
Lipidomics for the Prediction of Progressive Liver Disease in Patients with Alcohol Use Disorder

 , , and
Abstract
:1. Introduction
2. Results
2.1. Patient Cohort
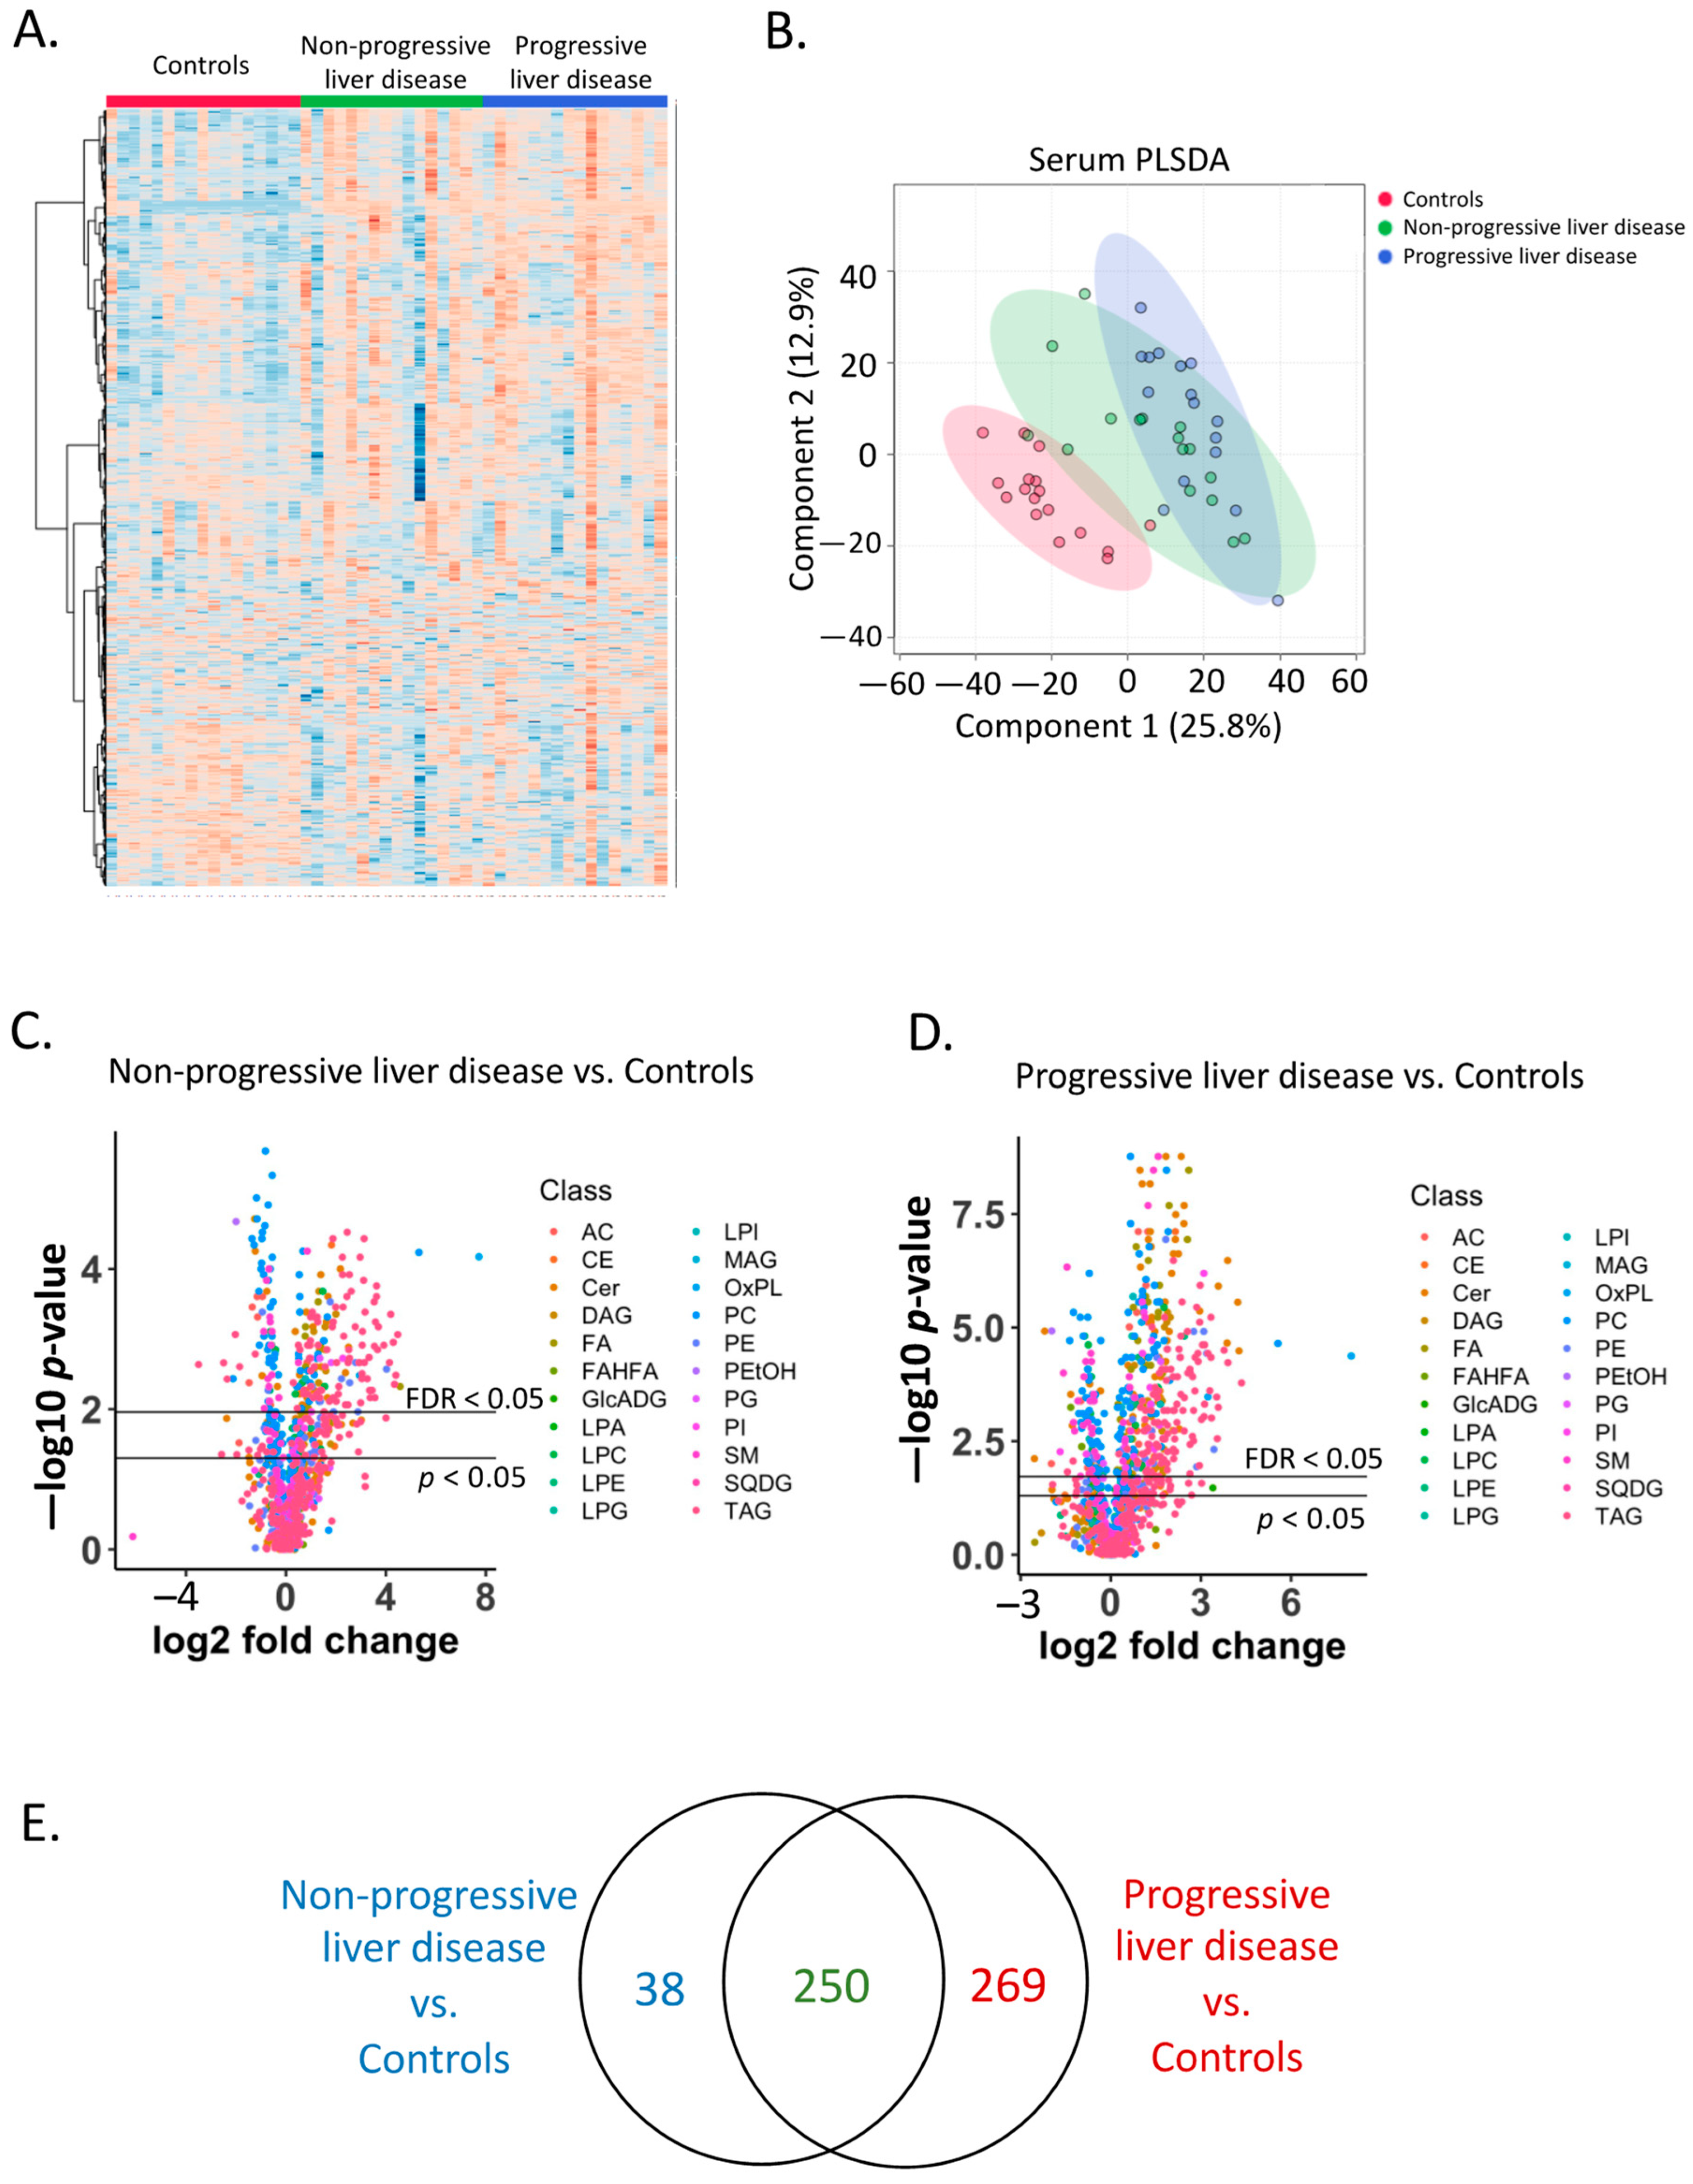
2.2. Serum Lipidome
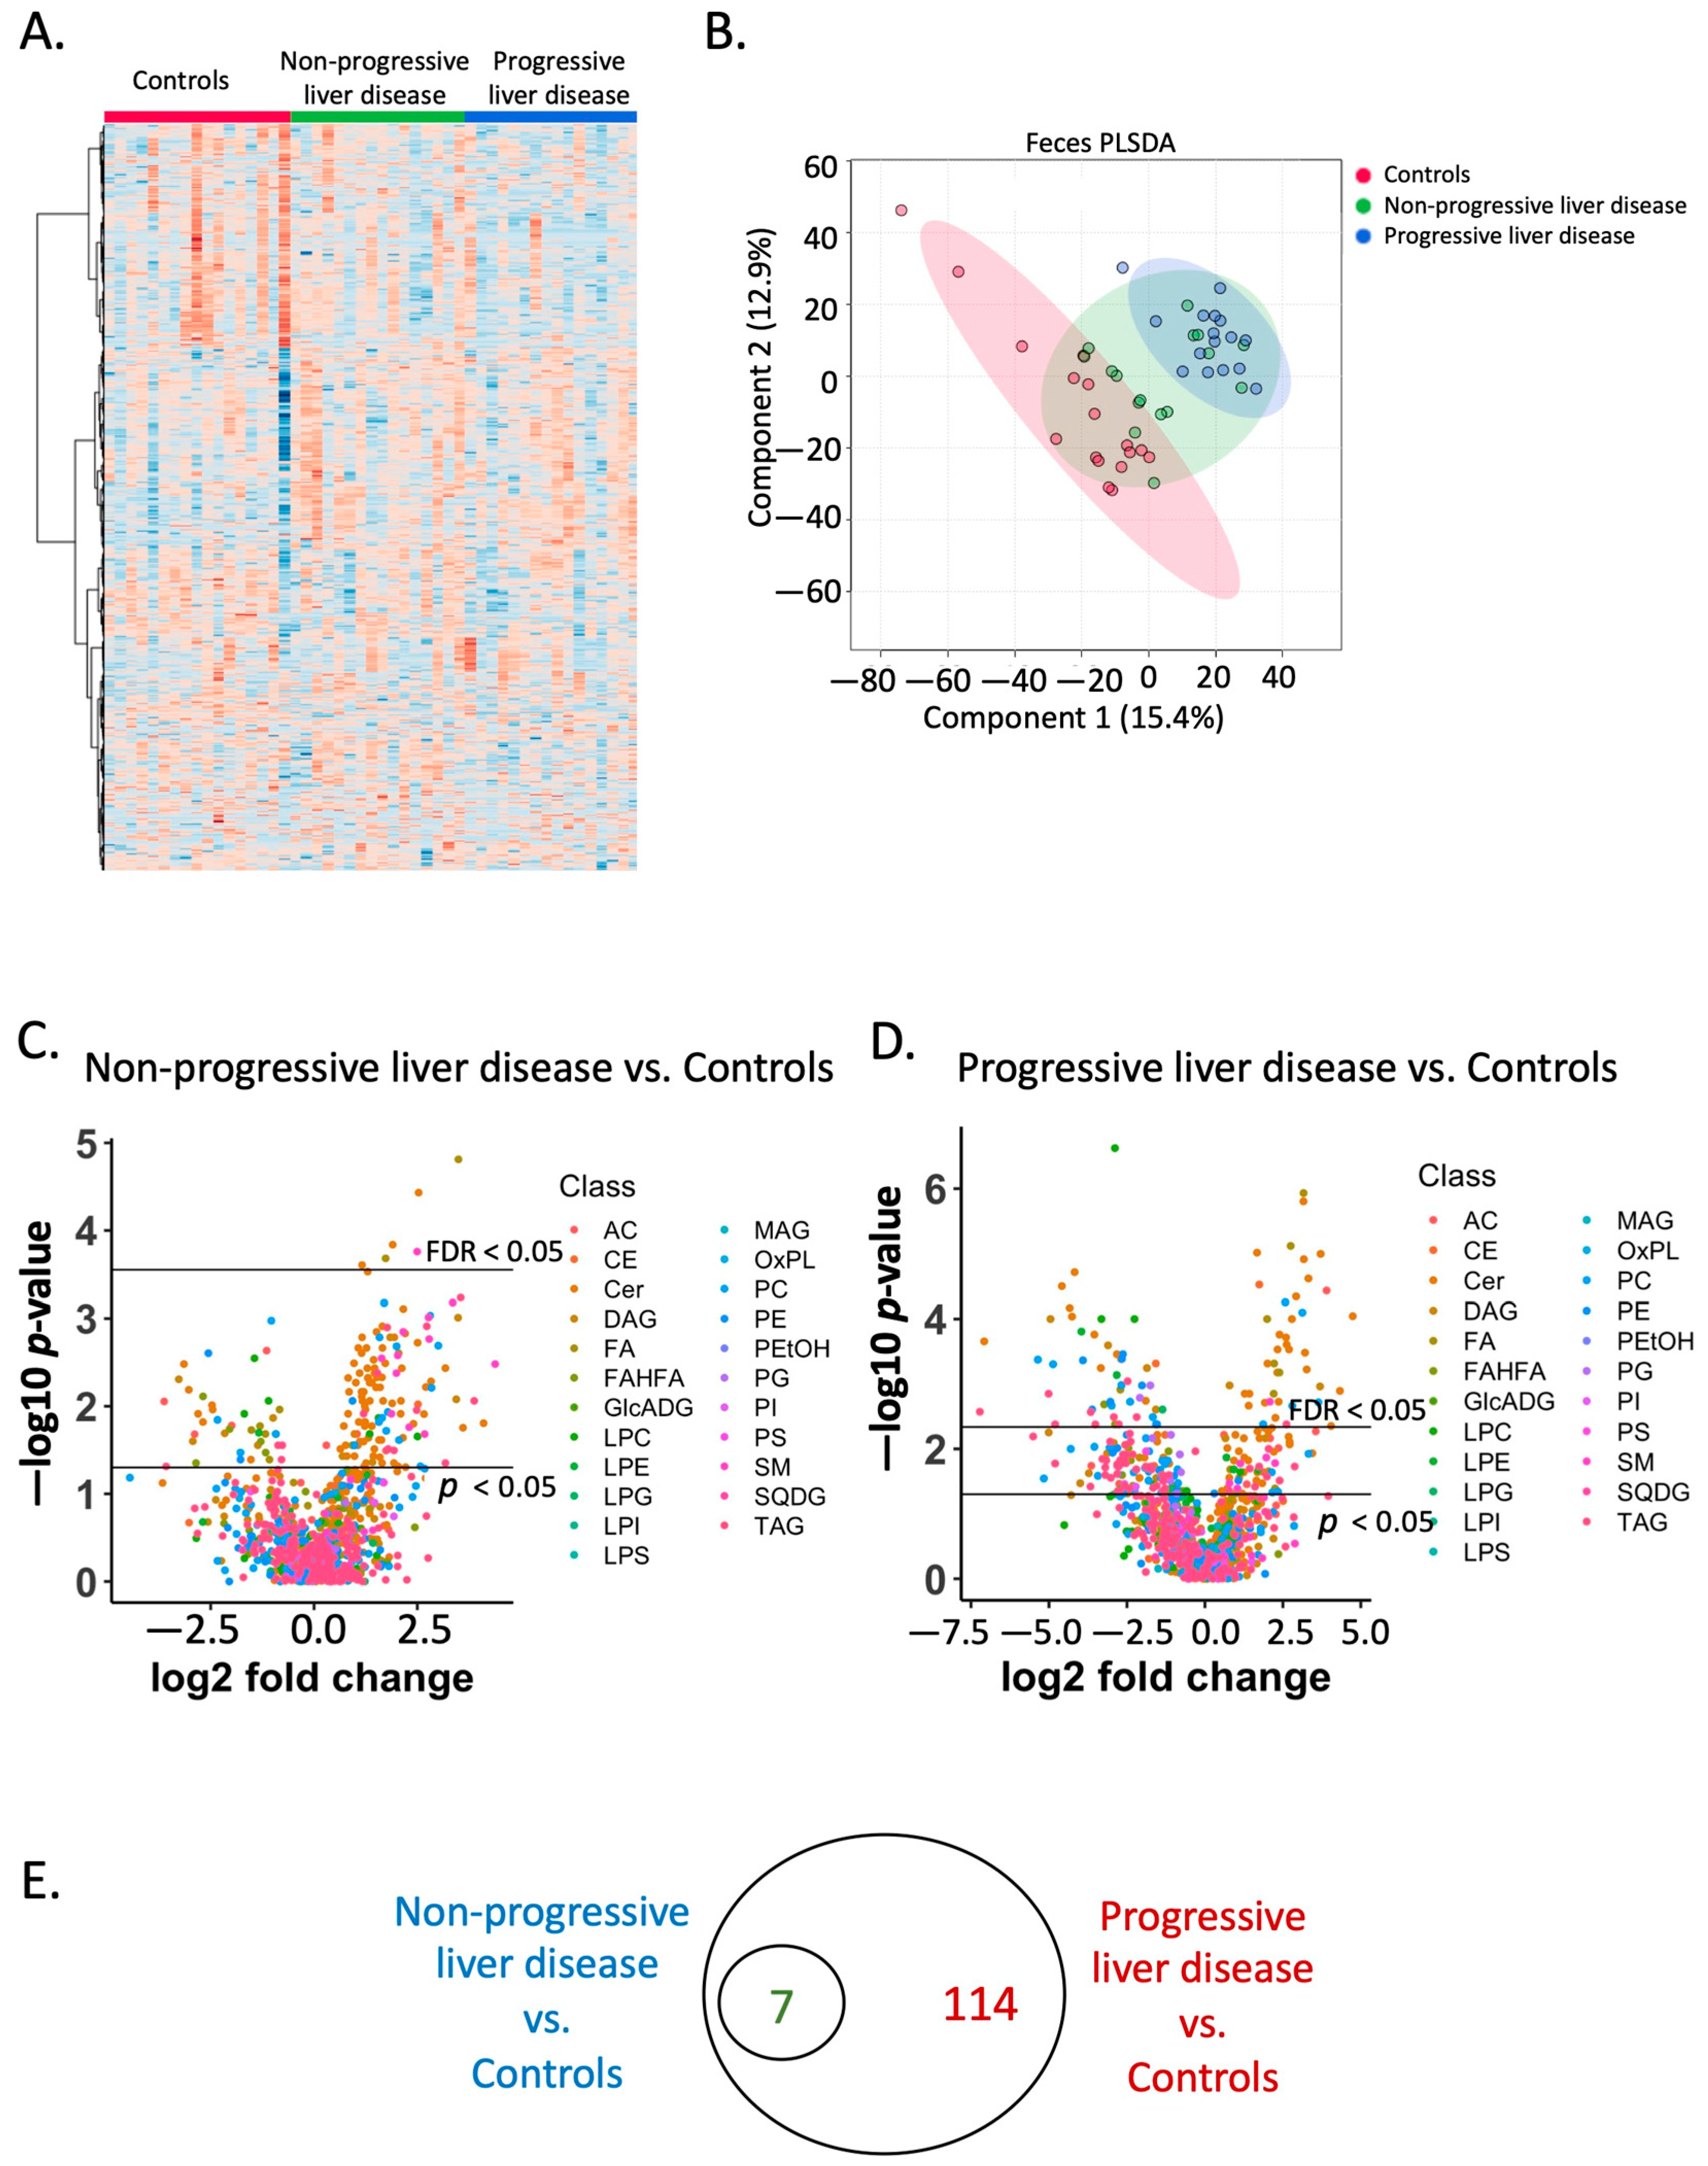
2.3. Fecal Lipidome
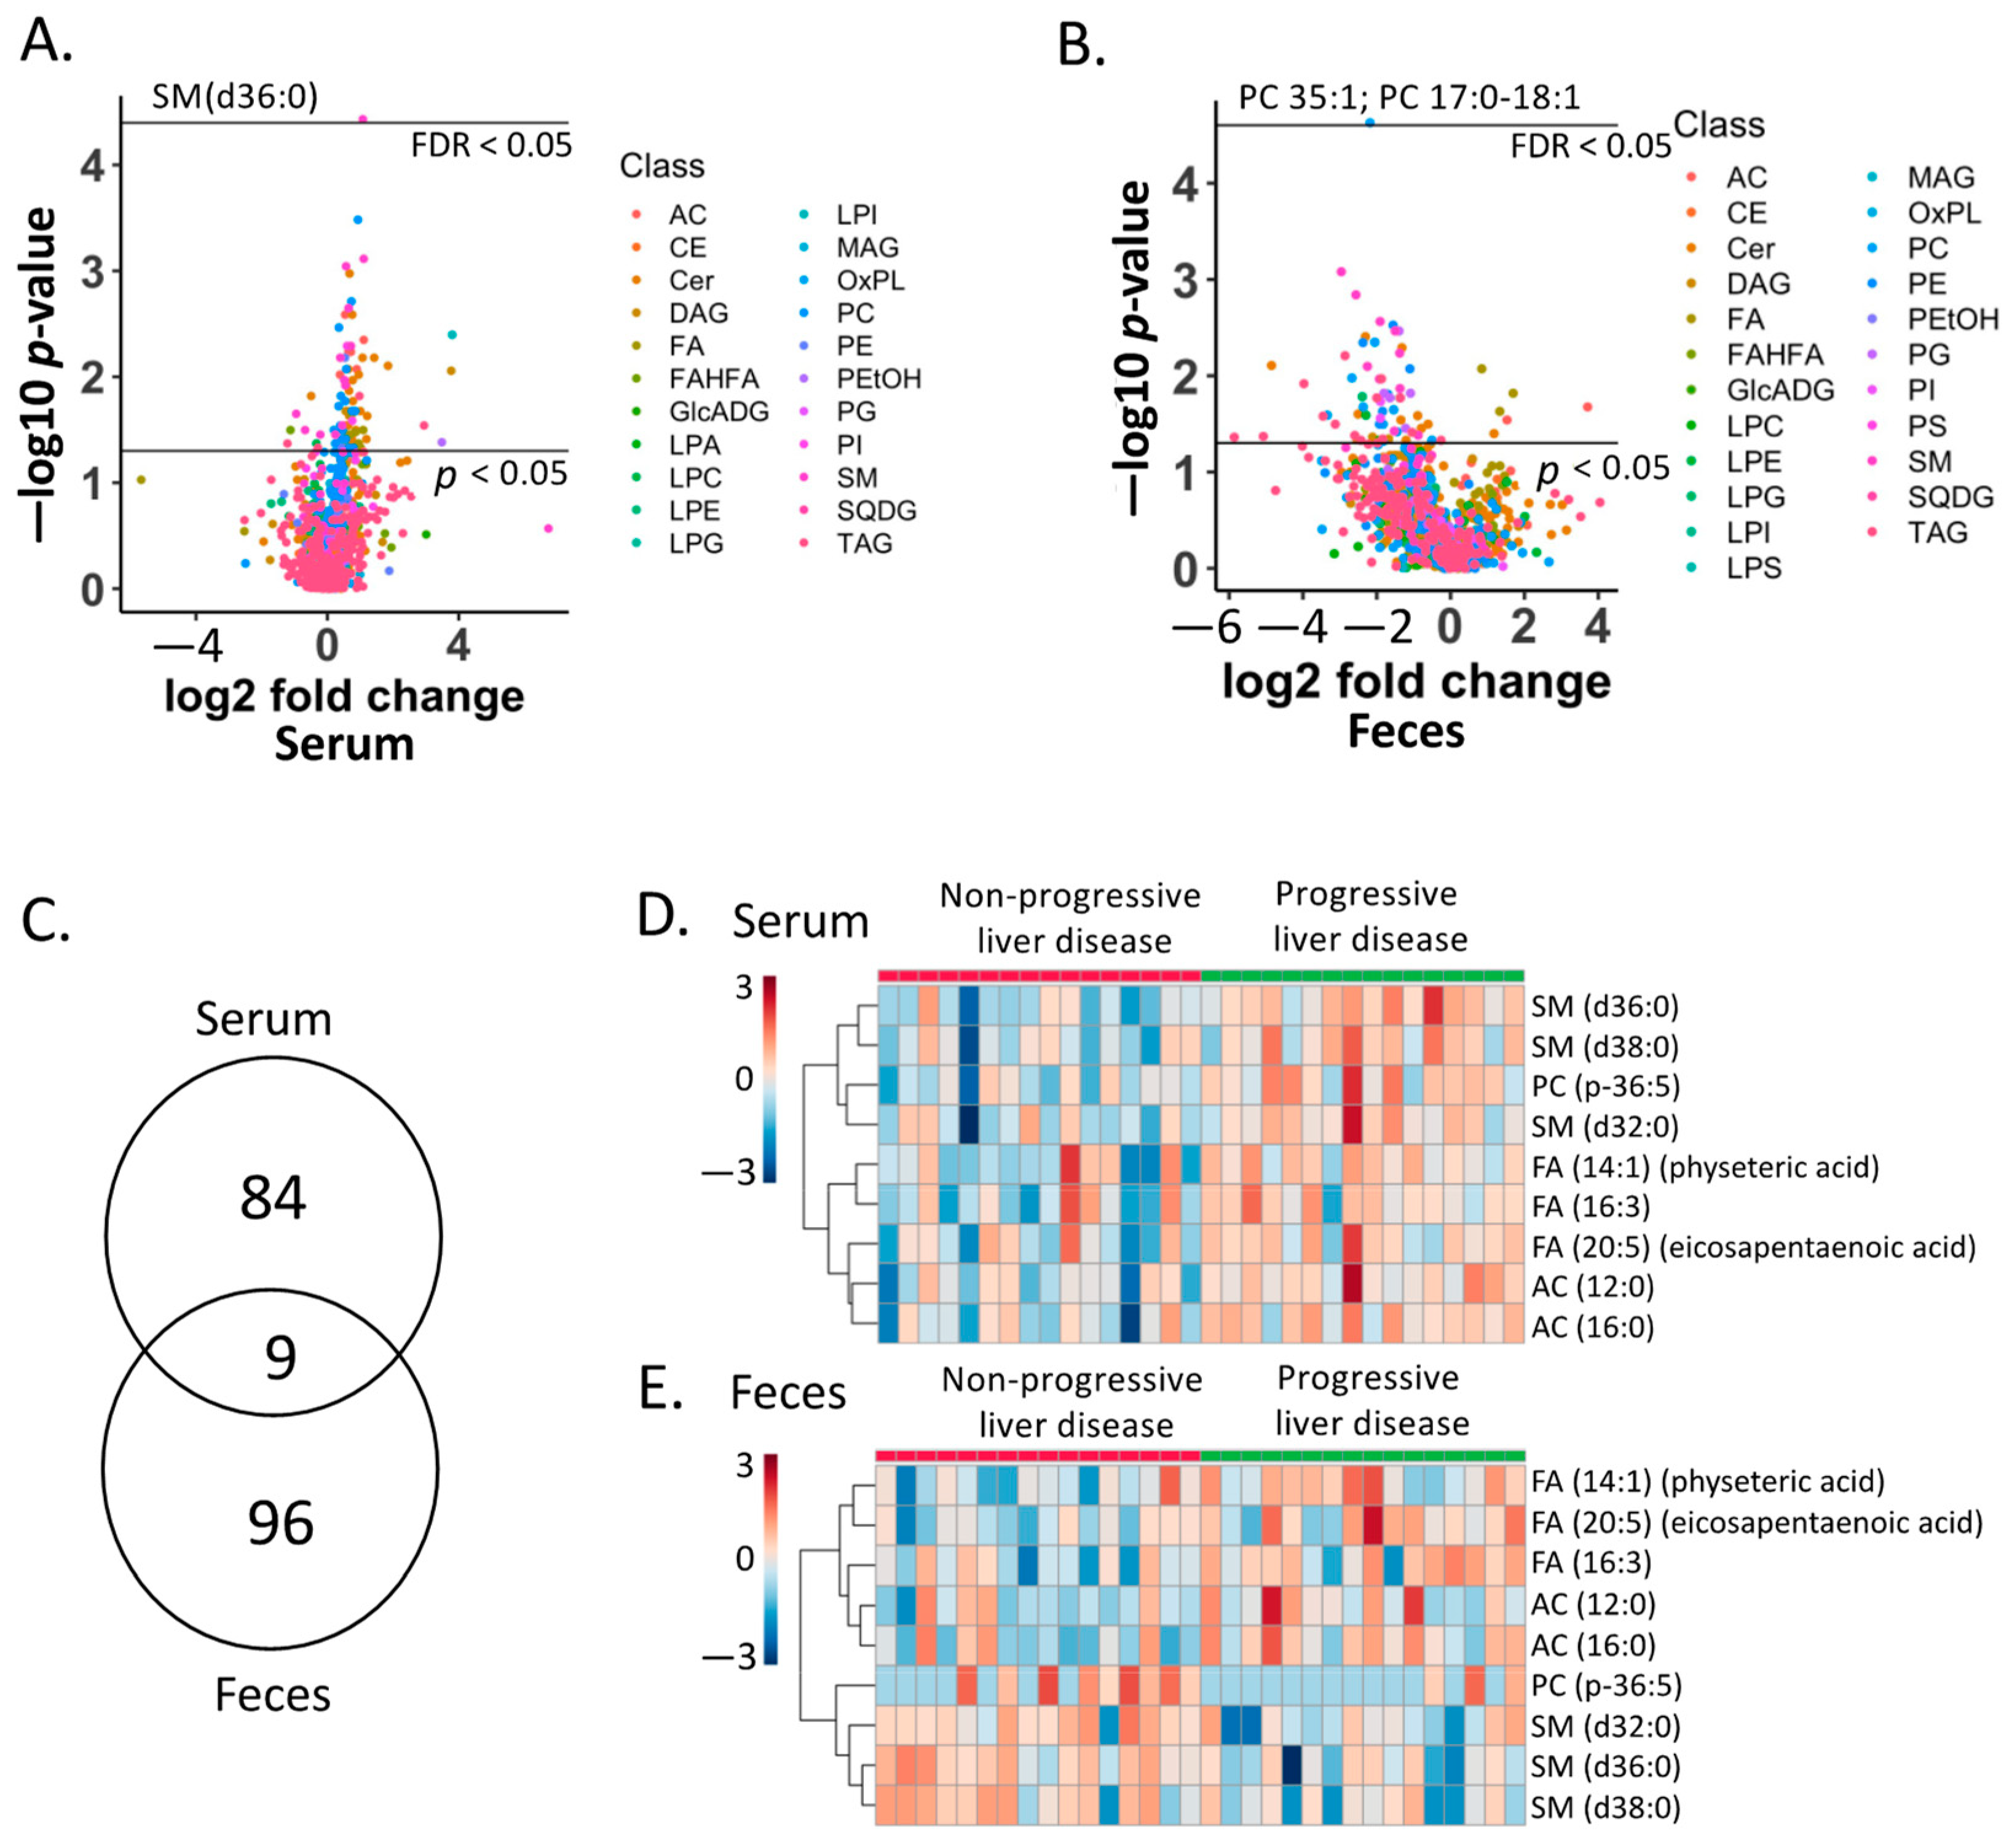
2.4. Lipid Biomarkers for Progressive Liver Disease
2.5. Association of Lipid Biomarkers with Clinical Parameters
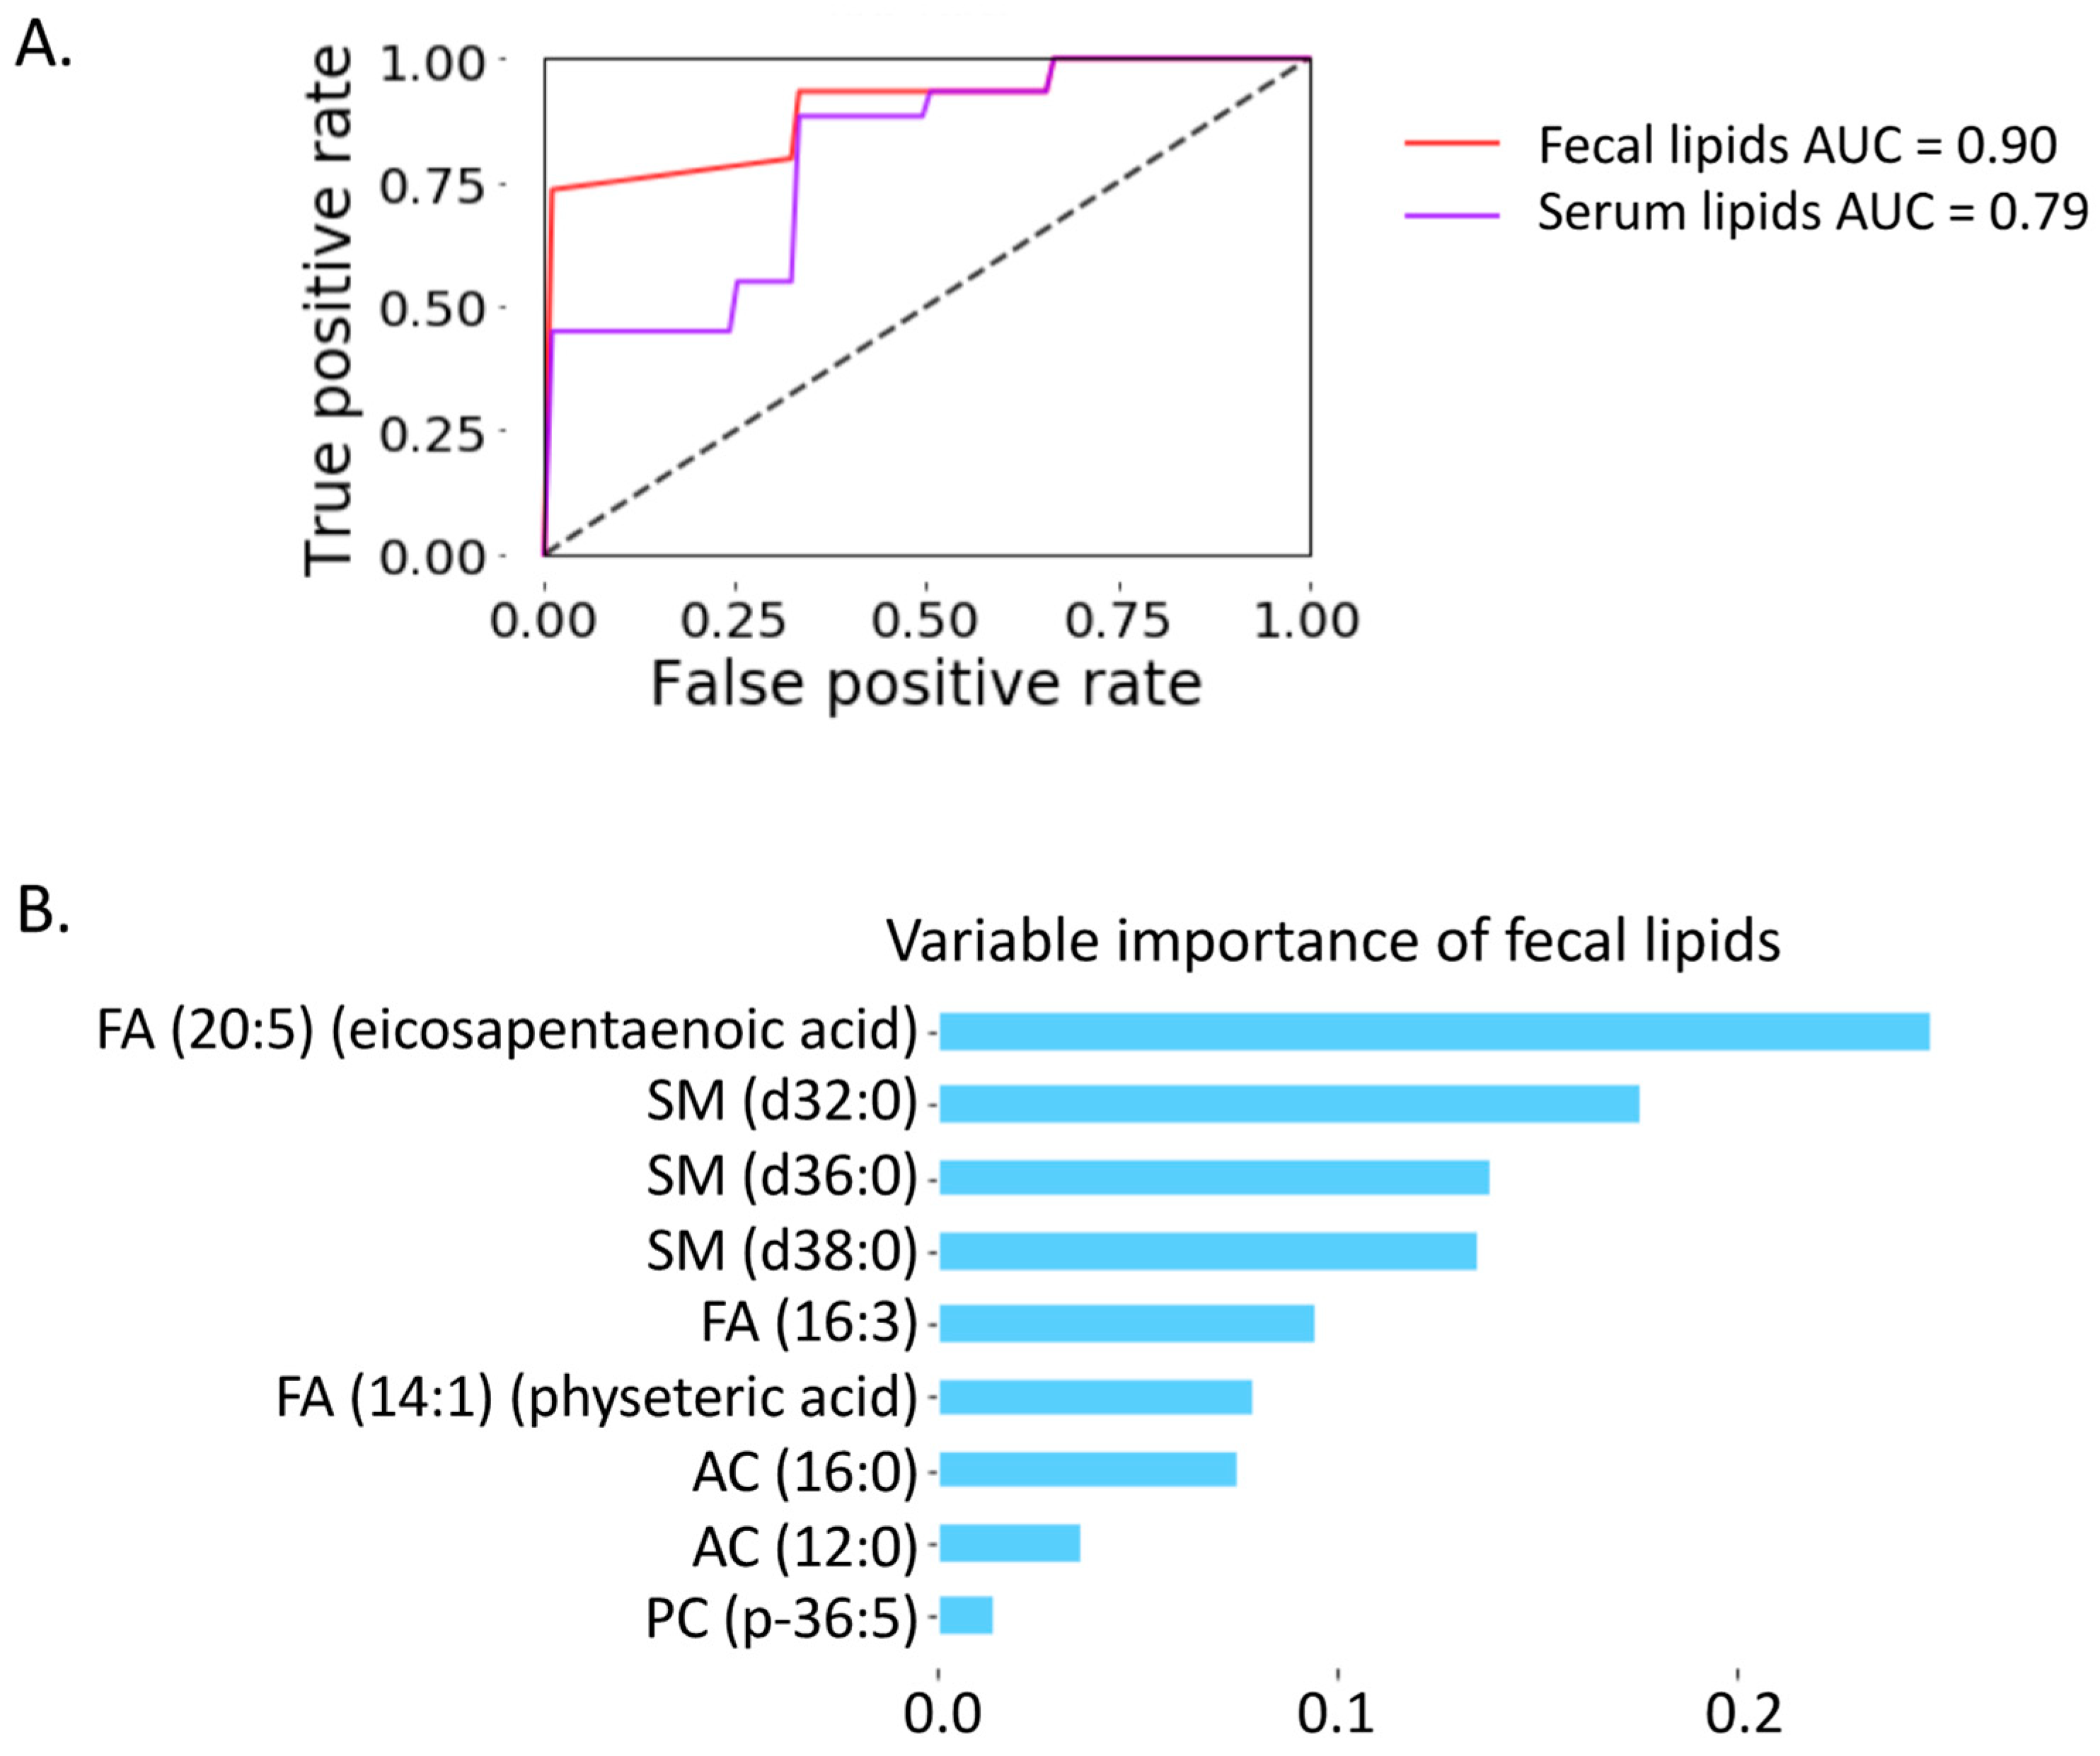
2.6. Prediction of Progressive Liver Disease
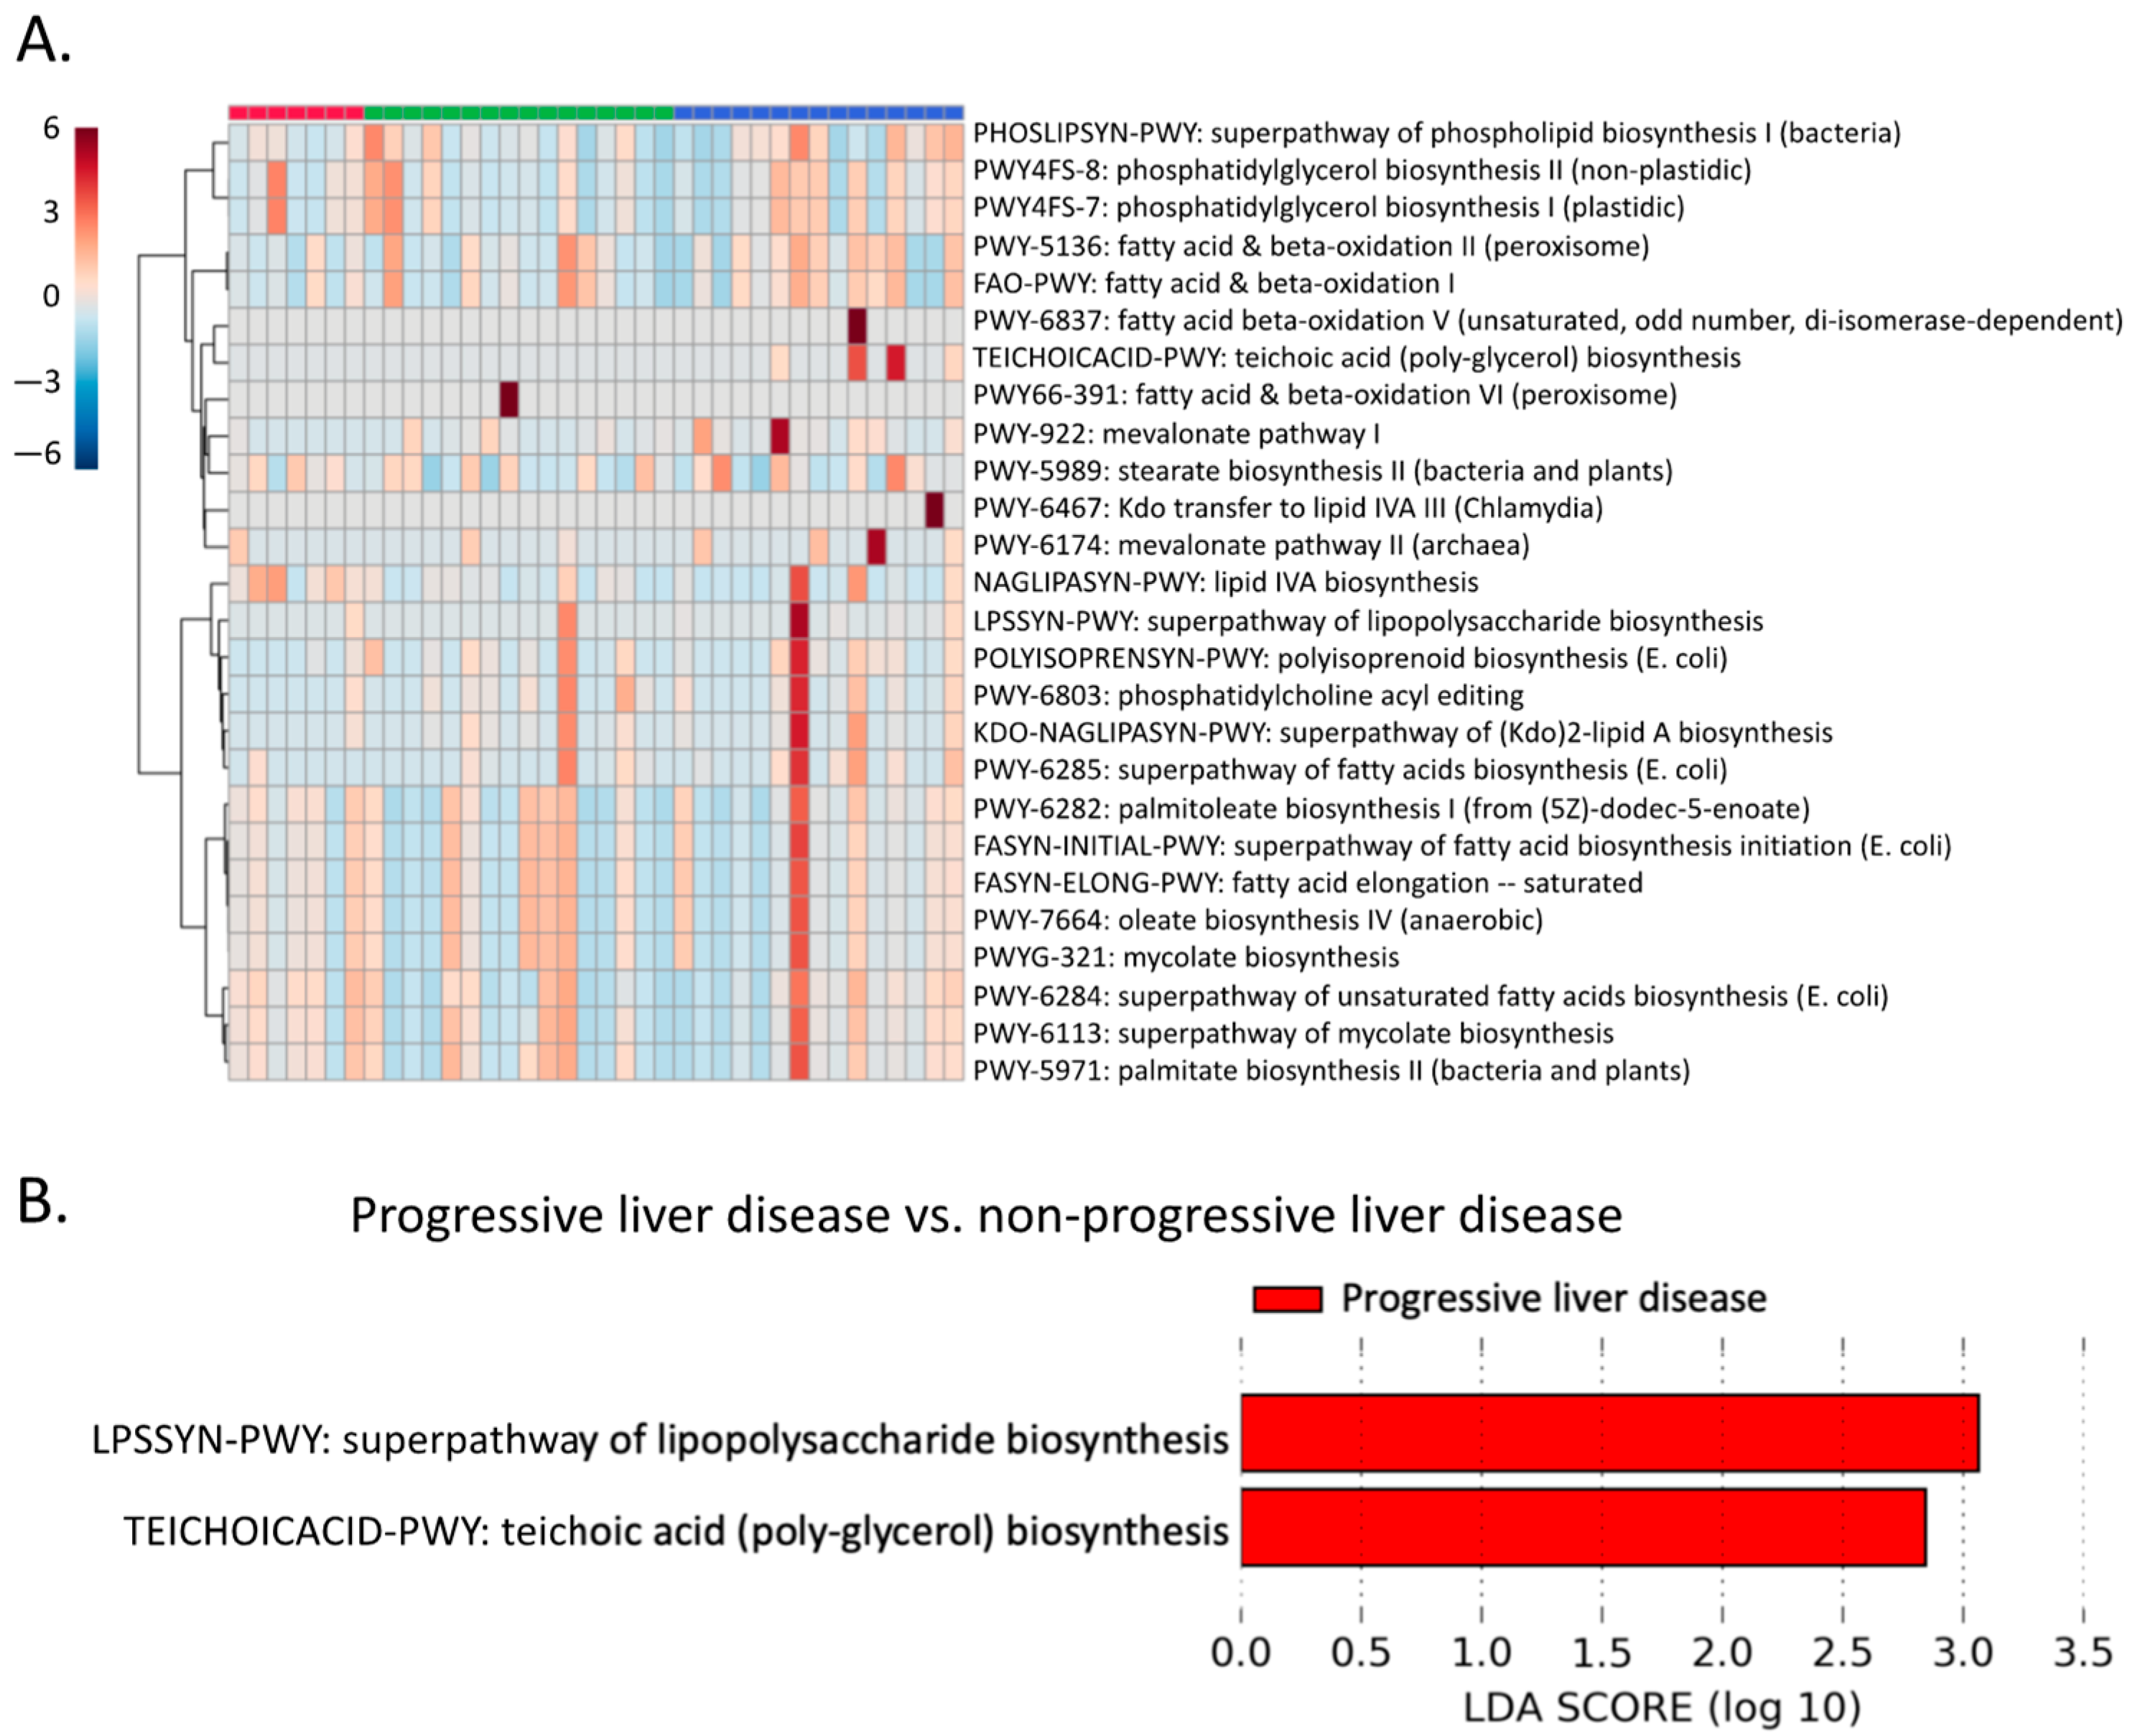
2.7. Microbial Lipid Pathways
3. Discussion
4. Materials and Methods
4.1. Patients
4.2. Lipidomics Analysis
4.3. Shotgun Metagenomics Analysis
4.4. Statistical Analysis
Supplementary Materials
Author Contributions
Funding
Institutional Review Board Statement
Informed Consent Statement
Data Availability Statement
Acknowledgments
Conflicts of Interest
References
- Osna, N.A.; Donohue, T.M.; Kharbanda, K.K. Alcoholic Liver Disease: Pathogenesis and Current Management. Alcohol Res. 2017, 38, 147–161. [Google Scholar] [PubMed]
- You, M.; Arteel, G.E. Effect of Ethanol on Lipid Metabolism. J. Hepatol. 2019, 70, 237–248. [Google Scholar] [CrossRef] [PubMed] [Green Version]
- Ontko, J.A. Effects of Ethanol on the Metabolism of Free Fatty Acids in Isolated Liver Cells. J. Lipid Res. 1973, 14, 78–86. [Google Scholar] [CrossRef]
- Siler, S.Q.; Neese, R.A.; Hellerstein, M.K. De Novo Lipogenesis, Lipid Kinetics, and Whole-Body Lipid Balances in Humans after Acute Alcohol Consumption. Am. J. Clin. Nutr. 1999, 70, 928–936. [Google Scholar] [CrossRef] [PubMed]
- Boros, L.G.; Deng, Q.; Pandol, S.J.; Tsukamoto, H.; Go, V.L.W.; Lee, W.-N.P. Ethanol Diversely Alters Palmitate, Stearate, and Oleate Metabolism in the Liver and Pancreas of Rats Using the Deuterium Oxide Single Tracer. Pancreas 2009, 38, e47–e52. [Google Scholar] [CrossRef] [PubMed] [Green Version]
- Clugston, R.D.; Jiang, H.; Lee, M.X.; Piantedosi, R.; Yuen, J.J.; Ramakrishnan, R.; Lewis, M.J.; Gottesman, M.E.; Huang, L.-S.; Goldberg, I.J.; et al. Altered Hepatic Lipid Metabolism in C57BL/6 Mice Fed Alcohol: A Targeted Lipidomic and Gene Expression Study. J. Lipid Res. 2011, 52, 2021–2031. [Google Scholar] [CrossRef] [PubMed] [Green Version]
- Zhao, Z.; Yu, M.; Crabb, D.; Xu, Y.; Liangpunsakul, S. Ethanol-Induced Alterations in Fatty Acid-Related Lipids in Serum and Tissues in Mice. Alcohol Clin. Exp. Res. 2011, 35, 229–234. [Google Scholar] [CrossRef] [Green Version]
- Meikle, P.J.; Mundra, P.A.; Wong, G.; Rahman, K.; Huynh, K.; Barlow, C.K.; Duly, A.M.P.; Haber, P.S.; Whitfield, J.B.; Seth, D. Circulating Lipids Are Associated with Alcoholic Liver Cirrhosis and Represent Potential Biomarkers for Risk Assessment. PLoS ONE 2015, 10, e0130346. [Google Scholar] [CrossRef] [Green Version]
- Sanyal, A.J.; Abdelmalek, M.F.; Suzuki, A.; Cummings, O.W.; Chojkier, M. EPE-A Study Group No Significant Effects of Ethyl-Eicosapentanoic Acid on Histologic Features of Nonalcoholic Steatohepatitis in a Phase 2 Trial. Gastroenterology 2014, 147, 377–384.e1. [Google Scholar] [CrossRef]
- Novgorodov, S.A.; Gudz, T.I. Ceramide and Mitochondria in Ischemia/Reperfusion. J. Cardiovasc. Pharmacol. 2009, 53, 198–208. [Google Scholar] [CrossRef] [Green Version]
- Yang, L.; Jin, G.-H.; Zhou, J.-Y. The Role of Ceramide in the Pathogenesis of Alcoholic Liver Disease. Alcohol Alcohol. 2016, 51, 251–257. [Google Scholar] [CrossRef] [PubMed] [Green Version]
- Saika, A.; Nagatake, T.; Kunisawa, J. Host- and Microbe-Dependent Dietary Lipid Metabolism in the Control of Allergy, Inflammation, and Immunity. Front. Nutr. 2019, 6, 36. [Google Scholar] [CrossRef] [PubMed]
- Kishino, S.; Takeuchi, M.; Park, S.-B.; Hirata, A.; Kitamura, N.; Kunisawa, J.; Kiyono, H.; Iwamoto, R.; Isobe, Y.; Arita, M.; et al. Polyunsaturated Fatty Acid Saturation by Gut Lactic Acid Bacteria Affecting Host Lipid Composition. Proc. Natl. Acad. Sci. USA 2013, 110, 17808–17813. [Google Scholar] [CrossRef] [PubMed] [Green Version]
- Druart, C.; Bindels, L.B.; Schmaltz, R.; Neyrinck, A.M.; Cani, P.D.; Walter, J.; Ramer-Tait, A.E.; Delzenne, N.M. Ability of the Gut Microbiota to Produce PUFA-Derived Bacterial Metabolites: Proof of Concept in Germ-Free versus Conventionalized Mice. Mol. Nutr. Food Res. 2015, 59, 1603–1613. [Google Scholar] [CrossRef]
- Johnson, E.L.; Heaver, S.L.; Waters, J.L.; Kim, B.I.; Bretin, A.; Goodman, A.L.; Gewirtz, A.T.; Worgall, T.S.; Ley, R.E. Sphingolipids Produced by Gut Bacteria Enter Host Metabolic Pathways Impacting Ceramide Levels. Nat. Commun. 2020, 11, 2471. [Google Scholar] [CrossRef]
- Chen, P.; Torralba, M.; Tan, J.; Embree, M.; Zengler, K.; Stärkel, P.; van Pijkeren, J.-P.; DePew, J.; Loomba, R.; Ho, S.B.; et al. Supplementation of Saturated Long-Chain Fatty Acids Maintains Intestinal Eubiosis and Reduces Ethanol-Induced Liver Injury in Mice. Gastroenterology 2015, 148, 203–214.e16. [Google Scholar] [CrossRef] [Green Version]
- Viktorov, A.V.; Yurkiv, V.A. Effects of Ethanol and Lipopolysaccharide on the Sphingomyelin Cycle in Rat Hepatocytes. Bull. Exp. Biol. Med. 2008, 146, 753–755. [Google Scholar] [CrossRef]
- Lang, S.; Schnabl, B. Microbiota and Fatty Liver Disease-the Known, the Unknown, and the Future. Cell Host Microbe 2020, 28, 233–244. [Google Scholar] [CrossRef]
- Long, E.M.; Millen, B.; Kubes, P.; Robbins, S.M. Lipoteichoic Acid Induces Unique Inflammatory Responses When Compared to Other Toll-Like Receptor 2 Ligands. PLoS ONE 2009, 4, e5601. [Google Scholar] [CrossRef] [Green Version]
- Roh, Y.-S.; Seki, E. Toll-Like Receptors in Alcoholic Liver Disease, Non-Alcoholic Steatohepatitis and Carcinogenesis. J. Gastroenterol. Hepatol. 2013, 28, 38–42. [Google Scholar] [CrossRef] [Green Version]
- Maccioni, L.; Gao, B.; Leclercq, S.; Pirlot, B.; Horsmans, Y.; Timary, P.D.; Leclercq, I.; Fouts, D.; Schnabl, B.; Stärkel, P. Intestinal Permeability, Microbial Translocation, Changes in Duodenal and Fecal Microbiota, and Their Associations with Alcoholic Liver Disease Progression in Humans. Gut Microbes 2020, 12, 1782157. [Google Scholar] [CrossRef] [PubMed]
- Gao, B.; Lue, H.-W.; Podolak, J.; Fan, S.; Zhang, Y.; Serawat, A.; Alumkal, J.J.; Fiehn, O.; Thomas, G.V. Multi-Omics Analyses Detail Metabolic Reprogramming in Lipids, Carnitines, and Use of Glycolytic Intermediates between Prostate Small Cell Neuroendocrine Carcinoma and Prostate Adenocarcinoma. Metabolites 2019, 9, 82. [Google Scholar] [CrossRef] [PubMed] [Green Version]
- Tsugawa, H.; Cajka, T.; Kind, T.; Ma, Y.; Higgins, B.; Ikeda, K.; Kanazawa, M.; VanderGheynst, J.; Fiehn, O.; Arita, M. MS-DIAL: Data-Independent MS/MS Deconvolution for Comprehensive Metabolome Analysis. Nat. Methods 2015, 12, 523–526. [Google Scholar] [CrossRef] [PubMed]
- DeFelice, B.C.; Mehta, S.S.; Samra, S.; Čajka, T.; Wancewicz, B.; Fahrmann, J.F.; Fiehn, O. Mass Spectral Feature List Optimizer (MS-FLO): A Tool To Minimize False Positive Peak Reports in Untargeted Liquid Chromatography-Mass Spectroscopy (LC-MS) Data Processing. Anal. Chem. 2017, 89, 3250–3255. [Google Scholar] [CrossRef]
- Duan, Y.; Llorente, C.; Lang, S.; Brandl, K.; Chu, H.; Jiang, L.; White, R.C.; Clarke, T.H.; Nguyen, K.; Torralba, M.; et al. Bacteriophage Targeting of Gut Bacterium Attenuates Alcoholic Liver Disease. Nature 2019, 575, 505–511. [Google Scholar] [CrossRef]
- Franzosa, E.A.; McIver, L.J.; Rahnavard, G.; Thompson, L.R.; Schirmer, M.; Weingart, G.; Lipson, K.S.; Knight, R.; Caporaso, J.G.; Segata, N.; et al. Species-Level Functional Profiling of Metagenomes and Metatranscriptomes. Nat. Methods 2018, 15, 962–968. [Google Scholar] [CrossRef]
- Caspi, R.; Billington, R.; Keseler, I.M.; Kothari, A.; Krummenacker, M.; Midford, P.E.; Ong, W.K.; Paley, S.; Subhraveti, P.; Karp, P.D. The MetaCyc Database of Metabolic Pathways and Enzymes—A 2019 Update. Nucleic Acids Res. 2020, 48, D445–D453. [Google Scholar] [CrossRef] [Green Version]
- Segata, N.; Izard, J.; Waldron, L.; Gevers, D.; Miropolsky, L.; Garrett, W.S.; Huttenhower, C. Metagenomic Biomarker Discovery and Explanation. Genome Biol. 2011, 12, R60. [Google Scholar] [CrossRef] [Green Version]
- Chong, J.; Soufan, O.; Li, C.; Caraus, I.; Li, S.; Bourque, G.; Wishart, D.S.; Xia, J. MetaboAnalyst 4.0: Towards More Transparent and Integrative Metabolomics Analysis. Nucleic Acids Res. 2018, 46, W486–W494. [Google Scholar] [CrossRef] [Green Version]


| Non-Alcoholic Controls | Non-Progressive Liver Disease | Progressive Liver Disease | p-Value | |
|---|---|---|---|---|
| Clinical parameter | ||||
| Total n | 17 | 16 | 16 | |
| Age, years, n = 48 | 38 (27–71) | 37 (27–58) | 41 (28–59) | 0.470 |
| Body Mass Index (BMI), kg/m², n = 48 | 22 (19–29) | 22 (19-31) | 24 (18–31) | 0.381 |
| Gender (male), n (%), n = 48 | 14 (88) | 11 (69) | 14 (88) | 0.292 |
| Laboratory parameter | ||||
| Albumin (g/dL), n = 27 | 4.7 (4.2–5.2) | 4.7 (3.9–5.2) | 0.558 | |
| Alkaline phosphatase (U/L), n = 28 | 65 (38–101) | 81 (47–113) | 0.072 | |
| ALT (U/L), n = 32 | 19 (11–37) | 78 (37–184) | <0.001 | |
| AST (U/L), n = 32 | 25 (15–36) | 81 (46–283) | <0.001 | |
| Total bilirubin (mg/dL), n = 29 | 0.3 (0.2–1.1) | 0.5 (0.3–0.9) | 0.031 | |
| GGT (U/L), n = 29 | 31 (4–213) | 139 (11–952) | 0.012 | |
| Platelet counts (×109/L), n = 28 | 268 (165–339) | 220 (21–434) | 0.270 | |
| Creatinine (mg/dL), n = 29 | 0.8 (0.5–1.0) | 0.8 (0.6–1.2) | 0.406 | |
| International normalized ratio, n = 29 | 1.0 (0.9–1.2) | 0.9 (0.8–1.0) | 0.115 | |
| Fibroscan (kpa), n = 32 | 4.8 (3.1–6.6) | 6.0 (3.2–7.0) | 0.122 | |
| CAP, (dB/m), n = 32 CAP > 250 dB/m, n (%) | 254 (148–325) 9 (56) | 314 (222–381) 15 (94) | <0.001 | |
| Fecal albumin (µg/L), n = 43 | 16.9 (4.7–66.6) | 56.8 (10.5–504.4) | 31.2 (2.2–98.1) | 0.002 |
| CK18-M65 (U/L), n = 38 | 166 (104–282) | 332 (158–616) | 592 (316–1576) | <0.001 |
| sCD14 (ng/mL), n = 38 | 1376 (1074–1810) | 1710 (1046–2570) | 1745 (1191–2266) | 0.033 |
Publisher’s Note: MDPI stays neutral with regard to jurisdictional claims in published maps and institutional affiliations. |
© 2022 by the authors. Licensee MDPI, Basel, Switzerland. This article is an open access article distributed under the terms and conditions of the Creative Commons Attribution (CC BY) license (https://creativecommons.org/licenses/by/4.0/).
Share and Cite
Gao, B.; Zeng, S.; Maccioni, L.; Shi, X.; Armando, A.; Quehenberger, O.; Zhang, X.; Stärkel, P.; Schnabl, B. Lipidomics for the Prediction of Progressive Liver Disease in Patients with Alcohol Use Disorder. Metabolites 2022, 12, 433. https://doi.org/10.3390/metabo12050433
Gao B, Zeng S, Maccioni L, Shi X, Armando A, Quehenberger O, Zhang X, Stärkel P, Schnabl B. Lipidomics for the Prediction of Progressive Liver Disease in Patients with Alcohol Use Disorder. Metabolites. 2022; 12(5):433. https://doi.org/10.3390/metabo12050433
Chicago/Turabian StyleGao, Bei, Suling Zeng, Luca Maccioni, Xiaochun Shi, Aaron Armando, Oswald Quehenberger, Xinlian Zhang, Peter Stärkel, and Bernd Schnabl. 2022. "Lipidomics for the Prediction of Progressive Liver Disease in Patients with Alcohol Use Disorder" Metabolites 12, no. 5: 433. https://doi.org/10.3390/metabo12050433