
Impact of Nitisinone on the Cerebrospinal Fluid Metabolome of a Murine Model of Alkaptonuria

 , and
, and
Abstract
:
1. Introduction
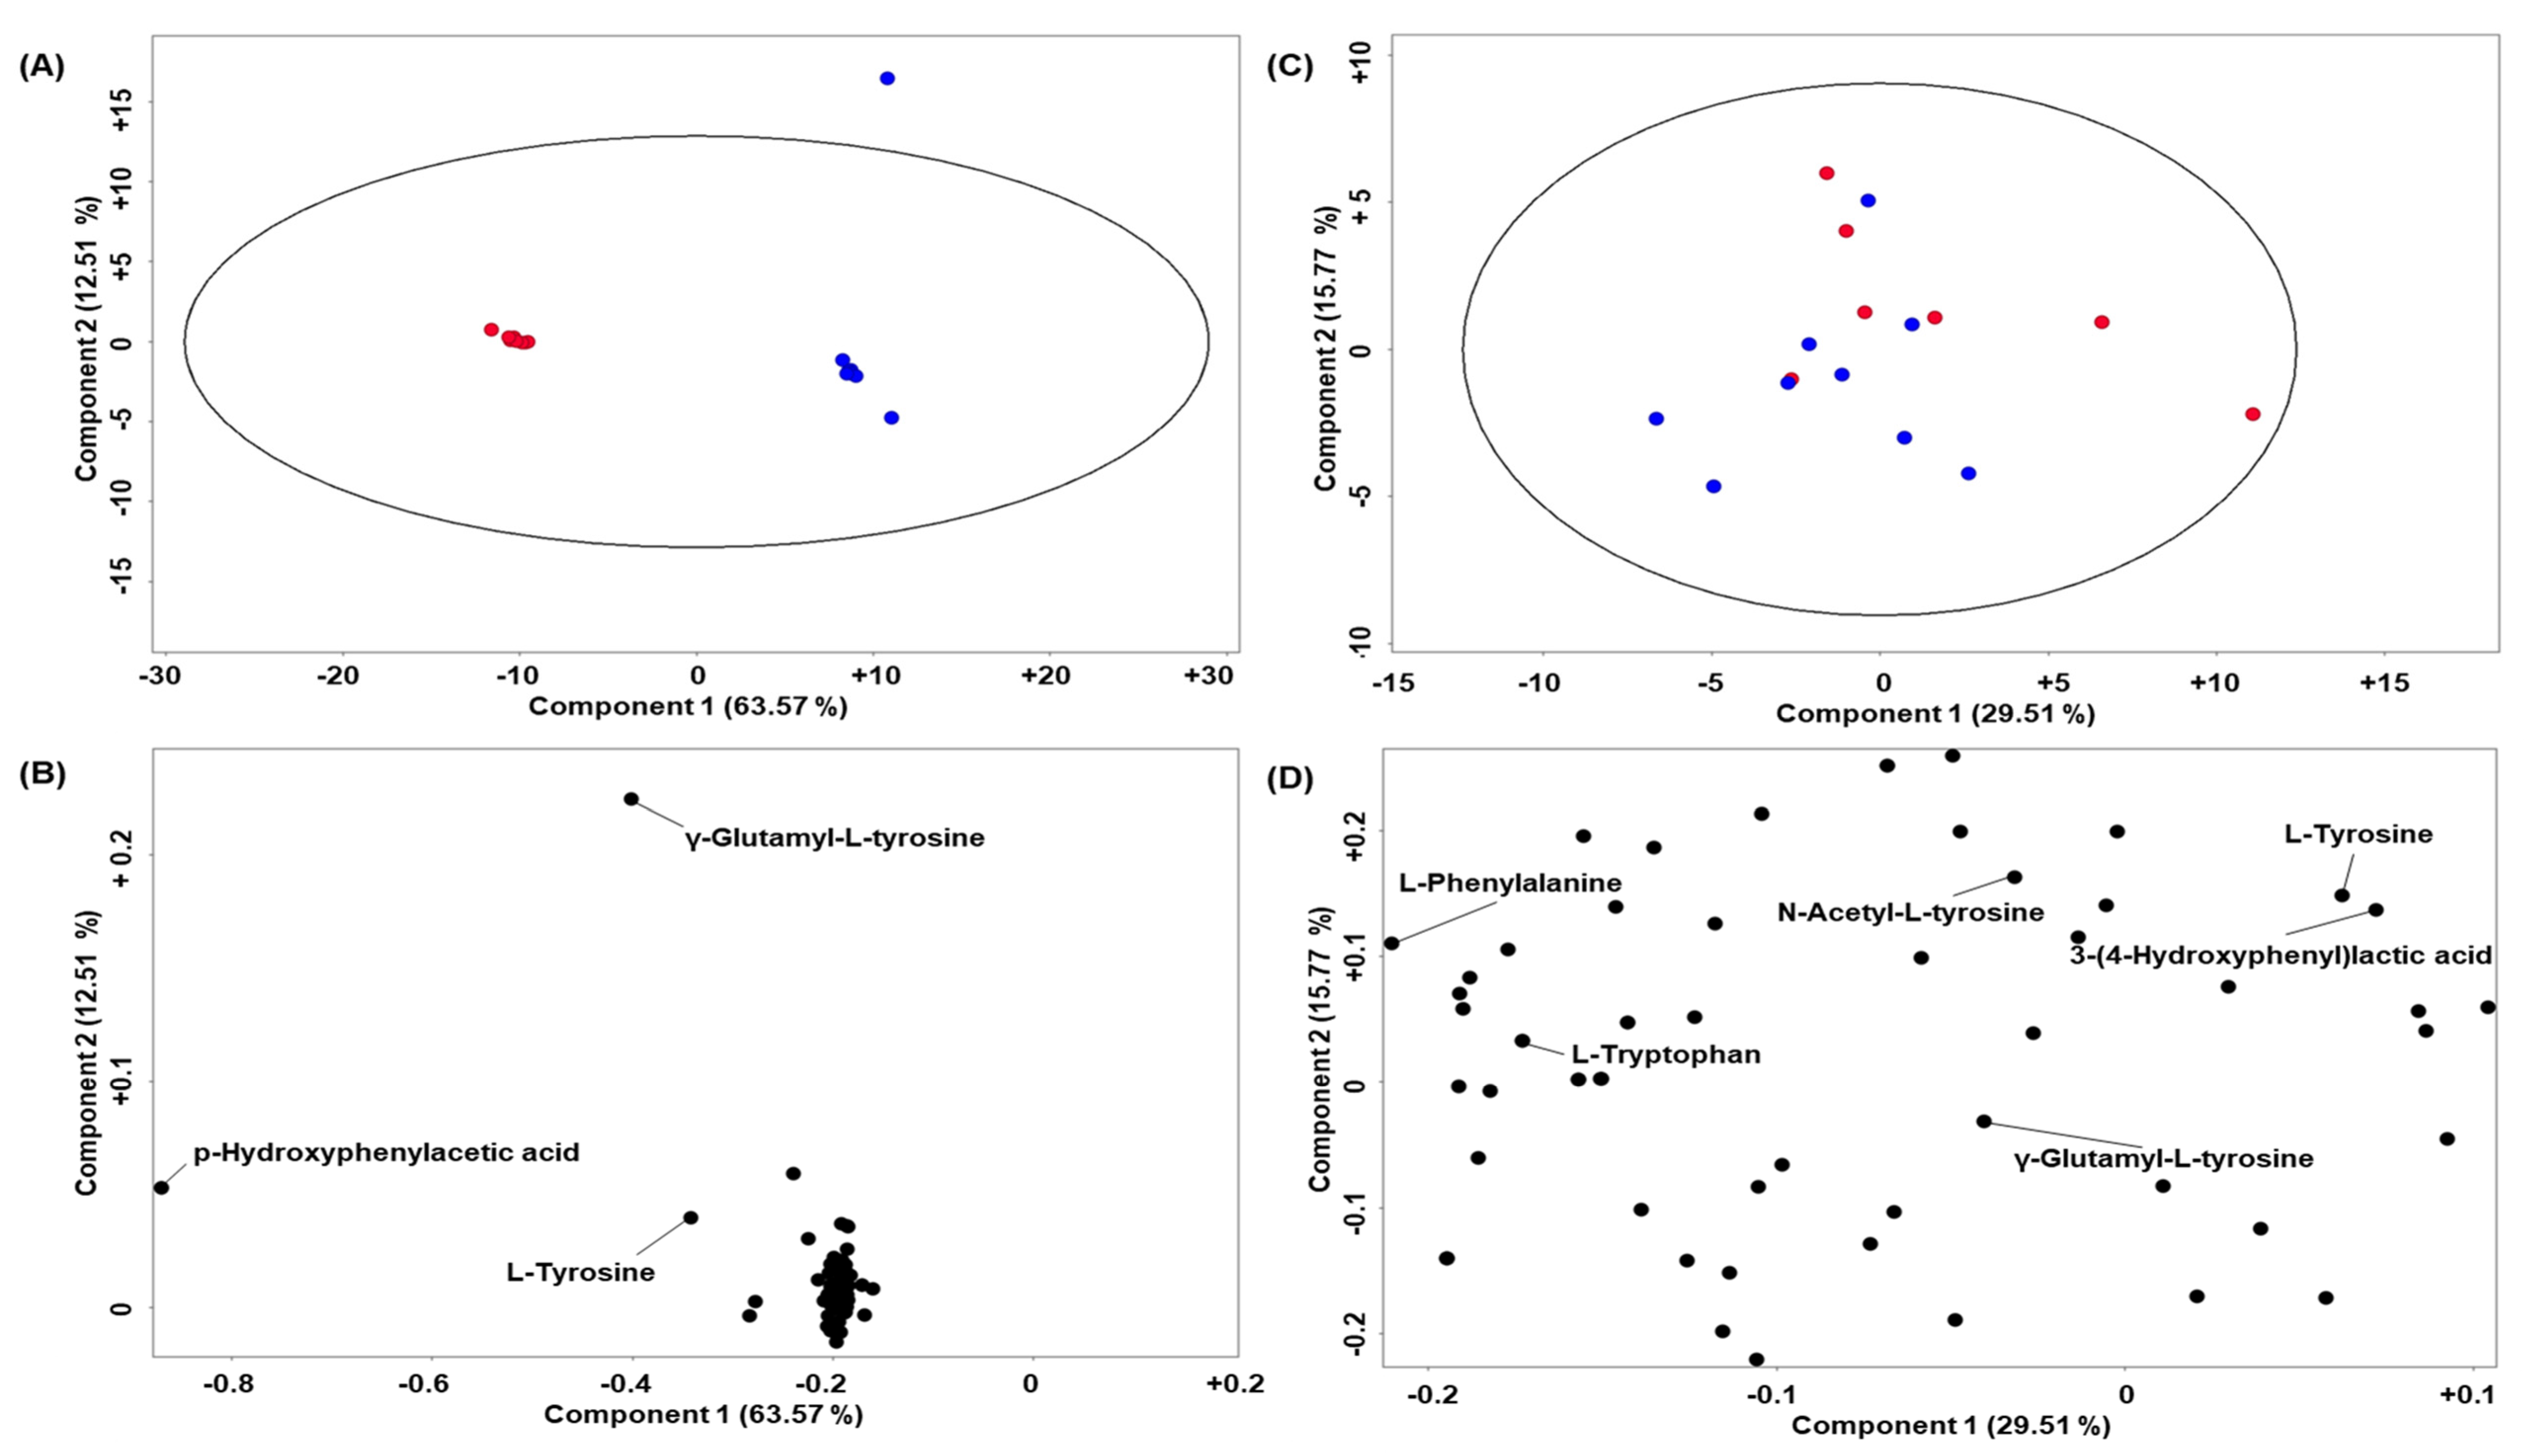
2. Results
Quality Control and Murine CSF Data
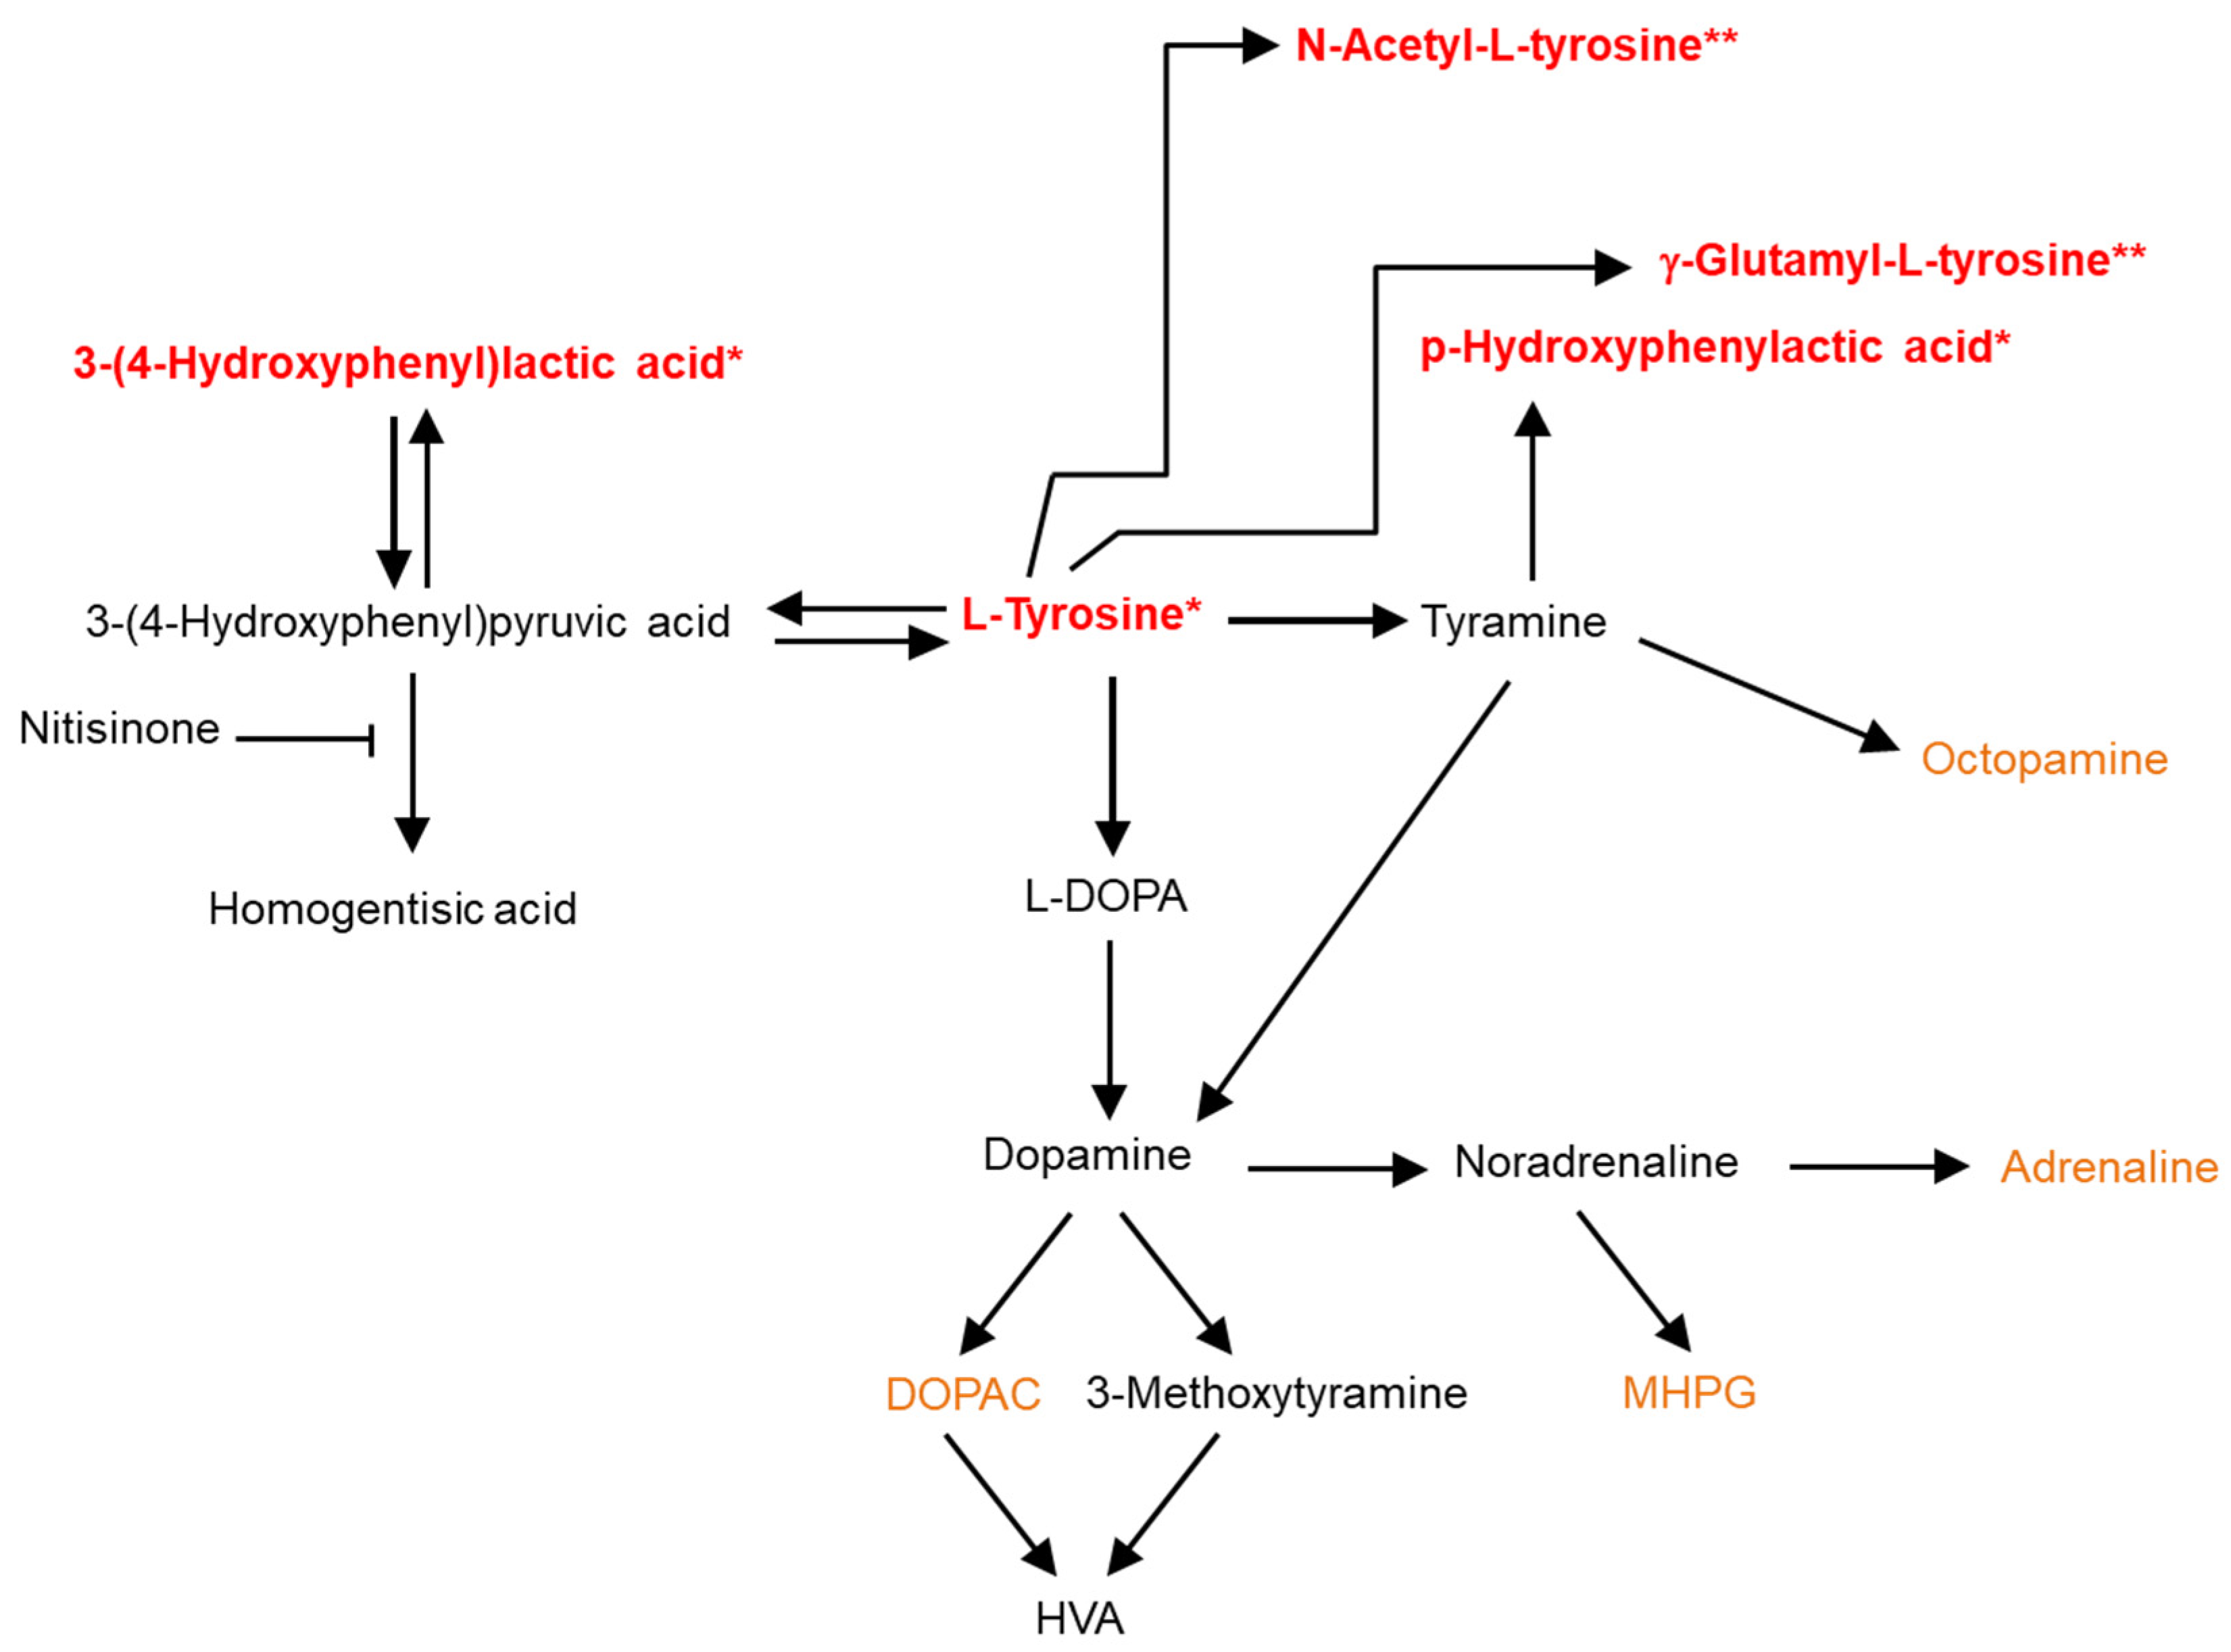
3. Discussion
4. Materials and Methods
4.1. Reagents
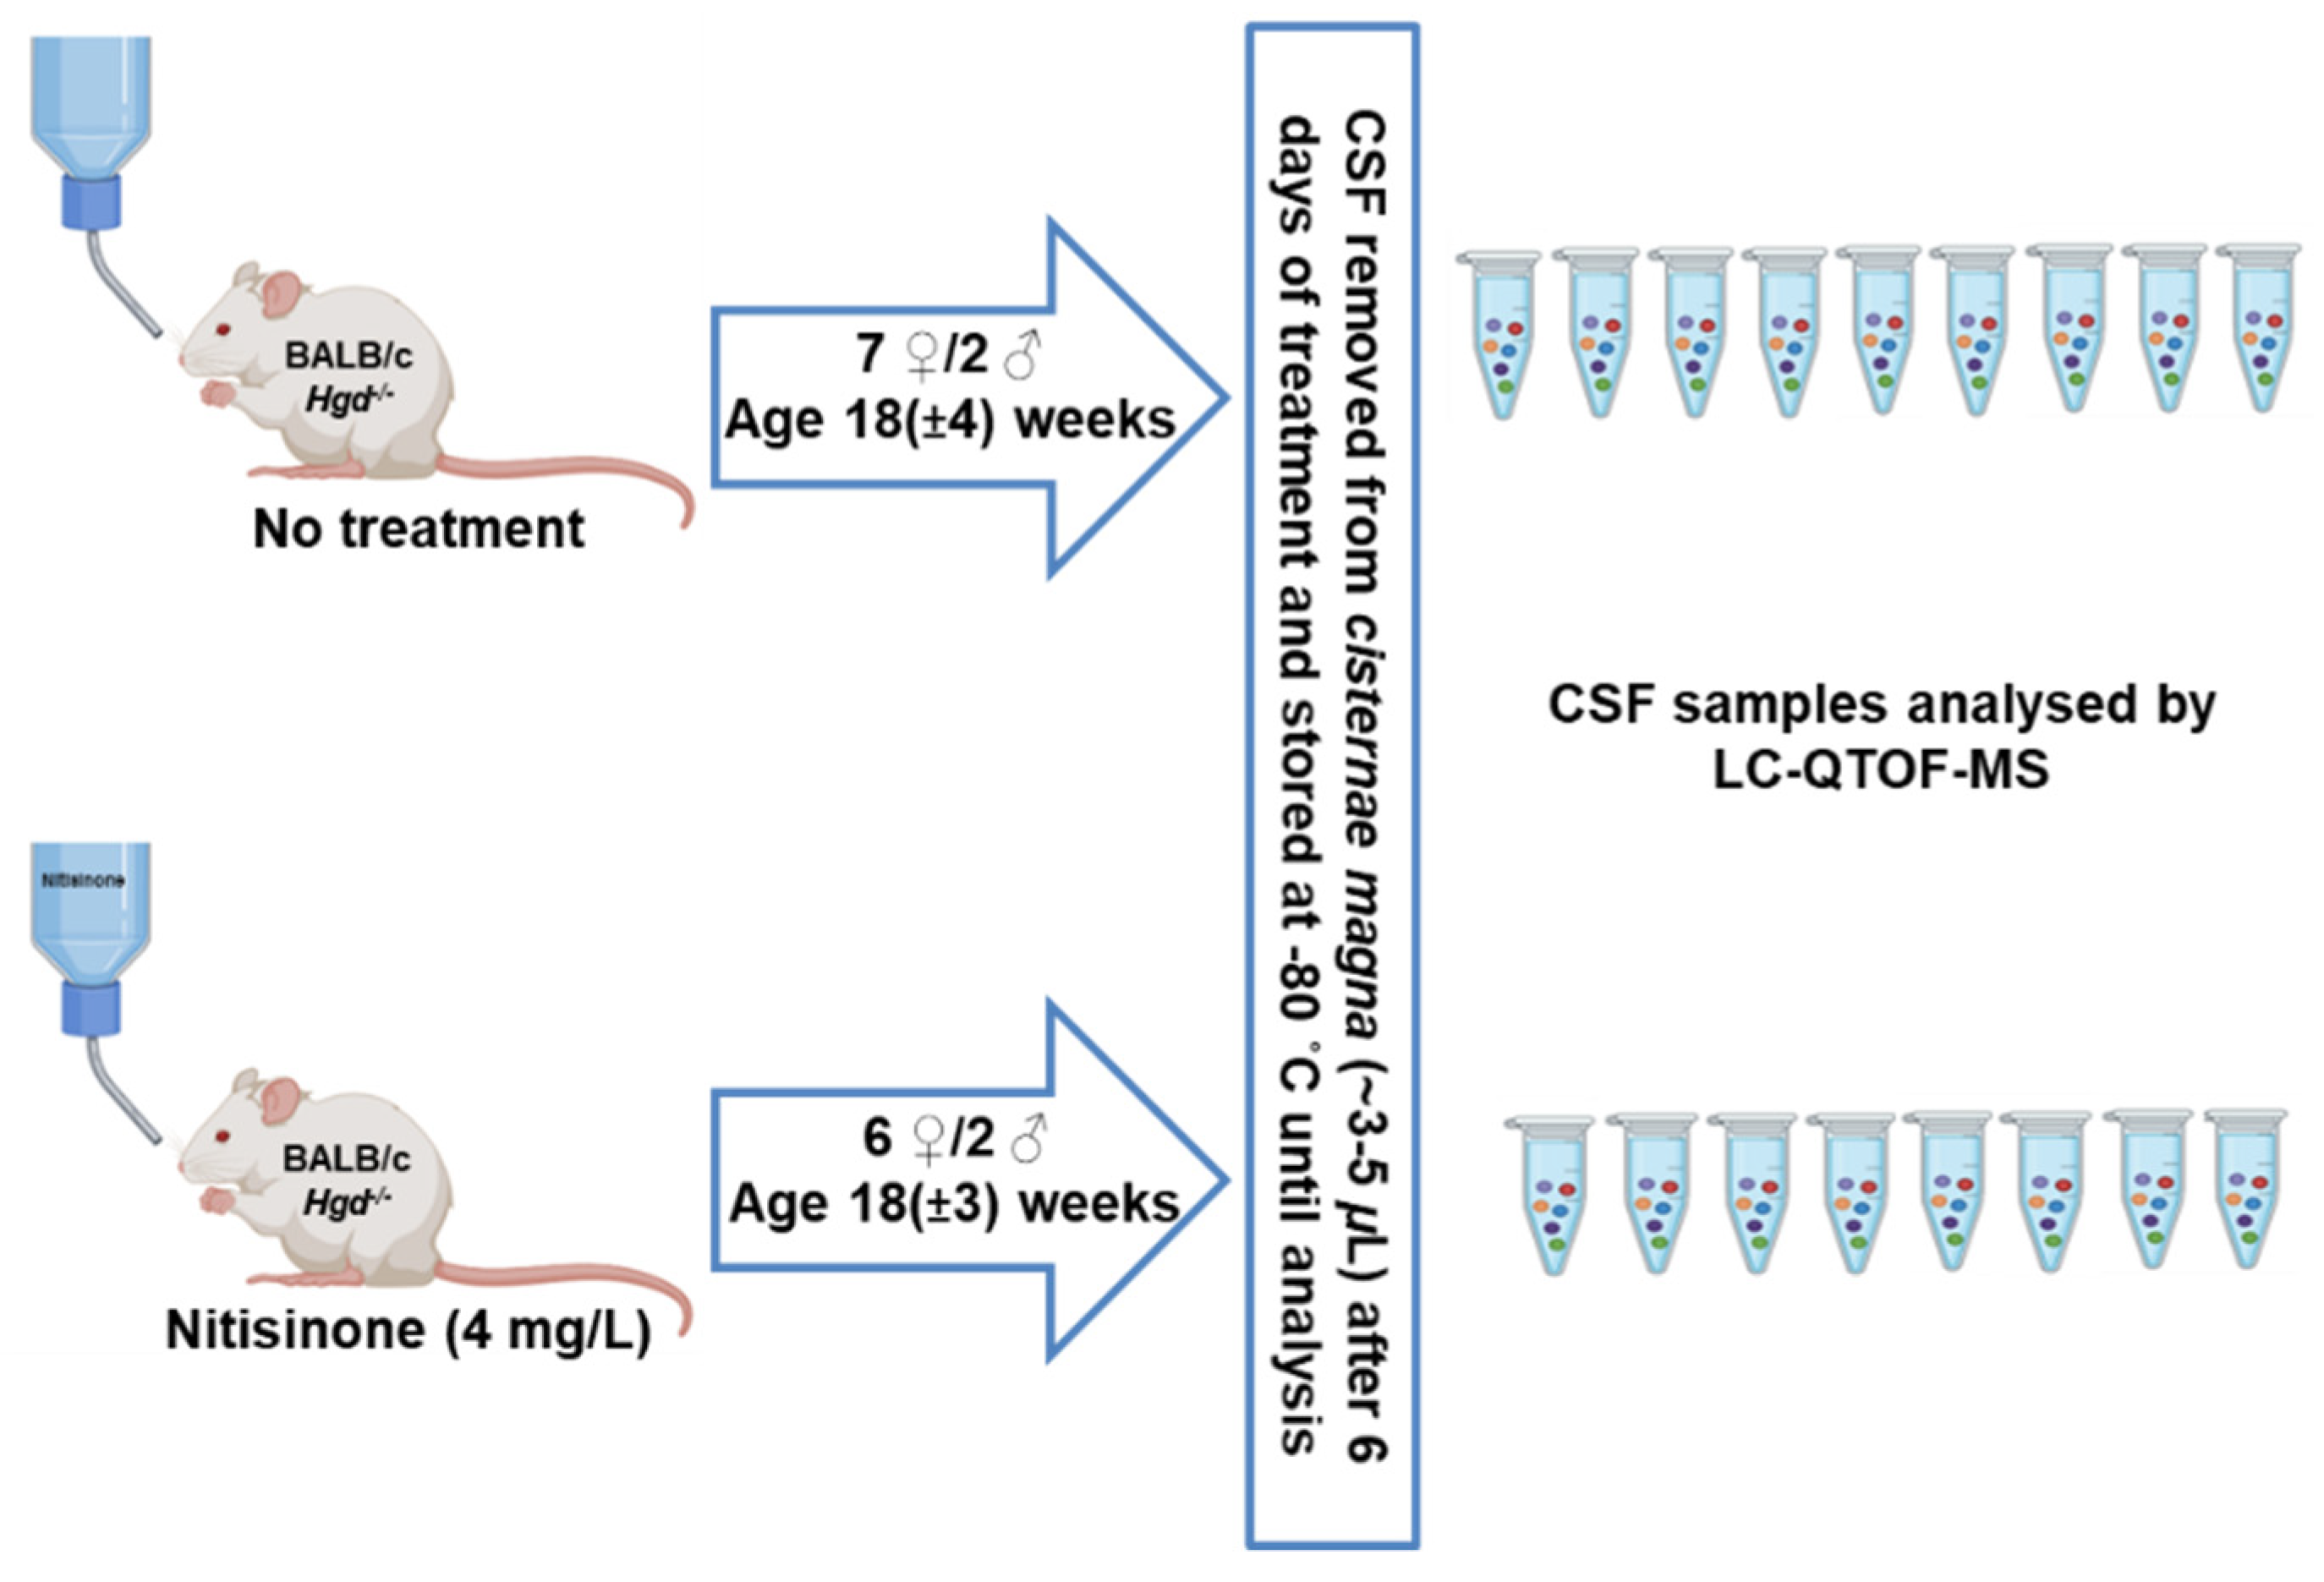
4.2. Animal Experiments and CSF Sample Collection
4.3. Murine and Quality Control Sample Preparation
4.4. Analytical Method
4.4.1. LC-QTOF-MS Conditions
4.4.2. Data Acquisition and Handling Parameters
4.4.3. Data Quality Control and Statistical Analysis
5. Conclusions
Supplementary Materials
Author Contributions
Funding
Institutional Review Board Statement
Data Availability Statement
Conflicts of Interest
References
- Phomphutkul, C.; Introne, W.J.; Perry, M.B.; Bernardini, I.; Murphey, M.D.; Fitzpatrick, D.L.; Anderson, P.D.; Huizing, M.; Anikster, Y.; Gerber, L.H.; et al. Natural History of Alkaptonuria. N. Eng. J. Med. 2002, 347, 2111–2121. [Google Scholar] [CrossRef] [PubMed]
- Suwannarat, P.; O’Brien, K.; Perry, M.B. Use of nitisinone in patients with alkaptonuria. Metabolism 2005, 54, 719–728. [Google Scholar] [CrossRef] [PubMed] [Green Version]
- Introne, W.J.; Perry, M.B.; Troendle, J.; Tsilou, E.; Kayser, M.A.; Suwannarat, P.; O’Brien, K.E.; Bryant, J.; Sachdev, V.; Reynolds, J.C.; et al. A 3-year randomized therapeutic trial of nitisinone in Alkaptonuria. Mol. Genet. Metab. 2011, 103, 307–314. [Google Scholar] [CrossRef] [PubMed] [Green Version]
- Ranganath, L.R.; Milan, A.M.; Hughes, A.T.; Dutton, J.J.; Fitzgerald, R.; Briggs, M.C.; Bygott, H.; Psarelli, E.E.; Cox, T.F.; Gallagher, J.A.; et al. Suitability Of Nitisinone In Alkaptonuria 1 (SONIA 1): An International, Multicentre, Randomised, Open-Label, No-Treatment Controlled, Parallel-Group, Dose-Response Study to Investigate the Effect of Once Daily Nitisinone on 24-H Urinary Homogentisic Acid Excretion in Patients with Alkaptonuria after 4 Weeks of Treatment. Ann. Rheum. Dis. 2016, 75, 362–367. [Google Scholar] [PubMed]
- Milan, A.M.; Hughes, A.T.; Davison, A.S.; Devine, J.; Usher, J.; Curtis, S.; Khedr, M.; Gallagher, J.A.; Ranganath, L.R. The Effect of Nitisinone on Homogentisic Acid and Tyrosine: A Two-Year Survey of Patients Attending the National Alkaptonuria Centre, Liverpool. Ann. Clin. Biochem. Int. J. Lab. Med. 2017, 54, 323–330. [Google Scholar] [CrossRef]
- Davison, A.S.; Norman, B.P.; Smith, E.A.; Devine, J.; Usher, J.; Hughes, A.T.; Khedr, M.; Milan, A.M.; Gallagher, J.A.; Ranganath, L.R. Serum Amino Acid Profiling in Patients with Alkaptonuria Before and After Treatment with Nitisinone. JIMD Rep. 2018, 41, 109–117. [Google Scholar]
- Sloboda, N.; Wiedemann, A.; Merten, M.; Alqahtani, A.; Jeannesson, E.; Blum, A.; Henn-Ménétré, S.; Guéant, J.-L.; Renard, E.; Feillet, F. Efficacy of Low Dose Nitisinone in the Management of Alkaptonuria. Mol. Genet. Metab. 2019, 127, 184–190. [Google Scholar] [CrossRef]
- Ranganath, L.R.; Psarelli, E.E.; Arnoux, J.-B.; Braconi, D.; Briggs, M.; Bröijersén, A.; Loftus, N.; Bygott, H.; Cox, T.F.; Davison, A.S.; et al. Efficacy and Safety of Once-Daily Nitisinone for Patients with Alkaptonuria (SONIA 2): An International, Multicentre, Open-Label, Randomised Controlled Trial. Lancet Diabetes Endocrinol. 2020, 8, 762–772. [Google Scholar] [CrossRef]
- Lindstedt, S.; Holme, E.; Lock, E.A.; Hjalmarson, O.; Strandvik, B. Treatment of Hereditary Tyrosinaemia Type I by Inhibition of 4-Hydroxyphenylpyruvate Dioxygenase. Lancet 1992, 340, 813–817. [Google Scholar] [CrossRef]
- van Ginkel, W.G.; Jahja, R.; Huijbregts, S.C.J.; Daly, A.; MacDonald, A.; De Laet, C.; Cassiman, D.; Eyskens, F.; Körver-Keularts, I.M.L.W.; Goyens, P.J.; et al. Neurocognitive Outcome in Tyrosinemia Type 1 Patients Compared to Healthy Controls. Orphanet J. Rare Dis. 2016, 11, 87. [Google Scholar] [CrossRef] [Green Version]
- Zeybek, C.A.; Zubarioglu, T. Nitisinone: A review. Orphanet J. Rare Dis. 2017, 7, 25–35. [Google Scholar] [CrossRef] [Green Version]
- Spiekerkoetter, U.; Couce, M.L.; Das, A.M.; de Laet, C.; Dionisi-Vici, C.; Lund, A.M.; Schiff, M.; Spada, M.; Sparve, E.; Szamosi, J.; et al. Long-Term Safety and Outcomes in Hereditary Tyrosinaemia Type 1 with Nitisinone Treatment: A 15-Year Non-Interventional, Multicentre Study. Lancet Diabetes Endocrinol. 2021, 9, 427–435. [Google Scholar] [CrossRef]
- Stewart, R.M.K.; Briggs, M.C.; Jarvis, J.C.; Gallagher, J.A.; Ranganath, L. Reversible Keratopathy due to Hypertyrosinaemia Following Intermittent Low-Dose Nitisinone in Alkaptonuria: A Case Report. JIMD Rep. 2014, 17, 1–6. [Google Scholar]
- Khedr, M.; Judd, S.; Briggs, M.C.; Hughes, A.T.; Milan, A.M.; Stewart, R.M.K.; Lock, E.A.; Gallagher, J.A.; Ranganath, L.R. Asymptomatic Corneal Keratopathy Secondary to Hypertyrosinaemia Following Low Dose Nitisinone and a Literature Review of Tyrosine Keratopathy in Alkaptonuria. JIMD Rep. 2017, 40, 31–37. [Google Scholar]
- White, A.; Tchan, M.C. Nitisinone-Induced Keratopathy in Alkaptonuria: A Challenging Diagnosis Despite Clinical Suspicion. JIMD Rep. 2018, 40, 7–9. [Google Scholar] [PubMed]
- McKiernan, P.J.; Preece, M.A.; Chakrapani, A. Outcome of children with hereditary tyrosinaemia following newborn screening. Arch. Dis. Child. 2015, 100, 738–741. [Google Scholar] [CrossRef]
- Thimm, E.; Herebian, D.; Assmann, B.; Klee, D.; Mayatepek, E.; Spiekerkoetter, U. Increase of CSF Tyrosine and Impaired Serotonin Turnover in Tyrosinemia Type I. Mol. Genet. Metab. 2011, 102, 122–125. [Google Scholar] [CrossRef] [PubMed]
- Hillgartner, M.A.; Coker, S.B.; Koenig, A.E.; Moore, M.E.; Barnby, E.; MacGregor, G.G. Tyrosinemia Type I and Not Treatment with NTBC Causes Slower Learning and Altered Behavior in Mice. J. Inherit. Metab. Dis. 2016, 39, 673–682. [Google Scholar] [CrossRef]
- Barone, H.; Bliksrud, Y.T.; Elgen, I.B.; Szigetvari, P.D.; Kleppe, R.; Ghorbani, S.; Hansen, E.V.; Haavik, J. Tyrosinemia Type 1 and Symptoms of ADHD: Biochemical Mechanisms and Implications for Treatment and Prognosis. Am. J. Med. Genet. B Neuropsychiatr. Genet. 2020, 183, 95–105. [Google Scholar] [CrossRef] [Green Version]
- Pearl, P.L.; Taylor, J.L.; Trzcinski, S.; Sokohl, A. The Pediatric Neurotransmitter Disorders. J. Child Neurol. 2007, 22, 606–616. [Google Scholar] [CrossRef]
- Davison, A.S.; Norman, B.; Milan, A.M.; Hughes, A.T.; Khedr, M.; Rovensky, J.; Gallagher, J.A.; Ranganath, L.R. Assessment of the Effect of Once Daily Nitisinone Therapy on 24-H Urinary Metadrenalines and 5-Hydroxyindole Acetic Acid Excretion in Patients with Alkaptonuria After 4 Weeks of Treatment. JIMD Rep. 2018, 41, 1–10. [Google Scholar] [PubMed]
- Davison, A.S.; Harrold, J.A.; Hughes, G.; Norman, B.P.; Devine, J.; Usher, J.; Hughes, A.T.; Khedr, M.; Gallagher, J.A.; Milan, A.M.; et al. Clinical and Biochemical Assessment of Depressive Symptoms in Patients with Alkaptonuria before and after Two Years of Treatment with Nitisinone. Mol. Genet. Metab. 2018, 125, 135–143. [Google Scholar] [CrossRef] [PubMed]
- Norman, B.P.; Davison, A.S.; Ross, G.A.; Milan, A.M.; Hughes, A.T.; Sutherland, H.; Jarvis, J.C.; Roberts, N.B.; Gallagher, J.A.; Ranganath, L.R. A Comprehensive LC-QTOF-MS Metabolic Phenotyping Strategy: Application to Alkaptonuria. Clin. Chem. 2019, 65, 530–539. [Google Scholar] [CrossRef]
- Davison, A.S.; Hughes, G.; Harrold, J.A.; Clarke, P.; Griffin, R.; Ranganath, L.R. Long-term low dose nitisinone therapy in adults with alkaptonuria shows no cognitive decline or increased severity of depression. JIMD Rep. 2022, 63, 221–230. [Google Scholar] [CrossRef] [PubMed]
- Davison, A.S.; Strittmatter, N.; Sutherland, H.; Hughes, A.T.; Hughes, J.; Bou-Gharios, G.; Milan, A.M.; Goodwin, R.J.A.; Ranganath, L.R.; Gallagher, J.A. Assessing the Effect of Nitisinone Induced Hypertyrosinaemia on Monoamine Neurotransmitters in Brain Tissue from a Murine Model of Alkaptonuria Using Mass Spectrometry Imaging. Metabolomics 2019, 15, 68. [Google Scholar] [CrossRef] [Green Version]
- Norman, B.P.; Davison, A.S.; Ross, G.A.; Milan, A.M.; Hughes, A.T.; Sutherland, H.; Jarvis, J.C.; Roberts, N.B.; Gallagher, J.A.; Ranganath, L.R. Three Accurate Mass Retention Time (AMRT) Databases Generated from IROA Technology Metabolite Library of Standards by LC-QTOF-MS Analysis. 2019. Available online: https://figshare.com/collections/Three_accurate_mass_retention_time_AMRT_databases_generated_from_IROA_Technology_Metabolite_Library_of_Standards_by_LC-QTOF-MS_analysis/4378235/2 (accessed on 5 May 2022).
- Davison, A.S.; Norman, B.P.; Ross, G.A.; Hughes, A.T.; Khedr, M.; Milan, A.M.; Gallagher, J.A.; Ranganath, L.R. Evaluation of the Serum Metabolome of Patients with Alkaptonuria before and after Two Years of Treatment with Nitisinone Using LC-QTOF-MS. JIMD Rep. 2019, 48, 67–74. [Google Scholar] [CrossRef]
- Bernardini, G.; Laschi, M.; Geminiani, M.; Braconi, D.; Vannuccini, E.; Lupetti, P.; Manetti, F.; Millucci, L.; Santucci, A. Homogentisate 1,2 Dioxygenase Is Expressed in Brain: Implications in Alkaptonuria. J. Inherit. Metab. Dis. 2015, 38, 807–814. [Google Scholar] [CrossRef]
- Wilson, P.J.M.; Ranganath, L.R.; Bou-Gharios, G.; Gallagher, J.A.; Hughes, J.H. Expression of Tyrosine Pathway Enzymes in Mice Demonstrates That Homogentisate 1,2-Dioxygenase Deficiency in the Liver Is Responsible for Homogentisic Acid-Derived Ochronotic Pigmentation. JIMD Rep. 2021, 58, 52–60. [Google Scholar] [CrossRef]
- Antoshechkin, A.G.; Chentsova, T.V.; Tatur, V.Y.; Naritsin, D.B.; Railian, G.P. Content of Phenylalanine, Tyrosine and Their Metabolites in CSF in Phenylketonuria. J. Inherit. Metab. Dis. 1991, 14, 749–754. [Google Scholar] [CrossRef]
- Sarkissian, C.N.; Scriver, C.R.; Mamer, O.A. Measurement of phenyllactate, phenylacetate, and phenylpyruvate by negative ion chemical ionization-gas chromatography/mass spectrometry in brain of mouse genetic models of phenylketonuria and non-phenylketonuria hyperphenylalaninemia. Anal. Biochem. 2000, 280, 242–249. [Google Scholar] [CrossRef] [Green Version]
- Gertsman, I.; Barshop, B.A.; Panyard-Davis, J. Metabolic Effects of Increasing Doses of Nitisinone in the Treatment of Alkaptonuria. JIMD Rep. 2015, 24, 13–20. [Google Scholar] [PubMed] [Green Version]
- Liu, G.; Cao, W.; Fang, T.; Jia, G.; Zhao, H.; Chen, X.; Wu, C.; Wang, J. Urinary Metabolomic Approach Provides New Insights into Distinct Metabolic Profiles of Glutamine and N-Carbamylglutamate Supplementation in Rats. Nutrients 2016, 8, 478. [Google Scholar] [CrossRef] [PubMed] [Green Version]
- Yu, P.H.; Bowen, R.C.; Davis, B.A.; Boulton, A.A. Platelet Monoamine Oxidase Activity and Trace Acid Levels in Plasma of Agoraphobic Patients. Acta Psychiatr. Scand. 1983, 67, 188–194. [Google Scholar] [CrossRef] [PubMed]
- Sandler, M.; Ruthven, C.R.; Goodwin, B.L.; Reynolds, G.P.; Rao, V.A.; Coppen, A. Deficient Production of Tyramine and Octopamine in Cases of Depression. Nature 1979, 278, 357–358. [Google Scholar] [CrossRef]
- Kobayashi, K.; Koide, Y.; Shohmori, T. Determination of p-hydroxyphenylacetic acid in cerebrospinal fluid by high-performance liquid chromatography with electrochemical detection. Clin. Chim. Acta 1982, 123, 161–168. [Google Scholar] [CrossRef]
- Simon, M.J.; Iliff, J.J. Regulation of cerebrospinal fluid (CSF) flow in neurodegenerative, neurovascular and neuroinflammatory disease. Biochim. Biophys. Acta 2016, 1862, 442–451. [Google Scholar] [CrossRef]
- Dourish, C.T. An observational analysis of the behavioural effects of β phenylethylamine in isolated and grouped mice. Prog. Neuropsychopharmacol. Biol. Psychiat. 1982, 6, 143–158. [Google Scholar] [CrossRef]
- Berry, M.D. The potential of trace amines and their receptors for treating neurological and psychiatric diseases. Rev. Recent Clin. Trials 2007, 2, 3–19. [Google Scholar] [CrossRef] [Green Version]
- Lindemann, L.; Meyer, C.A.; Jeanneau, K.; Bradaia, A.; Ozmen, L.; Bluethmann, H.; Bettler, B.; Wettstein, J.G.; Borroni, E.; Moreau, J.-L.; et al. Trace Amine-Associated Receptor 1 Modulates Dopaminergic Activity. J. Pharmacol. Exp. Ther. 2008, 324, 948–956. [Google Scholar] [CrossRef] [Green Version]
- D’Andrea, G.; Nordera, G.; Pizzolato, G.; Bolner, A.; Colavito, D.; Flaibani, R.; Leon, A. Trace Amine Metabolism in Parkinson’s Disease: Low Circulating Levels of Octopamine in Early Disease Stages. Neurosci. Lett. 2010, 469, 348–351. [Google Scholar] [CrossRef]
- Boulton, A.A. Trace amines and mental disorders. Can. J. Neurol. Sci. 1980, 7, 261–263. [Google Scholar] [CrossRef] [PubMed] [Green Version]
- Baker, G.B.; Bornstein, R.A.; Yeragani, V.K. Trace amines and Tourette’s syndrome. Neurochem. Res. 1993, 18, 951–956. [Google Scholar] [CrossRef] [PubMed]
- D’Andrea, G.; Terrazzino, S.; Leon, A.; Fortin, D.; Perini, F.; Granella, F.; Bussone, G. Elevated Levels of Circulating Trace Amines in Primary Headaches. Neurology 2004, 62, 1701–1705. [Google Scholar] [CrossRef] [PubMed]
- Harding, C.O.; Winn, S.R.; Gibson, K.M.; Arning, E.; Bottiglieri, T.; Grompe, M. Pharmacologic Inhibition of L-Tyrosine Degradation Ameliorates Cerebral Dopamine Deficiency in Murine Phenylketonuria (PKU). J. Inherit. Metab. Dis. 2014, 37, 735–743. [Google Scholar] [CrossRef] [PubMed] [Green Version]
- Thimm, E.; Richter-Werkle, R.; Kamp, G.; Molke, B.; Herebian, D.; Klee, D.; Mayatepek, E.; Spiekerkoetter, U. Neurocognitive Outcome in Patients with Hypertyrosinemia Type I after Long-Term Treatment with NTBC. J. Inherit. Metab. Dis. 2012, 35, 263–268. [Google Scholar] [CrossRef]
- Pilotto, A.; Blau, N.; Leks, E. Cerebrospinal fluid biogenic amines depletion and brain atrophy in adult patients with phenylketonuria. J. Inherit. Metab. Dis. 2019, 42, 398–406. [Google Scholar] [CrossRef]
- Olszewska, M. The effect of hemodialysis on some parameters of the antioxidant system in the blood of patients with chronic renal failure. Ann. Acad. Med. Stetin. 2004, 50, 41–52. [Google Scholar]
- Akiyama, T.; Hayashi, Y.; Hanaoka, Y.; Shibata, T.; Akiyama, M.; Nakamura, K.; Tsuyusaki, Y.; Kubota, M.; Yoshinaga, H.; Kobayashi, K. Simultaneous Measurement of Monoamine Metabolites and 5-Methyltetrahydrofolate in the Cerebrospinal Fluid of Children. Clin. Chim. Acta 2017, 465, 5–10. [Google Scholar] [CrossRef]
- Yoshitake, T.; Kehr, J.; Todoroki, K.; Nohta, H.; Yamaguchi, M. Derivatization Chemistries for Determination of Serotonin, Norepinephrine and Dopamine in Brain Microdialysis Samples by Liquid Chromatography with Fluorescence Detection. Biomed. Chromatogr. 2006, 20, 267–281. [Google Scholar] [CrossRef]
- Kovac, A.; Somikova, Z.; Zilka, N.; Novak, M. Liquid Chromatography–tandem Mass Spectrometry Method for Determination of Panel of Neurotransmitters in Cerebrospinal Fluid from the Rat Model for Tauopathy. Talanta 2014, 119, 284–290. [Google Scholar] [CrossRef]
- Ramautar, R.; Shyti, R.; Schoenmaker, B.; de Groote, L.; Derks, R.J.E.; Ferrari, M.D.; van den Maagdenberg, A.M.J.M.; Deelder, A.M.; Mayboroda, O.A. Metabolic Profiling of Mouse Cerebrospinal Fluid by Sheathless CE-MS. Anal. Bioanal. Chem. 2012, 404, 2895–2900. [Google Scholar] [CrossRef] [PubMed]
- Hyland, K. Clinical utility of monoamine neurotransmitter metabolite analysis in cerebrospinal fluid. Clin. Chem. 2008, 54, 633–641. [Google Scholar] [CrossRef] [PubMed] [Green Version]
- Bass, N.H.; Lundborg, P. Postnatal development of bulk flow in the cerebrospinal fluid system of the albino rat: Clearance of carboxyl-(14C)inulin after intrathecal infusion. Brain Res. 1973, 30, 323–332. [Google Scholar] [CrossRef]
- Liu, L.; Duff, K. A technique for serial collection of cerebrospinal fluid from the cisterna magna in mouse. J. Vis. Exp. 2008, 21, 960. [Google Scholar] [CrossRef] [Green Version]


| Compound | CV of Raw Area Abundance (%) | Mean Error from Target Mass (ppm) | Mean Difference from Target RT (min) |
|---|---|---|---|
| L-Tyrosine (100 µmol/L) | 8.8 | 0.69 | 0.07 |
| L-Phenylalanine (100 µmol/L) | 2.4 | 0.20 | 0.06 |
| Nitisinone (10 µmol/L) | 11.9 | 0.26 | 0.004 |
| Succinylacetone (30 µmol/L) | 4.6 | 0.42 | 0.02 |
| Compound | Log2 FC | Abundance | p Value | Metabolic Pathway Affected | |
|---|---|---|---|---|---|
| Up | Down | ||||
| p-Hydroxyphenylacetic acid (HPA) † | 4.0 | √ | 6.37 × 10⁻¹⁹ | Tyramine | |
| 3-(4-Hydroxyphenyl)lactic acid (HPLA) †† | 3.9 | √ | 6.15 × 10⁻¹¹ | L-Tyrosine | |
| L-Tyrosine * | 2.6 | √ | 8.7 × 10⁻¹⁰ | L-Tyrosine | |
Publisher’s Note: MDPI stays neutral with regard to jurisdictional claims in published maps and institutional affiliations. |
© 2022 by the authors. Licensee MDPI, Basel, Switzerland. This article is an open access article distributed under the terms and conditions of the Creative Commons Attribution (CC BY) license (https://creativecommons.org/licenses/by/4.0/).
Share and Cite
Davison, A.S.; Norman, B.P.; Sutherland, H.; Milan, A.M.; Gallagher, J.A.; Jarvis, J.C.; Ranganath, L.R. Impact of Nitisinone on the Cerebrospinal Fluid Metabolome of a Murine Model of Alkaptonuria. Metabolites 2022, 12, 477. https://doi.org/10.3390/metabo12060477
Davison AS, Norman BP, Sutherland H, Milan AM, Gallagher JA, Jarvis JC, Ranganath LR. Impact of Nitisinone on the Cerebrospinal Fluid Metabolome of a Murine Model of Alkaptonuria. Metabolites. 2022; 12(6):477. https://doi.org/10.3390/metabo12060477
Chicago/Turabian StyleDavison, Andrew S., Brendan P. Norman, Hazel Sutherland, Anna M. Milan, James A. Gallagher, Jonathan C. Jarvis, and Lakshminarayan R. Ranganath. 2022. "Impact of Nitisinone on the Cerebrospinal Fluid Metabolome of a Murine Model of Alkaptonuria" Metabolites 12, no. 6: 477. https://doi.org/10.3390/metabo12060477