Article

The Distribution of Major Brain Metabolites in Normal Adults: Short Echo Time Whole-Brain MR Spectroscopic Imaging Findings

1
Laboratory for Biomarker Imaging Science, Hokkaido University Graduate School of Biomedical Science and Engineering, Sapporo 060-8638, Japan
2
Department of Rehabilitation, Hokkaido University Hospital, Sapporo 060-8648, Japan
3
Department of Rehabilitation, Sapporo Azabu Neurosurgical Hospital, Sapporo 065-0022, Japan
4
Department of Radiology, University of Miami School of Medicine, Miami, FL 33146, USA
5
Siemens Healthcare K.K., Tokyo 141-8644, Japan
6
Siemens Healthineers, San Francisco, CA 94553, USA
7
Global Center for Biomedical Science and Engineering, Hokkaido University Faculty of Medicine, Sapporo 060-8638, Japan
*
Author to whom correspondence should be addressed.
Metabolites 2022, 12(6), 543; https://doi.org/10.3390/metabo12060543
Submission received: 17 March 2022 / Revised: 5 June 2022 / Accepted: 8 June 2022 / Published: 14 June 2022
(This article belongs to the Section Endocrinology and Clinical Metabolic Research)

Abstract

:
This prospective study aimed to evaluate the variation in magnetic resonance spectroscopic imaging (MRSI)-observed brain metabolite concentrations according to anatomical location, sex, and age, and the relationships among regional metabolite distributions, using short echo time (TE) whole-brain MRSI (WB-MRSI). Thirty-eight healthy participants underwent short TE WB-MRSI. The major metabolite ratios, i.e., N-acetyl aspartate (NAA)/creatine (Cr), choline (Cho)/Cr, glutamate + glutamine (Glx)/Cr, and myoinositol (mI)/Cr, were calculated voxel-by-voxel. Their variations according to anatomical regions, sex, and age, and their relationship to each other were evaluated by using repeated-measures analysis of variance, t-tests, and Pearson’s product-moment correlation analyses. All four metabolite ratios exhibited widespread regional variation across the cerebral hemispheres (corrected p < 0.05). Laterality between the two sides and sex-related variation were also shown (p < 0.05). In several regions, NAA/Cr and Glx/Cr decreased and mI/Cr increased with age (corrected p < 0.05). There was a moderate positive correlation between NAA/Cr and mI/Cr in the insular lobe and thalamus and between Glx/Cr and mI/Cr in the parietal lobe (r ≥ 0.348, corrected p ≤ 0.025). These observations demand age- and sex- specific regional reference values in interpreting these metabolites, and they may facilitate the understanding of glial-neuronal interactions in maintaining homeostasis.

Graphical Abstract

1. Introduction

Magnetic resonance spectroscopy (MRS) has been applied in clinical practice for several decades for in vivo measurement of metabolites that cannot be directly detected by routine MR imaging sequences [1]. Its usefulness in diagnosing brain diseases or monitoring treatment has been widely documented; for example, malignant brain tumors are characterized by increased choline (Cho) and decreased N-acetylaspartate (NAA) signals, relative to normal tissue [1], and increased Lactate (Lac) concentration has been used as an indicator of disease activity in mitochondrial diseases, such as Leigh syndrome, mitochondrial encephalomyopathy, lactic acidosis, and stroke-like episodes (MELAS) [2,3].
Despite its clinical usefulness, the widespread application of MRS for clinical studies remains limited, for reasons that include the limited spatial sampling and long acquisition times provided by the standard single voxel acquisition methods [1]. Several documents have reported on MR spectroscopic imaging (MRSI) techniques that enable mapping of tissue metabolites over larger brain regions within clinically acceptable acquisition times [4,5]. Of these, an echo-planar spectroscopic imaging method has recently emerged as a whole-brain acquisition (WB-MRSI) in time suitable for clinical studies [6,7]. The reproducibility of WB-MRSI has been reported as comparable to that of the conventional MRS technique [8]. Studies using WB-MRSI have also reported its ability to detect metabolite alterations in the normal-appearing brain regions of patients with traumatic brain injury, amyotrophic lateral sclerosis, and brain tumors, suggestive of its high sensitivity in detecting abnormalities across the whole brain, which is not possible with single-voxel spectroscopy [9,10,11].
Identification of metabolite alterations by MRS requires knowledge about normal metabolite concentrations and their distribution. Conventional MRS and a few initial WB-MRSI studies have reported variations in metabolite concentrations with anatomical location, sex, age, and echo time (TE) [7,12,13]. The existing WB-MRSI reports that evaluated the variation in metabolite concentrations with anatomical location focus mainly on laterality. Very little has been reported about their variation across various anatomical regions of the brain. To our knowledge, there has been only one WB-MRSI report which statistically compared the concentrations of glutamate and glutamine compounds (Glx) across anatomical regions [14]. With regard to sex-related variations, there have been two reports that compared the major metabolite concentrations and their ratios, using an intermediate TE [7,12]; however, short TE is generally preferred to longer TE settings due to its higher signal-to-noise ratio (SNR) and its ability to detect more metabolites [14].
This prospective study aimed to evaluate the influence of anatomical location, sex, and age on the concentrations of the brain’s major metabolites and their relationship, using short TE WB-MRSI.

2. Results

The representative single-voxel spectra extracted from WB-MRSI and major metabolite ratio maps are shown in Figure 1 and Supplementary Figure S1, respectively. The average Cramer-Rao bound was 9.70 ± 2.45% for NAA, 12.28 ± 2.47% for Cho, 20.20 ± 3.20% for Glx, 12.86 ± 2.04% for mI, and 8.31 ± 2.14% for creatine (Cr).

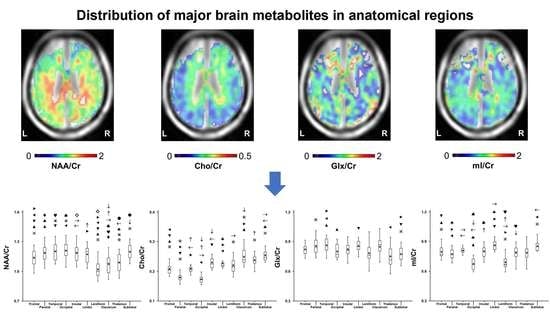
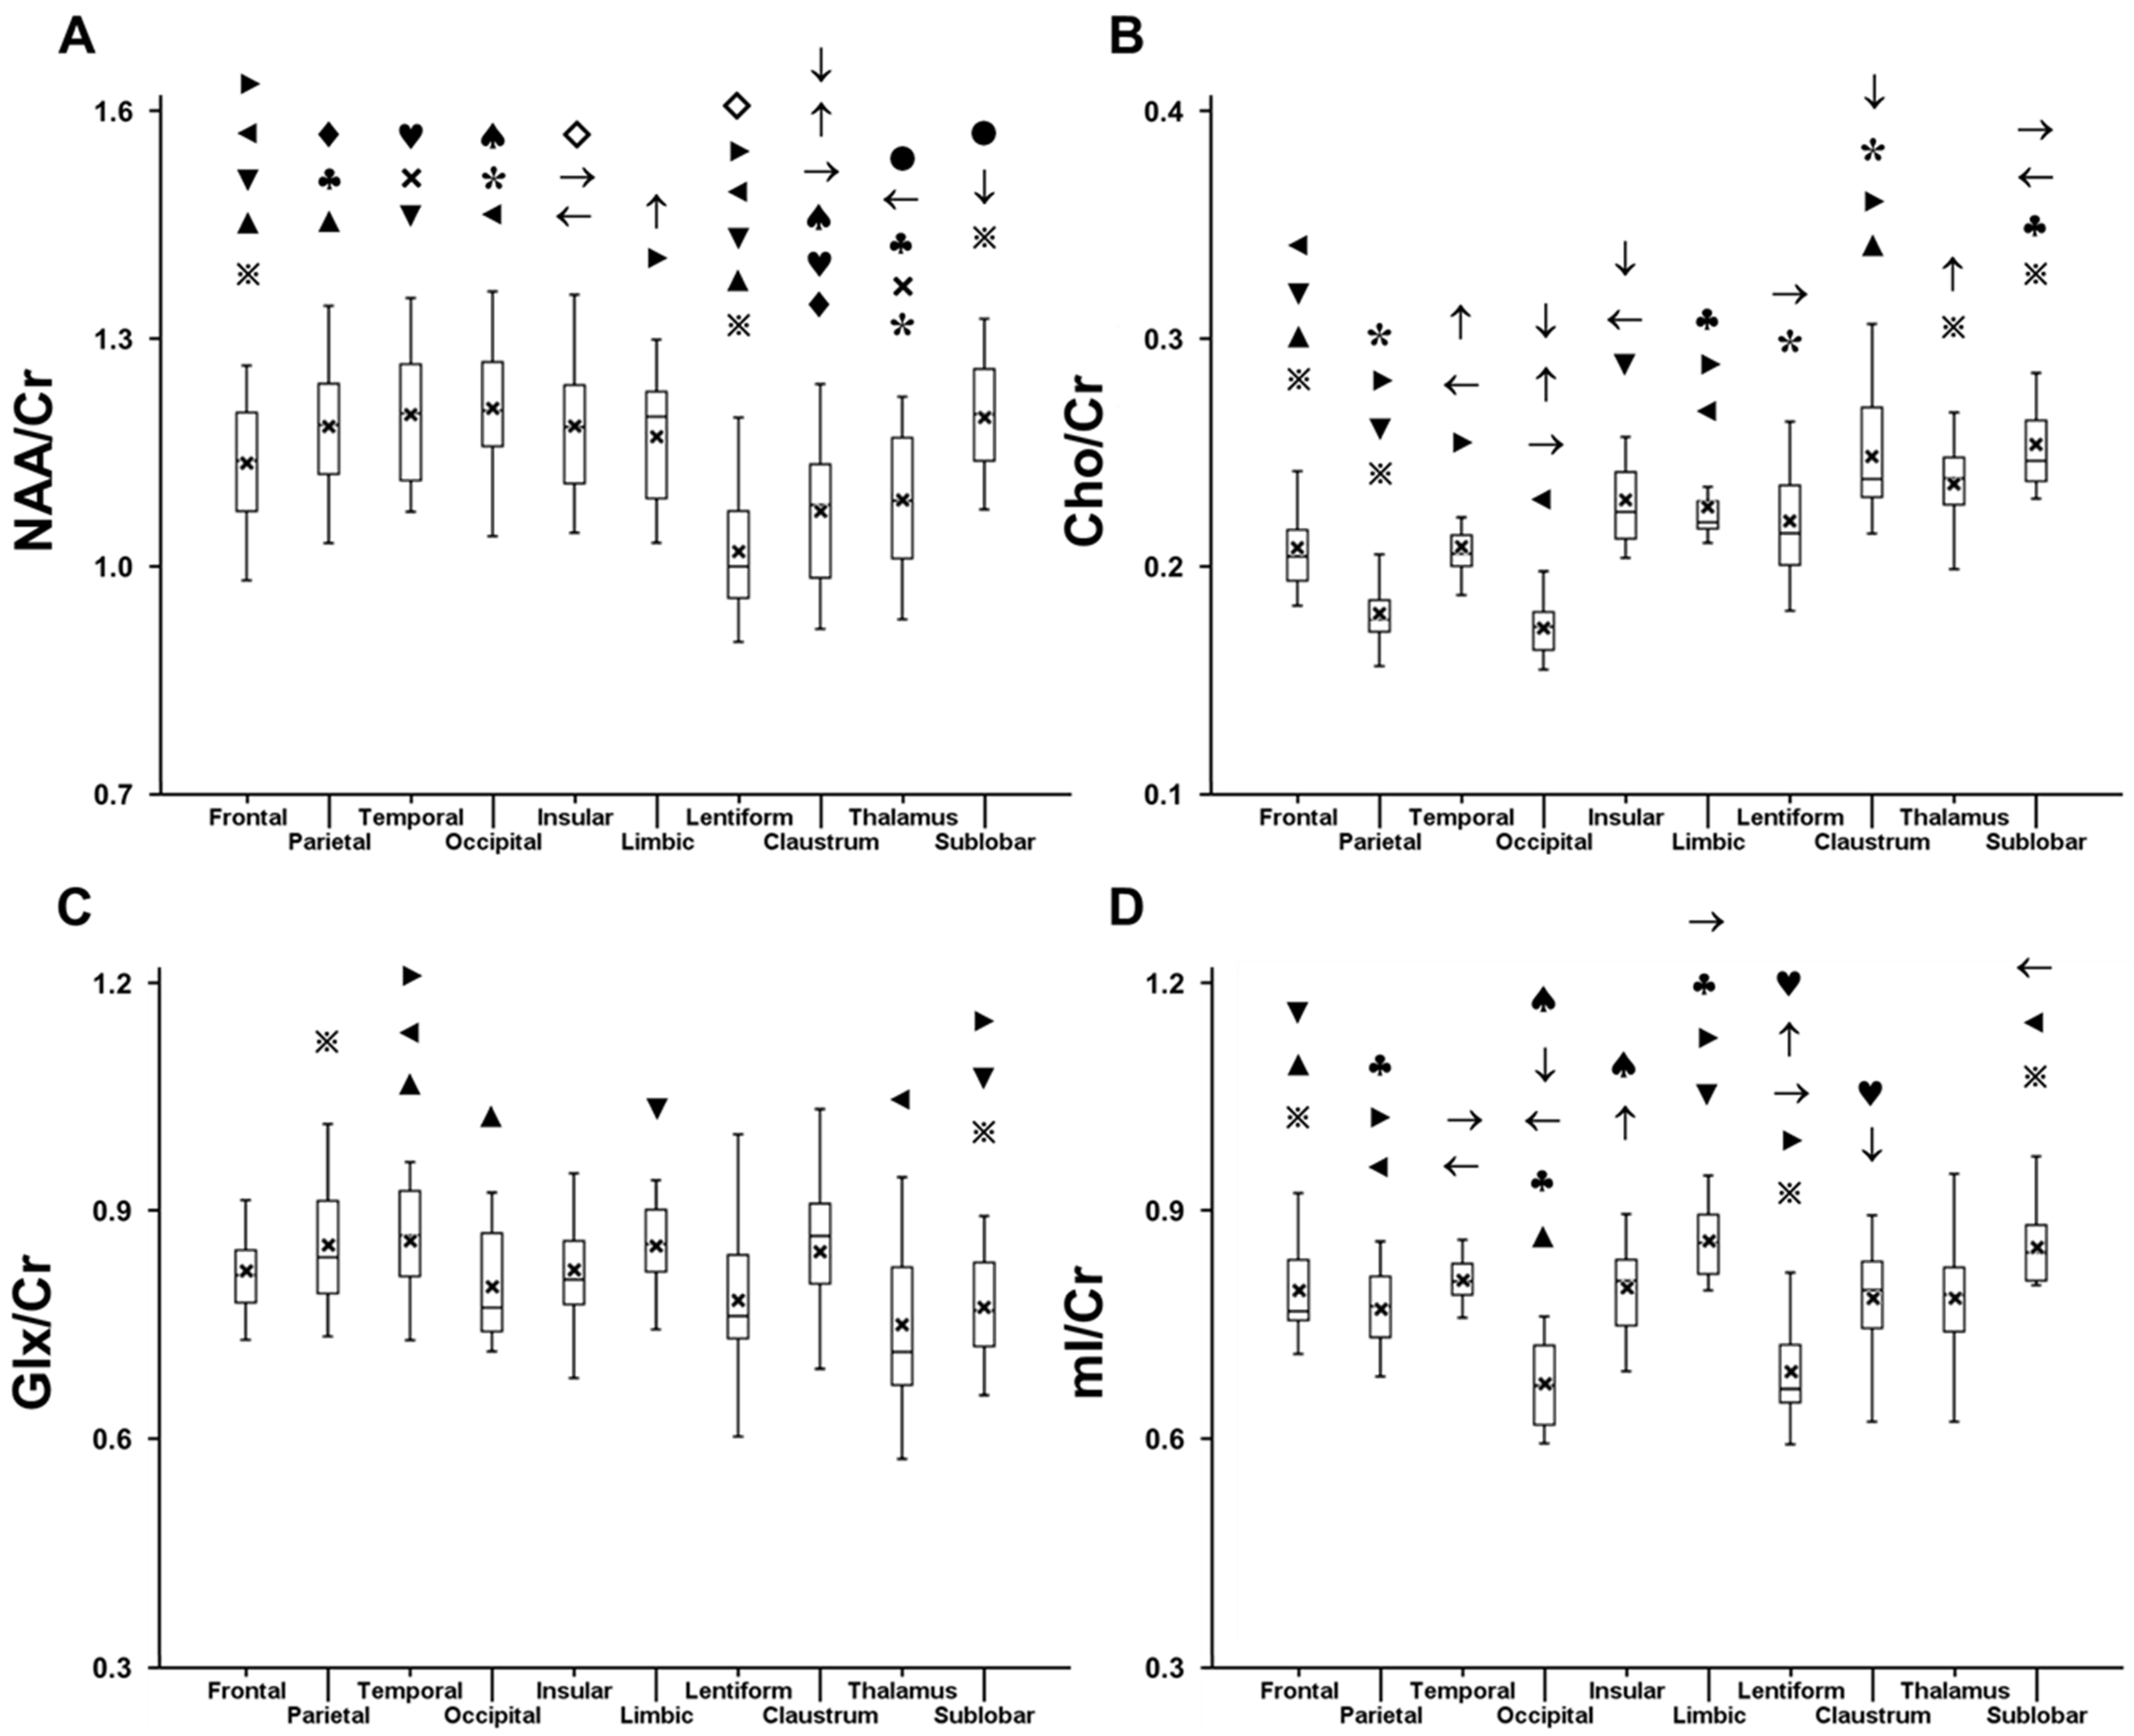
2.1. Variation in Metabolite Ratios with Anatomical Location

The regional metabolite ratios are summarized in Figure 2. The metabolite ratios varied significantly among several anatomical locations. The frontal lobe, lentiform nucleus, claustrum, and thalamus had lower NAA/Cr than the parietal, temporal, and occipital lobes and the sublobar white matter (corrected p < 0.018). The frontal lobe and claustrum also had lower NAA/Cr than the limbic lobe (corrected p < 0.016). The claustrum and thalamus had lower NAA/Cr than the insular lobe (corrected p < 0.004). The lentiform nucleus had lower NAA/Cr than the frontal, insular, and limbic lobes (corrected p < 0.001). On the other hand, the insular and limbic lobes, claustrum, thalamus, and the sublobar white matter had higher Cho/Cr than the four major cerebral lobes (corrected p < 0.001). The frontal and temporal lobes and lentiform nucleus had higher Cho/Cr than the parietal and occipital lobes (corrected p < 0.001). The claustrum and sublobar white matter had higher Cho/Cr than the insular and limbic lobes and lentiform nucleus (corrected p < 0.001). The sublobar white matter also had higher Cho/Cr than the thalamus (corrected p = 0.017) and had lower Glx/Cr than the parietal, temporal, and limbic lobes (corrected p < 0.015). The occipital lobe and thalamus had lower Glx/Cr than the temporal lobe (corrected p < 0.023). The limbic lobe and sublobar white matter had higher mI/Cr than all four major cerebral lobes and lentiform nucleus (corrected p < 0.015). The frontal, parietal, temporal, and insular lobes had higher mI/Cr than the occipital lobe and lentiform nucleus (corrected p < 0.006). The claustrum also had higher mI/Cr than the occipital lobe and lentiform nucleus (corrected p < 0.048).
The gray and white matter volume ratios and their standard deviations (SD) are: 0.771 ± 0.077 for frontal lobe, 1.282 ± 0.128 for parietal lobe, 1.152 ± 0.090 for temporal lobe, 1.340 ± 0.137 for occipital lobe, 1.260 ± 0.253 for insular lobe, 1.044 ± 0.113 for limbic lobe, 1.082 ± 0.184 for claustrum, 1.925 ± 0.722 for lentiform nucleus, 0.898 ± 0.153 for thalamus, and 0.356 ± 0.079 for sublobar white matter. Tissue-specific regional metabolite ratios are provided in Supplementary Table S1.

2.2. Laterality

The mean regional metabolite ratios of anatomical regions by each side are provided in Table 1. The left frontal (p = 0.028), parietal (p = 0.002), and temporal (p < 0.001) lobes had significantly higher NAA/Cr than the right side. The left frontal (p < 0.001), temporal (p < 0.001), and limbic (p = 0.010) lobes, claustrum (p = 0.034), and the sublobar white matter (p = 0.002) had significantly higher Glx/Cr than the right side. The right parietal (p < 0.001), temporal (p < 0.001), occipital (p < 0.001), insular (p = 0.024) and limbic (p = 0.004) lobes, and the sublobar white matter (p < 0.001) had significantly higher Cho/Cr than the left side. No laterality in mI/Cr was observed for any anatomical region. A separate evaluation with 30 right-handed participants also gave similar results for most anatomical regions (Supplementary Table S2).

2.3. Sex-Related Variation

The mean regional metabolite ratios of each sex group are provided in Table 1. Women had significantly lower Cho/Cr in the frontal (p = 0.009), temporal (p = 0.018), and insular (p = 0.012) lobes, and higher mI/Cr in the parietal (p = 0.016) and occipital (p = 0.005) lobes, and the lentiform nucleus (p = 0.025) than men. The sex difference in the metabolite ratios was greatest in the lentiform nucleus for mI/Cr, amounting to 20.3% difference.
The sex-related variation mentioned above was also true for mI/Cr in the left occipital lobe (p = 0.003) and the lentiform nucleus (p = 0.044) if the metabolite ratios were compared for each side (Supplementary Table S3). For the right cerebral hemisphere, no significant sex difference in mI/Cr was observed. As for Cho/Cr, women showed a trend toward a decrease in the right frontal (p = 0.051), left temporal (p = 0.063), and left insular (p = 0.053) lobes.

2.4. Correlation with Age

Table 2 summarizes the results of correlation of each metabolite ratio with age. NAA/Cr significantly decreased with age in most anatomical locations, including the frontal (r = −0.741, corrected p < 0.001), parietal (r = −0.791, corrected p < 0.001), temporal (r = −0.819, corrected p < 0.001), occipital (r = −0.668, corrected p < 0.001), insular (r = −0.605, corrected p < 0.001) and limbic (r = −0.780, corrected p < 0.001) lobes, claustrum (r = −0.512, corrected p = 0.003), thalamus (r = −0.471, corrected p = 0.005), and the sublobar white matter (r = −0.568, corrected p < 0.001). Glx/Cr also significantly decreased with age in the parietal (r = −0.532, corrected p < 0.001) and limbic (r = −0.422, corrected p = 0.011) lobes. A significant increase in mI/Cr with age was observed in the frontal (r = 0.417, corrected p = 0.045), insular (r = 0.452, corrected p = 0.006), and limbic (r = 0.385, corrected p = 0.040) lobes.
The above observations were also valid for each side of the anatomical regions that exhibit laterality in the metabolite ratios, except the NAA/Cr of bilateral claustra, left thalamus, sublobar white matter, and the right occipital lobe, the Glx/Cr of bilateral limbic and right parietal lobes, and the mI/Cr of bilateral frontal and limbic lobes, and the left insular lobe. Further exploration of the influence of sex on age-related variation in metabolite ratios also revealed significant differences: a decrease in NAA/Cr in the frontal (r = −0.794, corrected p < 0.001), parietal (r = −0.783, corrected p < 0.001), temporal (r = −0.832, corrected p < 0.001), and limbic (r = −0.834, corrected p < 0.001) lobes was observed in women. The men’s results were also similar in most locations, except increased mI/Cr in the frontal and limbic lobes.

2.5. Relationship among Regional Metabolite Ratios

Figure 3 provides a summary of significant relationships among regional metabolite ratios. Moderate positive correlations were observed between NAA/Cr and mI/Cr in the insular lobe (r = 0.490, corrected p < 0.001) and thalamus (r = 0.362, corrected p = 0.025), and between Glx/Cr and mI/Cr in the parietal lobe (r = 0.348, corrected p = 0.018).
When these correlations were tested on each side, moderate positive correlations were observed between NAA/Cr and mI/Cr in the left insular lobe (r = 0.619, corrected p = 0.002), and between Glx/Cr and mI/Cr in the left parietal lobe (r = 0.503, corrected p = 0.013). When tested on each sex group, moderate positive correlations were observed between NAA/Cr and mI/Cr in the insular lobe (r = 0.642, corrected p = 0.001) and the thalamus (r = 0.547, corrected p = 0.013), in women.

2.6. The Influence of Scan Conditions on Laterality in Major Metabolite Ratios

Bland-Altman plots are summarized in Supplementary Figure S2. For NAA/Cr, Cho/Cr, Glx/Cr, and mI/Cr, the mean differences and their SD were 0.096 ± 0.048, 0.013 ± 0.011, −0.004 ± 0.099, and −0.038 ± 0.112, respectively. The difference in metabolite ratios between the two head positions fell within the 95% confidence intervals, except for NAA/Cr and Glx/Cr in the left lentiform nucleus, Cho/Cr and mI/Cr in the right lentiform nucleus, and mI/Cr in the right thalamus. The laterality pattern was similar across all regions of interest (ROIs) between the two head positions, except for Cho/Cr in the limbic lobe, Glx/Cr in the parietal and temporal lobes, lentiform nucleus, and thalamus, and mI/Cr in the temporal lobe, claustrum, and sublobar white matter.

3. Discussion

This report evaluated the influence of anatomical location, sex, and age on the brain’s major metabolite ratios and the relationship among these ratios, using short TE WB-MRSI. Metabolite ratios, instead of absolute metabolite concentrations, were evaluated because metabolite ratios are more commonly used in real clinical situations due to simpler acquisition and data processing [14]. Additionally, evaluating metabolite ratios can reduce the influence of T2 relaxation time [15]. Significant differences in metabolite ratios were observed across anatomical locations, sex, and age, which indicates these must be accounted for when interpreting regional metabolite ratios. There were also correlations among regional metabolite ratios, the knowledge of which facilitates the understanding of glial-neuronal interactions, and the involvement of each metabolite in regulating homeostasis.
NAA/Cr in the deep gray matter nuclei was significantly lower than most other anatomical regions. This metabolite ratio was also significantly lower in the frontal lobe, when compared with the other major anatomical lobes. NAA concentrations have been shown to associate positively with neuronal density [16,17]. Thus, these findings may reflect the lower neuronal density in these regions. Supportive of this, histological studies on cadaveric brains have documented lower neuronal density in these regions [18,19]. Our observation of lower Cho/Cr in the parietal and occipital lobes is in agreement with a previous autopsy report that observed a low concentration of Cho-containing compounds in these regions [20]. The sublobar white matter had relatively higher Cho/Cr, which may be due to a relatively higher Cho and lower Cr in the whiter matter than the gray matter [21]. Given that glutamate is the main component of Glx, Glx/Cr variations are thought to reflect variations in neuron and glutamate receptor density. Glutamate is mainly located in the synaptic vesicles of nerve terminals [22]. Glx/Cr variations in this study replicate the results of a previous report which shows higher Glx/Cr in the temporal lobe than the thalamus and no significant variations among the frontal, parietal, and temporal lobes [23]. Lower mI/Cr in the occipital lobe than the other major cerebral lobes is a new finding of this study. As mI is considered a glial marker, the lower mI/Cr in the occipital lobe and lentiform nucleus may be due to fewer glial cells in these regions, compared to the other major cerebral lobes. Supportive of this observation, a postmortem study has shown fewer astrocytes in the occipital lobe and basal ganglia than the other major cerebral lobes [24]. Noteworthily, a few previous studies have also shown lower prevalence of low-grade gliomas in the occipital lobe [25]. Although the mechanisms underlying this regional variation and glioma development may be more complex, a variation in glial cell population may also be implicated [26].
Evaluation of regional variation in metabolite ratios is incomplete without evaluating laterality. For several anatomical regions, the left side had higher NAA/Cr or Glx/Cr and lower Cho/Cr than the right side. The previous reports have also observed higher NAA/Cr in the left temporal, parietal, and occipital lobes; higher Cho/Cr in the gray matter of the right four major cerebral lobes; and higher Glx in the white matter of the temporal lobe [7,27]. Laterality in Cho/Cr and Glx/Cr in the sublobar white matter and that in Glx/Cr in the frontal and limbic lobes are the new observations of this study. These observations are thought to highlight the importance of such knowledge in diagnosing pathologies, as the unilateral increase in Cho/Cr and glutamate concentration has been reported in demyelinating, inflammatory, or autoimmune diseases [28,29]. Given the high percentage of right-handed participants in this study, these observations may reflect handedness-dependent lateralization in metabolite ratios. Since NAA and Glx reflect neuronal density, higher NAA/Cr and Glx/Cr in the left cerebral hemisphere may be reflective of higher neuronal density in the dominant hemisphere. Aligning with this, previous histological studies on Nissl-stained sections of human adult brains have reported a larger neuronal density in the left Broca’s area and superior frontal gyrus [30,31]. Hemispheric asymmetry in myelin content may have contributed to the observed Cho difference [32]. Thicker myelin sheath of axons in the left temporal lobe than the right side and the right-than-left asymmetry in g-ratio—which is the ratio of the axon’s diameter to that of axon and myelin [33]—have been reported in several white matter fasciculi [34,35]. It is considered unlikely that the observed laterality in metabolite ratios is artifactual, for example due to B0 or B1 field inhomogeneity. However, our investigation of the influence of scan conditions on laterality for the major metabolite ratios indicates that that this effect is small for most anatomical regions.
In several anatomical locations, women had lower Cho/Cr and mI/Cr than men. The observations of lower Cho/Cr in the frontal and temporal gray matter and lower mI in the parietal white matter and basal ganglia in women are in agreement with several previous reports [12,29,36,37]. To our knowledge, lower Cho/Cr in the insular lobe and lower mI/Cr in the occipital lobe in women have not been reported. The difference in Cho concentration may be sex hormone-related. Enhanced cholinergic enzyme activity and higher Cho uptake in the cholinergic neurons have been shown in female rats than male rats [38]. There also revealed an increase in Cho/Cr in women who underwent ovarian suppression [39]. Differences in astrocyte number may be attributable to the difference in mI concentration. A postmortem study has reported fewer astrocytes in the frontal, temporal, parietal, and occipital cortex in women than men [40].
This study also observed an age-related decrease in NAA/Cr, and decreased Glx/Cr or increased mI/Cr in several regions, including the frontal and limbic lobes. NAA/Cr and Glx/Cr alterations are thought to reflect an age-dependent neuronal and axonal loss. Age-related decrease in NAA/Cr and Glx concentrations has been reported in the major cerebral lobes and the parietal lobe, respectively [27]. A stronger degree of correlation of NAA/Cr with age than the other metabolite ratios may suggest that NAA/Cr is a sensitive index for age-related change. Age-related FA decrease in the four major cerebral lobes and sublobar white matter, suggestive of neuronal loss, has been reported by a diffusion tensor imaging (DTI) report [41]. From the observation of a stronger degree of correlation of NAA/Cr of the four major cerebral lobes and insular and limbic lobes than the other locations, it is possible that the predominant age-dependent neuronal and axonal loss occurs in these locations. As for mI, a previous study reported an age-related linear increase in mI concentration in the medial frontal gray matter in healthy volunteers aged 19 to 78 years [42]. Another study that employed immunohistochemical staining of the avidin-biotin complex reported a stable and moderate increase in astrocytic cell number with age in the human mid-frontal cortex [43].
A moderate but significant positive correlation between NAA/Cr and mI/Cr was observed in the insular lobe and thalamus, which is a new finding of this study. In addition, tendencies toward positive relationship were present in several anatomical regions. This relationship between NAA/Cr and mI/Cr may reflect an interaction between neurons and astrocytes. Astrocytes are important to maintain the structural integrity of neurons [44]. Perturbations of this relationship can be linked to disease states such as Alzheimer’s disease. A decrease in NAA/mI and its correlation with dementia test score have been reported in Alzheimer’s disease, according to a 7-year longitudinal study [45]. In addition to NAA/Cr, Glx/Cr also showed a moderate positive correlation with mI/Cr in the parietal lobe. This finding may reflect the importance of astrocytes in regulating neurotransmission through glutamate-glutamine cycling. Astrocytes take up glutamate from neurons and release glutamine to neurons in return [46]. A previous report has shown a positive correlation between Glx and mI in the cerebellar vermis of healthy volunteers [47].
There are several limitations in this study. First, the sample size is relatively small. There could be hidden differences in the major metabolite ratios left undiscovered due to type II error. Second, two of the 40 participants had to be excluded due to motion artifacts probably associated with long TA. Further TA reduction is desired for application in clinical settings. An immediate solution may be reducing the spatial resolution or increasing the parallel imaging acceleration factor. Third, several ROIs failed to meet the desired image quality (i.e., linewidth less than 13 Hz and Cramer-Rao lower bound less than 20% for NAA, Cho, and Cr and 30% for Glx and mI) possibly due to B0 field inhomogeneity, which led to the exclusion of the caudate nucleus, midbrain, pons, and cerebellum from further analyses. Although this study could not provide metabolite quantification for these anatomical regions, the average relative error for the other anatomical regions could be retained as low as 7.46 ± 1.82% for NAA/Cr, 9.99 ± 2.31% for Cho/Cr, 17.41 ± 3.04% for Glx/Cr, and 13.18 ± 3.73% for mI/Cr (Note: The average relative error was calculated from Cramer-Rao bounds and the correlation coefficient between the two metabolite concentrations of concern [48]). The lack of significant correlation between the average relative error and the regional metabolite ratios was also confirmed. Fourth, only metabolite ratios normalized by Cr, instead of absolute metabolite concentrations, were evaluated. As mentioned earlier, evaluating metabolite ratios has certain advantages. However, on rare occasions, the interpretation may be affected by diseases causing Cr changes [49]. Fifth, handedness information was not available in eight participants. This might have prevented us from drawing conclusions about the influence of handedness on laterality. Nevertheless, it is considered that this study provides sufficient information about laterality in right-handed individuals.

4. Materials and Methods

4.1. Participants

This prospective study was approved by our institutional review board. Written informed consent was obtained from all participants. Forty participants were recruited over a period of 21 months (July 2016 through March 2018). The inclusion criterion was age over 20 years, and the exclusion criteria were contraindications for MR imaging, history of diseases that might affect the central nervous system integrity (e.g., psychiatric diseases, diabetes, hypertension), gross abnormalities and white matter hyperintensities greater than scale 1 on the age-related white matter changes (ARWMC) scale [50], and visible motion artifacts on water-reference spectroscopic images. The review of conventional MR imaging sequences and water-reference spectroscopic images to exclude the abnormalities and artifacts was done by a radiologist with 21 years of experience in neuroimaging. Two volunteers were excluded for visible motion artifacts. Thus, a total of 38 participants (21 men and 17 women; age range = 22–68 years) were eligible for the study. Thirty of them were confirmed right-handed, according to the Edinburgh Handedness Inventory [51]. Information about handedness was not available for the other participants. Details about the participants are shown in Table 3.

4.2. MR Imaging

4.2.1. For Evaluation of the Distribution of Major Metabolite Ratios

MR imaging was performed using a 3T scanner (MAGNETOM Prisma, Siemens Healthineers, Erlangen, Germany) and a standard 64-channel head/neck coil. Padding and a fixation device were used to minimize head motion during acquisition.
Short TE WB-MRSI was acquired with a prototype volumetric spin-echo echo-planar spectroscopic imaging (EPSI) sequence, which employed two-dimensional phase encoding and echo-planar readout, frequency-selective water suppression, and lipid inversion nulling. The sequence details are as described in a previous report [52]. Regional saturation bands were also applied to suppress out-of-slice signals from areas such as the sinus and orbits. The sequence included a frequency reference measurement and adjustment that corrects for frequency drift throughout acquisition. The developer-recommended scan parameters were used, which included: repetition time (TR)/TE/inversion time (TI) = 1710/17/198 ms, flip angle (FA) = 73°, sampling of 50 × 50 × 18 k-space points over 280 × 280 ×180 mm3, and acquisition time (TA) = 16:49 min. The WB-MRSI acquisition also included a second dataset obtained in an interleaved manner without water suppression and 10° excitation and gradient-echo observation (TE = 3.8 ms). This second dataset provided a water reference signal (i.e., water MRSI) with identical spatial parameters as the metabolite MRSI, for normalization of the metabolite concentrations to institutional units [53].
In addition to WB-MRSI, a T1-weighted 3D magnetization-prepared rapid acquisition gradient echo (MPRAGE) sequence (TR/TE/TI = 1900/2.85/900 ms, FA = 9°, voxel size = 0.9 × 0.9 × 0.9 mm3, FOV = 230 × 230 mm2, matrix = 256 × 256, the number of excitation (NEX) = 1, TA = 4:50 min) was acquired. An axial fluid-attenuated inversion recovery (FLAIR) imaging sequence (TR/TE/TI = 12,000/115/2800 ms) and an axial proton density-weighted imaging (PDWI) sequence (TR/TE = 4000/12 ms) were also acquired to exclude gross abnormalities and white matter hyperintensities.

4.2.2. Test of the Influence of Scan Conditions on Laterality in Major Metabolite Ratios

To test if scan conditions affect laterality in regional metabolite ratios, short TE WB-MRSI was performed in supine and prone positions in a participant (27-year male). For this purpose, a standard 20-channel head/neck coil was used.

4.3. Data Analysis

The processing steps are summarized in Figure 4. The steps closely followed the report by Maudsley et al. [7], and included data resampling, spatial reconstruction, B0 correction, spatial registration, brain and scalp mask formation for lipid k-space extrapolation, spectral fitting, and signal normalization. The major metabolite maps, i.e., NAA, Cho, Cr, Glx, and mI, representing their peak areas, were reconstructed from the WB-MRSI raw data; the reconstruction relied on the default parameters of the Metabolic Imaging and Data Analysis System (MIDAS) software version 2.35 (the University of Miami, Miami, FL, USA), which runs on IDL version 8.4.1 (Exelis Visual Information Solutions, Boulder, CO, USA) [7]. Spectral analysis was performed with the MIDAS FITT program, which carries out automated spectral fitting with parametric modeling based on prior knowledge of the metabolite resonances [54]. As a measure of spectral quality control, voxels were excluded if the spectral fitting reported a linewidth (i.e., full width at half maximum of the metabolic peak’s height) greater than 13 Hz and Cramer-Rao lower bound greater than 20% for NAA, Cho, and Cr and 30% for Glx and mI [55,56]. Signal normalization of the reconstructed metabolite maps was based on the tissue water signal derived from the interleaved water-reference MRSI. The signal normalization procedure used tissue water as an internal reference, which has been widely used for single-voxel MRS measurements and also applied to MRSI. Knowledge of the tissue water distribution was obtained by convolution of the MRI-derived tissue segmentations to the spatial response function and by using the calculation of the water content for gray matter and white matter, which was calculated with the PDWI. This procedure then derived a 100% water-equivalent reference image that corrected for the variable receiver sensitivity function and normalized the metabolite images. The resultant individual metabolite images therefore represent the metabolite signal obtained following spectral fitting relative to a reference signal equivalent to that of 100% water at the same voxel location. The signal normalization procedure included an estimate on the water T1. The metabolite ratio maps, i.e., NAA/Cr, Cho/Cr, Glx/Cr, and mI/Cr, were then reconstructed from the corresponding metabolite maps, using ImageJ software version 1.51 (National Institutes of Health, Bethesda, MD, USA) [57]. These metabolite ratio maps were used in further data analyses.
The reconstruction of the metabolite ratio maps was followed by the spatial normalization of these maps and the corresponding MPRAGE images by using the default parameters of Statistical Parametric Mapping 12 (SPM12) software (Wellcome Trust Centre for Neuroimaging, London, UK), which runs on MATLAB version 7.9.0 R2009b (The MathWorks, Natick, MA, USA). Voxels other than the brain tissue were removed by applying a brain parenchyma mask, which was formed by segmenting the brain tissue (gray and white matter) voxels from the corresponding spatially normalized MPRAGE images (SPM12) and dilating for a single voxel to limit partial volume errors (ImageJ). Those voxels with too low or too high signal intensity were also discarded, as these voxels were considered to be affected by magnetic field inhomogeneity and imperfect magnetic field shimming [9]. This process was achieved by discarding voxels with signal intensity below 2.5% and above 97.5% of each map’s total signal intensity distribution (ImageJ).
Twenty-eight anatomical ROIs, which covered the entire brain, were selected from the WFU PickAtlas toolbox version 3.0.5 (Wake Forest University School of Medicine, Winston-Salem, NC, USA) [58] and applied on the resulting metabolite ratio maps. The exact anatomical location of each ROI is given in Figure 5. The mean metabolite ratios, including tissue-specific ratios, were then extracted for each ROI. Further evaluation of metabolite ratios’ distribution was limited to ROIs containing at least 50% of brain tissue; the evaluation used MRIcron version 1.0 (University of South Carolina, Columbia, SC, USA) [59]. This brain tissue fraction was chosen so as to include as many voxels as possible in the ROI while maximizing the sample size for each anatomical location. The gray and white matter volume ratio was recorded for each ROI.

4.4. Statistical Analysis

Unless otherwise specified, statistical analyses were performed by including both sides and sex groups to increase the number of voxels in each location and limit the number of comparisons (i.e., to limit type I error). Anatomical locations with the number of ROIs suitable for evaluation was less than ten (i.e., caudate nucleus, midbrain, pons, and cerebellar hemispheres) were discarded from further analysis, leaving 20 regions for evaluation.
The variations in metabolite ratios among anatomical regions were evaluated with repeated measures analysis of variance (ANOVA) and post hoc Bonferroni tests. The variations in metabolite ratios between laterality and in metabolite ratios between the two sides and sex groups were evaluated with two-sample t-tests and paired t-tests. The age-related changes in the regional metabolite ratios and their correlations were evaluated with Pearson’s product-moment correlation analyses. Age, BMI, sex, and the brain’s side were controlled in all analyses whenever appropriate, because these factors were reported to alter the metabolite concentrations [12,27]. p < 0.05 after correction for multiple comparisons was considered statistically significant. The difference in regional metabolite ratios between supine and prone positions, as evaluated by Bland–Altman analysis, was used to determine if scan conditions affected laterality in regional metabolite ratios. All statistical analyses were performed with Statistical Package for the Social Sciences (SPSS) software version 22 (IBM, New York, NY, USA).

5. Conclusions

This study evaluated the influence of anatomical location, sex, and age on the major metabolite ratios and their relationship by using short TE WB-MRSI. The metabolite ratios vary with anatomical location, sex, and age. Laterality in the regional metabolite ratios also exists. The interpretation of the regional metabolite ratios in a disease state in a clinical setting will require normative reference values. The results of this study may serve as a source for direct numerical comparison or for generating z-score maps. Finally, the major metabolite ratios are related, suggesting interactions among neural structures or neurotransmitters.

Supplementary Materials

The following supporting information can be downloaded at: https://www.mdpi.com/article/10.3390/metabo12060543/s1, Figure S1: The representative major metabolite ratio maps overlaid on water-reference spectroscopic images. The LUT scale indicates metabolite ratios; Figure S2: The Bland-Altman plots between the two head positions for (A) NAA)/Cr, (B) Cho)/Cr, (C) Glx/Cr, and (D) mI/Cr, in twenty anatomical regions. The solid line indicates the mean difference and the dash lines limit of agreement; Table S1: Tissue-specific mean regional metabolite ratios and their SD; Table S2: The mean regional metabolite ratios and their SD for right-handers; Table S3: The sex-specific regional metabolite ratios and their SD for each cerebral hemisphere.

Author Contributions

Conceptualization, K.K.T.; data curation, X.L. and K.K.T.; formal analysis, X.L. and K.K.T.; funding acquisition, K.A. and K.K.T.; investigation, X.L., K.A., Y.U. and K.K.T.; methodology, K.K.T.; software, S.S., A.A.M. and S.A.; resources, K.K.T.; supervision, K.K.T.; writing—original draft preparation, X.L.; writing—review and editing, X.L., K.A., S.S., A.A.M., Y.U., S.A. and K.K.T. All authors have read and agreed to the published version of the manuscript.

Funding

This work was supported by the Grants-in-Aid for scientific research by the Japan Society for Promotion of Science, grant number KAKENHI-15K01358 and -24591741, and the Global Center for Biomedical Science and Engineering, Hokkaido University. The EPSI acquisition and reconstruction development was supported by NIH grant R01EB016064.

Institutional Review Board Statement

This prospective study was approved by the Ethical Review Board for Medical Research of Hokkaido University Hospital, protocol number: 013-0211.

Informed Consent Statement

Written informed consent was obtained from all volunteers involved in the study.

Data Availability Statement

The data presented in this study are available on request from the corresponding author. The data are not publicly available due to patient confidentiality or ethical restrictions.

Conflicts of Interest

Yuta Urushibata is an employee of Siemens Healthcare K.K., and Sinyeob Ahn is an employee of Siemens Healthineers. The other authors declare no conflict of interest.

References

  1. Oz, G.; Alger, J.R.; Barker, P.B.; Bartha, R.; Bizzi, A.; Boesch, C.; Bolan, P.J.; Brindle, K.M.; Cudalbu, C.; Dinçer, A.; et al. Clinical proton MR spectroscopy in central nervous system disorders. Radiology 2014, 270, 658–679. [Google Scholar] [CrossRef] [Green Version]
  2. Castillo, M.; Kwock, L.; Green, C. MELAS syndrome: Imaging and proton MR spectroscopic findings. AJNR Am. J. Neuroradiol. 1995, 16, 233–239. [Google Scholar]
  3. Takahashi, S.; Oki, J.; Miyamoto, A.; Okuno, A. Proton magnetic resonance spectroscopy to study the metabolic changes in the brain of a patient with Leigh syndrome. Brain Dev. 1999, 21, 200–204. [Google Scholar] [CrossRef]
  4. Maudsley, A.A.; Andronesi, O.C.; Barker, P.B.; Bizzi, A.; Bogner, W.; Henning, A.; Nelson, S.J.; Posse, S.; Shungu, D.C.; Soher, B.J. Advanced magnetic resonance spectroscopic neuroimaging: Experts’ consensus recommendations. NMR Biomed. 2021, 34, e4309. [Google Scholar] [CrossRef]
  5. Bogner, W.; Otazo, R.; Henning, A. Accelerated MR spectroscopic imaging—A review of current and emerging techniques. NMR Biomed. 2021, 34, e4314. [Google Scholar] [CrossRef]
  6. Ebel, A.; Soher, B.J.; Maudsley, A.A. Assessment of 3D proton MR echo-planar spectroscopic imaging using automated spectral analysis. Magn. Reson. Med. 2001, 46, 1072–1078. [Google Scholar] [CrossRef]
  7. Maudsley, A.A.; Darkazanli, A.; Alger, J.R.; Hall, L.O.; Schuff, N.; Studholme, C.; Yu, Y.; Ebel, A.; Frew, A.; Goldgof, D.; et al. Comprehensive processing, display and analysis for in vivo MR spectroscopic imaging. NMR Biomed. 2006, 19, 492–503. [Google Scholar] [CrossRef] [Green Version]
  8. Zhang, Y.; Taub, E.; Salibi, N.; Uswatte, G.; Maudsley, A.A.; Sheriff, S.; Womble, B.; Mark, V.W.; Knight, D.C. Comparison of reproducibility of single voxel spectroscopy and whole-brain magnetic resonance spectroscopy imaging at 3T. NMR Biomed. 2018, 31, e3898. [Google Scholar] [CrossRef]
  9. Maudsley, A.A.; Govind, V.; Saigal, G.; Gold, S.G.; Harris, L.; Sheriff, S. Longitudinal MR Spectroscopy Shows Altered Metabolism in Traumatic Brain Injury. J. Neuroimaging 2017, 27, 562–569. [Google Scholar] [CrossRef]
  10. Verma, G.; Woo, J.H.; Chawla, S.; Wang, S.; Sheriff, S.; Elman, L.B.; McCluskey, L.F.; Grossman, M.; Melhem, E.R.; Maudsley, A.A.; et al. Whole-brain analysis of amyotrophic lateral sclerosis by using echo-planar spectroscopic imaging. Radiology 2013, 267, 851–857. [Google Scholar] [CrossRef] [Green Version]
  11. Maudsley, A.A.; Roy, B.; Gupta, R.K.; Sheriff, S.; Awasthi, R.; Gu, M.; Husain, N.; Mohakud, S.; Behari, S.; Spielman, D.M. Association of metabolite concentrations and water diffusivity in normal appearing brain tissue with glioma grade. J. Neuroimaging 2014, 24, 585–589. [Google Scholar] [CrossRef] [Green Version]
  12. Maudsley, A.A.; Govind, V.; Arheart, K.L. Associations of age; gender and body mass with 1H MR-observed brain metabolites and tissue distributions. NMR Biomed. 2012, 25, 580–593. [Google Scholar] [CrossRef] [Green Version]
  13. Mascalchi, M.; Brugnoli, R.; Guerrini, L.; Belli, G.; Nistri, M.; Politi, L.S.; Gavazzi, C.; Lolli, F.; Argenti, G.; Villari, N. Single-voxel long TE 1H -MR spectroscopy of the normal brainstem and cerebellum. J. Magn. Reson. Imaging 2002, 16, 532–537. [Google Scholar] [CrossRef]
  14. Goryawala, M.Z.; Sheriff, S.; Maudsley, A.A. Regional distributions of brain glutamate and glutamine in normal subjects. NMR Biomed. 2016, 29, 1108–1116. [Google Scholar] [CrossRef] [Green Version]
  15. Ding, X.Q.; Maudsley, A.A.; Sabati, M.; Sheriff, S.; Schmitz, B.; Schütze, M.; Bronzlik, P.; Kahl, K.G.; Lanfermann, H. Physiological neuronal decline in healthy aging human brain—An in vivo study with MRI and short echo-time whole-brain 1H MR spectroscopic imaging. Neuroimage 2016, 137, 45–51. [Google Scholar] [CrossRef] [Green Version]
  16. Kanowski, M.; Kaufmann, J.; Braun, J.; Bernarding, J.; Tempelmann, C. Quantitation of simulated short echo time 1H human brain spectra by LCModel and AMARES. Magn. Reson. Med. 2004, 51, 904–912. [Google Scholar] [CrossRef]
  17. Cheng, L.L.; Newell, K.; Mallory, A.E.; Hyman, B.T.; Gonzalez, R.G. Quantification of neurons in Alzheimer and control brains with ex vivo high resolution magic angle spinning proton magnetic resonance spectroscopy and stereology. Magn. Reson. Imaging 2002, 20, 527–533. [Google Scholar] [CrossRef]
  18. Hammen, T.; Hildebrandt, M.; Stadlbauer, A.; Doelken, M.; Engelhorn, T.; Kerling, F.; Kasper, B.; Romstoeck, J.; Ganslandt, O.; Nimsky, C. Non-invasive detection of hippocampal sclerosis: Correlation between metabolite alterations detected by 1H-MRS and neuropathology. NMR Biomed. 2008, 21, 545–552. [Google Scholar] [CrossRef]
  19. Pakkenberg, B. Total nerve cell number in neocortex in chronic schizophrenics and controls estimated using optical disectors. Biol. Psychiatry 1993, 34, 768–772. [Google Scholar] [CrossRef]
  20. Wegiel, J.; Flory, M.; Kuchna, I.; Nowicki, K.; Ma, S.Y.; Imaki, H.; Wegiel, J.; Cohen, I.L.; London, E.; Wisniewski, T. Stereological study of the neuronal number and volume of 38 brain subdivisions of subjects diagnosed with autism reveals significant alterations restricted to the striatum; amygdala and cerebellum. Acta. Neuropathol. Commun. 2014, 2, 141. [Google Scholar] [CrossRef] [Green Version]
  21. Nitsch, R.M.; Blusztajn, J.K.; Doyle, F.M.; Robitaille, Y.; Wurtman, R.J.; Growdon, J.H.; Kish, S.J. Phospholipid metabolite levels are altered in cerebral cortex of patients with dominantly inherited olivopontocerebellar atrophy. Neurosci. Lett. 1993, 161, 191–194. [Google Scholar] [CrossRef]
  22. Maudsley, A.A.; Domenig, C.; Govind, V.; Darkazanli, A.; Studholme, C.; Arheart, K.; Bloomer, C. Mapping of brain metabolite distributions by volumetric proton MR spectroscopic imaging (MRSI). Magn. Reson. Med. 2009, 61, 548–559. [Google Scholar] [CrossRef] [Green Version]
  23. Zhou, Y.; Danbolt, N.C. Glutamate as a neurotransmitter in the healthy brain. J. Neural Transm. 2014, 121, 799–817. [Google Scholar] [CrossRef] [Green Version]
  24. Minati, L.; Aquino, D.; Bruzzone, M.G.; Erbetta, A. Quantitation of normal metabolite concentrations in six brain regions by in-vivo 1H-MR spectroscopy. J. Med. Phys. 2010, 35, 154–163. [Google Scholar] [CrossRef]
  25. Karlsen, A.S.; Pakkenberg, B. Total numbers of neurons and glial cells in cortex and basal ganglia of aged brains with Down syndrome—A stereological study. Cereb. Cortex 2011, 21, 2519–2524. [Google Scholar] [CrossRef] [Green Version]
  26. Duffau, H.; Capelle, L. Preferential brain locations of low-grade gliomas. Cancer 2004, 100, 2622–2626. [Google Scholar] [CrossRef]
  27. Parisot, S.; Darlix, A.; Baumann, C.; Zouaoui, S.; Yordanova, Y.; Blonski, M.; Rigau, V.; Chemouny, S.; Taillandier, L.; Bauchet, L.; et al. A Probabilistic Atlas of Diffuse WHO Grade II Glioma Locations in the Brain. PLoS ONE 2016, 11, e0144200. [Google Scholar] [CrossRef] [Green Version]
  28. Tartaglia, M.C.; Narayanan, S.; De Stefano, N.; Arnaoutelis, R.; Antel, S.B.; Francis, S.J.; Santos, A.C.; Lapierre, Y.; Arnold, D.L. Choline is increased in pre-lesional normal appearing white matter in multiple sclerosis. J. Neurol. 2002, 249, 1382–1390. [Google Scholar] [CrossRef]
  29. Jia, Y.; Chen, Y.; Geng, K.; Cheng, Y.; Li, Y.; Qiu, J.; Huang, H.; Wang, R.; Zhang, Y.; Wu, R. Glutamate Chemical Exchange Saturation Transfer (GluCEST) Magnetic Resonance Imaging in Pre-clinical and Clinical Applications for Encephalitis. Front. Neurosci. 2020, 14, 750. [Google Scholar] [CrossRef]
  30. Uylings, H.B.; Jacobsen, A.M.; Zilles, K.; Amunts, K. Left-right asymmetry in volume and number of neurons in adult Broca’s area. Cortex 2006, 42, 652–658. [Google Scholar] [CrossRef]
  31. Cullen, T.J.; Walker, M.A.; Eastwood, S.L.; Esiri, M.M.; Harrison, P.J.; Crow, T.J. Anomalies of asymmetry of pyramidal cell density and structure in dorsolateral prefrontal cortex in schizophrenia. Br. J. Psychiatry 2006, 188, 26–31. [Google Scholar] [CrossRef] [PubMed]
  32. Pouwels, P.J.; Frahm, J. Regional metabolite concentrations in human brain as determined by quantitative localized proton MRS. Magn. Reson. Med. 1998, 39, 53–60. [Google Scholar] [CrossRef] [PubMed] [Green Version]
  33. Rushton, W.A.H. A theory of the effects of fibre size in medullated nerve. J. Physiol. 1951, 115, 101–122. [Google Scholar] [CrossRef] [PubMed]
  34. Anderson, B.; Southern, B.D.; Powers, R.E. Anatomic asymmetries of the posterior superior temporal lobes: A postmortem study. Neuropsychiatry Neuropsychol. Behav. Neurol. 1999, 12, 247–254. [Google Scholar]
  35. Cercignani, M.; Giulietti, G.; Dowell, N.G.; Gabel, M.; Broad, R.; Leigh, P.N.; Harrison, N.A.; Bozzali, M. Characterizing axonal myelination within the healthy population: A tract-by-tract mapping of effects of age and gender on the fiber g-ratio. Neurobiol. Aging 2017, 49, 109–118. [Google Scholar] [CrossRef] [Green Version]
  36. Chang, L.; Ernst, T.; Strickland, T.; Mehringer, C.M. Gender effects on persistent cerebral metabolite changes in the frontal lobes of abstinent cocaine users. Am. J. Psychiatry 1999, 156, 716–722. [Google Scholar]
  37. Cichocka, M.; Kozub, J.; Karcz, P.; Urbanik, A. Sex differences in brain metabolite concentrations in healthy children—Proton magnetic resonance spectroscopy study (1HMRS). Pol. J. Radiol. 2018, 83, e24–e31. [Google Scholar] [CrossRef]
  38. Loy, R.; Sheldon, R.A. Sexually dimorphic development of cholinergic enzymes in the rat septohippocampal system. Brain Res. 1987, 431, 156–160. [Google Scholar] [CrossRef]
  39. Craig, M.C.; Daly, E.M.; O’Gorman, R.; Rymer, J.; Lythgoe, D.; Ng, G.; Simmons, A.; Maki, P.M.; Murphy, D.G. Effects of acute ovarian hormone suppression on the human brain: An in vivo 1H MRS study. Psychoneuroendocrinology 2007, 32, 1128–1132. [Google Scholar] [CrossRef]
  40. Pelvig, D.P.; Pakkenberg, H.; Stark, A.K.; Pakkenberg, B. Neocortical glial cell numbers in human brains. Neurobiol. Aging 2008, 29, 1754–1762. [Google Scholar] [CrossRef]
  41. Bhagat, Y.A.; Beaulieu, C. Diffusion anisotropy in subcortical white matter and cortical gray matter: Changes with aging and the role of CSF-suppression. J. Magn. Reson. Imaging 2004, 20, 216–227. [Google Scholar] [CrossRef] [PubMed]
  42. Chang, L.; Ernst, T.; Poland, R.E.; Jenden, D.J. In vivo proton magnetic resonance spectroscopy of the normal aging human brain. Life Sci. 1996, 58, 2049–2056. [Google Scholar] [CrossRef]
  43. Hansen, L.A.; Armstrong, D.M.; Terry, R.D. An immunohistochemical quantification of fibrous astrocytes in the aging human cerebral cortex. Neurobiol. Aging 1987, 8, 1–6. [Google Scholar] [CrossRef]
  44. Schitine, C.; Nogaroli, L.; Costa, M.R.; Hedin-Pereira, C. Astrocyte heterogeneity in the brain: From development to disease. Front. Cell. Neurosci. 2015, 9, 76. [Google Scholar] [CrossRef] [PubMed] [Green Version]
  45. Waragai, M.; Moriya, M.; Nojo, T. Decreased N-Acetyl Aspartate/Myo-Inositol Ratio in the Posterior Cingulate Cortex Shown by Magnetic Resonance Spectroscopy May Be One of the Risk Markers of Preclinical Alzheimer′s Disease: A 7-Year Follow-Up Study. J. Alzheimers Dis. 2017, 60, 1411–1427. [Google Scholar] [PubMed] [Green Version]
  46. Mahmoud, S.; Gharagozloo, M.; Simard, C.; Gris, D. Astrocytes Maintain Glutamate Homeostasis in the CNS by Controlling the Balance between Glutamate Uptake and Release. Cells 2019, 8, 184. [Google Scholar] [CrossRef] [Green Version]
  47. Waddell, K.W.; Zanjanipour, P.; Pradhan, S.; Xu, L.; Welch, E.B.; Joers, J.M.; Martin, P.R.; Avison, M.J.; Gore, J.C. Anterior cingulate and cerebellar GABA and Glu correlations measured by ¹H J-difference spectroscopy. Magn. Reson. Imaging 2011, 29, 19–24. [Google Scholar] [CrossRef] [Green Version]
  48. Jiru, F.; Skoch, A.; Klose, U.; Grodd, W.; Hajek, M. Error images for spectroscopic imaging by LCModel using Cramer–Rao bounds. Magn. Reson. Mater. Phy. 2006, 19, 1–14. [Google Scholar] [CrossRef]
  49. Guerrini, L.; Belli, G.; Mazzoni, L.; Foresti, S.; Ginestroni, A.; Della Nave, R.; Diciotti, S.; Mascalchi, M. Impact of cerebrospinal fluid contamination on brain metabolites evaluation with 1H-MR spectroscopy: A single voxel study of the cerebellar vermis in patients with degenerative ataxias. J. Magn. Reson. Imaging 2009, 30, 11–17. [Google Scholar]
  50. Wahlund, L.O.; Barkhof, F.; Fazekas, F.; Bronge, L.; Augustin, M.; Sjögren, M.; Wallin, A.; Ader, H.; Leys, D.; Pantoni, L.; et al. A new rating scale for age-related white matter changes applicable to MRI and CT. Stroke 2001, 32, 1318–1322. [Google Scholar] [CrossRef]
  51. Oldfield, R.C. The assessment and analysis of handedness: The Edinburgh inventory. Neuropsychologia 1971, 9, 97–113. [Google Scholar] [CrossRef]
  52. Ebel, A.; Maudsley, A.A. Detection and correction of frequency instabilities for volumetric 1H echo-planar spectroscopic imaging. Magn. Reson. Med. 2005, 53, 459–465. [Google Scholar] [CrossRef] [PubMed]
  53. Maudsley, A.A.; Gupta, R.K.; Stoyanova, R.; Parra, N.A.; Roy, B.; Sheriff, S.; Hussain, N.; Behari, S. Mapping of glycine distributions in gliomas. AJNR Am. J. Neuroradiol. 2014, 35, S31–S36. [Google Scholar] [CrossRef] [Green Version]
  54. Soher, B.J.; Young, K.; Govindaraju, V.; Maudsley, A.A. Automated spectral analysis III: Application to in vivo proton MR spectroscopy and spectroscopic imaging. Magn. Reson. Med. 1998, 40, 822–831. [Google Scholar] [CrossRef] [PubMed]
  55. Birch, R.; Peet, A.C.; Dehghani, H.; Wilson, M. Influence of macromolecule baseline on 1H MR spectroscopic imaging reproducibility. Magn. Reson. Med. 2017, 77, 34–43. [Google Scholar] [CrossRef] [Green Version]
  56. Maghsudi, H.; Schmitz, B.; Maudsley, A.A.; Sheriff, S.; Bronzlik, P.; Schütze, M.; Lanfermann, H.; Ding, X. Regional Metabolite Concentrations in Aging Human Brain: Comparison of Short-TE Whole Brain MR Spectroscopic Imaging and Single Voxel Spectroscopy at 3T. Clin. Neuroradiol. 2020, 30, 251–261. [Google Scholar] [CrossRef]
  57. Schneider, C.A.; Rasband, W.S.; Eliceiri, K.W. NIH Image to ImageJ: 25 years of image analysis. Nat. Methods 2012, 9, 671–675. [Google Scholar] [CrossRef]
  58. Maldjian, J.A.; Laurienti, P.J.; Kraft, R.A.; Burdette, J.H. An automated method for neuroanatomic and cytoarchitectonic atlas-based interrogation of fMRI data sets. Neuroimage 2003, 19, 1233–1239. [Google Scholar] [CrossRef]
  59. Rorden, C.; Karnath, H.O.; Bonilha, L. Improving lesion-symptom mapping. J. Cogn. Neurosci. 2007, 19, 1081–1088. [Google Scholar] [CrossRef]
Figure 1. The representative single-voxel spectra obtained from the left (A) temporal lobe, (B) occipital lobe, (C) thalamus, and (D) sublobar white matter of WB-MRSI of a 25-year-old male. The voxel locations are shown on the T1-weighted 3D magnetization-prepared rapid acquisition gradient echo (MPRAGE) images.
Metabolites 12 00543 g001
Figure 2. Box and whisker plots showing the region-specific mean (cross mark), median, interquartile range, minimum, and maximum for (A) N-acetyl acetylaspartate (NAA)/creatine (Cr), (B) choline (Cho)/Cr, (C) glutamate + glutamine (Glx)/Cr, and (D) myoinositol (mI)/Cr (Abbreviations: frontal = frontal lobe, parietal = parietal lobe, temporal = temporal lobe, occipital = occipital lobe, insula = insular lobe, limbic = limbic lobe, lentiform = lentiform nucleus, sublobar = sublobar white matter). Each symbol indicates pairs with statistical significance (i.e., p < 0.05 following correction for multiple comparisons). For example, as indicated by ▶, NAA/Cr is different among the frontal lobe, limbic lobe, and lentiform nucleus.
Metabolites 12 00543 g002
Figure 3. Scatterplots showing the correlation between (A) glutamate + glutamine (Glx)/creatine (Cr) and myoinositol (mI)/Cr of the parietal lobe (r = 0.348), (B) N-acetylaspartate (NAA)/Cr and mI/Cr of the insular lobe (r = 0.490). The straight line indicates the mean and the dotted lines 95% confidence interval. These correlations are statistically significant at corrected p < 0.05 (Pearson’s product-moment correlation analyses).
Metabolites 12 00543 g003
Figure 4. Scheme summarizing the processing steps (Abbreviations: CRLB = Cramer-Rao lower bound, MRSI = Magnetic resonance spectroscopic imaging, MPRAGE = T1-weighted 3D magnetization-prepared rapid acquisition gradient echo, NAA = N-acetylaspartate, Cho = choline, Cr = creatine, Glx = glutamate + glutamine, mI = myoinositol).
Metabolites 12 00543 g004
Figure 5. The outline of the regions of interest (ROIs) overlaid on the axial sections of normalized T1-weighted 3D magnetization-prepared rapid acquisition gradient echo (MPRAGE) images of a participant. Each ROI is placed on the either side of the frontal lobe (1); parietal lobe (2); temporal lobe (3); occipital lobe (4); insular lobe (5); limbic lobe (6); caudate (7) and lentiform nuclei (8); claustrum (9); thalamus (10); sublobar white matter (11) containing corpus callosum, external and internal capsules, and periventricular white matter; midbrain (12); pons (13); and cerebellar hemispheres (14).
Metabolites 12 00543 g005
Table 1. The mean regional metabolite ratios and their standard deviation (SD) for each side of the brain and sex.
Metabolite RatioFrontal LobeParietal LobeTemporal LobeOccipital LobeInsulaLimbic LobeClaustrumLentiform NucleusThalamusSublobar White Matter
NAA/CrLeft1.140 ± 0.086 *1.188 ± 0.093 *1.221 ± 0.085 *1.240 ± 0.0611.165 ± 0.0951.173 ± 0.0921.040 ± 0.0931.021 ± 0.0761.096 ± 0.081.212 ± 0.071
Right1.123 ± 0.077 *1.163 ± 0.079 *1.166 ± 0.086 *1.232 ± 0.0701.158 ± 0.0991.175 ± 0.0851.034 ± 0.1101.043 ± 0.0711.068 ± 0.0871.204 ± 0.083
Women1.122 ± 0.0691.173 ± 0.0641.198 ± 0.0711.226 ± 0.0801.158 ± 0.0951.164 ± 0.0691.019 ± 0.1111.015 ± 0.0961.063 ± 0.1051.208 ± 0.087
Men1.147 ± 0.0691.181 ± 0.0621.198 ± 0.0721.214 ± 0.0761.157 ± 0.0931.182 ± 0.0661.052 ± 0.1111.037 ± 0.1021.082 ± 0.1041.194 ± 0.088
Cho/CrLeft0.218 ± 0.0220.184 ± 0.020 *0.207 ± 0.017 *0.166 ± 0.015 *0.230 ± 0.022 *0.234 ± 0.026 *0.246 ± 0.0220.217 ± 0.0200.239 ± 0.0220.253 ± 0.020 *
Right0.217 ± 0.0210.193 ± 0.020 *0.219 ± 0.018 *0.178 ± 0.016 *0.234 ± 0.021 *0.239 ± 0.025 *0.248 ± 0.0240.216 ± 0.0190.245 ± 0.0230.257 ± 0.020 *
Women0.207 ± 0.025 ^0.185 ± 0.0210.202 ± 0.020 ^0.167 ± 0.0180.223 ± 0.026 ^0.229 ± 0.0290.236 ± 0.0330.214 ± 0.0300.237 ± 0.0280.250 ± 0.025
Men0.227 ± 0.025 ^0.193 ± 0.0210.220 ± 0.020 ^0.176 ± 0.0170.242 ± 0.026 ^0.244 ± 0.0270.255 ± 0.0330.227 ± 0.0320.249 ± 0.0280.262 ± 0.025
Glx/CrLeft0.832 ± 0.075 *0.834 ± 0.0960.875 ± 0.061 *0.783 ± 0.0710.845 ± 0.0860.843 ± 0.067 *0.865 ± 0.100 *0.770 ± 0.1030.752 ± 0.1120.785 ± 0.054 *
Right0.783 ± 0.070 *0.807 ± 0.0680.810 ± 0.054 *0.778 ± 0.0660.813 ± 0.0830.808 ± 0.085 *0.806 ± 0.114 *0.717 ± 0.1230.738 ± 0.0860.747 ± 0.055 *
Women0.816 ± 0.0860.825 ± 0.0820.859 ± 0.0710.759 ± 0.0850.828 ± 0.1110.842 ± 0.0870.829 ± 0.1450.714 ± 0.1510.726 ± 0.1220.771 ± 0.071
Men0.804 ± 0.0860.813 ± 0.0790.822 ± 0.0720.783 ± 0.0800.813 ± 0.1080.810 ± 0.0840.827 ± 0.1460.753 ± 0.1530.759 ± 0.1200.751 ± 0.071
mI/CrLeft0.790 ± 0.0820.723 ± 0.0700.775 ± 0.0550.661 ± 0.0890.781 ± 0.0880.834 ± 0.0860.785 ± 0.1020.678 ± 0.0840.733 ± 0.1500.848 ± 0.082
Right0.781 ± 0.0740.736 ± 0.0660.785 ± 0.0510.680 ± 0.0980.791 ± 0.0660.820 ± 0.0880.799 ± 0.0920.673 ± 0.0710.770 ± 0.1380.842 ± 0.086
Women0.785 ± 0.0850.700 ± 0.078 ^0.770 ± 0.0630.605 ± 0.110 ^0.784 ± 0.0910.817 ± 0.0960.769 ± 0.1310.629 ± 0.112 ^0.772 ± 0.1790.822 ± 0.101
Men0.782 ± 0.0850.750 ± 0.076 ^0.785 ± 0.0620.709 ± 0.106 ^0.802 ± 0.0900.838 ± 0.0920.826 ± 0.1320.757 ± 0.115 ^0.754 ± 0.1780.865 ± 0.102
Note: * and ^ indicate statistical significance between the two sides and sex groups, respectively (p < 0.05). NAA = N-acetylaspartate, Cho = choline, Cr = creatine, Glx = glutamate + glutamine, mI = myoinositol.
Table 2. The relationship between major metabolite ratios of each anatomical location and age.
Metabolite RatioFrontal LobeParietal LobeTemporal LobeOccipital LobeInsulaLimbic LobeClaustrumLentiform NucleusThalamusSublobar White Matter
NAA/CrAll−0.741−0.791−0.819−0.668−0.605−0.780−0.512−0.359−0.471−0.568
Left−0.757−0.821−0.820−0.672−0.574−0.783−0.502−0.421−0.111−0.429
Right−0.719−0.766−0.888−0.620−0.628−0.779−0.528−0.326−0.644−0.639
Women−0.794−0.783−0.832−0.636−0.437−0.834−0.329−0.266−0.342−0.484
Men−0.757−0.817−0.839−0.696−0.686−0.776−0.637−0.450−0.587−0.677
Cho/CrAll0.0510.2140.2340.1950.2180.2450.0520.1220.1160.154
Left−0.0080.1230.3480.2410.1760.1810.0520.2520.1080.128
Right0.1060.3070.0620.2250.2290.2930.0490.0330.0990.156
Women−0.542−0.313−0.1520.318−0.249−0.402−0.313−0.287−0.054−0.148
Men0.4530.4940.5270.2760.4760.5100.2730.6620.3310.501
Glx/CrAll−0.262−0.532−0.262−0.259−0.143−0.422−0.0230.004−0.092−0.248
Left−0.196−0.577−0.293−0.4270.094−0.4800.144−0.068−0.2570.017
Right−0.316−0.503−0.2430.139−0.291−0.364−0.1240.0840.122−0.360
Women0.001−0.319−0.0510.035−0.102−0.1140.0830.2960.1250.102
Men−0.461−0.634−0.510−0.360−0.186−0.588−0.091−0.207−0.195−0.646
mI/CrAll0.4170.1400.380−0.2690.4520.3850.316−0.1580.2980.145
Left0.4280.0550.414−0.1850.3100.4310.426−0.3940.3140.164
Right0.4170.2320.357−0.3540.5750.3550.2360.1770.2700.136
Women0.4960.3060.105−0.0300.4010.4610.3560.3050.2460.392
Men0.5030.0830.566−0.1750.5430.4120.4500.0540.4430.188
Note: numbers in bold indicate statistical significance (corrected p < 0.05). NAA = N-acetylaspartate, Cho = choline, Cr = creatine, Glx = glutamate + glutamine, mI = myoinositol.
Table 3. Details about the participants.
SexTotal Number
(Right-Handers)
Mean Age ± SD
(Range)
Mean Years of Education ± SD
(Range)
Mean BMI ± SD
All 38 (30)35.11 ± 11.97 (22–68) years17.88 ± 2.12 (16–22) years22.76 ± 2.92
Women17 (14)34.29 ± 9.76 (22–52) years18.00 ± 2.35 (16–22) years20.90 ± 2.42
Men21 (16)35.76 ± 13.71 (22–68) years17.75 ± 1.98 (16–22) years24.27 ± 2.39
Note: SD = standard deviation, BMI = body mass index.
Publisher’s Note: MDPI stays neutral with regard to jurisdictional claims in published maps and institutional affiliations.

