
Human Serum Metabolites as Potential Mediators from Type 2 Diabetes and Obesity to COVID-19 Severity and Susceptibility: Evidence from Mendelian Randomization Study

 , , , and
Abstract
:1. Introduction
2. Results
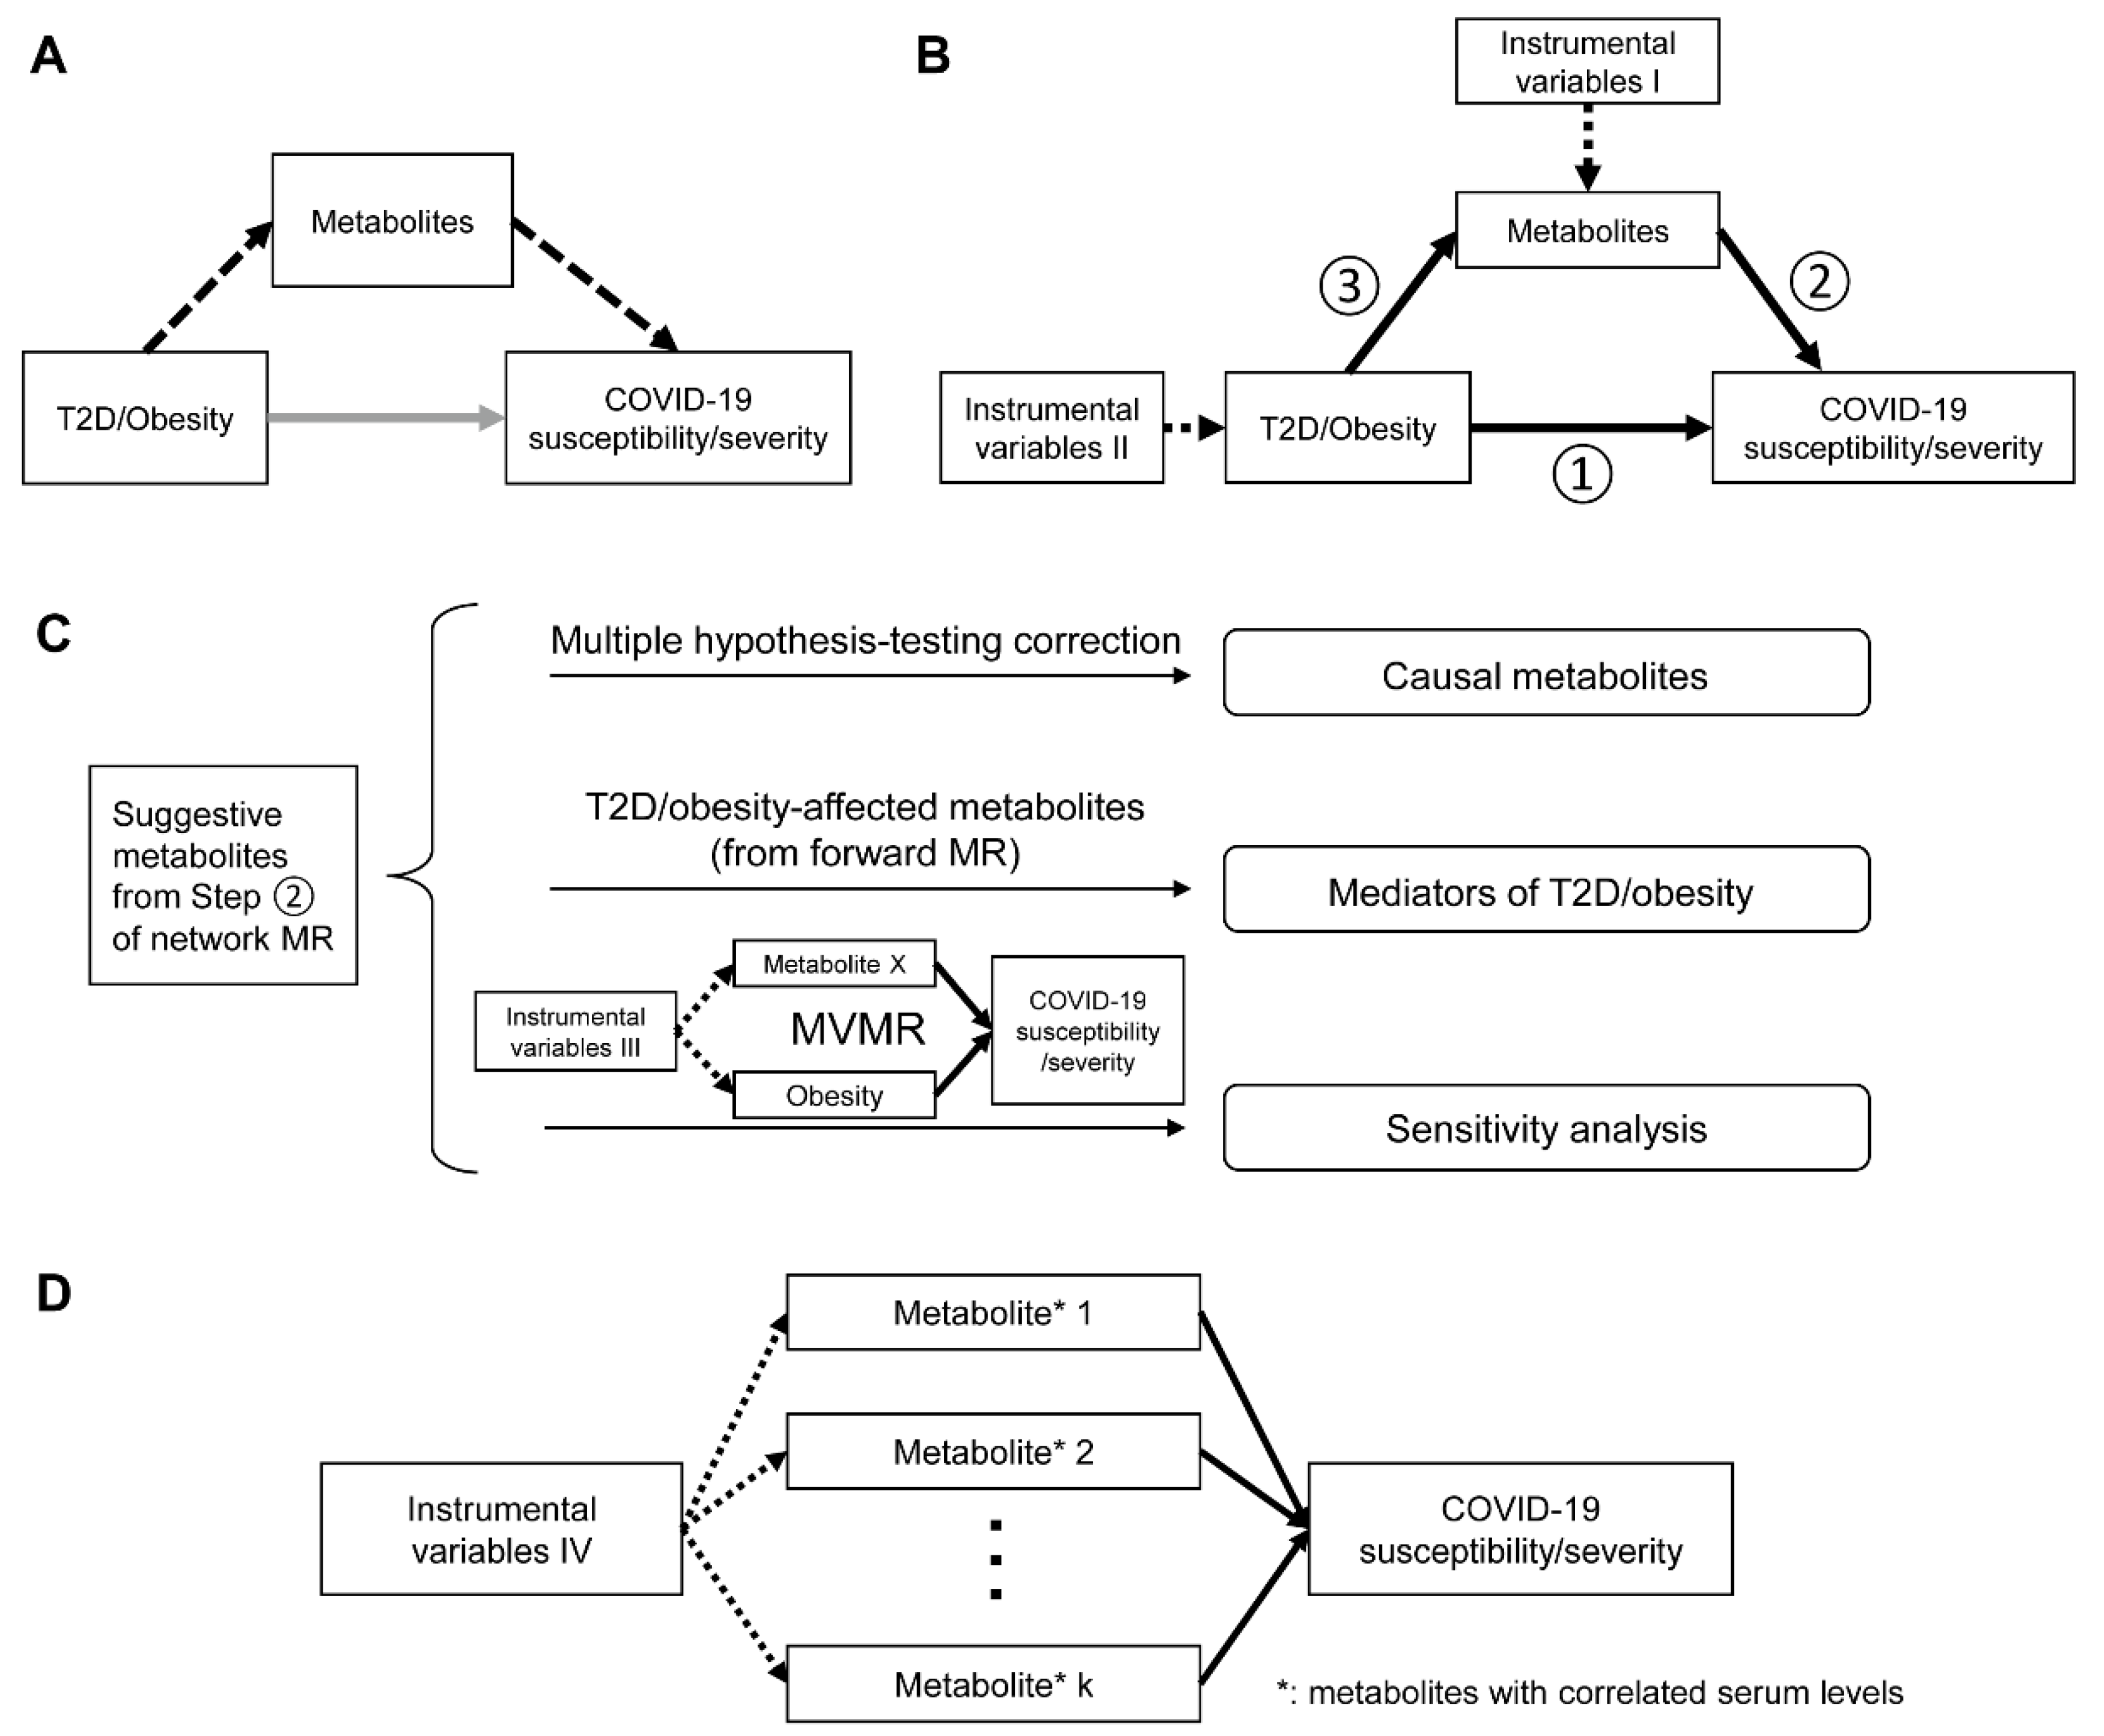
2.1. Study Overview
2.2. Instrument Strength
2.3. Network MR Step 1: Causal Associations between T2D, Glycemic Traits, Adiposity Traits and COVID-19 Phenotypes
2.4. Network MR Step 2: Causal Association between Human Serum Metabolites and COVID-19 Phenotypes
2.5. Network MR Step 3: Causal Relationship between COVID-19-Related Metabolites and T2D/Obesity
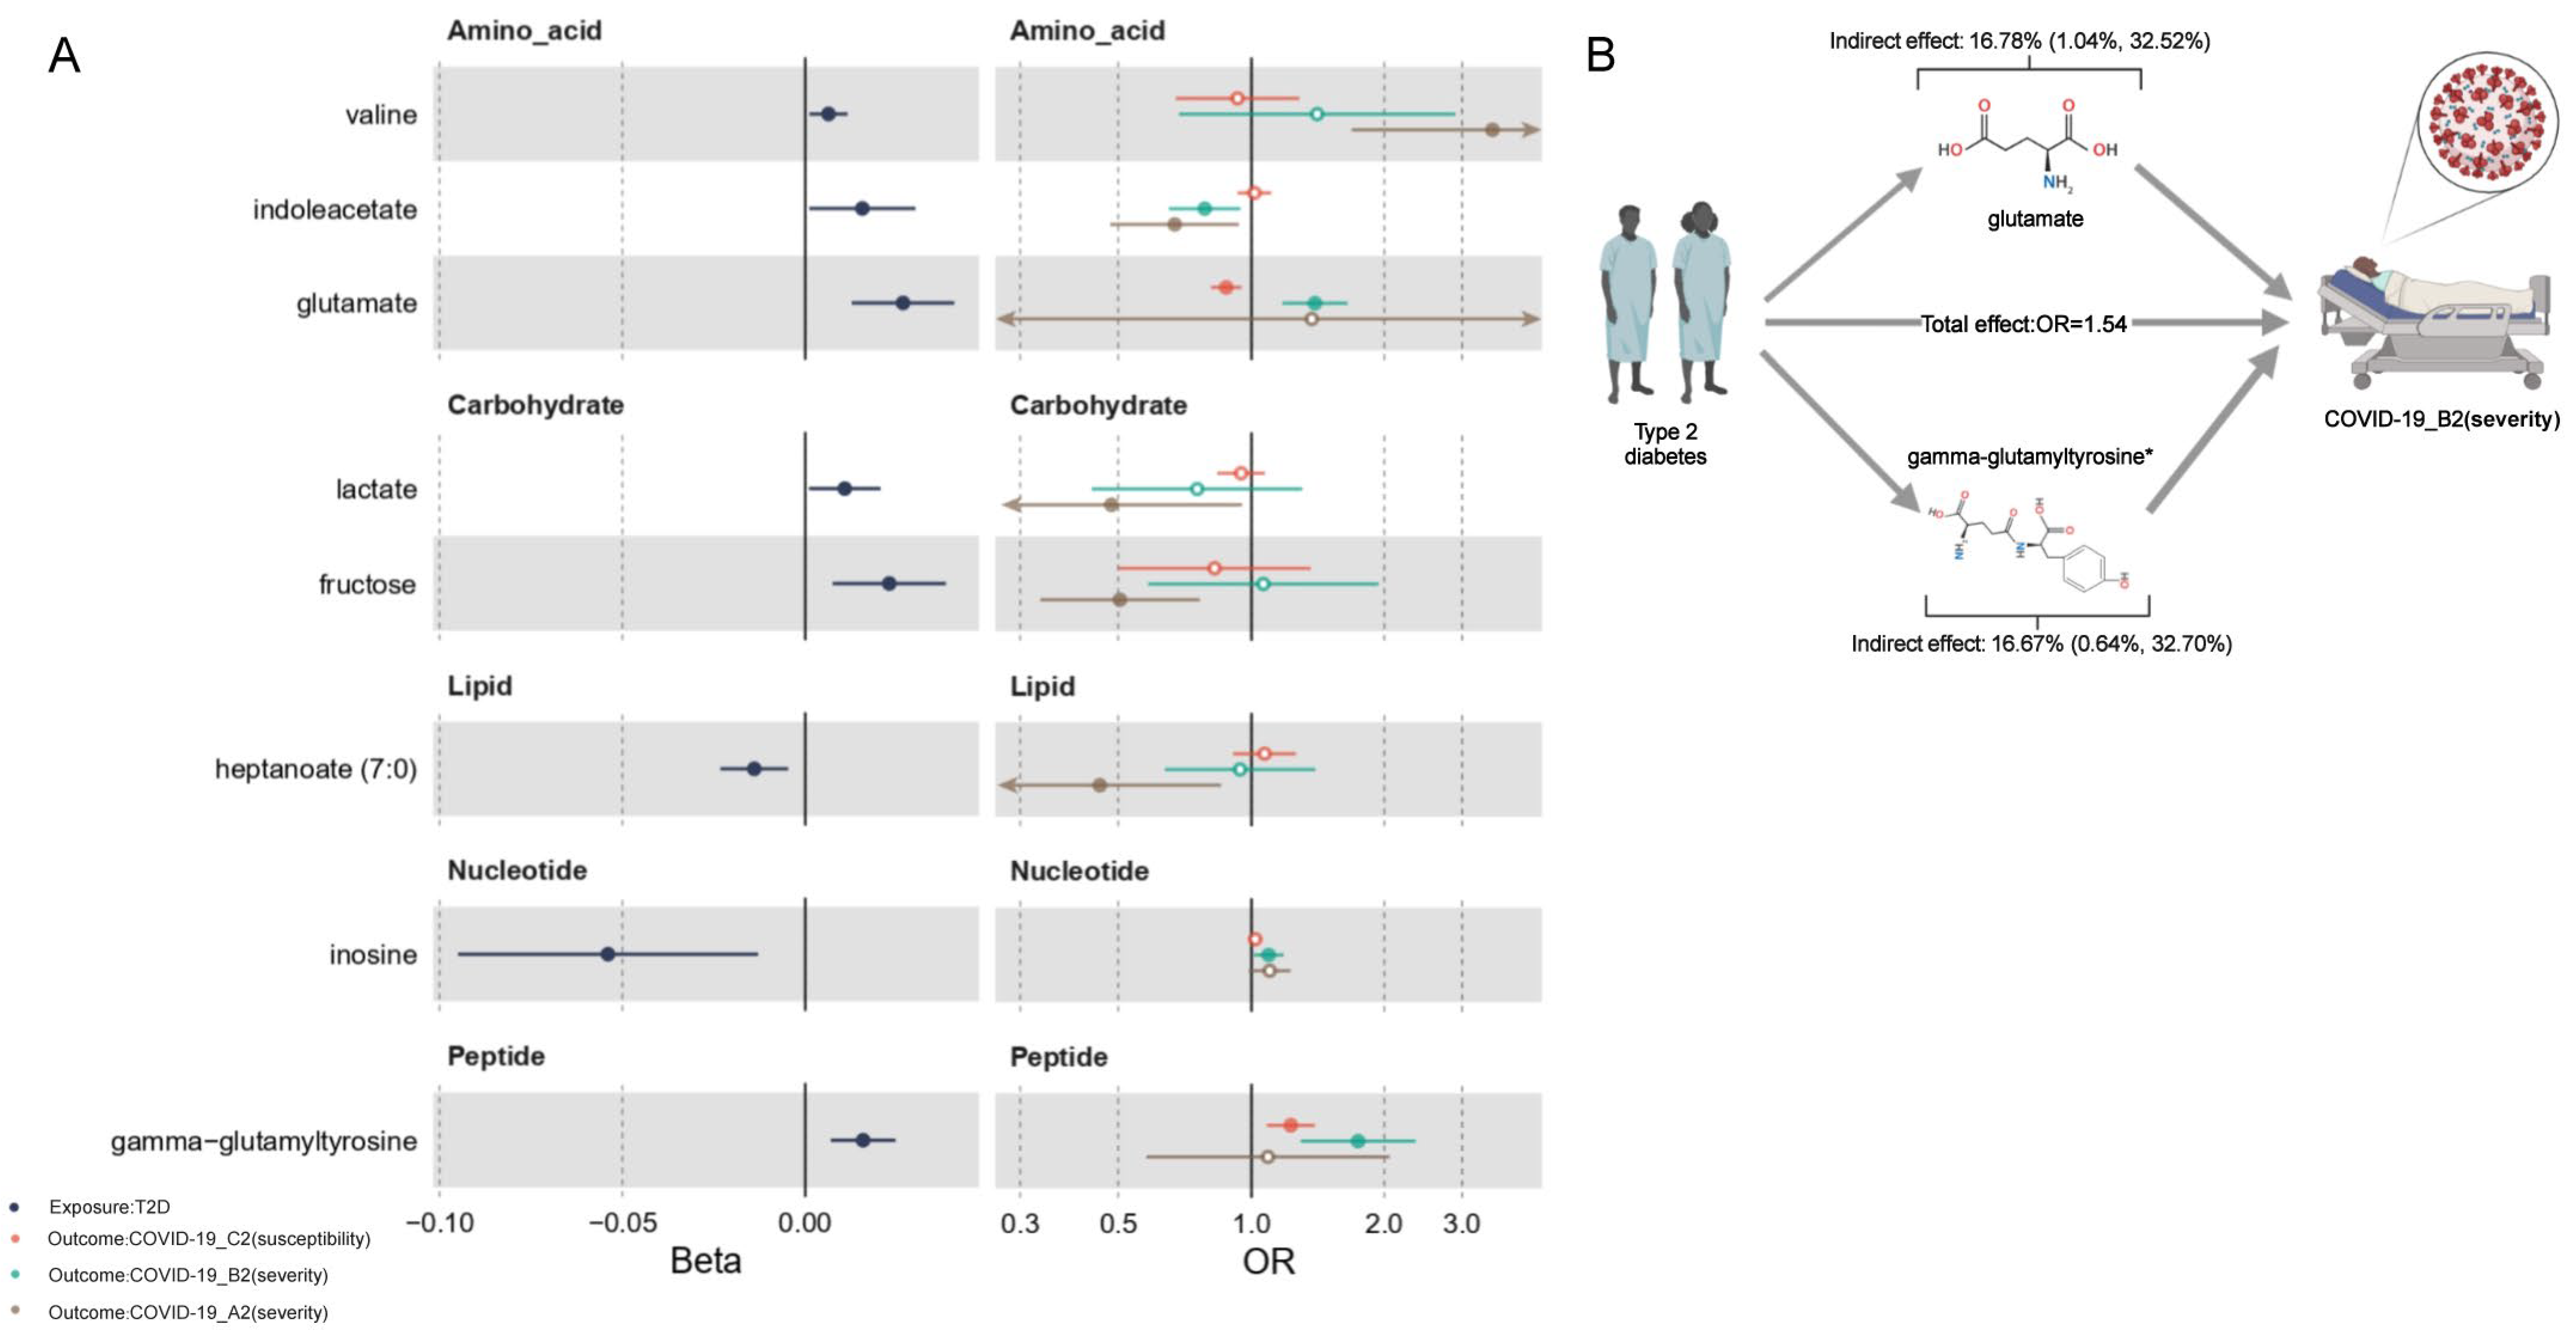
2.6. Mediation Effects of Metabolites
2.7. Reassessment on the Independent Causal Effects of Metabolites and COVID-19 Phenotypes
3. Discussion
4. Materials and Methods
4.1. Data Sources
4.1.1. Outcomes
4.1.2. Exposure and Mediators
4.2. Genetic Instruments
4.3. Statistical Analysis
4.3.1. Two-Sample Mendelian Randomization
4.3.2. Pathway Analysis
4.3.3. Mediation Analysis
4.3.4. Multivariable Mendelian Randomization (MVMR)
Supplementary Materials
Author Contributions
Funding
Institutional Review Board Statement
Informed Consent Statement
Data Availability Statement
Acknowledgments
Conflicts of Interest
References
- Johns Hopkins Coronavirus Resource Center. COVID-19 Map. 2021. Available online: https://coronavirus.jhu.edu/map.html (accessed on 30 March 2022).
- Guan, W.-J.; Ni, Z.-Y.; Hu, Y.; Liang, W.-H.; Ou, C.-Q.; He, J.-X.; Liu, L.; Shan, H.; Lei, C.L.; Hui, D.S.C.; et al. Clinical Characteristics of Coronavirus Disease 2019 in China. N. Engl. J. Med. 2020, 382, 1708–1720. Available online: http://www.ncbi.nlm.nih.gov/pubmed/32109013 (accessed on 30 March 2022). [CrossRef] [PubMed]
- Aung, N.; Khanji, M.Y.; Munroe, P.B.; Petersen, S.E. Causal Inference for Genetic Obesity, Cardiometabolic Profile and COVID-19 Susceptibility: A Mendelian Randomization Study. Front. Genet. 2020, 11, 586308. [Google Scholar] [CrossRef]
- Leong, A.; Cole, J.B.; Brenner, L.N.; Meigs, J.B.; Florez, J.C.; Mercader, J.M. Cardiometabolic risk factors for COVID-19 susceptibility and severity: A Mendelian randomization analysis. PLoS Med. 2021, 18, e1003553. [Google Scholar] [CrossRef] [PubMed]
- Lim, S.; Bae, J.H.; Kwon, H.S.; Nauck, M.A. COVID-19 and diabetes mellitus: From pathophysiology to clinical management. Nat. Rev. Endocrinol. 2020, 17, 11–30. [Google Scholar] [CrossRef] [PubMed]
- Ponsford, M.J.; Gkatzionis, A.; Walker, V.M.; Grant, A.J.; Wootton, R.E.; Moore, L.S.P.; Fatumo, S.; Mason, A.; Zuber, V.; Willer, C.; et al. Cardiometabolic Traits, Sepsis, and Severe COVID-19: A Mendelian Randomization Investigation. Circulation 2020, 142, 1791–1793. [Google Scholar] [CrossRef]
- Zhang, K.; Dong, S.-S.; Guo, Y.; Tang, S.-H.; Wu, H.; Yao, S.; Wang, P.-F.; Xue, H.-Z.; Huang, W.; Ding, J.; et al. Causal Associations Between Blood Lipids and COVID-19 Risk: A Two-Sample Mendelian Randomization Study. Arterioscler. Thromb. Vasc. Biol. 2021, 41, 2802–2810. [Google Scholar] [CrossRef] [PubMed]
- Muniyappa, R.; Gubbi, S. COVID-19 Pandemic, Corona Viruses, and Diabetes Mellitus. Am. J. Physiol. Endocrinol. Metab. 2020, 318, E736–E741. Available online: http://www.ncbi.nlm.nih.gov/pubmed/32228322 (accessed on 30 March 2022). [CrossRef] [Green Version]
- Gregg, E.W.; Sophiea, M.K.; Weldegiorgis, M. Diabetes and COVID-19: Population Impact 18 Months into the Pandemic. Diabetes Care. 2021, 44, 1916–1923. [Google Scholar] [CrossRef]
- Jia, J.; Dou, P.; Gao, M.; Kong, X.; Li, C.; Liu, Z.; Huang, T. Assessment of causal direction between gut microbiota-dependent metabolites and cardiometabolic health: A bidirectional mendelian randomization analysis. Diabetes 2019, 68, 1747–1755. [Google Scholar] [CrossRef]
- Shen, B.; Yi, X.; Sun, Y.; Bi, X.; Du, J.; Zhang, C.; Quan, S.; Zhang, F.; Sun, R.; Qian, L.; et al. Proteomic and Metabolomic Characterization of COVID-19 Patient Sera. Cell 2020, 182, 59–72.e15. [Google Scholar] [CrossRef]
- Shi, D.; Yan, R.; Lv, L.; Jiang, H.; Lu, Y.; Sheng, J.; Quan, S.; Zhang, F.; Sun, R.; Qian, L.; et al. The serum metabolome of COVID-19 patients is distinctive and predictive. Metabolism 2021, 118, 154739. [Google Scholar] [CrossRef] [PubMed]
- Haycock, P.C.; Burgess, S.; Wade, K.H.; Bowden, J.; Relton, C.; Davey Smith, G. Best (but oft-forgotten) practices: The design, analysis, and interpretation of Mendelian randomization studies. Am. J. Clin. Nutr. 2016, 103, 965–978. Available online: https://academic.oup.com/ajcn/article/103/4/965/4564602 (accessed on 30 March 2022). [CrossRef] [PubMed] [Green Version]
- Au Yeung, S.L.; Zhao, J.V.; Schooling, C.M. Evaluation of glycemic traits in susceptibility to COVID-19 risk: A Mendelian randomization study. BMC Med. 2021, 19, 72. [Google Scholar] [CrossRef] [PubMed]
- Fujiogi, M.; Camargo, C.A.; Raita, Y.; Bochkov, Y.A.; Gern, J.E.; Mansbach, J.M.; Piedra, P.A.; Hasegawa, K. Respiratory viruses are associated with serum metabolome among infants hospitalized for bronchiolitis: A multicenter study. Pediatr. Allergy Immunol. 2020, 31, 755–766. [Google Scholar] [CrossRef]
- Cyr, M.; Lepage, Y.; Blais, C.; Gervais, N.; Cugno, M.; Rouleau, J.L.; Adam, A. Bradykinin and des-Arg9-bradykinin metabolic pathways and kinetics of activation of human plasma. Am. J. Physiol. Circ. Physiol. 2001, 281, H275–H283. [Google Scholar] [CrossRef]
- Peckham, H.; de Gruijter, N.M.; Raine, C.; Radziszewska, A.; Ciurtin, C.; Wedderburn, L.R.; Rosser, E.C.; Webb, K.; Deakin, C.T. Male sex identified by global COVID-19 meta-analysis as a risk factor for death and ITU admission. Nat. Commun. 2020, 11, 6317. [Google Scholar] [CrossRef]
- Flanagan, J.L.; Simmons, P.A.; Vehige, J.; Willcox, M.D.; Garrett, Q. Role of carnitine in disease. Nutr. Metab. 2010, 7, 30. Available online: http://www.nutritionandmetabolism.com/content/7/1/30 (accessed on 30 March 2022). [CrossRef] [Green Version]
- Nagoor Meeran, M.F.; Javed, H.; Al Taee, H.; Azimullah, S.; Ojha, S.K. Pharmacological properties and molecular mechanisms of thymol: Prospects for its therapeutic potential and pharmaceutical development. Front. Pharmacol. 2017, 8, 380. [Google Scholar] [CrossRef] [Green Version]
- Lustgarten, M.S.; Price, L.L.; Chalé, A.; Fielding, R.A. Metabolites related to gut bacterial metabolism, peroxisome proliferator-activated receptor-alpha activation, and insulin sensitivity are associated with physical function in functionally-limited older adults. Aging Cell 2014, 13, 918–925. [Google Scholar] [CrossRef] [Green Version]
- Palmer, N.D.; Okut, H.; Hsu, F.C.; Ng, M.C.; Chen, Y.D.I.; Goodarzi, M.O.; Taylor, K.D.; Norris, J.M.; Lorenzo, C.; Rotter, J.I.; et al. Metabolomics Identifies Distinctive Metabolite Signatures for Measures of Glucose Homeostasis: The Insulin Resistance Atherosclerosis Family Study (IRAS-FS). J. Clin. Endocrinol. Metab. 2018, 103, 1877–1888. [Google Scholar] [CrossRef]
- Kim, H.W. Metabolomic Approaches to Investigate the Effect of Metformin: An Overview. Int. J. Mol. Sci. 2021, 22, 10275. [Google Scholar] [CrossRef] [PubMed]
- Lynch, C.J.; Adams, S.H. Branched-chain amino acids in metabolic signalling and insulin resistance. Nat. Rev. Endocrinol. 2014, 10, 723–736. [Google Scholar] [CrossRef] [PubMed] [Green Version]
- Carter, A.R.; Sanderson, E.; Hammerton, G.; Richmond, R.C.; Davey Smith, G.; Heron, J.; Taylor, A.E.; Davies, N.M.; Howe, L.D. Mendelian randomisation for mediation analysis: Current methods and challenges for implementation. Eur. J. Epidemiol. 2021, 36, 465–478. [Google Scholar] [CrossRef] [PubMed]
- Zheng, Y.; Hu, F.B.; Ruiz-Canela, M.; Clish, C.B.; Dennis, C.; Salas-Salvado, J.; Hruby, A.; Liang, L.; Toledo, E.; Corella, D.; et al. Metabolites of Glutamate Metabolism Are Associated with Incident Cardiovascular Events in the PREDIMED PREvención con DIeta MEDiterránea (PREDIMED) Trial. J. Am. Heart Assoc. 2016, 5, e003755. [Google Scholar] [CrossRef] [PubMed] [Green Version]
- Burgess, S.; Thompson, S.G. Bias in causal estimates from Mendelian randomization studies with weak instruments. Stat. Med. 2011, 30, 1312–1323. Available online: http://doi.wiley.com/10.1002/sim.4197 (accessed on 30 March 2022). [CrossRef] [PubMed]
- Shin, S.Y.; Fauman, E.B.; Petersen, A.K.; Krumsiek, J.; Santos, R.; Huang, J.; Arnold, M.; Erte, I.; Forgetta, V.; Yang, T.P.; et al. An atlas of genetic influences on human blood metabolites. Nat. Genet. 2014, 46, 543–550. [Google Scholar] [CrossRef] [PubMed] [Green Version]
- Mahajan, A.; Taliun, D.; Thurner, M.; Robertson, N.R.; Torres, J.M.; Rayner, N.W.; Payne, A.J.; Steinthorsdottir, V.; Scott, R.A.; Grarup, N.; et al. Fine-mapping type 2 diabetes loci to single-variant resolution using high-density imputation and islet-specific epigenome maps. Nat. Genet. 2018, 50, 1505–1513. [Google Scholar] [CrossRef] [PubMed] [Green Version]
- Spracklen, C.N.; Shi, J.; Vadlamudi, S.; Wu, Y.; Zou, M.; Raulerson, C.K.; Davis, J.P.; Zeynalzadeh, M.; Jackson, K.; Yuan, W.; et al. Identification and functional analysis of glycemic trait loci in the China Health and Nutrition Survey. PLoS Genet. 2018, 14, e1007275. [Google Scholar] [CrossRef]
- Locke, A.E.; Kahali, B.; Berndt, S.I.; Justice, A.E.; Pers, T.H.; Day, F.R.; Powell, C.; Vedantam, S.; Buchkovich, M.L.; Yang, J.; et al. Genetic studies of body mass index yield new insights for obesity biology. Nature 2015, 518, 197–206. [Google Scholar] [CrossRef] [Green Version]
- Hemani, G.; Tilling, K.; Davey Smith, G. Orienting the causal relationship between imprecisely measured traits using GWAS summary data. PLoS Genet. 2017, 13, e1007081. [Google Scholar]
- Sanderson, E.; Windmeijer, F. A weak instrument F-test in linear IV models with multiple endogenous variables. J. Econom. 2016, 190, 212–221. [Google Scholar] [CrossRef] [PubMed] [Green Version]
- Sanderson, E.; Spiller, W.; Bowden, J. Testing and correcting for weak and pleiotropic instruments in two-sample multivariable Mendelian randomization. Stat. Med. 2021, 40, 5434–5452. [Google Scholar] [CrossRef]
- Burgess, S.; Davey Smith, G.; Davies, N.M.; Dudbridge, F.; Gill, D.; Glymour, M.M.; Hartwig, F.P.; Holmes, M.V.; Minelli, C.; Relton, C.L.; et al. Guidelines for performing Mendelian randomization investigations. Wellcome Open Res. 2020, 4, 186. [Google Scholar] [CrossRef] [PubMed]
- Hemani, G.; Zheng, J.; Elsworth, B.; Wade, K.H.; Haberland, V.; Baird, D.; Laurin, C.; Burgess, S.; Bowden, J.; Langdon, R.; et al. The MR-base platform supports systematic causal inference across the human phenome. eLife 2018, 7, e34408. [Google Scholar] [CrossRef]
- Verbanck, M.; Chen, C.Y.; Neale, B.; Do, R. Detection of widespread horizontal pleiotropy in causal relationships inferred from Mendelian randomization between complex traits and diseases. Nat. Genet. 2018, 50, 693–698. Available online: https://www.nature.com/articles/s41588-018-0099-7 (accessed on 30 March 2022). [CrossRef]
- Teumer, A. Common Methods for Performing Mendelian Randomization. Front. Cardiovasc. Med. 2018, 5, 51. [Google Scholar] [CrossRef]
- Liu, X.; Li, C.; Sun, X.; Yu, Y.; Si, S.; Hou, L.; Yan, R.; Yu, Y.; Li, M.; Li, H.; et al. Genetically predicted insomnia in relation to 14 cardiovascular conditions and 17 cardiometabolic risk factors: A mendelian randomization study. J. Am. Heart Assoc. 2021, 10, e020187. [Google Scholar] [CrossRef]
- Burgess, S. MendelianRandomization v0.3.0: An R package for performing Mendelian randomization analyses using summarized data. Int. J. Epidemiol. 2017, 46, 1734–1739. [Google Scholar]


| Methods | Role of Metabolites | Directed Acyclic Graph | Evidence Level | COVID-19 A2 (Severity) | COVID-19 B2 (Severity) | COVID-19 C2 (Susceptibility) |
|---|---|---|---|---|---|---|
| Univariable MR analysis (after Bonferroni correction) | Causative (risk *) |  | Credible | 2-stearoylglycerophosphocholine (↑) | bradykinin-des-arg(9) (↑) decanoylcarnitine (↑) thymol sulfate (↑) | — |
| Suggestive | — | 1-heptadecanoylglycerophosphocholine (↑) glutamate (↑) | — | |||
| Mediation analysis | Mediator of T2D (direction †) |  | Strong | — | gamma-glutamyltyrosine (+) | — |
| Moderate | — | glutamate (+) | glutamate (−) | |||
| Potential | valine (+) indoleacetate (−) lactate (−) fructose (−) heptanoate (7:0) (+) | Indoleacetate (−) Inosine (−) | gamma-glutamyltyrosine (+) | |||
| Mediator of BMI (direction †) |  | Strong | valine (+) | gamma-glutamyltyrosine (+) | — | |
| Moderate | heptanoate (7:0) (+) alpha-glutamyltyrosine (−) | glutamate (+) | glutamate (−) alpha-glutamyltyrosine (−) gamma-glutamyltyrosine (+) | |||
| Potential | 1-oleoylglycerophosphocholine (+) taurochenodeoxycholate (−) 2-stearoylglycerophosphocholine (−) 2−tetradecenoyl carnitine (−) | bradykinin-des-arg(9) (+) xanthine (−) | phenol sulfate (−) propionylcarnitine (−) 2−tetradecenoyl carnitine (−) quinate (−) |
| Mediator | Category | Exposure | Outcome | BetaXM | ORMY | ORXY | Betaindirect (95% CI) | Proportion Mediated (95% CI) | MVMR |
|---|---|---|---|---|---|---|---|---|---|
| valine | Amino acid | T2D | A2 | 0.006 | 3.516 | 1.057 | 0.008 (−0.001, 0.016) | — * | F † |
| indoleacetate | Amino acid | T2D | A2 | 0.016 | 0.670 | −0.006 (−0.014, 0.002) | — | F | |
| lactate | Carbohydrate | T2D | A2 | 0.011 | 0.483 | −0.008 (−0.018, 0.002) | — | F | |
| fructose | Carbohydrate | T2D | A2 | 0.023 | 0.505 | −0.016 (−0.03, −0.001) | — | F | |
| heptanoate (7:0) | Lipid | T2D | A2 | −0.014 | 0.454 | 0.011 (−0.001, 0.022) | — | F | |
| indoleacetate | Amino acid | T2D | B2 | 0.016 | 0.784 | 1.054 | −0.004 (−0.008, 0.001) | — | F |
| glutamate | Amino acid | T2D | B2 | 0.027 | 1.393 | 0.009 (0.002, 0.015) | 16.78% (1.04%, 32.52%) | F | |
| inosine | Nucleotide | T2D | B2 | −0.054 | 1.094 | −0.005 (−0.01, 0.001) | — | F | |
| gamma-glutamyltyrosine | Peptide | T2D | B2 | 0.016 | 1.745 | 0.009 (0.002, 0.016) | 16.67% (0.64%, 32.70%) | P | |
| glutamate | Amino acid | T2D | C2 | 0.027 | 0.877 | 1.019 | −0.004 (−0.006, −0.001) | — | P |
| gamma-glutamyltyrosine | Peptide | T2D | C2 | 0.016 | 1.228 | 0.003 (0.001, 0.006) | 17.63% (−2.83%, 38.08%) | F |
| Mediator | Category | Exposure | Outcome | BetaXM | ORMY | ORXY | Betaindirect (95% CI) | Proportion Mediated (95% CI) | MVMR |
|---|---|---|---|---|---|---|---|---|---|
| valine | Amino acid | BMI | A2 | 0.014 | 3.516 | 1.698 | 0.018 (0.001, 0.036) | 4.19% (0.03%, 8.35%) | P † |
| heptanoate (7:0) | Lipid | BMI | A2 | −0.031 | 0.454 | 0.025 (0.001, 0.049) | 5.75% (0.20%, 11.30%) | F | |
| taurochenodeoxycholate | Lipid | BMI | A2 | 0.076 | 0.78 | −0.019 (−0.043, 0.005) | — * | F | |
| 1-oleoylglycerophosphocholine | Lipid | BMI | A2 | −0.031 | 0.486 | 0.022 (−0.003, 0.048) | — | F | |
| 2-stearoylglycerophosphocholine | Lipid | BMI | A2 | −0.038 | 2.145 | −0.029 (−0.058, 0.001) | — | F | |
| 2-tetradecenoyl carnitine | Lipid | BMI | A2 | −0.046 | 1.441 | −0.017 (−0.038, 0.004) | — | F | |
| alpha-glutamyltyrosine | Peptide | BMI | A2 | −0.063 | 1.322 | −0.018 (−0.039, 0.004) | — | P | |
| glutamate | Amino acid | BMI | B2 | 0.051 | 1.393 | 1.523 | 0.017 (0.002, 0.031) | 4.59% (0.69%, 8.49%) | F |
| xanthine | Nucleotide | BMI | B2 | 0.039 | 0.671 | −0.016 (−0.033, 0.001) | — | F | |
| gamma-glutamyltyrosine | Peptide | BMI | B2 | 0.041 | 1.745 | 0.023 (0.006, 0.04) | 6.32% (1.76%, 10.87%) | P | |
| bradykinin, des-arg(9) | Peptide | BMI | B2 | 0.109 | 1.087 | 0.009 (−0.001, 0.019) | — | F | |
| glutamate | Amino acid | BMI | C2 | 0.051 | 0.877 | 1.141 | −0.007 (−0.013, −0.00016) | — | P |
| phenol sulfate | Amino acid | BMI | C2 | −0.06 | 1.08 | −0.005 (−0.01, 0.001) | — | F | |
| propionylcarnitine | Lipid | BMI | C2 | 0.026 | 0.896 | −0.003 (−0.006, 0.001) | — | F | |
| 2-tetradecenoyl carnitine | Lipid | BMI | C2 | −0.046 | 1.058 | −0.003 (−0.006, 0.001) | — | F | |
| gamma-glutamyltyrosine | Peptide | BMI | C2 | 0.041 | 1.228 | 0.009 (0.002, 0.015) | 6.62% (1.52%, 11.71%) | F | |
| alpha-glutamyltyrosine | Peptide | BMI | C2 | −0.063 | 1.093 | −0.006 (−0.012, 0.001) | — | P | |
| quinate | Xenobiotics | BMI | C2 | 0.123 | 0.956 | −0.006 (−0.012, 0.001) | — | F |
Publisher’s Note: MDPI stays neutral with regard to jurisdictional claims in published maps and institutional affiliations. |
© 2022 by the authors. Licensee MDPI, Basel, Switzerland. This article is an open access article distributed under the terms and conditions of the Creative Commons Attribution (CC BY) license (https://creativecommons.org/licenses/by/4.0/).
Share and Cite
Huang, C.; Shi, M.; Wu, H.; Luk, A.O.Y.; Chan, J.C.N.; Ma, R.C.W. Human Serum Metabolites as Potential Mediators from Type 2 Diabetes and Obesity to COVID-19 Severity and Susceptibility: Evidence from Mendelian Randomization Study. Metabolites 2022, 12, 598. https://doi.org/10.3390/metabo12070598
Huang C, Shi M, Wu H, Luk AOY, Chan JCN, Ma RCW. Human Serum Metabolites as Potential Mediators from Type 2 Diabetes and Obesity to COVID-19 Severity and Susceptibility: Evidence from Mendelian Randomization Study. Metabolites. 2022; 12(7):598. https://doi.org/10.3390/metabo12070598
Chicago/Turabian StyleHuang, Chuiguo, Mai Shi, Hongjiang Wu, Andrea O. Y. Luk, Juliana C. N. Chan, and Ronald C. W. Ma. 2022. "Human Serum Metabolites as Potential Mediators from Type 2 Diabetes and Obesity to COVID-19 Severity and Susceptibility: Evidence from Mendelian Randomization Study" Metabolites 12, no. 7: 598. https://doi.org/10.3390/metabo12070598
APA StyleHuang, C., Shi, M., Wu, H., Luk, A. O. Y., Chan, J. C. N., & Ma, R. C. W. (2022). Human Serum Metabolites as Potential Mediators from Type 2 Diabetes and Obesity to COVID-19 Severity and Susceptibility: Evidence from Mendelian Randomization Study. Metabolites, 12(7), 598. https://doi.org/10.3390/metabo12070598