Article

PPAR Signaling Maintains Metabolic Homeostasis under Hypothermia in Freshwater Drum (Aplodinotus grunniens)

1
Freshwater Fisheries Research Center, Chinese Academy of Fishery Sciences, No. 9 Shanshui East Road, Wuxi 214081, China
2
Wuxi Fisheries College, Nanjing Agricultural University, Wuxi 214081, China
*
Authors to whom correspondence should be addressed.
Metabolites 2023, 13(1), 102; https://doi.org/10.3390/metabo13010102
Submission received: 5 December 2022 / Revised: 2 January 2023 / Accepted: 5 January 2023 / Published: 8 January 2023
(This article belongs to the Section Animal Metabolism)

Abstract

:
Aplodinotus grunniens, known as freshwater drum, is a kind of eurythermal freshwater fish that is widely distributed in North America. In 2019, our research group reached a milestone on its artificial breeding and cultivation and have investigated its physiological adaption to the environment, providing a breakthrough and prospects for aquaculture. However, its adaptability and metabolic homeostasis to hypothermia is not fully understood. In this experiment, cold stress was conducted at 18 °C (LT18) and 10 °C (LT10) with 25 °C as control (Con) for 8 days to explore the effects of short-term hypothermia on the physiology and metabolism of freshwater drum. From the results, the level of free essential amino acids in LT18 and LT10 decreased significantly after 2 days cold stress compared with Con. Furthermore, plasma total triglyceride (TG) content and lipase (LPS) activity were decreased at LT10 for 2d. With RNA-seq in the liver, metabolic-related signaling, especially amino acid synthesis and lipid metabolism, was inhibited by hypothermia. Specifically, the PPAR signaling pathway is correlated with the inhibition of lipid and amino acid metabolism induced by hypothermia. These data confirmed that PPAR signaling maintains lipid and amino acid metabolic homeostasis during cold stress. These results give a theoretical foundation for hypothermia resistance in the area of metabolic homeostasis for freshwater drum.

1. Introduction

Fish are ectotherms, and temperature alternations in the living surroundings have many physiological effects on fish feeding, growth, development, immunity, and reproduction [1,2,3]. Different fish species have their own suitable living temperature. Extreme low or high temperature will directly or indirectly affect physiological function and biochemical metabolism [4,5]. Therein, cold stress is a kind of severe stress that could induce physiological dysfunction and even mortality for aquatic animals [6,7].
Studies on fish have suggested that temperature is interrelated to their digestion and metabolism of fish. Under low temperature, glycogen catabolism expedites in fish tissues to meet the increasing energy requirements of resistance to cold stress [8]. At the same time, cold stress leads to an increase in cortisol level, which is released into the blood, thereby inducing gluconeogenesis and significantly increasing the plasma glucose concentration [9]. However, as the cold stress continues, plasma glucose will gradually drop below normal levels [10]. Under low-temperature stimulation, the biological enzyme activity will also be affected, resulting in reduced cellular metabolism and protein synthesis [11]. Additionally, low-temperature stress can increase the activity of stearoyl-CoA desaturase (SCD) and Δ6 and Δ9 fatty acid desaturase, resulting in changes in fatty acid composition [12,13], and promoting the synthesis of unsaturated fatty acids in fish [14,15]. Moreover, it can also increase the level of oxidized lipids, which could induce the dysfunction of the cell [16].
Peroxisome proliferators-activated receptors (PPARs) are a class of nuclear receptor transcription factors which are ligand activated. PPARs play a significant role in adipogenesis, lipid metabolism, as well as maintenance of metabolic homeostasis, and are associated with a variety of metabolic related diseases, such as diabetes [17,18,19]. Additionally, it has been reported that PPARα also plays a role in in regulating the oxidation of fatty acids and amino acid metabolism [20,21].
Aplodinotus grunniens is widely distributed in North America, as far north as the Great Lakes region of Canada and as far south as Mexico and Guatemala [22]. Such latitude distribution indicates A. grunniens could adapt to a wide range of water temperatures. A. grunniens has a high edible proportion due to its thick back muscles, and the flesh is delicious, nutritious, abundant in protein, amino acids, and fatty acids [23,24,25]. These visible characteristics show the potential of A. grunniens cultivation to offer high-quality proteins to human beings [23,24,25]. Nevertheless, there are still limited resources in domestication, aquaculture, and management practices for the species. Furthermore, little scientific research has been carried out in this area. For these promising foregrounds, we introduced the A. grunniens larval form USA in 2016 and made a significant breakthrough on the artificial breeding and cultivation three years later. This offered a great progress and prospect for aquaculture [25,26,27]. It is reported that A. grunniens can reproduce under temperatures between 22 °C and 30 °C [28]. Early studies also showed that the minimum value of its survival temperature may be close to 1 °C [29] and its growth tends to be inhibited when exposed to living surroundings under 14 °C [30]. Additionally, our previous study reveals that hypothermia dysregulated glucose and lipid metabolism, and thereby induced antioxidant and immune dysfunction under 10 °C in freshwater drum. However, the underlying mechanism of hypothermia on metabolic homeostasis remains unclear. Based on our previous experiments and fish samples, 10 °C (LT10) was selected as the minimum temperature, and 18 °C (LT18) was selected as the intermediate temperature, while 25 °C was selected as the control temperature (Con) in this study. The impact of hypothermia on the physiological metabolism of freshwater drum were studied by comparing the differences of plasma biochemical parameters index, fatty acid and amino acid composition, as well as the high-throughput RNA-seq among different groups. Moreover, PPARs signaling undertaken in metabolic homeostasis was emphatically explored. Our study will provide a basis for the adaptation of freshwater drum to adverse temperatures in future production and breeding.

2. Materials and Methods

2.1. Ethics Statement

Our experiment was approved by the Animal Care and Use Committee of Nanjing Agricultural University (Nanjing, China). All animal procedures were carried out in terms of the Guideline for the Care and Use of Laboratory Animals in China.

2.2. Experimental Animals and Rearing Conditions

The experiment was conducted in Wuxi Fisheries College of Nanjing Agricultural University. The second-generation larvae were used as the laboratory fish. First-generation parents were introduced from the USA by Freshwater Fisheries Research Center, Chinese Academy of Fishery Sciences (Wuxi, China). The fish were raised in an indoor circulating water system, in which temperature could be adjusted according to experimental requirements (specifications for φ 820 × 700 mm). The initial body weights of the freshwater drums were 20.88 ± 2.75 g. They were stochastically assigned to nine tanks with a density of 50 fish per tank (Figure 1). The fish fed with fresh shrimp (3–5% body weight) daily were acclimated for 7 days under 25 °C prior to the experiment. After acclimation, the water temperature was set to 25 ± 1 °C, 18 ± 1 °C, and 10 ± 1 °C, and each treatment had three replicates. The normal water temperature was 25 ± 1 °C, while 18 °C and 10 °C were gradually achieved by the temperature-adjustable circulating water system within 6 h. Dissolved oxygen was >6 mg/L, pH was 7.2–7.8, and NH3 was <0.05 mg/L throughout the whole experiment.

2.3. Sample Collection

We conducted the experiments by collecting samples, respectively at 8 h, 1 day, 2 days, 4 days, and 8 days after cold stress. At each time point, nine fish (3 fish per tank) were selected to collect samples at random. We used MS-222 (0.1 g/L) to anaesthetize the fish (Figure 1). Before extracting the plasma (centrifugation at 5000 rpm for 10 min at 4 °C), blood samples were taken from caudal vein. For the purpose of composition and digestive enzyme activity index measurement, the plasma samples were stored at −80 °C. Similarly, the liver tissue was immediately frozen with liquid nitrogen and kept at −80 °C for the following analyses. The fish were dissected and sampled on ice.

2.4. Crude Fat Content Determination

Nine fish per group (3 fish per tank) for each time point were taken for body composition determination (Figure 1). Crude fat content (CFC) of each fish was determined by Soxhlet extraction method [31].

2.5. Plasma Biochemical Parameters Index Analysis

Plasma samples were used to measure TC (total cholesterol,), TG (total triglyceride), LPS (lipase activity), GLU(Glucose), AMS (α-amylase activity), TP (total protein), TPS (trypsin activity) following the instructions (Figure 1). In detail, TC were determined by COD-PAP method, TG by GPO-PAP method, LPS by colorimetric method, GLU by glucose-oxidase method, AMS by starch-iodine colorimetric method, TP by Coomassie brilliant blue method, TPS by UV-spectrocolorimetry method. Assay kits used in this study were all purchased from Nanjing Jiancheng Bioengineering Institute, China. The product numbers are as follows: TC, A111-1-1; LPS, A054-2-1; GLU, F006-1-1; AMS, C016-1-1; TP, A045-3-2; TPS, A080-2-2; TG, A110-1-1. The operations were strictly carried out according to the instructions.

2.6. Hydrolyzed and Free Amino Acid Content Analysis at 2 Days

Three fish were randomly selected out of the nine which were collected after 2 days’ cold stress (Figure 1), the muscles on both sides of the spine of these three fish were taken, ground, and mixed well separately. An amount of 6 mol/L hydrochloric acid was applied to hydrolyze the sample and then nitrogen was filled for 24 h. The prepared sample was used to detect the hydrolyzed amino acid contents by A200 amino acid analyzer with Aminosis.
Meanwhile, the flesh samples (0.1 g) were mixed with 0.3 mL water and 1.2 mL methanol, and then an ice-water bath was used to homogenize the samples with ultrasonic treatment for 10 min. After being frozen for 2 h at −20 °C, samples were centrifuged (12,000 rpm for 30 min at 4 °C) to collect the supernatant. Free amino acid analysis was performed by Waters ACQUITY Ultra Performance LC/MS (Waters, Milford, MA, USA).

2.7. RNA Extraction, cDNA Library Construction and RNA-seq at 2 Days

TRIzol Reagent (Takara, Dalian, China) was used to extract Total RNA from the liver in each groups according to the protocols. High-throughput sequence was conducted on 9 liver tissues collected from each group after 2 days of low-temperature stress (Figure 1). Among them, three fish from the same group (each fish 0.1 g liver) were mixed at random. Three biological replicates were put to use in the final RNA-seq. After that, the process of eukaryotic mRNA enrichment, first and second strand cDNA synthesis, adaptor, and sequencing on Illumina Hiseq4000 can all be referred to in our published paper [32]. Details of RNAseq reads and the total amount of RNAseq data of each individual sample can be found in Table S1.

2.8. De Novo Assembly, Functional Annotation, and Differentially Expressed Genes (DEGs) Analysis at 2 Days

Before the data were assembled, cut adapt software SeqPrep and Sickle (https://github.com/jstjohn/SeqPrep (accessed on 11 November 2021); https://github.com/najoshi/sickle (accessed on 11 November 2021)) was applied to filter unqualified raw data into clean data. The data processing process can also be referred to in published papers of our laboratory [32]. We assembled all the clean data using Trinity (https://github.com/trinityrnaseq/trinityrnaseq/wiki (accessed on 11 November 2021)) [33], then optimized and filtered the results by TransRate (http://hibberdlab.com/transrate/ (accessed on 11 November 2021)) [34] together with CD-HIT (http://weizhongli-lab.org/cd-hit/ (accessed on 11 November 2021)) [35]. The results, including 27,335 genes (G), 27,335 transcripts (T), N50 average length was 2653 bp. All transcripts obtained by this transcriptome sequencing were compared with GO and KEGG databases, and 19,305 GO annotations and 19,409 KEGG annotations were obtained. Details of transcripts and unigenes annotation are listed in Table S2. In order to compare different samples, the expression abundance of genes was quantified by using fragments-per-kilobase of exon model per million mapped reads (FPKM), measured by RSEM [36]. Given that the sequencing depth varied from samples, the FPKM value was used to normalize the absolute gene expression, making FPKM the expression quantity of genes. Then, we adopted DESeq2 [37] to verify the differentiation between StringTie assembled and quantified genes (|log2FC| > 1 was determined as the significant difference threshold, p < 0.05). Goatools (https://github.com/tanghaibao/GOatools (accessed on 11 November 2021)) [38] was applied for GO enrichment and KEGG pathway enrichment analysis.

2.9. Transcriptional Expression and Validation of Key DEGs at 2 Days

To verify the key genes expressions obtained from RNA-seq, RT-qPCR was performed. The process was set according to the previous operation of our laboratory [39]. We chose the gene B2M obtained by reference gene selection as the internal control. All the synthesis of primers in this study in Shanghai Generay Biotech Co., Ltd. (Shanghai, China), and the detailed information can be found in Table S3 and Document S1. On the basis of the manufacture’s protocol, SYBR Green (Takara, Dalian, China) was used for RT-PCR on Takara 800 Fast Real-Time PCR system.

2.10. Correlation Analysis

Pearson’s correlation test was conducted to figure out how the key genes correlated with SPSS 25.0.

2.11. Statistical Analysis

Data of crude fat content, plasma biochemical parameters index, hydrolysis amino acid, free amino acid content, and transcriptional expression were analyzed with one-way ANOVA by SPSS 25.0. The 2−ΔΔCT method was applied to calculate the relative RNA expression, students’ t-test was applied to analyze the statistical difference by SPSS 25.0. In all figures, the statistical differences were represented as asterisks (*, p <0.05; **, p < 0.01; ***, p < 0.001) and results were expressed as mean ± SEM.

3. Results

3.1. Body Composition and Plasma Biochemical Parameters Induced by Hypothermia in A. grunniens

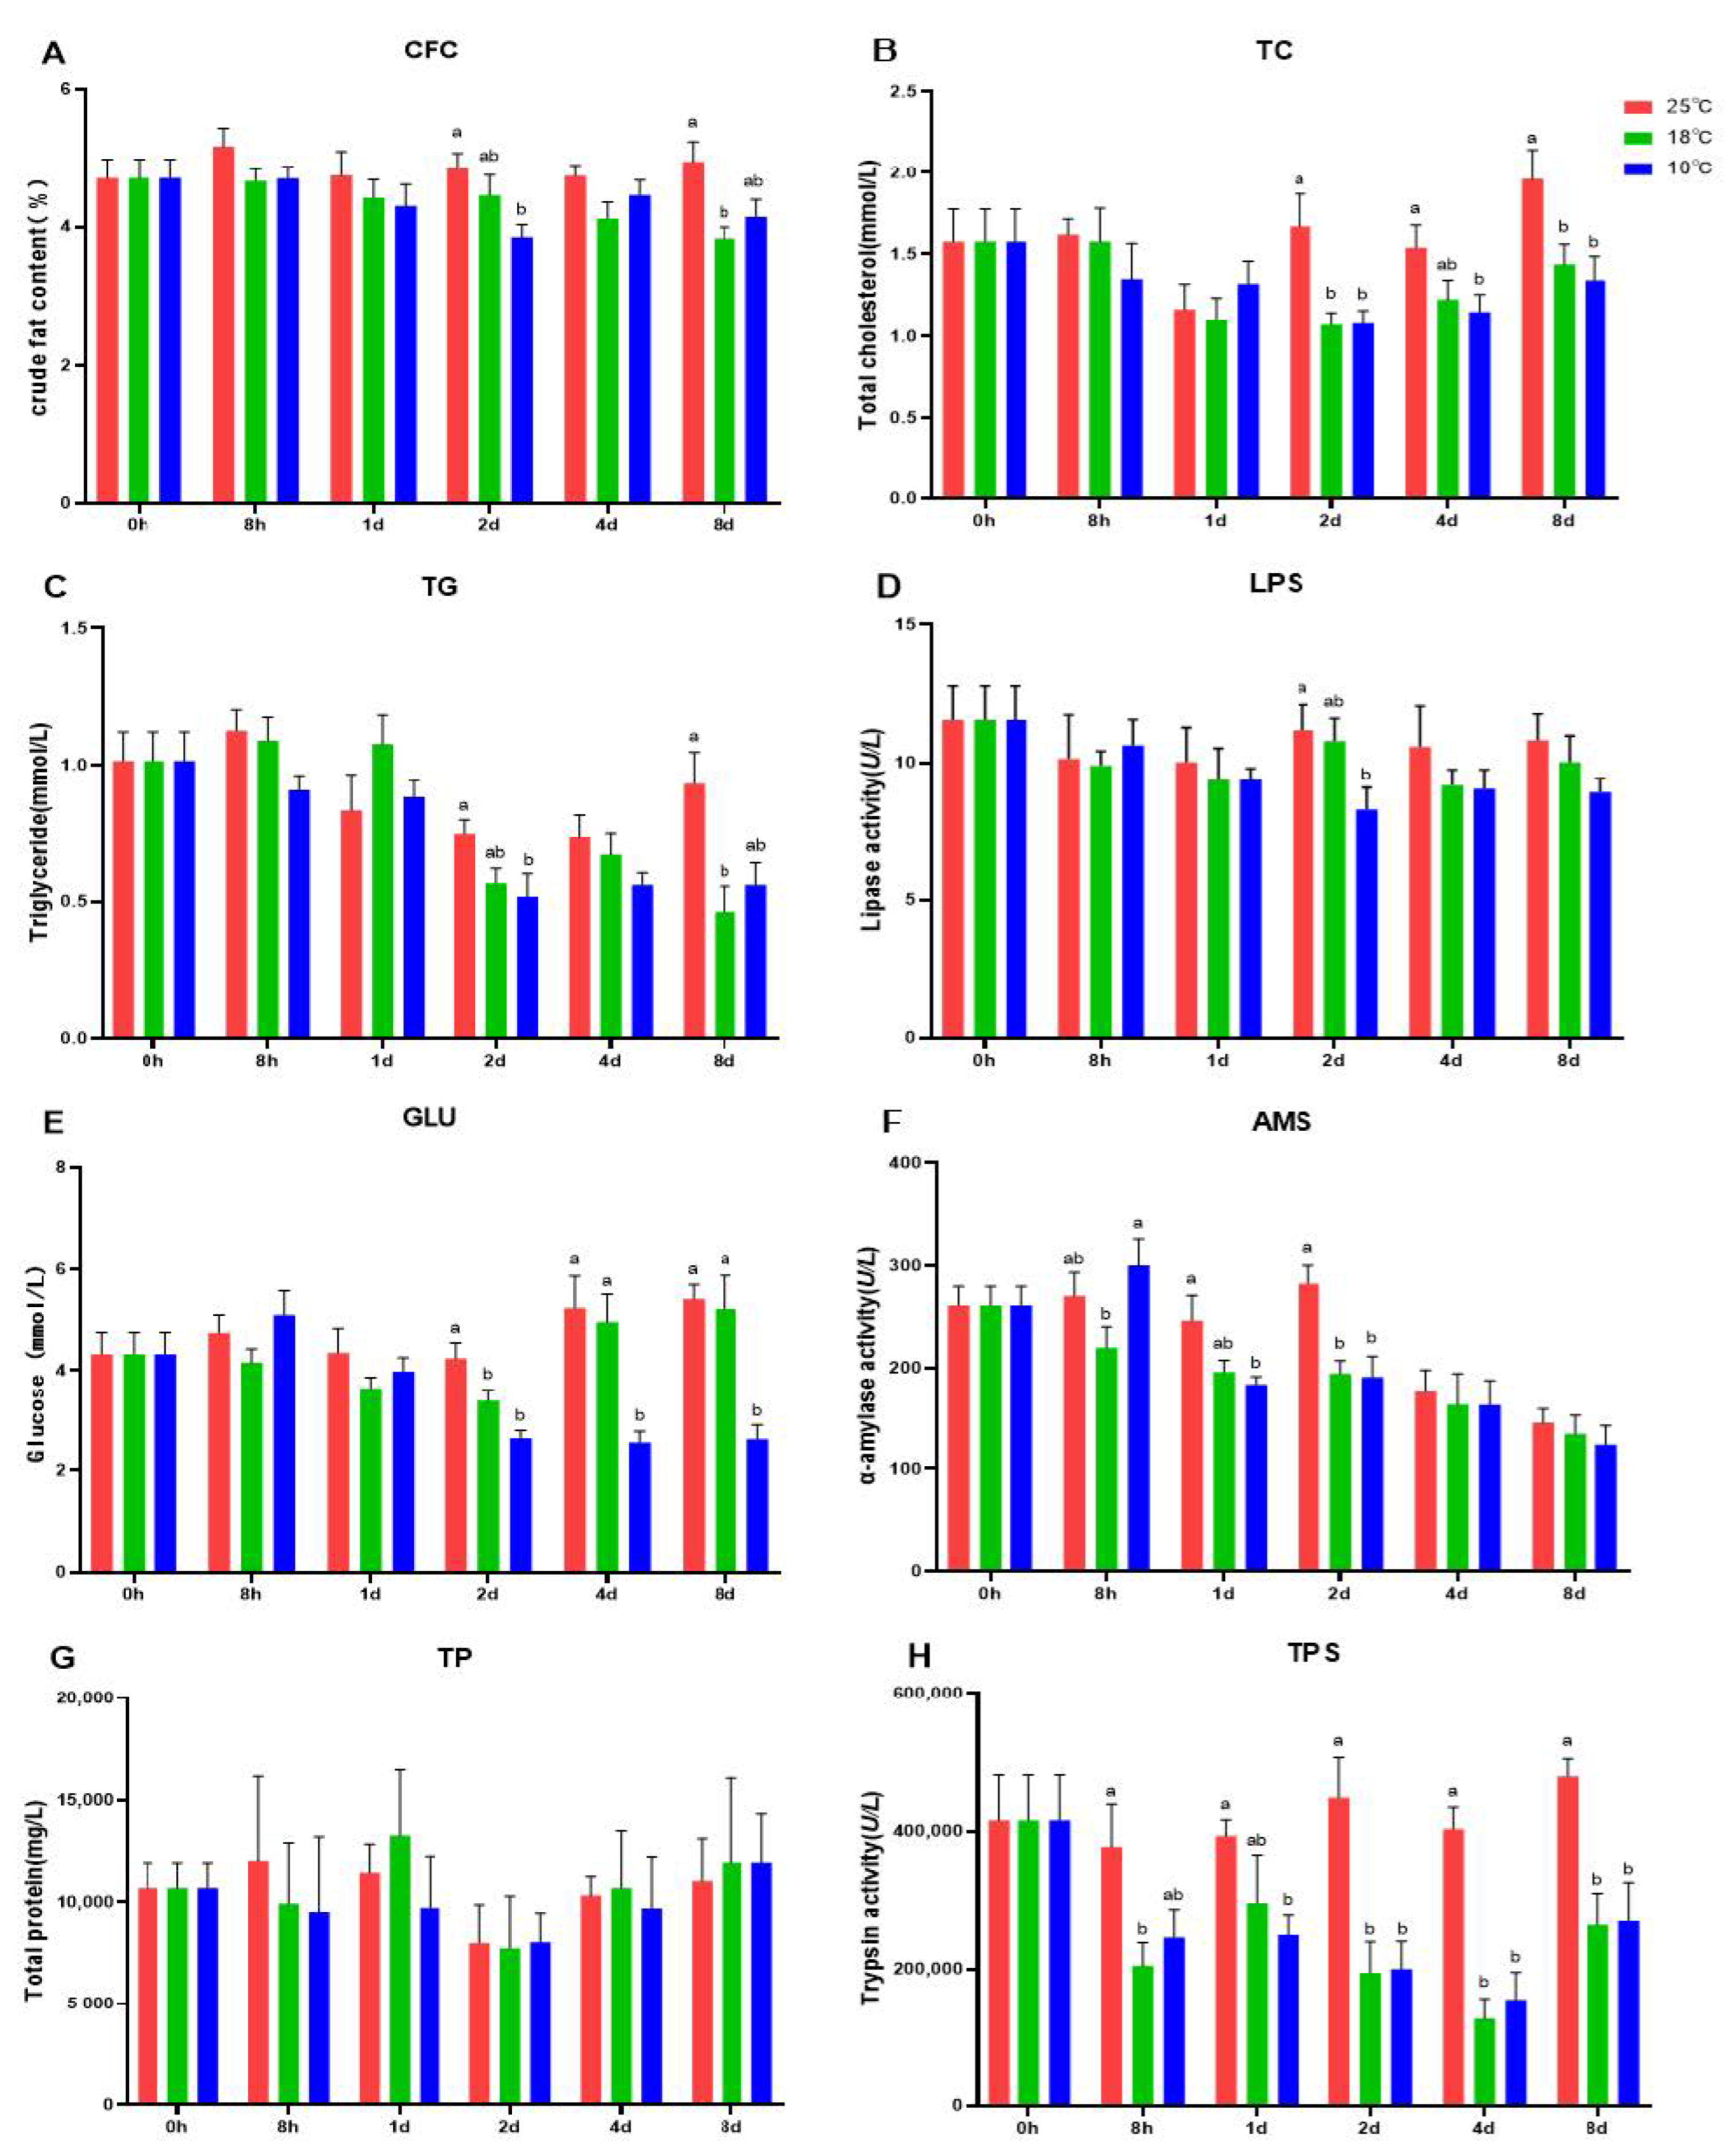
Body composition together with plasma biochemical parameters induced by cold stress were first determined (shown in Figure 2). Results show that CFC (Figure 2A), TC (Figure 2B), TG (Figure 2C), and LPS (Figure 2D) in LT10 were decreased gradually in comparison with the Con (p < 0.05). Meanwhile, TC (Figure 2B) content in L10 was also dramatically decreased compared with Con after 4 days and 8 days stress (p < 0.05). Significant difference between LT18 and Con mainly occurred after 8 days (p < 0.05), including CFC (Figure 2A), TC (Figure 2B), and TG (Figure 2C). AMS decreased significantly (Figure 2F) after 2 days in LT10 and LT18 compared with Con (p < 0.05), and AMS in LT10 also showed a significant downward trend at 1 day (Figure 2F, p < 0.05), the downregulation difference of GLU persisted in the LT10 group at 4 and 8 days (Figure 2E, p < 0.05). Moreover, TPS in both LT10 and LT18 decreased significantly to about half of that in the Con group after 2 days (Figure 2H, p < 0.05). However, TP content showed no difference at each time point (Figure 2G, p > 0.05).

3.2. Amino Acid Contents Induced by Hypothermia in A. grunniens

On the basis of the results, hypothermia for 2 days induced significant alteration on crude fat content and plasma biochemical parameters relating to metabolism, which indicate that hypothermia for 2 days is a key time point to study metabolism regulation. Therefore, hypothermia for 2 days was selected for the subsequent analysis. We conducted the amino acid analysis at 2 days cold stress. From the results, hydrolysis amino acid content exhibited no significant differences among the groups under 2 days cold stress (Table 1). However, the free amino acid contents of arginine, histidine, lysine, methionine, phenylalanine, threonine, aspartic acid, glutamic acid, proline and tyrosine were decreased after low-temperature stress (p < 0.05). Meanwhile, the level of total essential free amino acid (EAA) decreased significantly in groups LT10 and LT18 (p < 0.05).

3.3. Transcriptome Profiling of DEGs Induced by Hypothermia in A. grunniens

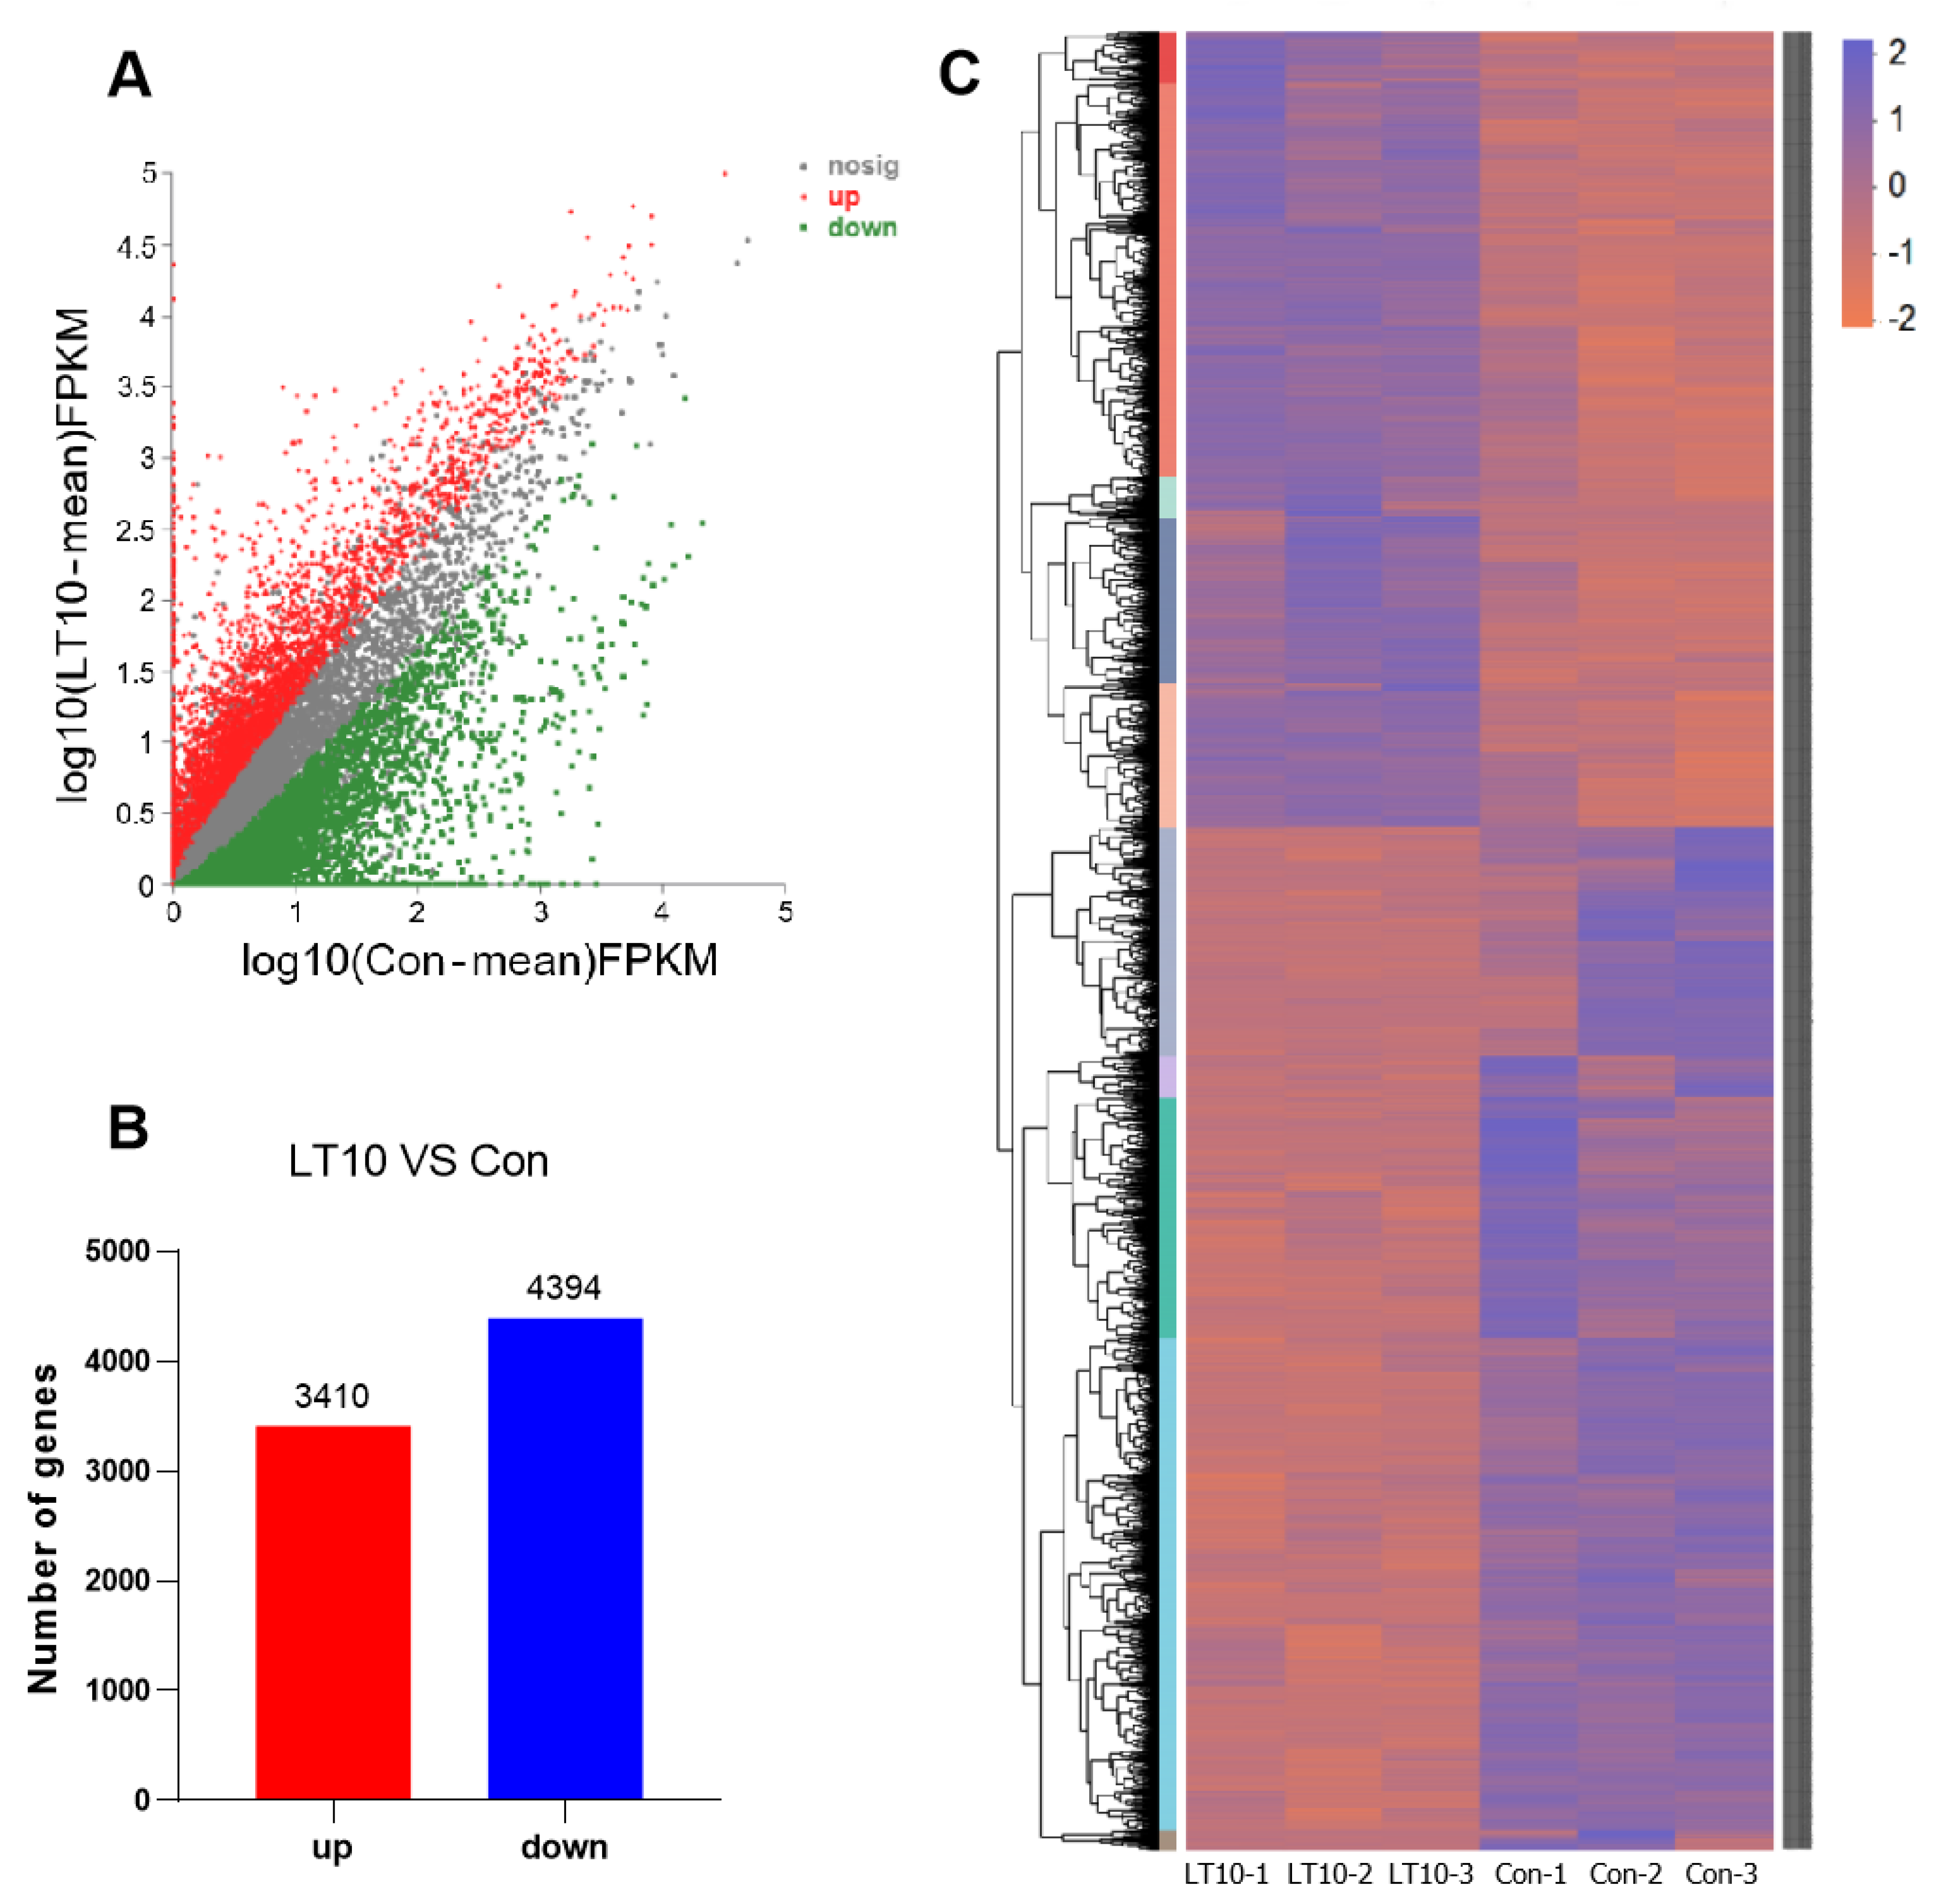
For the purpose of further exploring the inner mechanism of cold stress on freshwater drums, we conducted high throughput RNA sequencing to detect the DEGs between LT10 and Con. Taking |fold change| > 2.0 and p < 0.05 as threshold standard, 7804 DEGs in total was identified in LT10 (Figure 3A), including 4394 downregulated and 3410 upregulated DEGs (Figure 3B, Table S4). Since the genomes data of A. grunniens were not publicly available, most of the genes from transcriptome data were defined as those from Larimichthys crocea, which has an extremely high genetic similarity to A. grunniens. The expression levels and categories of DEGs demonstrated a pattern as clustering into sub-groups (Figure 3C).

3.4. GO and KEGG Enrichments of DEGs

The gene ontology as well as involved signaling pathways of DEGs were retrieved by subjecting them into the online database. The results were published in our previous research [23] (shown in Figure S1). DEGs were enriched into three kinds of items, including 6159 molecular functions (MF), 6648 cell components (CC), and 6826 biological processes (BP) (Figure S1A, Table S5). Analyzed by the rich factor value, most of the enriched items among the top 20 were related to biosynthetic and physiological metabolism, especially protein and amino acid metabolism (Amide biosynthetic process, 0043604; cellular nitrogen compound biosynthetic process, 0044271; cellular nitrogen compound metabolic process, 0034641; cellular protein metabolic process, 0044267; organonitrogen compound metabolic process, 1901564; peptide biosynthetic process, 0043043; peptide metabolic process, 0006518; protein metabolic process, 0019538; cellular amide metabolic process, 0043603) (Figure S1B, Table S6). Moreover, 342 KEGG signaling pathways were enriched by these DEGs, including 21 items with the corrected p-value < 0.05 (Figure S1C, Table S7). KEGG enrichment reveal that protein and amino acid metabolism (Pancreatic secretion, map04972; lysine degradation, map00310; tryptophan metabolism, map00380; histidine metabolism, map00340; protein digestion and absorption, map04974; valine, leucine and isoleucine degradation, map00280), lipid metabolism (Pancreatic secretion, map04972; linoleic acid metabolism, map00591; glycerolipid metabolism, map00561), as well as vitamin metabolism (Ascorbate and aldarate metabolism, map00053; retinol metabolism, map00830) were involved in the regulation of cold stress in freshwater drums. Specifically, PPARs signaling was dynamically enriched under hypothermia stress.

3.5. Expression of Lipid-Metabolism-Related Genes of A. grunniens under Low-Temperature Stress

DEGs involved in lipid metabolism were first identified and the transcriptional expression were validated with RT-PCR (shown in Figure 4). Results shown that the expression of pancreatic lipase-related proteins (PLRP, Figure 4A), fatty acid synthesis (FAS, Figure 4B), hormone-sensitive lipase (HSL, Figure 4C), acetyl coenzyme A carboxylase 1 (ACC1, Figure 4E), and uncoupling protein 1 (UCP1, Figure 4F) was dramatically decreased (p < 0.05). Conversely, the expression of cytokine macrophage migration inhibitory factor (MIF, Figure 5D) was increased significantly (p < 0.05).

3.6. Expression of Amino Acid Metabolism-Related Genes of A. grunniens under Low-Temperature Stress

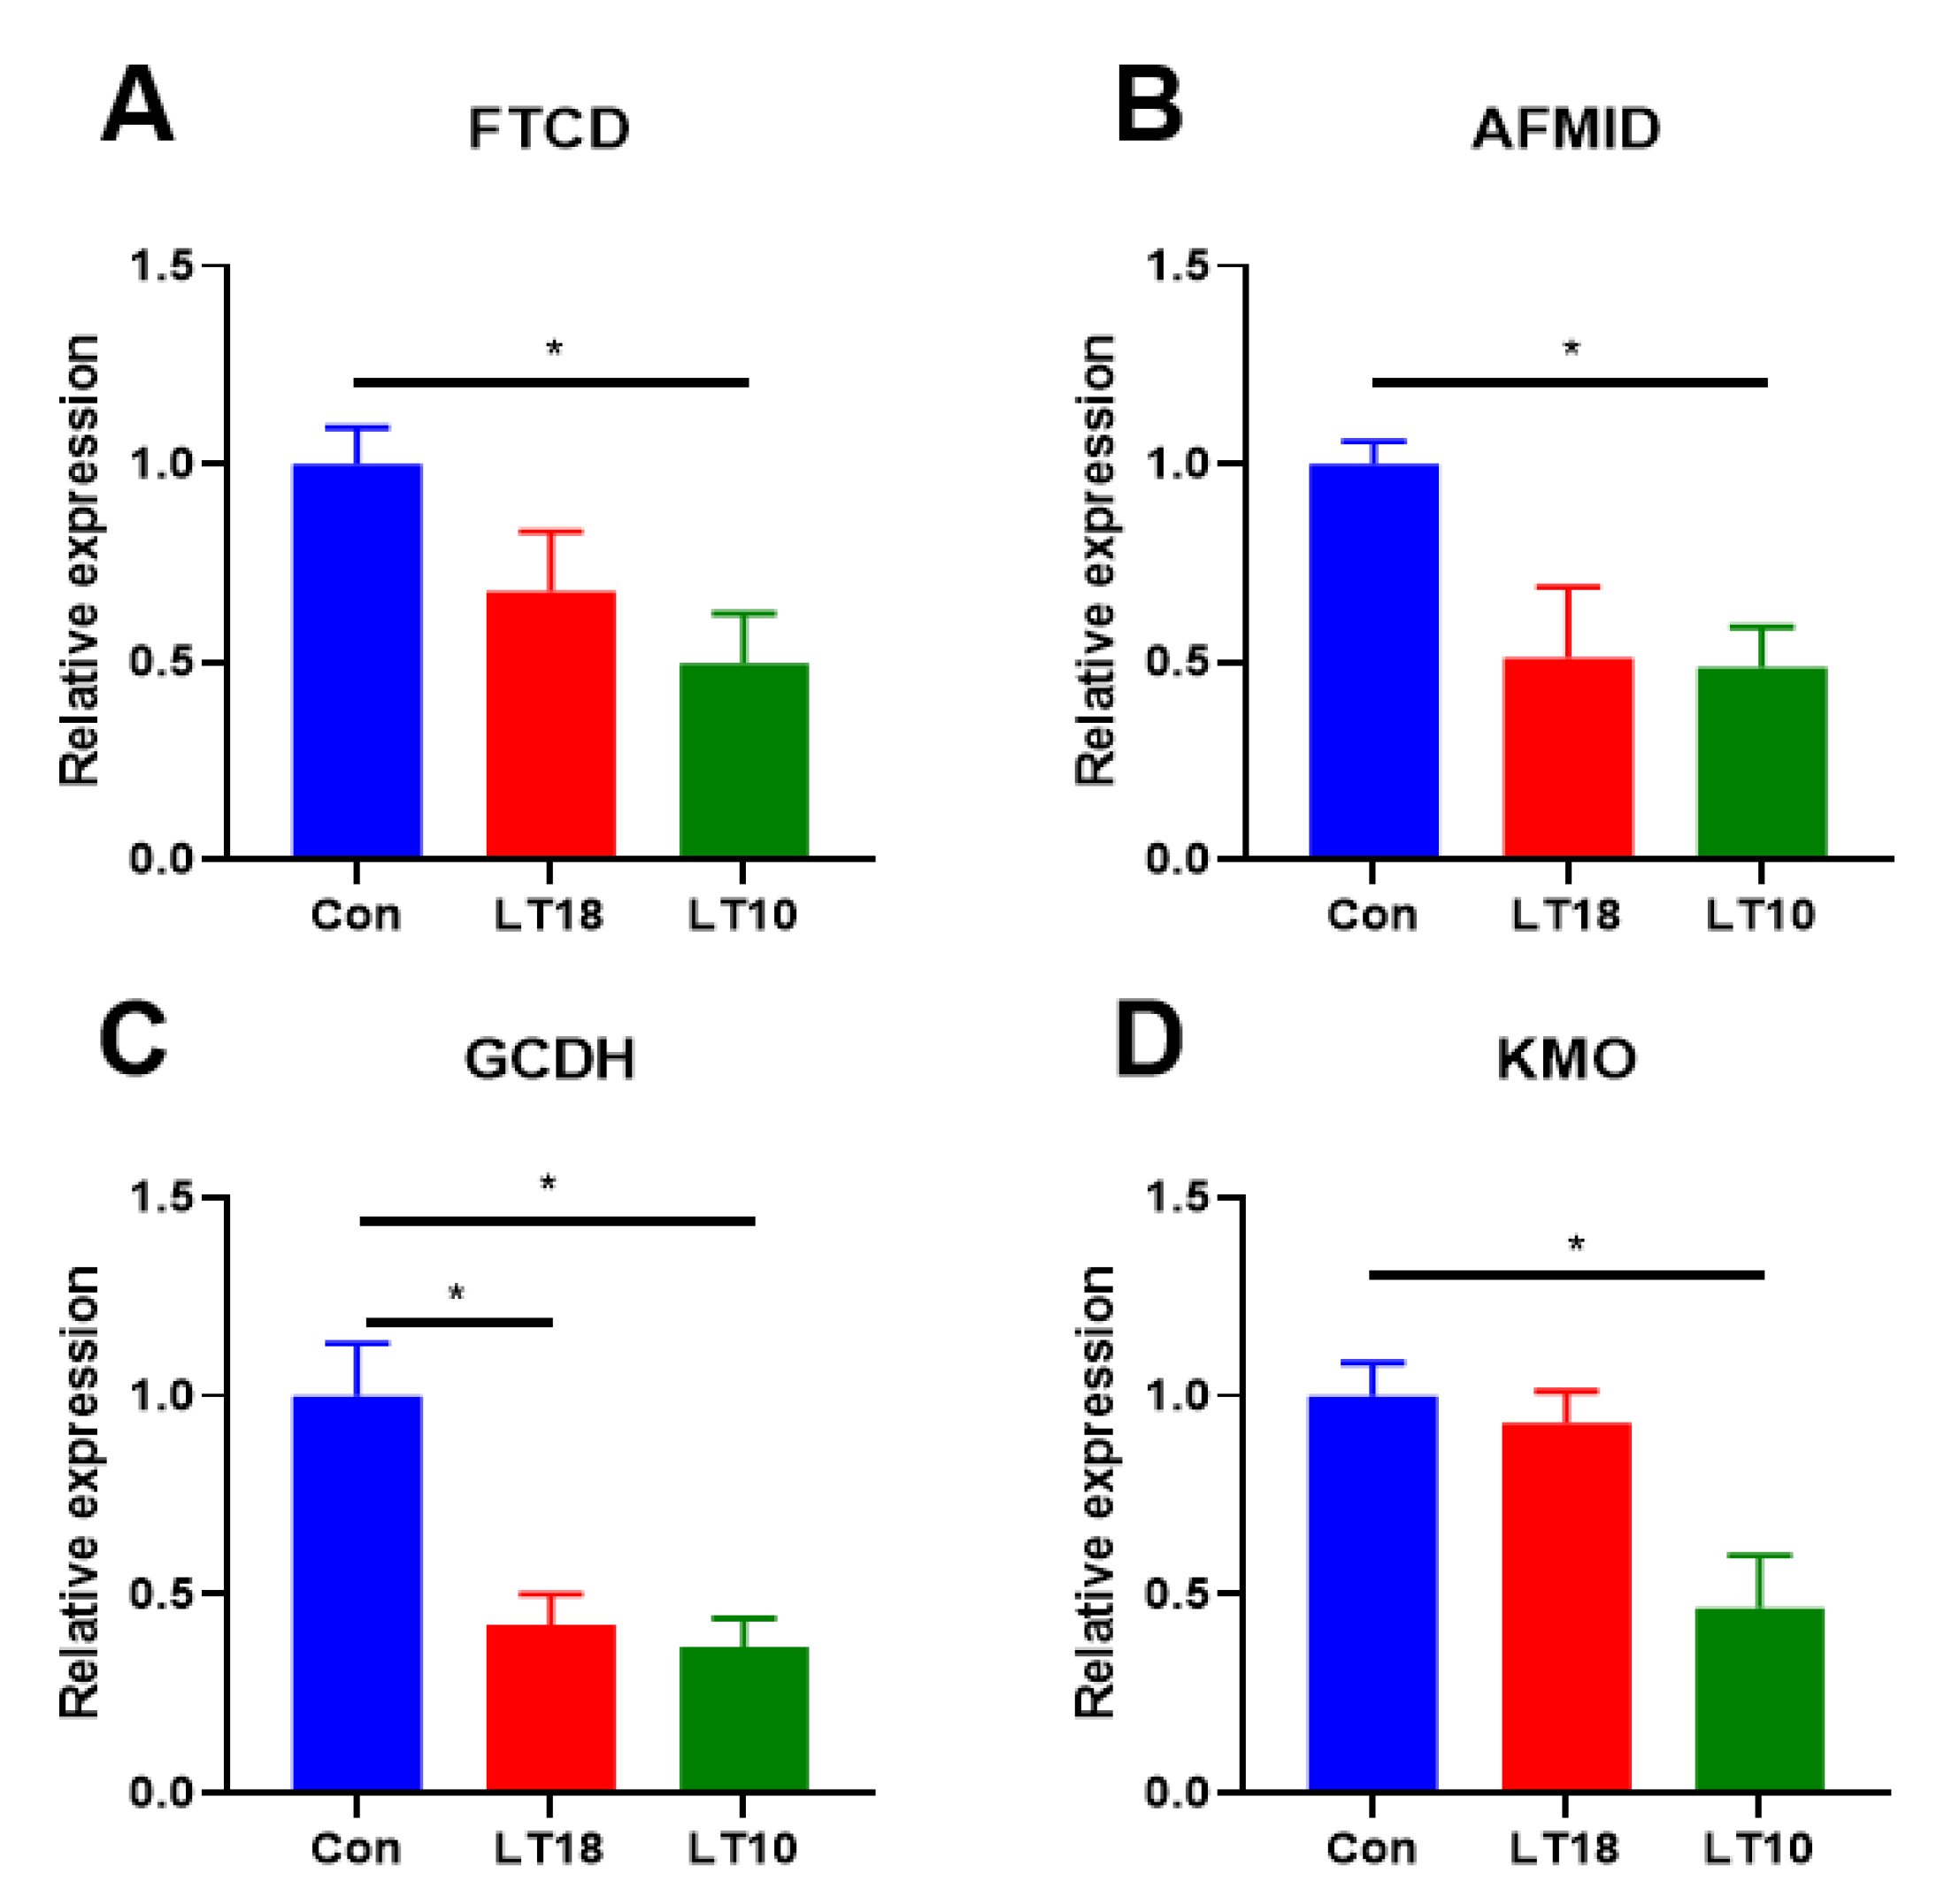
KEGG enrichment revealed that amino acid metabolism was active to the regulation of cold stress in freshwater drums (Figure 5). Results indicate that the transcriptional expression of formiminotransferase cyclodeaminase (FTCD, Figure 5A), enzyme arylformamidase (AFMID, Figure 5B), mitochondrial enzyme glutaryl- coenzyme A dehydrogenase (GCDH, Figure 5C), kynurenine3-monooxygenase (KMO, Figure 5D) was significantly downregulated (p < 0.05).

3.7. PPARs Signaling Was Involved in the Regulation of Hypothermia in A. grunniens

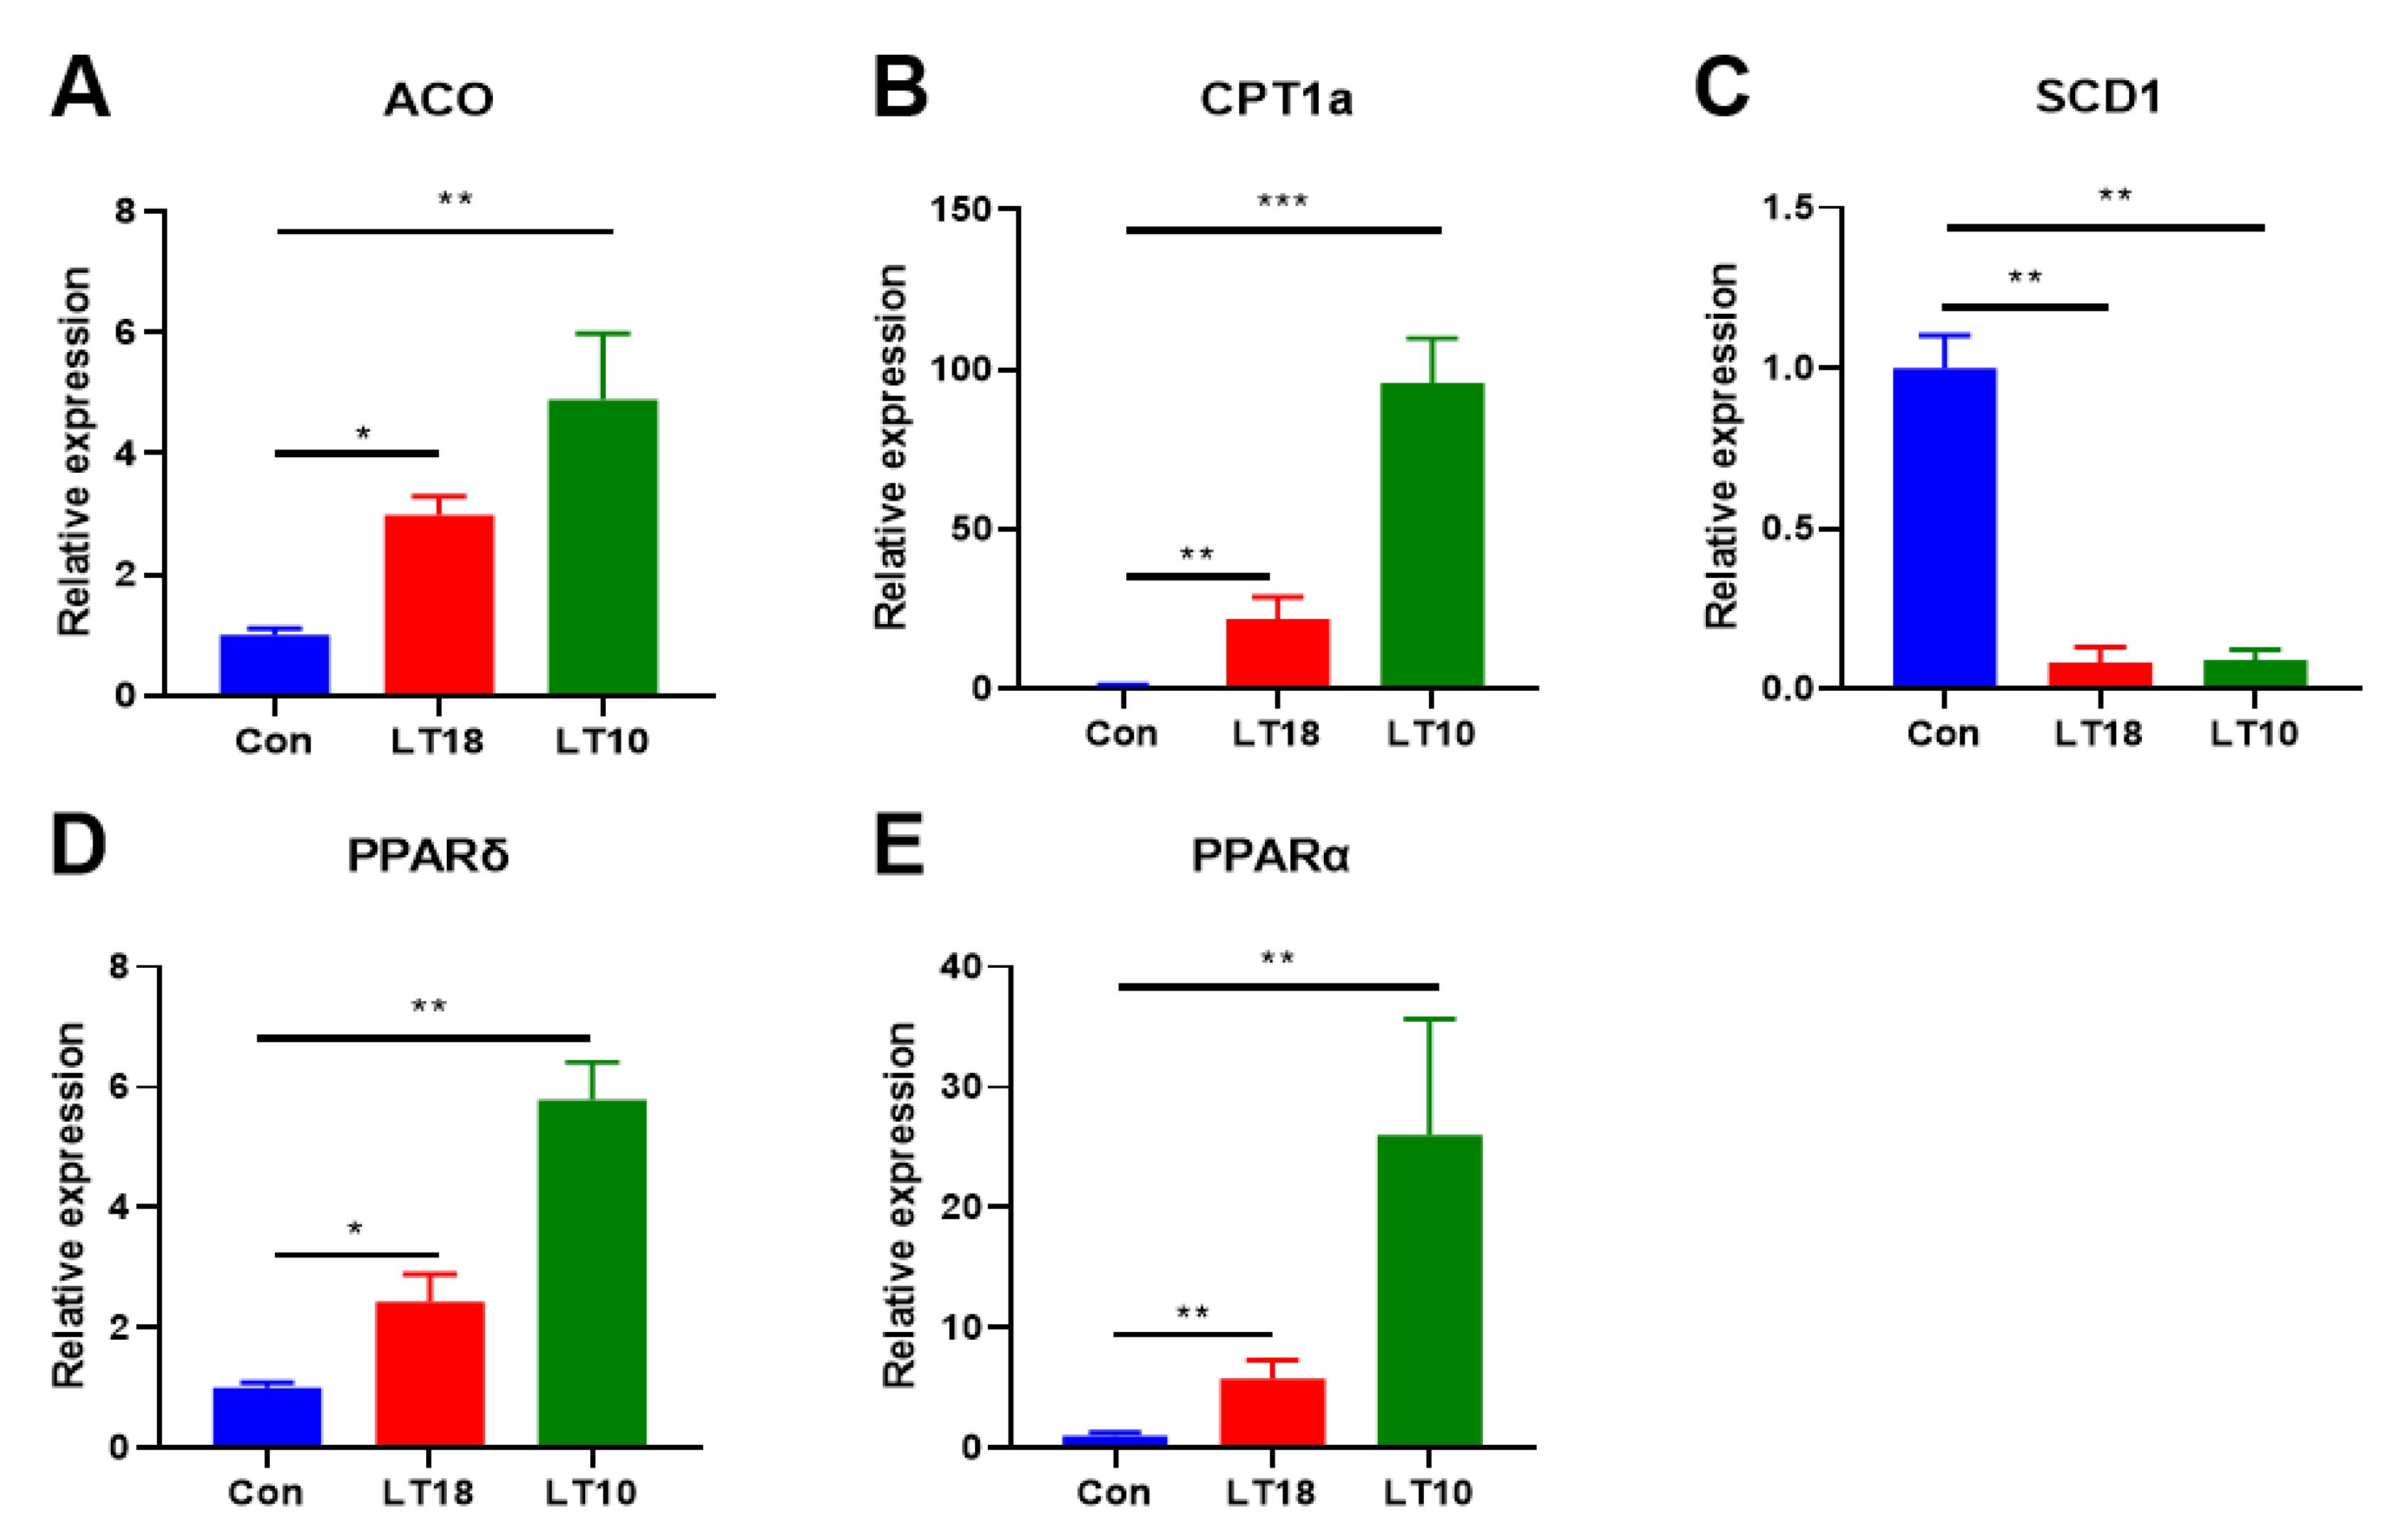
Apart from the above DEGs related to lipid and amino acid metabolism, the transcriptional expression of PPARs signaling related genes (shown in Figure 6), which is closely associated with metabolism homeostasis, was also validated. Results indicate that acyl-coenzyme A oxidase (ACO, Figure 6A), carnitine palmityltransferase 1A (CPT1a, Figure 6B), PPARδ (Figure 6D), and PPARα (Figure 6E) were dramatically upregulated (p < 0.05), but stearoylcoa desaturase-1 (SCD1, Figure 6C) was downregulated significantly (p < 0.05).

3.8. Lipid and Amino Acid Metabolism of A. grunniens Were Co-Related with PPARs Signaling under Low-Temperature Stress

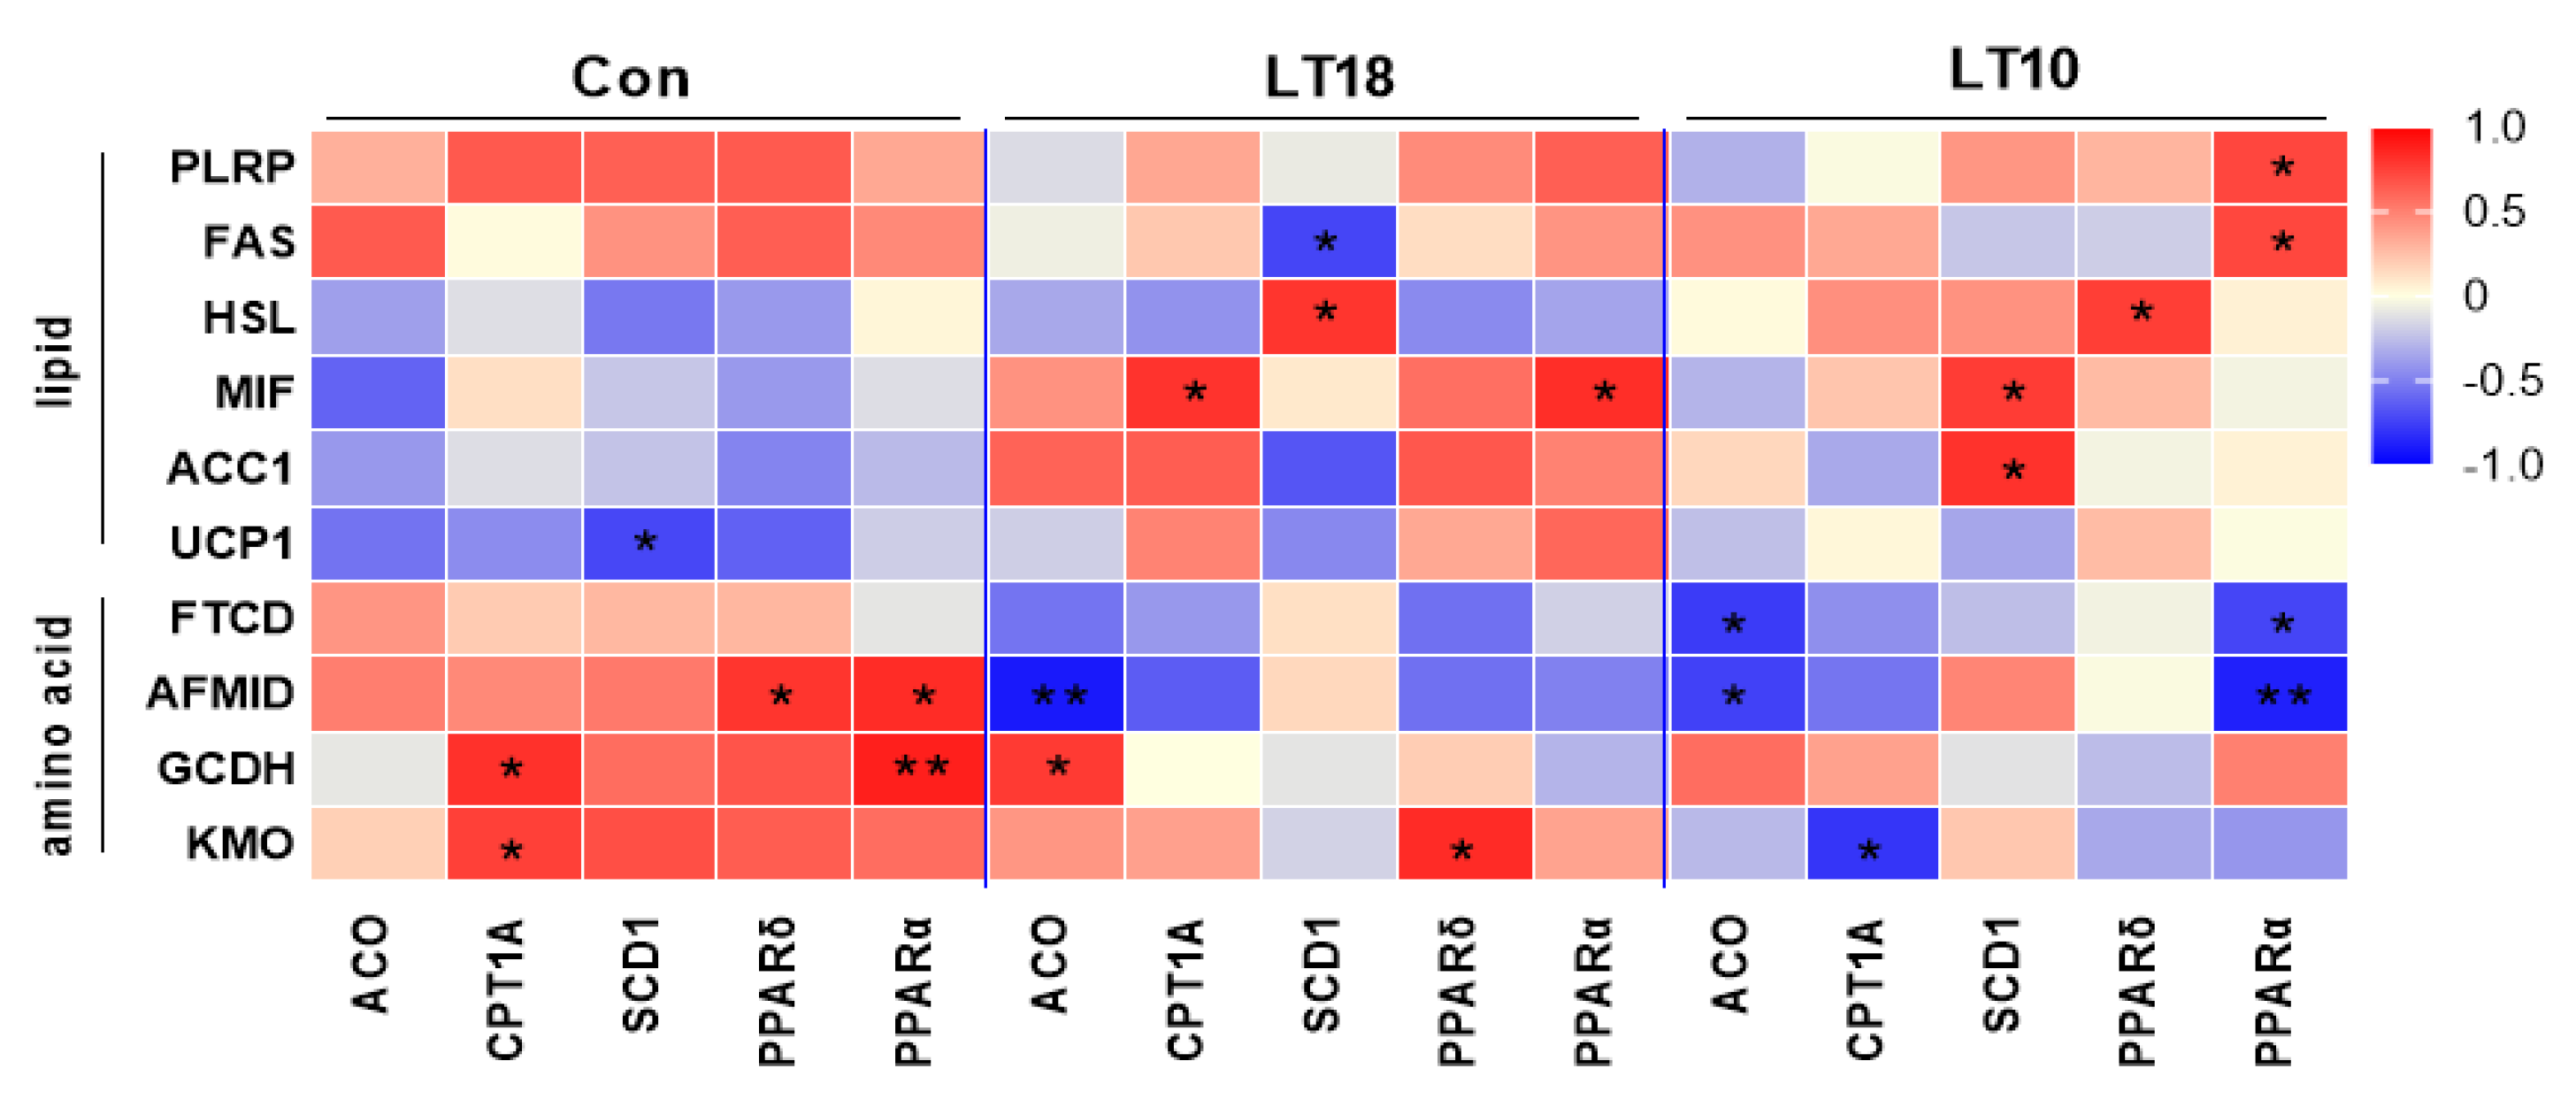
According to the aforesaid data, Pearson correlation analysis was proceeded in order to reveal the relationship between PPAR pathway and lipid and amino acid metabolism. The results shown that PPAR signaling was positively correlated with lipid metabolism in group LT10, while the correlation between PPAR signaling and amino acid metabolism changed from positive correlation at 25 °C to negative correlation at 10 °C (Figure 7).

4. Discussion

Generally, the growth of fish requires a relatively stable water temperature. However, extreme low or high temperature stress caused by abnormal weather changes generally exists in the practical aquaculture production [40,41]. The aim of our research is to assess the impact of low water temperature stress on the physiological and metabolic alternation of freshwater drums.
As a complex metabolic transformation process, fish growth includes the utilization of glucose, amino acids and fatty acids, intracellular protein transformation, as well as fat deposition, together with the regulation of hormones and other nutrients, leading to the accumulation of lipid and muscle [42]. To combat the low-temperature environment, aquatic animals have evolved to adapt to adverse stress, such as to enhance glycol-metabolism and decrease food intake. Cold stress experiments in tilapia showed that plasma glucose increased immediately, and then decreased after 2 days stress [10]. Decreased glucose may lead to insufficient energy supply and affect other physiological functions of the body, such as the previously reported reduction of immune and antioxidant properties [23]. Therefore, it will have adverse effects on the health of the fish. In our experiment, glucose, lipid, and amino acid metabolic-related enzyme activity was decreased along with the temperature decreasing. The results indicated that low temperature may reduce the digestive enzyme activity, and thus affect the physiological metabolism of freshwater drums.
Protein is an important nutrient for aquatic animals. Cold stress also affects the decomposition and anabolism of protein. Cold stress affects biological enzyme activity, reduces, or hinders cell metabolism and protein synthesis [11]. Studies on Perccottus glenii showed that the composition of free amino acids in different tissues changed under long-term cold stress [43]. In our present study, trypsin was decreased sharply under hypothermia stress, indicating that the protein digestive activity was decreased in freshwater drum [44,45,46]. Analogously, free amino acids (FAA) content was also decreased, especially the content of free essential amino acids (EAA). This result is consistent with the results of low-temperature stress experiments on Litopenaeus vannamei [47].
These different phenotypes in body composition, plasma biochemical parameters, and free amino acid contents positively indicate that cold stress could affect the physiological metabolism of freshwater drums. However, the underlying mechanism remain unclear. With RNA-seq, we found the DEGs were mostly enriched in amino acid metabolism and lipid synthesis and digestion. This shows that although freshwater drums can tolerate low temperatures for even 10 °C, its metabolism will still be affected when the ambient temperature drops.
Hypothermia may enhance lipid metabolism in fish by decreasing plasma TG content together with upregulating the expression of genes related to lipid metabolism [48]. In this study, low-temperature stress downregulated the expression of FAS, HSL, PLRP, ACC1, and UCP1, which function to catalyze the synthesis of fatty acids [49], catalyzes the hydrolysis of triacylglycerol [50], and lipid digestion [51], de novo fatty acid synthesis [52], and energy supply by fatty acid catabolism [53], respectively. Additionally, metabolic and inflammatory related MIF was upregulated under hypothermia, indicating that metabolic alternation was corelated with inflammatory response in freshwater drum [54]. These data reveal that fat synthesis and metabolism might contribute to the immune resistance under hypothermia.
In addition, amino acid metabolism-related gene expression was also validated. FTCD encodes an intermediate metabolic enzyme that links histidine catabolism with folate metabolism [55]. AFMID is involved in tryptophan transport [56]. KMO plays a central role in tryptophan metabolism [57]. GCDH can affect the accumulation of glutaric acid as well as 3-hydroxyglutaric acid in the catabolic metabolism of tryptophan, lysine, and hydroxylysine [58]. In this experiment, the expression of AFMID, KMO, and GCDH were all downregulated after the cold stress, indicating that hypothermia inhibited the amino acid metabolism of freshwater drums.
PPARα regulates the expression of ACO and CPT1a by inducing the oxidation rate of mitochondrial and peroxisomal fatty acids [59]. SCD1, a target of PPARα, is the key enzyme in the biosynthesis of monounsaturated fatty acids [60]. In our experiment, ACO, CPT1a, PPARα, and PPARδ were upregulated while SCD1 was downregulated under hypothermia, which was consistent with the study on Larimichthys Crocea [61]. Additionally, as a possible biomarker, glycine may be able to evaluate lipid accumulation as well as the lipid-lowering effects of PPARA/G in oleate-treated macrophages [21]. The activation of the PPAR pathway can also inhibit insulin sensitivity, thus could reduce glucose content [62], which was also confirmed in our study, evidenced by the decreased glucose and upregulated PPAR related genes. In this study, the relationship between PPAR signaling and amino acid metabolism and lipid metabolism was also validated, the results showed that there is a reversal of the correlation between PPAR pathway and fat metabolism and amino acid metabolism after 10 °C cold stresses, which indicated that the PPAR pathway maintained the homeostasis of lipid and amino acid metabolism in freshwater drums at low temperature.

5. Conclusions

In this study, hypothermia inhibited lipid and amino acid metabolism by the digestive enzyme activity, lipid and amino acid synthesis, and catabiosis. Transcriptome and RT-PCR analysis revealed that hypothermia-derived DEGs were chiefly involved in lipid and amino acid metabolism Moreover, PPAR signaling was dynamically related to lipid and amino acid metabolic homeostasis under low-temperature stress. These results uncovered the molecular basis of hypothermia on freshwater drum and provided potential regulation in resistance to hypothermia by means of metabolic approaches.

Supplementary Materials

The following supporting information can be downloaded at: https://www.mdpi.com/2218-1989/13/1/102/s1, Table S1: Transcriptome sequencing mapping statics; Table S2: Transcripts and unigenes annotation; Table S3: Primers and sequences referred to in the experiment; Table S4: Statistical analysis of express; Table S5: GO classification table of gene; Table S6: GO enrichment analysis; Table S7: KEGG enrichment analysis; Document S1: cDNA sequence of the gene involved in the experiment; Figure S1: GO and KEGG enrichments of DEGs in Freshwater drums liver induced by 2 days cold stress.

Author Contributions

Methodology, N.W., M.X. and J.C.; conceptualization, H.L., H.W. and C.S.; validation, N.W. and M.W.; formal analysis, N.W., C.S. and H.W.; investigation, N.W., M.X. and J.C.; data curation, N.W., M.X. and J.C.; writing—original draft preparation, N.W.; resources, H.W. and J.L.; writing—review and editing, C.S.; visualization, C.S.; project administration, H.L. and P.X.; funding acquisition, P.X. All authors have read and agreed to the published version of the manuscript.

Funding

This research was funded by the National Nonprofit Institute Research Grant of Freshwater Fisheries Research Center, Chinese Academy of Fishery Sciences (2021JBFM13, 2020JBFR03, 2020JBMF02), and the Innovation Project of Jiangsu Agriculture Science and Technology (CX(20)2025).

Institutional Review Board Statement

This study was approved by the Animal Care and Use Committee of Nanjing Agricultural University (Nanjing, China) (WXFC 2021-0006). All animal procedures were performed according to the Guideline for the Care and Use of Laboratory Animals in China.

Informed Consent Statement

Not applicable.

Data Availability Statement

The data that support the findings of this study are available from the corresponding author upon reasonable request. Data is not publicly available due to privacy.

Acknowledgments

We gratefully acknowledge Guohua Lv, Liang Zhang, and Xueyan Ma from the Freshwater Fisheries Research Center, Chinese Academy of Fishery Sciences for their help in this experiment.

Conflicts of Interest

The authors declare no conflict of interest.

References

  1. Hu, P.; Liu, M.; Liu, Y.; Wang, J.; Zhang, D.; Niu, H.; Jiang, S.; Wang, J.; Zhang, D.; Han, B.; et al. Transcriptome Comparison Reveals a Genetic Network Regulating the Lower Temperature Limit in Fish. Sci. Rep. 2016, 6, 28952. [Google Scholar] [CrossRef] [PubMed]
  2. Yang, Y.; Yu, H.; Li, H.; Wang, A.; Yu, H. Effect of High Temperature on Immune Response of Grass Carp (Ctenopharyngodon Idellus) by Transcriptome Analysis. Fish Shellfifish Immunol 2016, 58, 89–95. [Google Scholar] [CrossRef] [PubMed]
  3. Zhou, T.; Gui, L.; Liu, M.; Li, W.; Hu, P.; Duarte, D.F.C.; Niu, H.; Chen, L. Transcriptomic Responses to Low Temperature Stress in the Nile Tilapia, Oreochromis Niloticus. Fish Shellfifish Immunol 2019, 84, 1145–1156. [Google Scholar] [CrossRef] [PubMed]
  4. Song, C.; Cui, Y.; Liu, B.; Xie, J.; Ge, X.; Xu, P.; Ren, M.; Miao, L.; Zhou, Q.; Lin, Y. HSP60 and HSP90β from Blunt Snout Bream, Megalobrama Amblycephala: Molecular Cloning, Characterization, and Comparative Response to Intermittent Thermal Stress and Aeromonas Hydrophila Infection. Fish Shellfifish Immunol 2018, 74, 119–132. [Google Scholar] [CrossRef] [PubMed]
  5. Barat, A.; Goel, C.; Tyagi, A.; Ali, S.; Sahoo, P.K. Molecular Cloning and Expression Profile of Snow Trout GPDH Gene in Response to Abiotic Stress. Mol. Biol. Rep. 2012, 39, 10843–10849. [Google Scholar] [CrossRef]
  6. Hassaan, M.S.; EL Nagar, A.G.; Salim, H.S.; Fitzsimmons, K.; El-Haroun, E.R. Nutritional Mitigation of Winter Thermal Stress in Nile Tilapia by Propolis-Extract: Associated Indicators of Nutritional Status, Physiological Responses and Transcriptional Response of Delta-9-Desaturase Gene. Aquaculture 2019, 511, 734256. [Google Scholar] [CrossRef]
  7. Soaudy, M.R.; Mohammady, E.Y.; Elashry, M.A.; Ali, M.M.; Ahmed, N.M.; Hegab, M.H.; El-Garhy, H.A.S.; El-Haroun, E.R.; Hassaan, M.S. Possibility Mitigation of Cold Stress in Nile Tilapia under Biofloc System by Dietary Propylene Glycol: Performance Feeding Status, Immune, Physiological Responses and Transcriptional Response of Delta-9-Desaturase Gene. Aquaculture 2021, 538, 736519. [Google Scholar] [CrossRef]
  8. Hsieh, S.L.; Chen, Y.N.; Kuo, C.M. Physiological Responses, Desaturase Activity, and Fatty Acid Composition in Milkfish (Chanos Chanos) under Cold Acclimation. Aquaculture 2003, 220, 903–918. [Google Scholar] [CrossRef]
  9. Pankhurst, N.W. The Endocrinology of Stress in Fish: An Environmental Perspective. Gen. Comp. Endocrinol. 2011, 170, 265–275. [Google Scholar] [CrossRef]
  10. Jun, Q.; Hong, Y.; Hui, W.; Didlyn, K.M.; Jie, H.; Pao, X. Physiological Responses and HSP70 MRNA Expression in GIFT Tilapia Juveniles,Oreochromis Niloticus under Short-Term Crowding. Aquac. Res. 2013, 46, 335–345. [Google Scholar] [CrossRef]
  11. Salahudeen, A.K. Cold Ischemic Injury of Transplanted Kidneys: New Insights from Experimental Studies. Am. J. Physiol. Ren. Physiol. 2004, 287, F181–F187. [Google Scholar] [CrossRef]
  12. Qiang, J.; He, J.; Yang, H.; Wang, H.; Kpundeh, M.D.; Xu, P.; Zhu, Z.X. Temperature Modulates Hepatic Carbohydrate Metabolic Enzyme Activity and Gene Expression in Juvenile GIFT Tilapia (Oreochromis Niloticus) Fed a Carbohydrate-Enriched Diet. J. Therm. Biol. 2014, 40, 25–31. [Google Scholar] [CrossRef] [PubMed]
  13. Hsieh, S.-L.; Hu, C.-Y.; Hsu, Y.-T.; Hsieh, T.-J. Influence of Dietary Lipids on the Fatty Acid Composition and Stearoyl-CoA Desaturase Expression in Hybrid Tilapia (Oreochromis Niloticus×O. Aureus) under Cold Shock. Comp. Biochem. Physiol. B Biochem. Mol. Biol. 2007, 147, 438–444. [Google Scholar] [CrossRef] [PubMed]
  14. Ruyter, B.; Røjø, C.; Grisdale-Helland, B.; Rosenlund, G.; Obach, A.; Thomassen, M.S. Influence of Temperature and High Dietary Linoleic Acid Content on Esterification, Elongation, and Desaturation of PUFA in Atlantic Salmon Hepatocytes. Lipids 2003, 38, 833–840. [Google Scholar] [CrossRef] [PubMed]
  15. Vagner, M.; Santigosa, E. Characterization and Modulation of Gene Expression and Enzymatic Activity of Delta-6 Desaturase in Teleosts: A Review. Aquaculture 2011, 315, 131–143. [Google Scholar] [CrossRef]
  16. Ibarz, A.; Martín-Pérez, M.; Blasco, J.; Bellido, D.; de Oliveira, E.; Fernández-Borràs, J. Gilthead Sea Bream Liver Proteome Altered at Low Temperatures by Oxidative Stress. Proteomics 2010, 10, 963–975. [Google Scholar] [CrossRef] [PubMed]
  17. Michalik, L.; Auwerx, J.; Berger, J.P.; Chatterjee, V.K.; Glass, C.K.; Gonzalez, F.J.; Grimaldi, P.A.; Kadowaki, T.; Lazar, M.A.; O’Rahilly, S.; et al. International Union of Pharmacology. LXI. Peroxisome Proliferator-Activated Receptors. Pharmacol. Rev. 2006, 58, 726–741. [Google Scholar] [CrossRef]
  18. Dunning, K.R.; Anastasi, M.R.; Zhang, V.J.; Russell, D.L.; Robker, R.L. Regulation of Fatty Acid Oxidation in Mouse Cumulus-Oocyte Complexes during Maturation and Modulation by PPAR Agonists. PLoS ONE 2014, 9, e87327. [Google Scholar] [CrossRef]
  19. Rakhshandehroo, M.; Knoch, B.; Müller, M.; Kersten, S. Peroxisome Proliferator-Activated Receptor Alpha Target Genes. PPAR Res. 2010, 2010, 393–416. [Google Scholar] [CrossRef]
  20. Kersten, S.; Mandard, S.; Escher, P.; Gonzalez, F.J.; Tafuri, S.; Desvergne, B.; Wahli, W. The Peroxisome Proliferator-activated Receptor α Regulates Amino Acid Metabolism. FASEB J. 2001, 15, 1971–1978. [Google Scholar] [CrossRef]
  21. Ye, G.; Gao, H.; Lin, Y.; Ding, D.; Liao, X.; Zhang, H.; Chi, Y.; Dong, S. Peroxisome Proliferator-Activated Receptor A/G Reprogrammes Metabolism Associated with Lipid Accumulation in Macrophages. Metabolomics 2019, 15, 36. [Google Scholar] [CrossRef]
  22. Barney, R.L. The Distribution of the Fresh-Water Sheepshead, Aplodinotus Grunniens Rafinesque, in Respect to the Glacial History of North America. Ecology 1926, 7, 351–364. [Google Scholar] [CrossRef]
  23. Chen, J.; Li, H.; Xu, P.; Tang, Y.; Su, S.; Liu, G.; Wu, N.; Xue, M.; Yu, F.; Feng, W.; et al. Hypothermia-Mediated Apoptosis and Inflammation Contribute to Antioxidant and Immune Adaption in Freshwater Drum, Aplodinotus Grunniens. Antioxidants 2022, 11, 1657. [Google Scholar] [CrossRef] [PubMed]
  24. Chen, J.; Song, C.; Wen, H.; Liu, G.; Wu, N.; Li, H.; Xue, M.; Xu, P. MiR-1/AMPK-Mediated Glucose and Lipid Metabolism under Chronic Hypothermia in the Liver of Freshwater Drum, Aplodinotus Grunniens. Metabolites 2022, 12, 697. [Google Scholar] [CrossRef] [PubMed]
  25. Song, C.; Wen, H.; Liu, G.; Ma, X.; Lv, G.; Wu, N.; Chen, J.; Xue, M.; Li, H.; Xu, P. Gut Microbes Reveal Pseudomonas Medicates Ingestion Preference via Protein Utilization and Cellular Homeostasis Under Feed Domestication in Freshwater Drum, Aplodinotus Grunniens. Front. Microbiol. 2022, 13, 1831. [Google Scholar] [CrossRef]
  26. Wen, H.; Ma, X.; Xu, P.; Zheng, B.; Yuan, X.; Zou, J.; Jin, W.; Hua, D.; Gu, R. External Morphology and Internal Anatomical Characters of Juveniles of the Freshwater Drum Aplodinotus Grunniens. J. Fish. Sci. China 2018, 25, 1161. [Google Scholar] [CrossRef]
  27. Liang, Z.; Haibo, W.; Bingqing, Z.; Hongxia, L.; Changyou, S.; Wu, J.; Xueyan, M.; Pao, X.; Dan, H.; Ruobo, G. Artificial Spawning and Embryonic Development of Freshwater Drum, Aplodinotus Grunniens. J. Fish. Sci. China 2021, 28, 569–578. [Google Scholar] [CrossRef]
  28. Hernández-Gómez, R.E.; Perera-Garcia, M.A.; Valenzuela, C.I.; Duran, M.T.; Mendoza-Carranza, M. Embryonic Development of Aplodinotus Grunniens (Perciforme: Sciaenidae) in Tenosique, Tabasco, Mexico. Int. J. Morphol. 2013, 31, 633–639. [Google Scholar] [CrossRef]
  29. Bodensteiner, L.R.; Lewis, W.M. Role of Temperature, Dissolved Oxygen, and Backwaters in the Winter Survival of Freshwater Drum (Aplodinotus Grunniens) in the Mississippi River. Can. J. Fish. Aquat. Sci. 1992, 49, 173–184. [Google Scholar] [CrossRef]
  30. Edsall, T.A. Biology of the Freshwater Drum in Western Lake Erie. Ohio J. Sci. 1967, 67, 321–340. Available online: https://kb.osu.edu/handle/1811/5342 (accessed on 1 December 2022).
  31. Jensen, W.B. The Origin of the Soxhlet Extractor. J. Chem. Educ. 2007, 84, 1913. [Google Scholar] [CrossRef]
  32. Li, H.; Qiang, J.; Song, C.; Xu, P. Transcriptome Profiling Reveal Acanthopanax Senticosus Improves Growth Performance, Immunity and Antioxidant Capacity by Regulating Lipid Metabolism in GIFT (Oreochromis Niloticus). Comp. Biochem. Physiol. Part D Genom. Proteom. 2021, 37, 100784. [Google Scholar] [CrossRef]
  33. Grabherr, M.G.; Haas, B.J.; Yassour, M.; Levin, J.Z.; Thompson, D.A.; Amit, I.; Adiconis, X.; Fan, L.; Raychowdhury, R.; Zeng, Q.; et al. Full-Length Transcriptome Assembly from RNA-Seq Data without a Reference Genome. Nat. Biotechnol. 2011, 29, 644–652. [Google Scholar] [CrossRef] [PubMed]
  34. Smith-Unna, R.; Boursnell, C.; Patro, R.; Hibberd, J.M.; Kelly, S. TransRate: Reference-Free Quality Assessment of de Novo Transcriptome Assemblies. Genome Res. 2016, 26, 1134–1144. [Google Scholar] [CrossRef]
  35. Li, W.; Godzik, A. Cd-Hit: A Fast Program for Clustering and Comparing Large Sets of Protein or Nucleotide Sequences. Bioinformatics 2006, 22, 1658–1659. [Google Scholar] [CrossRef] [PubMed]
  36. Li, B.; Dewey, C.N. RSEM: Accurate Transcript Quantification from RNA-Seq Data with or without a Reference Genome. BMC Bioinform. 2011, 12, 323. [Google Scholar] [CrossRef] [PubMed]
  37. Love, M.I.; Huber, W.; Anders, S. Moderated Estimation of Fold Change and Dispersion for RNA-Seq Data with DESeq2. Genome Biol. 2014, 15, 550. [Google Scholar] [CrossRef] [PubMed]
  38. Klopfenstein, D.V.; Zhang, L.; Pedersen, B.S.; Ramírez, F.; Vesztrocy, A.W.; Naldi, A.; Mungall, C.J.; Yunes, J.M.; Botvinnik, O.; Weigel, M.; et al. GOATOOLS: A Python Library for Gene Ontology Analyses. Sci. Rep. 2018, 8, 10872. [Google Scholar] [CrossRef]
  39. Song, C.; Liu, B.; Ge, X.; Li, H.; Liu, B.; Xu, P. MiR-34a/Notch1b Mediated Autophagy and Apoptosis Contributes to Oxidative Stress Amelioration by Emodin in the Intestine of Teleost Megalobrama Amblycephala. Aquaculture 2022, 547, 737441. [Google Scholar] [CrossRef]
  40. Chu, P.; Wang, T.; Sun, Y.R.; Chu, M.X.; Wang, H.Y.; Zheng, X.; Yin, S. Effect of Cold Stress on the MAPK Pathway and Lipidomics on Muscle of Takifugu Fasciatus. Aquaculture 2021, 540, 736691. [Google Scholar] [CrossRef]
  41. Stavrakidis-Zachou, O.; Lika, K.; Anastasiadis, P.; Papandroulakis, N. Projecting Climate Change Impacts on Mediterranean Finfish Production: A Case Study in Greece. Clim. Chang. 2021, 165, 67. [Google Scholar] [CrossRef]
  42. Kong, X.F.; Yin, F.G.; He, Q.H.; Liu, H.J.; Li, T.J.; Huang, R.L.; Fan, M.Z.; Liu, Y.L.; Hou, Y.Q.; Li, P.; et al. Acanthopanax Senticosus Extract as a Dietary Additive Enhances the Apparent Ileal Digestibility of Amino Acids in Weaned Piglets. Livest. Sci. 2009, 123, 261–267. [Google Scholar] [CrossRef]
  43. Karanova, M.V. Impact of Seasonal Temperature Decrease and Cold Shock on the Composition of Free Amino Acids and Phosphomonoethers in Various Organs of Amur Sleeper Percottus Glenii (Eleotridae). J. Ichthyol. 2018, 58, 570–579. [Google Scholar] [CrossRef]
  44. Zeytin, S.; Schulz, C.; Ueberschär, B. Diurnal Patterns of Tryptic Enzyme Activity under Different Feeding Regimes in Gilthead Sea Bream (Sparus Aurata) Larvae. Aquaculture 2016, 457, 85–90. [Google Scholar] [CrossRef]
  45. Mir, I.N.; Srivastava, P.P.; Bhat, I.A.; Muralidhar, A.P.; Varghese, T.; Gireesh-Babu, P.; Jain, K.K. Expression and Activity of Trypsin and Pepsin during Larval Development of Indian Walking Catfish (Clarias Magur). Aquaculture 2018, 491, 266–272. [Google Scholar] [CrossRef]
  46. Solovyev, M.M.; Kashinskaya, E.N.; Rogozhin, E.A.; Moyano, F.J. Seasonal Changes in Kinetic Parameters of Trypsin in Gastric and Agastric Fish. Fish Physiol. Biochem. 2021, 47, 381–391. [Google Scholar] [CrossRef]
  47. Zhou, M.; Wang, A.-L.; Xian, J.-A. Variation of Free Amino Acid and Carbohydrate Concentrations in White Shrimp, Litopenaeus Vannamei: Effects of Continuous Cold Stress. Aquaculture 2011, 317, 182–186. [Google Scholar] [CrossRef]
  48. Sun, Z.; Tan, X.; Liu, Q.; Ye, H.; Zou, C.; Xu, M.; Zhang, Y.; Ye, C. Physiological, immune responses and liver lipid metabolism of orange-spotted grouper (Epinephelus Coioides) under Cold Stress. Aquaculture 2019, 498, 545–555. [Google Scholar] [CrossRef]
  49. Chakravarthy, M.V.; Lodhi, I.J.; Yin, L.; Malapaka, R.R.V.; Xu, H.E.; Turk, J.; Semenkovich, C.F. Identification of a Physiologically Relevant Endogenous Ligand for PPARα in Liver. Cell 2009, 138, 476–488. [Google Scholar] [CrossRef]
  50. Kraemer, F.B.; Shen, W.-J. Hormone-Sensitive Lipase Knockouts. Nutr. Metab. 2006, 3, 12. [Google Scholar] [CrossRef] [PubMed]
  51. Ren, J.; Chen, Z.; Zhang, W.; Li, L.; Sun, R.; Deng, C.; Fei, Z.; Sheng, Z.; Wang, L.; Sun, X.; et al. Increased Fat Mass and Insulin Resistance in Mice Lacking Pancreatic Lipase-Related Protein 1. J. Nutr. Biochem. 2011, 22, 691–698. [Google Scholar] [CrossRef] [PubMed]
  52. Wang, X.; Zhou, Y.; Tang, D.; Zhu, Z.; Li, Y.; Huang, T.; Müller, R.; Yu, W.; Li, P. ACC1 (Acetyl Coenzyme A Carboxylase 1) Is a Potential Immune Modulatory Target of Cerebral Ischemic Stroke. Stroke 2019, 50, 1869–1878. [Google Scholar] [CrossRef] [PubMed]
  53. Mills, E.L.; Harmon, C.; Jedrychowski, M.P.; Xiao, H.; Garrity, R.; Tran, N.V.; Bradshaw, G.A.; Fu, A.; Szpyt, J.; Reddy, A.; et al. UCP1 governs liver extracellular succinate and inflammatory pathogenesis. Nat. Metab. 2021, 3, 604–617. [Google Scholar] [CrossRef]
  54. Morrison, M.C.; Kleemann, R. Role of Macrophage Migration Inhibitory Factor in Obesity, Insulin Resistance, Type 2 Diabetes, and Associated Hepatic Co-Morbidities: A Comprehensive Review of Human and Rodent Studies. Front. Immunol. 2015, 6, 306. [Google Scholar] [CrossRef]
  55. Solans, A.; Estivill, X.; de la Luna, S. Cloning and Characterization of Human FTCD on 21q22.3, a Candidate Gene for Glutamate Formiminotransferase Deficiency. Cytogenet. Cell Genet. 2000, 88, 43–49. [Google Scholar] [CrossRef]
  56. Venkateswaran, N.; Lafita-Navarro, M.C.; Hao, Y.-H.; Kilgore, J.A.; Perez-Castro, L.; Braverman, J.; Borenstein-Auerbach, N.; Kim, M.; Lesner, N.P.; Mishra, P.; et al. MYC Promotes Tryptophan Uptake and Metabolism by the Kynurenine Pathway in Colon Cancer. Genes Dev. 2019, 33, 1236–1251. [Google Scholar] [CrossRef] [PubMed]
  57. Liu, I.; Chung, T.; Huang, W.; Hsu, C.; Liu, C.; Chiu, Y.; Huang, K.; Liao, A.T.; Lin, C. Kynurenine 3-monooxygenase (KMO), and Signal Transducer and Activator of Transcription 3 (STAT3) Expression Is Involved in Tumour Proliferation and Predicts Poor Survival in Canine Melanoma. Vet. Comp. Oncol. 2020, 19, 79–91. [Google Scholar] [CrossRef]
  58. Wajner, M.; Amaral, A.U.; Leipnitz, G.; Seminotti, B. Pathogenesis of Brain Damage in Glutaric Acidemia Type I: Lessons from the Genetic Mice Model. Int. J. Dev. Neurosci 2019, 78, 215–221. [Google Scholar] [CrossRef]
  59. Mandard, S.; Müller, M.; Kersten, S. Peroxisome Proliferator-Activated Receptor a Target Genes. Cell. Mol. Life Sci. 2004, 61, 393–416. [Google Scholar] [CrossRef]
  60. Shimada, M.; Hibi, M.; Nakagawa, T.; Hayakawa, T.; Field, C.J. High-Fructose Diet-Induced Hepatic Expression of the Scd1 Gene Is Associated with Increased Acetylation of Histones H3 and H4 and the Binding of ChREBP at the Scd1 Promoter in Rats. Biomed. Res. 2021, 42, 85–88. [Google Scholar] [CrossRef]
  61. Xu, H.; Zhang, D.L.; Yu, D.H.; Lv, C.H.; Luo, H.Y.; Wang, Z.Y. Molecular Cloning and Expression Analysis of Scd1 Gene from Large Yellow Croaker Larimichthys Crocea under Cold Stress. Gene 2015, 568, 100–108. [Google Scholar] [CrossRef] [PubMed]
  62. Sblano, S.; Cerchia, C.; Laghezza, A.; Piemontese, L.; Brunetti, L.; Leuci, R.; Gilardi, F.; Thomas, A.; Genovese, M.; Santi, A.; et al. A Chemoinformatics Search for Peroxisome Proliferator-Activated Receptors Ligands Revealed a New Pan-Agonist Able to Reduce Lipid Accumulation and Improve Insulin Sensitivity. Eur. J. Med. Chem. 2022, 235, 114240. [Google Scholar] [CrossRef] [PubMed]
Figure 1. Overview of the experimental outline.
Metabolites 13 00102 g001
Figure 2. Body composition and plasma biochemical parameters of freshwater drums induced by cold stress (n = 9): (A) crude fat content, CFC; (B) total cholesterol, TC; (C) total triglyceride, TG; (D) lipase activity, LPS; (E) Glucose, GLU; (F) α-amylase activity, AMS; (G) total protein, TP; (H) trypsin activity, TPS. The statistical differences are indicated with different superscript letters (a, b) (p < 0.05).
Metabolites 13 00102 g002
Figure 3. Transcriptome profile of freshwater drums liver induced by 2 days cold stress: (A) set diagram of DEGs; (B) up and down regulated DEGs; (C) heatmap of DEGs.
Metabolites 13 00102 g003
Figure 4. Expression of the lipid metabolism-related key genes in freshwater drums liver induced by 2 days cold stress (n = 9): (A) pancreatic lipase-related proteins, PLRP; (B) fatty acid synthesis, FAS; (C) hormone-sensitive lipase, HSL; (D) cytokine macrophage migration inhibitory factor, MIF; (E) acetyl Coenzyme A Carboxylase 1, ACC1; (F) uncoupling protein 1, UCP1. Asterisk represents the statistical difference (*, p < 0.05; **, p < 0.01).
Metabolites 13 00102 g004
Figure 5. Expression of the amino acid metabolism-related key genes in freshwater drums liver induced by 2 days cold stress (n = 9): (A) formiminotransferase cyclodeaminase, FTCD; (B) enzyme arylformamidase, AFMID; (C) glutaryl-CoA dehydrogenase, GCDH; (D) kynurenine3- monooxygenase, KMO. Asterisk represents the statistical difference (*, p <0.05).
Metabolites 13 00102 g005
Figure 6. Expression of PPARs signaling related genes in Freshwater drums liver induced by 2 days cold stress (n = 9): (A) acyl-coenzyme A oxidase, ACO; (B) carnitine palmityl -transferase 1A, CPT1a; (C) stearoylcoa desaturase-1, SCD1; (D) PPAR delta, PPARδ; (E) PPAR alpha, PPARα. Asterisk represents the statistical difference (*, p < 0.05; **, p < 0.01; ***, p < 0.001).
Metabolites 13 00102 g006
Figure 7. The metabolism of lipid and amino acid were co-related with PPARs signaling under hypothermia in freshwater drum. Asterisk represents the statistical difference (*, p < 0.05; **, p < 0.01).
Metabolites 13 00102 g007
Table 1. Amino acid content (dry weight) after 2 days temperature stress (g/100 g sample). Note: values are mean and SEM, n = 3. Values in the same line with different superscripts are significantly different (p < 0.05). Different superscript letters (a, b, c) represent the statistical difference (p < 0.05).
Amino AcidsHydrolyzed Amino AcidFree Amino Acid
25 °C18 °C10 °C25 °C18 °C10 °C
Arginine2.61 ± 0.08 a2.95 ± 0.13 a2.85 ± 0.29 a0.0157 ± 0.00639 a0.005 ± 0.00298 b0.0024 ± 0.00017 b
Histidine1.00 ± 0.04 a0.92 ± 0.05 a0.90 ± 0.10 a0.1236 ± 0.01007 a0.0107 ± 0.01044 b0.0348 ± 0.01737 b
Isoleucine1.8- ± 0.02 a2.07 ± 0.12 a2.00 ± 0.23 a0.0062 ± 0.00316 a0.0045 ± 0.00066 a0.0044 ± 0.00031 a
Leucine2.91 ± 0.04 a3.34 ± 0.18 a3.21 ± 0.36 a0.0168 ± 0.00251 a0.0095 ± 0.00135 a0.0051 ± 0.00252 a
Lysine3.48 ± 0.08 a3.78 ± 0.20 a3.80 ± 0.43 a0.1586 ± 0.01514 a0.0543 ± 0.01039 b0.1242 ± 0.01722 ab
Methionine0.85 ± 0.05 a0.87 ± 0.07 a0.82 ± 0.09 a0.0074 ± 0.00178 a0.0161 ± 0.00744 a0.0178 ± 0.01332 a
Phenylalanine1.65 ± 0.02 a1.84 ± 0.09 a1.78 ± 0.19 a0.0084 ± 0.00149 a0.0043 ± 0.00118 b0.0041 ± 0.00029 b
Threonine1.36 ± 0.02 a1.53 ± 0.07 a1.46 ± 0.15 a0.0681 ± 0.00878 a0.0344 ± 0.00307 b0.0427 ± 0.00361 b
Valine2.08 ± 0.02 a2.32 ± 0.12 a2.25 ± 0.25 a0.0428 ± 0.00213 a0.0215 ± 0.00957 a0.0227 ± 0.00926 a
total EAA17.73 ± 0.33 a19.62 ± 1.02 a19.07 ± 3.62 a0.4476 ± 0.00548 a0.1603 ± 0.01095 c0.2581 ± 0.02536 b
Alanine2.86 ± 0.09 a3.13 ± 0.12 a3.05 ± 0.26 a0.082 ± 0.00739 a0.0541 ± 0.02722 a0.0681 ± 0.00964 a
Aspartic acid4.19 ± 0.07 a4.73 ± 0.39 a4.57 ± 0.48 a0.0288 ± 0.00435 a0.0166 ± 0.00088 b0.0203 ± 0.00239 ab
Cysteine0.05 ± 0.00 a0.06 ± 0.01 a0.05 ± 0.01 a0.0006 ± 0.00019 a0.0006 ± 0.00035 a0.0003 ± 0.00009 a
Glutamic acid6.49 ± 0.11 a7.20 ± 0.35 a7.01 ± 0.73 a0.12757 ± 0.01672 a0.06913 ± 0.00636 b0.08979 ± 0.00538 ab
Glycine3.97 ± 0.23 a4.16 ± 0.09 a4.12 ± 0.35 a0.3315 ± 0.02239 a0.2898 ± 0.02433 a0.329 ± 0.05891 a
Proline2.20 ± 0.09 a2.31 ± 0.06 a2.40 ± 0.26 a0.0899 ± 0.01459 a0.0346 ± 0.01009 b0.053 ± 0.00871 ab
Serine1.46 ± 0.03 a1.65 ± 0.07 a1.57 ± 0.17 a0.0051 ± 0.00199 a0.0112 ± 0.00702 a0.0043 ± 0.00183 a
Tyrosine0.93 ± 0.03 a1.14 ± 0.06 a1.03 ± 0.12 a0.0075 ± 0.00165 a0.0014 ± 0.00127 b0.0003 ± 0.00006 b
Total NEAA22.04 ± 0.59 a24.39 ± 1.67 a23.78 ± 2.37 a0.6730 ± 0.06312 a0.4692 ± 0.06114 a0.5652 ± 0.07076 a
Disclaimer/Publisher’s Note: The statements, opinions and data contained in all publications are solely those of the individual author(s) and contributor(s) and not of MDPI and/or the editor(s). MDPI and/or the editor(s) disclaim responsibility for any injury to people or property resulting from any ideas, methods, instructions or products referred to in the content.