
Metabolomic Profiling of Hormonal Contraceptive Use in Young Females Using a Commercially Available LC-MS/MS Kit

 ,
,
Abstract
:1. Introduction
2. Materials and Methods
2.1. Cohort Recruitment and Sample Collection
2.2. Metabolomic Analyses
2.3. Statistical Analysis
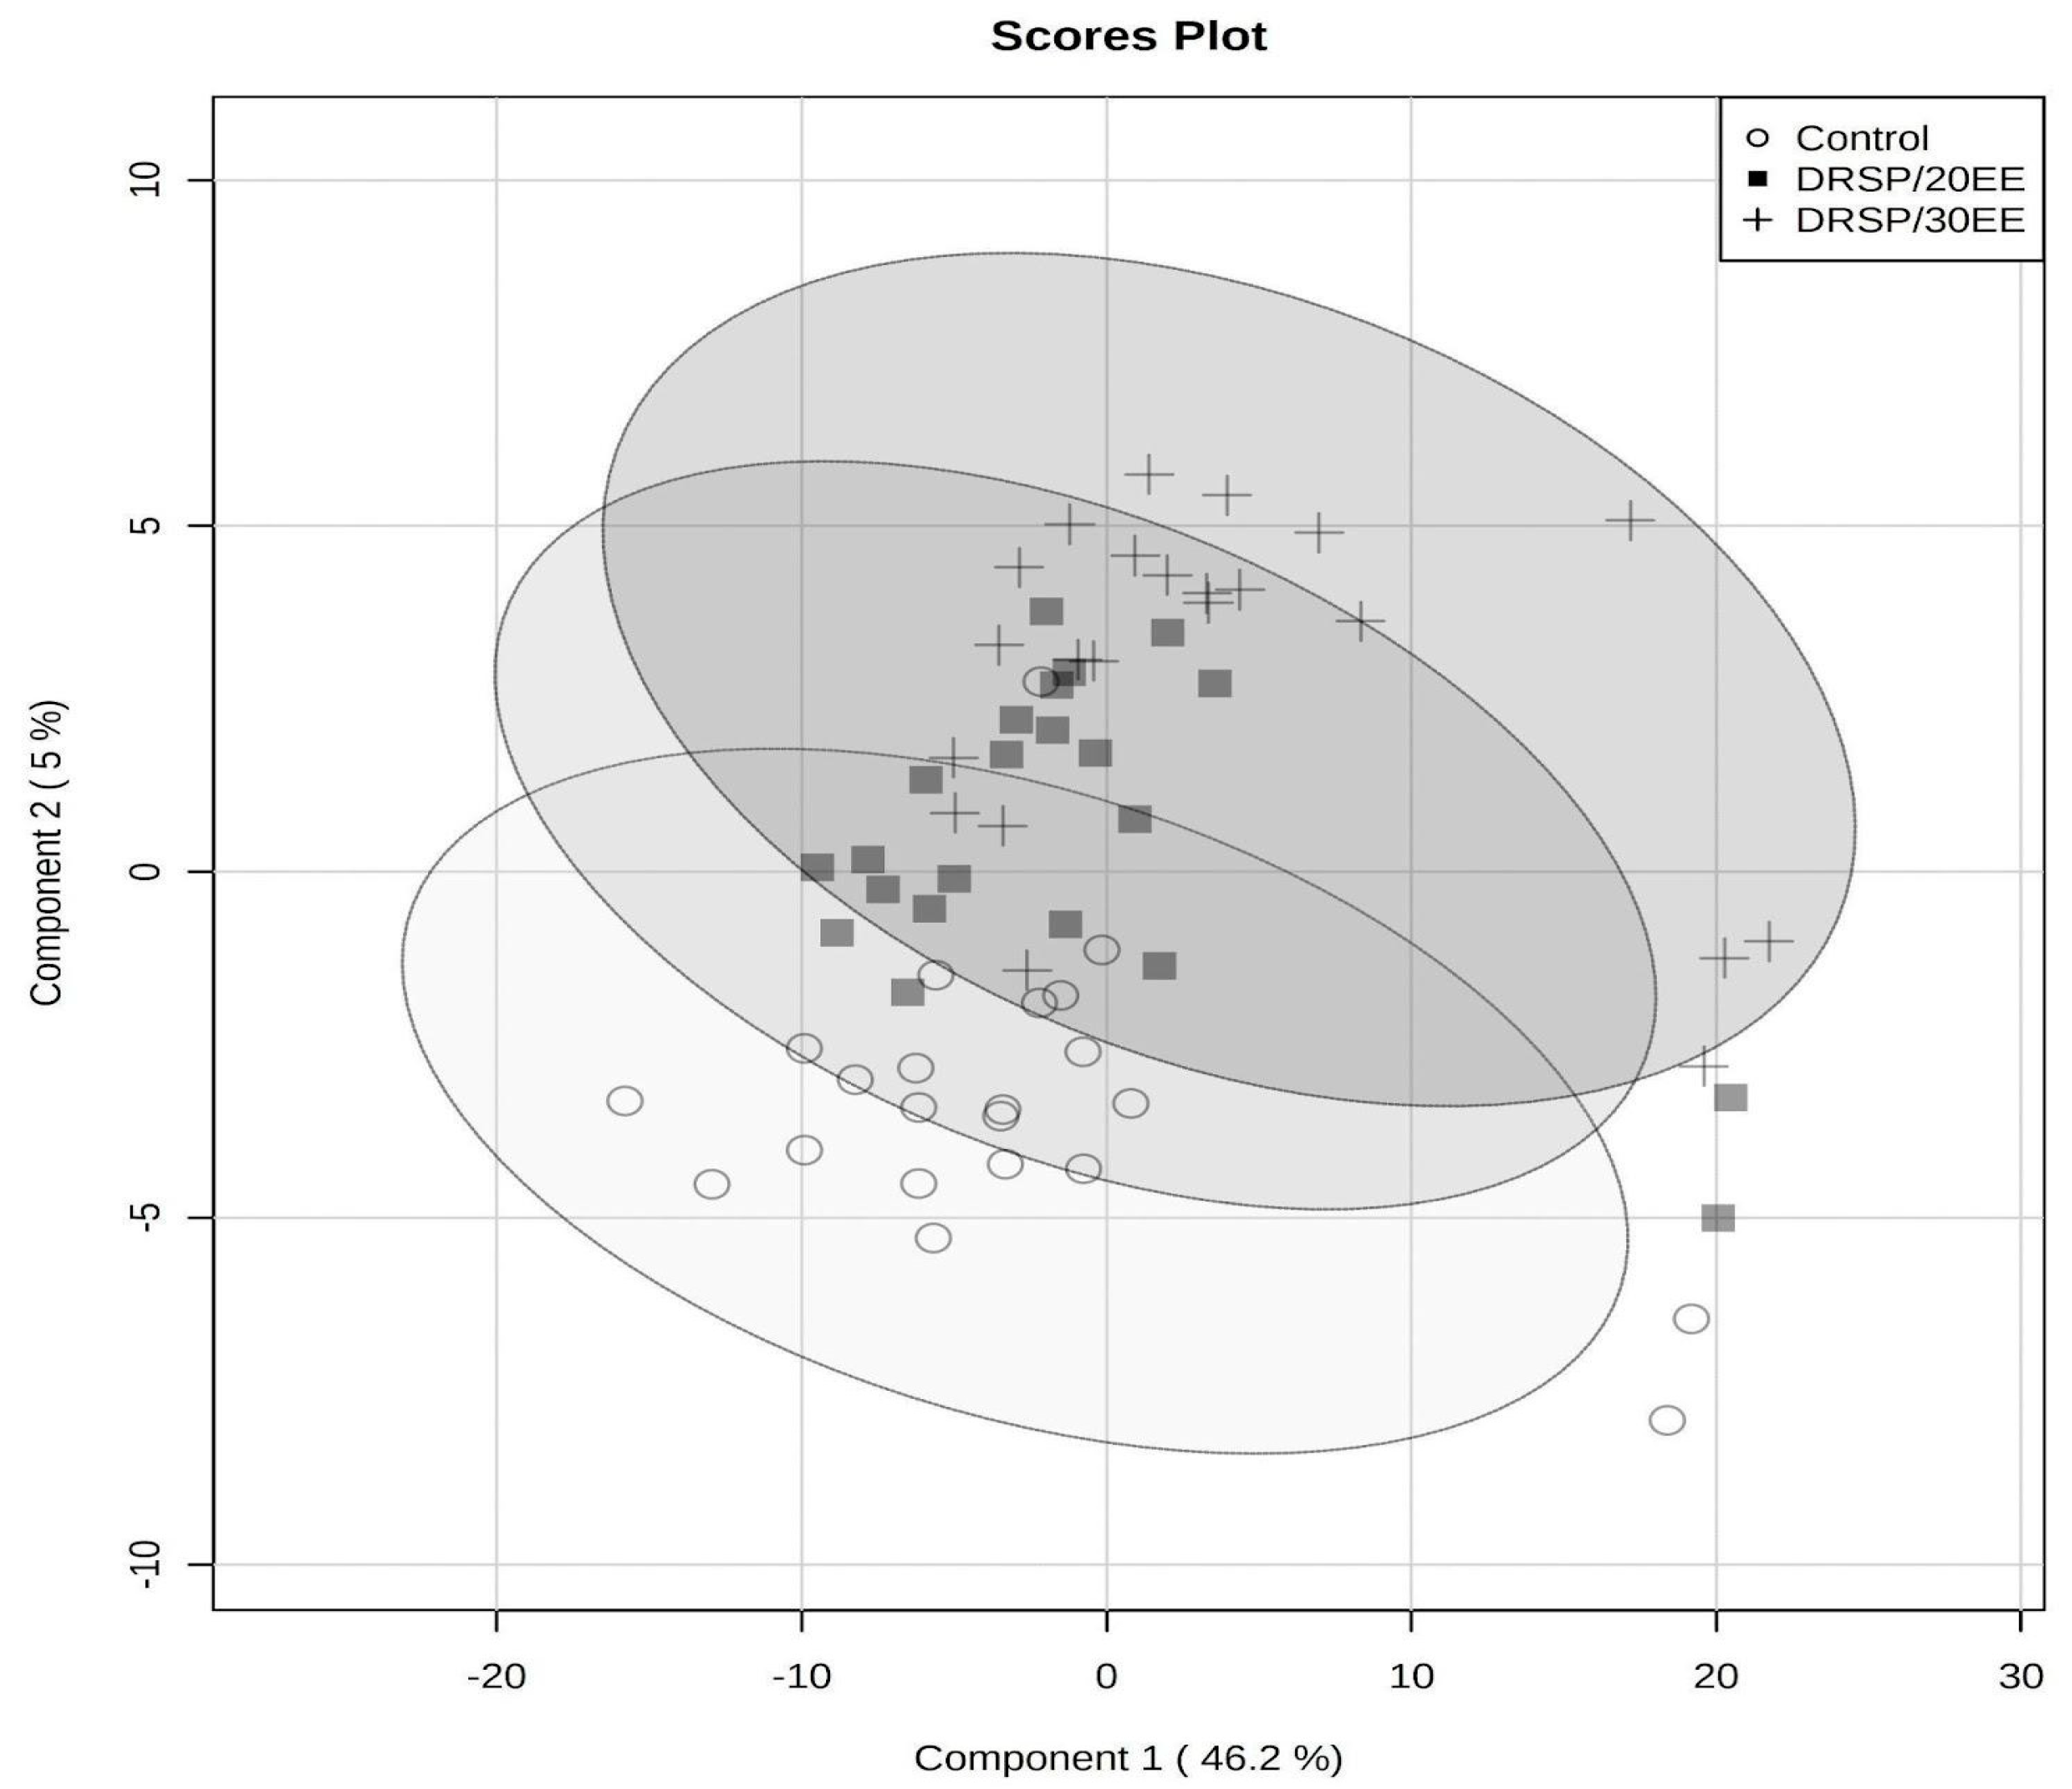
3. Results
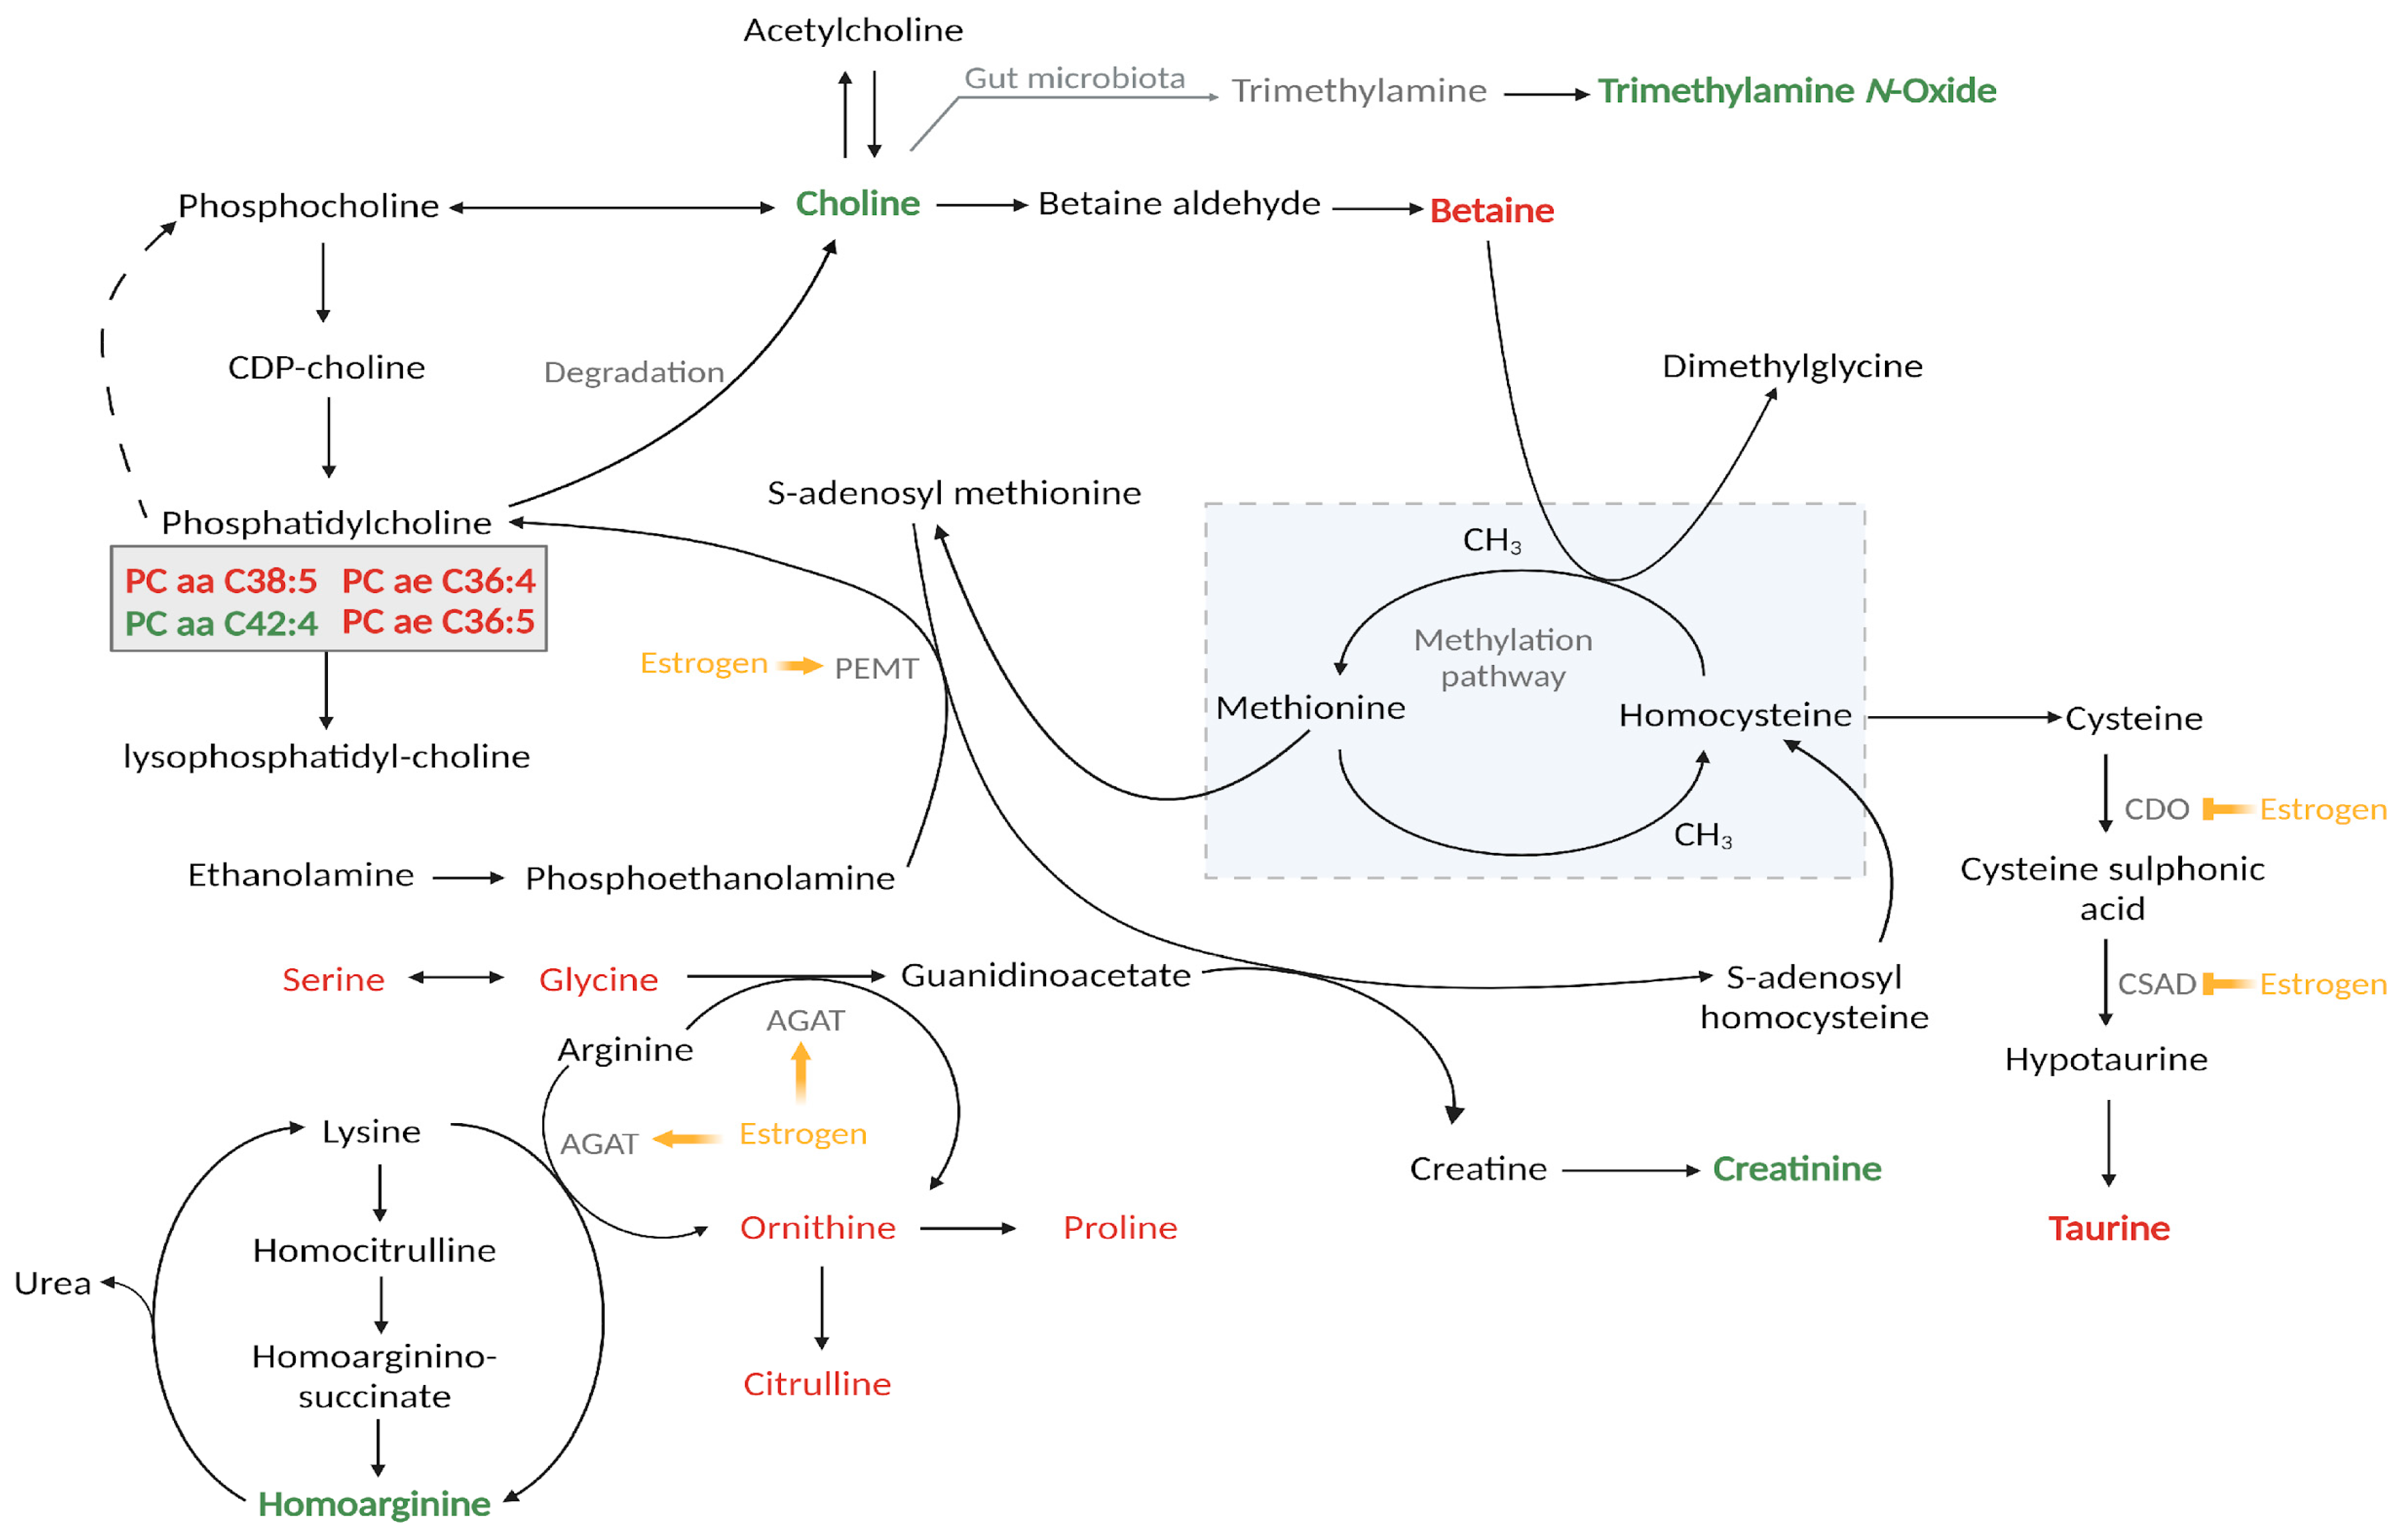
4. Discussion
Supplementary Materials
Author Contributions
Funding
Institutional Review Board Statement
Informed Consent Statement
Data Availability Statement
Conflicts of Interest
References
- United Nations. Contraceptive Use by Method 2019: Data Booklet; Department of Economic and Social Affairs, Population Division, United Nations: New York, NY, USA, 2019.
- WHO. Web Annex A. World Health Organization Model List of Essential Medicines—23rd List, 2023. In The Selection and Use of Essential Medicines 2023: Executive Summary of the Report of the 24th Who Expert Committee on the Selection and Use of Essential Medicineses; World Health Organization: Geneva, Switzerland, 2023. [Google Scholar]
- De Bastos, M.; Stegeman, B.H.; Rosendaal, F.R.; Van Hylckama Vlieg, A.; Helmerhorst, F.M.; Stijnen, T.; Dekkers, O.M. Combined Oral Contraceptives: Venous Thrombosis. Cochrane Database Syst. Rev. 2014, 3, Cd010813. [Google Scholar] [CrossRef]
- Brown, H.L.; Sherburn, I.A.; Gaff, C.; Taylor, N.; Best, S. Structured Approaches to Implementation of Clinical Genomics: A Scoping Review. Genet Med. 2022, 24, 1415–1424. [Google Scholar] [CrossRef] [PubMed]
- Moore, C.M.; Seibold, M.A. Possibilities and Promise: Leveraging Advances in Transcriptomics for Clinical Decision Making in Allergic Diseases. J. Allergy Clin. Immunol. 2022, 150, 756–765. [Google Scholar] [CrossRef]
- Alexovič, M.; Urban, P.L.; Tabani, H.; Sabo, J. Recent Advances in Robotic Protein Sample Preparation for Clinical Analysis and Other Biomedical Applications. Clin. Chim. Acta 2020, 507, 104–116. [Google Scholar] [CrossRef] [PubMed]
- Ngan, H.; Lam, K.; Li, Z.; Zhang, J.; Cai, Z. Machine Learning Facilitates the Application of Mass Spectrometry-Based Metabolomics to Clinical Analysis: A Review of Early Diagnosis of High Mortality Rate Cancers. TrAC Trends Anal. Chem. 2023, 168, 117333. [Google Scholar] [CrossRef]
- Kaddurah-Daouk, R.; Weinshilboum, R. Metabolomic Signatures for Drug Response Phenotypes: Pharmacometabolomics Enables Precision Medicine. Clin. Pharmacol. Ther. 2015, 98, 71–75. [Google Scholar] [CrossRef]
- Swanepoel, A.C.; Bester, J.; Emmerson, O.; Soma, P.; Beukes, D.; Van Reenen, M.; Loots, D.T.; Du Preez, I. Serum Metabolome Changes in Relation to Prothrombotic State Induced by Combined Oral Contraceptives with Drospirenone and Ethinylestradiol. OMICS J. Integr. Biol. 2020, 24, 404–414. [Google Scholar] [CrossRef] [PubMed]
- Swanepoel, A.; Bester, J.; Kruger, Y.; Davoren, E.; Du Preez, I. The Effect of Combined Oral Contraceptives Containing Drospirenone and Ethinylestradiol on Serum Levels of Amino Acids and Acylcarnitines. Metabolomics 2021, 17, 75. [Google Scholar] [CrossRef]
- Swanepoel, A.; Lindeque, B.; Swart, P.; Abdool, Z.; Pretorius, E. Estrogen Causes Ultrastructural Changes of Fibrin Networks During the Menstrual Cycle: A Qualitative Investigation. Microsc. Res. Tech. 2014, 77, 594–601. [Google Scholar] [CrossRef]
- Reif, S.; Snelder, N.; Blode, H. Characterisation of the Pharmacokinetics of Ethinylestradiol and Drospirenone in Extended-Cycle Regimens: Population Pharmacokinetic Analysis from a Randomised Phase Iii Study. J. Fam. Plann. Reprod. Health Care 2013, 39, e1–e13. [Google Scholar] [CrossRef]
- Lovett, J.L.; Chima, M.A.; Wexler, J.K.; Arslanian, K.J.; Friedman, A.B.; Yousif, C.B.; Strassmann, B.I. Oral Contraceptives Cause Evolutionarily Novel Increases in Hormone Exposure: A Risk Factor for Breast Cancer. Evol. Med. Public Health 2017, 2017, 97–108. [Google Scholar] [CrossRef] [PubMed]
- Pang, Z.; Chong, J.; Zhou, G.; De Lima Morais, D.A.; Chang, L.; Barrette, M.; Gauthier, C.; Jacques, P.É.; Li, S.; Xia, J. Metaboanalyst 5.0: Narrowing the Gap between Raw Spectra and Functional Insights. Nucleic Acids Res. 2021, 49, W388–W396. [Google Scholar] [CrossRef] [PubMed]
- Meulenberg, P.M.M.; Ross, H.A.; Swinkels, L.M.J.W.; Benraad, T.J. The Effect of Oral Contraceptives on Plasma-Free and Salivary Cortisol and Cortisone. Clin. Chim. Acta 1987, 165, 379–385. [Google Scholar] [CrossRef]
- Perogamvros, I.; Ray, D.W.; Trainer, P.J. Regulation of Cortisol Bioavailability—Effects on Hormone Measurement and Action. Nat. Rev. Endocrinol. 2012, 8, 717–727. [Google Scholar] [CrossRef] [PubMed]
- Jilma, B.; Cvitko, T.; Winter-Fabry, A.; Petroczi, K.; Quehenberger, P.; Blann, A.D. High Dose Dexamethasone Increases Circulating P-Selectin and Von Willebrand Factor Levels in Healthy Men. Thromb. Haemost. 2005, 94, 797–801. [Google Scholar] [PubMed]
- Casonato, A.; Pontara, E.; Boscaro, M.; Sonino, N.; Sartorello, F.; Ferasin, S.; Girolami, A. Abnormalities of Von Willebrand Factor Are Also Part of the Prothrombotic State of Cushing’s Syndrome. Blood Coagul. Fibrinolysis 1999, 10, 145–151. [Google Scholar] [CrossRef]
- Patrassi, G.M.; Sartori, M.T.; Viero, M.L.; Scarano, L.; Boscaro, M.; Girolami, A. The Fibrinolytic Potential in Patients with Cushing’s Disease: A Clue to Their Hypercoagulable State. Blood Coagul. Fibrinolysis 1992, 3, 789–793. [Google Scholar] [CrossRef]
- Boscaro, M.; Sonino, N.; Scarda, A.; Barzon, L.; Fallo, F.; Sartori, M.T.; Patrassi, G.M.; Girolami, A. Anticoagulant Prophylaxis Markedly Reduces Thromboembolic Complications in Cushing’s Syndrome. J. Clin. Endocrinol. Metab. 2002, 87, 3662–3666. [Google Scholar]
- Fatti, L.M.; Bottasso, B.; Invitti, C.; Coppola, R.; Cavagnini, F.; Mannucci, P.M. Markers of Activation of Coagulation and Fibrinolysis in Patients with Cushing’s Syndrome. J. Endocrinol. Invest 2000, 23, 145–150. [Google Scholar] [CrossRef]
- Isidori, A.M.; Minnetti, M.; Sbardella, E.; Graziadio, C.; Grossman, A.B. Mechanisms in Endocrinology: The Spectrum of Haemostatic Abnormalities in Glucocorticoid Excess and Defect. Eur. J. Endocrinol. 2015, 173, R101–R113. [Google Scholar] [CrossRef]
- Majoor, C.J.; Sneeboer, M.M.; De Kievit, A.; Meijers, J.C.; Van der Poll, T.; Lutter, R.; Bel, E.H.; Kamphuisen, P.W. The Influence of Corticosteroids on Hemostasis in Healthy Subjects. J. Thromb. Haemost. 2016, 14, 716–723. [Google Scholar] [CrossRef] [PubMed]
- Rogers, K.M.; Bonar, C.A.; Estrella, J.L.; Yang, S. Inhibitory Effect of Glucocorticoid on Coronary Artery Endothelial Function. Am. J. Physiol. Heart Circ. Physiol. 2002, 283, H1922–H1928. [Google Scholar] [CrossRef] [PubMed]
- Wallerath, T.; Witte, K.; Schäfer, S.C.; Schwarz, P.M.; Prellwitz, W.; Wohlfart, P.; Kleinert, H.; Lehr, H.A.; Lemmer, B.; Förstermann, U. Down-Regulation of the Expression of Endothelial No Synthase Is Likely to Contribute to Glucocorticoid-Mediated Hypertension. Proc. Natl. Acad. Sci. USA 1999, 96, 13357–13362. [Google Scholar] [CrossRef]
- Iuchi, T.; Akaike, M.; Mitsui, T.; Ohshima, Y.; Shintani, Y.; Azuma, H.; Matsumoto, T. Glucocorticoid Excess Induces Superoxide Production in Vascular Endothelial Cells and Elicits Vascular Endothelial Dysfunction. Circ. Res. 2003, 92, 81–87. [Google Scholar] [CrossRef] [PubMed]
- Seppälä, I.; Oksala, N.; Jula, A.; Kangas, A.J.; Soininen, P.; Hutri-Kähönen, N.; März, W.; Meinitzer, A.; Juonala, M.; Kähönen, M.; et al. The Biomarker and Causal Roles of Homoarginine in the Development of Cardiometabolic Diseases: An Observational and Mendelian Randomization Analysis. Sci. Rep. 2017, 7, 1130. [Google Scholar] [CrossRef]
- Helm, T.; Varsi, K.; Fløtre, C.H.; Lund, A.; Svingen, G.F.T.; Ueland, P.M.; Bjørke-Monsen, A.-L. Plasma Homoarginine Concentrations According to Use of Hormonal Contraception. Sci. Rep. 2018, 8, 12217. [Google Scholar] [CrossRef]
- Li, J.; Leghari, I.H.; He, B.; Zeng, W.; Mi, Y.; Zhang, C. Estrogen Stimulates Expression of Chicken Hepatic Vitellogenin Ii and Very Low-Density Apolipoprotein Ii through Er-A. Theriogenology 2014, 82, 517–524. [Google Scholar] [CrossRef]
- Valtonen, P.; Laitinen, T.; Lyyra-Laitinen, T.; Raitakari, O.T.; Juonala, M.; Viikari, J.S.; Heiskanen, N.; Vanninen, E.; Punnonen, K.; Heinonen, S. Serum L-Homoarginine Concentration Is Elevated During Normal Pregnancy and Is Related to Flow-Mediated Vasodilatation. Circ. J. 2008, 72, 1879–1884. [Google Scholar] [CrossRef]
- Wyss, M.; Kaddurah-Daouk, R. Creatine and Creatinine Metabolism. Physiol. Rev. 2000, 80, 1107–1213. [Google Scholar] [CrossRef]
- Wang, Q.; Würtz, P.; Auro, K.; Morin-Papunen, L.; Kangas, A.J.; Soininen, P.; Tiainen, M.; Tynkkynen, T.; Joensuu, A.; Havulinna, A.S.; et al. Effects of Hormonal Contraception on Systemic Metabolism: Cross-Sectional and Longitudinal Evidence. Int. J. Epidemiol. 2016, 45, 1445–1457. [Google Scholar] [CrossRef]
- Zeisel, S.H. Metabolic Crosstalk between Choline/1-Carbon Metabolism and Energy Homeostasis. Clin. Chem. Lab. Med. 2013, 51, 467–475. [Google Scholar] [CrossRef] [PubMed]
- Zeisel, S.H.; Niculescu, M.D. Choline and Phosphatidylcholine. In Modern Nutrition in Health and Disease, 10th ed.; Shils, M.E., Shike, M., Eds.; Lippincott Williams & Wilkins: Philadelphia, PA, USA, 2006; pp. 225–236. [Google Scholar]
- Velzing-Aarts, F.V.; Holm, P.I.; Fokkema, M.R.; Van der Dijs, F.P.; Ueland, P.M.; Muskiet, F.A. Plasma Choline and Betaine and Their Relation to Plasma Homocysteine in Normal Pregnancy1. Am. J. Clin. Nutr. 2005, 81, 1383–1389. [Google Scholar] [CrossRef] [PubMed]
- Fernàndez-Roig, S.; Cavallé-Busquets, P.; Fernandez-Ballart, J.D.; Ballesteros, M.; Berrocal-Zaragoza, M.I.; Salat-Batlle, J.; Ueland, P.M.; Murphy, M.M. Low Folate Status Enhances Pregnancy Changes in Plasma Betaine and Dimethylglycine Concentrations and the Association between Betaine and Homocysteine. Am. J. Clin. Nutr. 2013, 97, 1252–1259. [Google Scholar] [CrossRef] [PubMed]
- Rios-Avila, L.; Coats, B.; Chi, Y.; Midttun, Ø.; Ueland, P.M.; Stacpoole, P.W.; Gregory, J.F. Metabolite Profile Analysis Reveals Association of Vitamin B-6 with Metabolites Related to One-Carbon Metabolism and Tryptophan Catabolism but Not with Biomarkers of Inflammation in Oral Contraceptive Users and Reveals the Effects of Oral Contraceptives on These Processes. J. Nutr. 2015, 145, 87–95. [Google Scholar] [PubMed]
- Jacobs, T. An Analytical Method to Investigate the Metabolites and Co-Factors of the Methionine-Homocysteine Cycle in Women Using Combined Oral Contraceptives and Non-Users; North-West University, Potchefstroom Campus: Potchefstroom, South Africa, 2022. [Google Scholar]
- Velasquez, M.T.; Ramezani, A.; Manal, A.; Raj, D.S. Trimethylamine N-Oxide: The Good, the Bad and the Unknown. Toxins 2016, 8, 326. [Google Scholar] [CrossRef] [PubMed]
- Tappaz, M.L. Taurine Biosynthetic Enzymes and Taurine Transporter: Molecular Identification and Regulations. Neurochem. Res. 2004, 29, 83–96. [Google Scholar] [CrossRef]
- Abebe, W.; Mozaffari, M.S. Role of Taurine in Vasculature: An Overview of Experimental and Human Studies. Am. J. Cardiovasc. Dis. 2011, 1, 293–311. [Google Scholar]
- Ma, Q.; Zhao, J.; Cao, W.; Liu, J.; Cui, S. Estradiol Decreases Taurine Level by Reducing Cysteine Sulfinic Acid Decarboxylase via the Estrogen Receptor-A in Female Mice Liver. Am. J. Physiol. Gastrointest. 2014, 308, G277–G286. [Google Scholar] [CrossRef]
- Rose, D.P.; Leklem, J.E.; Brown, R.R.; Potera, C. Effect of Oral Contraceptives and Vitamin B6 Supplements on Alanine and Glycine Metabolism. Am. J. Clin. Nutr. 1976, 29, 956–960. [Google Scholar] [CrossRef]
- Campesi, I.; Sanna, M.; Zinellu, A.; Carru, C.; Rubattu, L.; Bulzomi, P.; Seghieri, G.; Tonolo, G.; Palermo, M.; Rosano, G.; et al. Oral Contraceptives Modify DNA Methylation and Monocyte-Derived Macrophage Function. Biol. Sex Differ. 2012, 3, 4. [Google Scholar] [CrossRef]
- Ruoppolo, M.; Campesi, I.; Scolamiero, E.; Pecce, R.; Caterino, M.; Cherchi, S.; Mercuro, G.; Tonolo, G.; Franconi, F. Serum Metabolomic Profiles Suggest Influence of Sex and Oral Contraceptive Use. Am. J. Transl. Res. 2014, 6, 614–624. [Google Scholar]
- Anderson, G.M. Determination of Indolepropionic Acid and Related Indoles in Plasma, Plasma Ultrafiltrate, and Saliva. Metabolites 2023, 13, 602. [Google Scholar] [CrossRef] [PubMed]
- Rose, D.P.; Adams, P.W. Oral Contraceptives and Tryptophan Metabolism: Effects of Oestrogen in Low Dose Combined with a Progestagen and of a Low-Dose Progestagen (Megestrol Acetate) Given Alone. J. Clin. Pathol. 1972, 25, 252. [Google Scholar] [CrossRef] [PubMed]
- Wilson, S.M.C.; Bivins, B.N.; Russell, K.A.; Bailey, L.B. Oral Contraceptive Use: Impact on Folate, Vitamin B6, and Vitamin B12 Status. Nutr. Rev. 2011, 69, 572–583.47. [Google Scholar] [CrossRef]
- Sun, C.; Lin, C.; Pan, H.; Lee, C.; Lu, S.; Hsieh, Y.; Huang, S.; Huang, H. Clinical Association between the Metabolite of Healthy Gut Microbiota, 3-Indolepropionic Acid and Chronic Kidney Disease. Clin. Nutr. 2019, 38, 2945–2948. [Google Scholar] [CrossRef] [PubMed]
- Kumar, P.; Lee, J.H.; Lee, J. Diverse Roles of Microbial Indole Compounds in Eukaryotic Systems. Biol. Rev. 2021, 96, 2522–2545. [Google Scholar] [CrossRef]
- Cason, C.A.; Dolan, K.T.; Sharma, G.; Tao, M.; Kulkarni, R.; Helenowski, I.B.; Doane, B.M.; Avram, M.J.; McDermott, M.M.; Chang, E.B.; et al. Plasma Microbiome-Modulated Indole- and Phenyl-Derived Metabolites Associate with Advanced Atherosclerosis and Postoperative Outcomes. J. Vasc. Surg. 2018, 68, 1552–1562.e7. [Google Scholar] [CrossRef]
- Hua, X.; Cao, Y.; Morgan, D.M.; Miller, K.; Chin, S.M.; Bellavance, D.; Khalili, H. Longitudinal Analysis of the Impact of Oral Contraceptive Use on the Gut Microbiome. J. Med. Microbiol. 2022, 71, 001512. [Google Scholar] [CrossRef]
- Gialeraki, A.; Valsami, S.; Pittaras, T.; Panayiotakopoulos, G.; Politou, M. Oral Contraceptives and Hrt Risk of Thrombosis. Clin. Appl. Thromb. 2017, 24, 217–225. [Google Scholar] [CrossRef]
- Li, F.; Zhu, L.; Zhang, J.; He, H.; Qin, Y.; Cheng, Y.; Xie, Z. Oral Contraceptive Use and Increased Risk of Stroke: A Dose–Response Meta-Analysis of Observational Studies. Front. Neurol. 2019, 10, 993. [Google Scholar] [CrossRef]

| One-Way ANOVA | CONTROLS | DRSP/20EE | DRSP/30EE | ||||||
|---|---|---|---|---|---|---|---|---|---|
| Metabolite | Metabolite Class | PLS-DA VIP (Avg Comp 1, 2, 3) | p-Value | Fisher’s LSD | Average Concentration (uM) (SEM) | Average Concentration (uM) (SEM) | Increased (↑) or Decreased (↓) with COC (Double Arrow Indicates Group with More Prominent Effect) | Average Concentration (uM) (SEM) | Increased (↑) or Decreased (↓) with COC |
| Trimethylamine N-oxide | Amine oxides | 1.07 | Not significant | 3.714 (0.61) | 4.185 (0.68) | ↑ | 5.712 (0.98) | ↑↑ | |
| Glutamine | Aminoacids | 2.94 | 1.36 × 10⁻⁶ | Control–DRSP/20EE; Control–DRSP/30EE | 718.4 (27.0) | 557.4 (17.0) | ↓↓ | 564.4 (15.7) | ↓ |
| Glycine | Aminoacids | 2.02 | 3.87 × 10⁻⁵ | Control–DRSP/20EE; Control–DRSP/30EE | 386.2 (23.5) | 251.0 (11.8) | ↓↓ | 298.9 (28.1) | ↓ |
| Isoleucine | Aminoacids | 1.25 | Not significant | 68.55 (4.61) | 54.10 (4.22) | ↓ | 53.82 (4.84) | ↓↓ | |
| Leucine | Aminoacids | 1.03 | Not significant | 113.8 (6.62) | 103.0 (4.49) | ↓ | 101.8 (5.63) | ↓↓ | |
| Proline | Aminoacids | 1.02 | Not significant | 280.1 (27.1) | 221.3 (24.0) | ↓ | 219.3 (29.8) | ↓↓ | |
| Serine | Aminoacids | 2.05 | Not significant | 167.5 (7.24) | 140.4 (5.72) | ↓ | 139.5 (6.60) | ↓↓ | |
| Tyrosine | Aminoacids | 1.02 | Not significant | 103.1 (11.6) | 72.12 (7.44) | ↓↓ | 79.14 (11.0) | ↓ | |
| 1-Methylhistidine | Aminoacids related | 1.47 | Not significant | 3.840 (0.28) | 4.119 (0.19) | ↑ | 4.621 (0.29) | ↑↑ | |
| 3-Methylhistidine | Aminoacids related | 1.21 | Not significant | 2.653 (0.70) | 2.996 (0.62) | ↑ | 4.782 (0.95) | ↑↑ | |
| β-Aminobutyric acid # | Aminoacids related | 1.01 | Not significant | 3.28 (0.36) | 3.304 (0.48) | ↑ | 2.635 (0.48) | ↓ | |
| Betaine | Aminoacids related | 3.47 | 1.60 × 10⁻¹⁰ | Control–DRSP/20EE; Control–DRSP/30EE | 34.18 (2.75) | 14.69 (1.21) | ↓↓ | 14.99 (1.41) | ↓ |
| Citrulline | Aminoacids related | 1.36 | Not significant | 26.61 (2.33) | 21.23 (1.21) | ↓ | 19.52 (1.80) | ↓↓ | |
| Creatinine | Aminoacids related | 1.21 | Not significant | 68.88 (2.92) | 71.59 (2.24) | ↑ | 76.36 (3.08) | ↑↑ | |
| Homoarginine | Aminoacids related | 1.59 | Not significant | 1.844 (0.16) | 2.383 (0.13) | ↑ | 2.425 (0.17) | ↑↑ | |
| Ornithine | Aminoacids related | 1.76 | Not significant | 59.63 (5.99) | 35.89 (2.07) | ↓↓ | 36.37 (2.86) | ↓ | |
| Proline betaine | Aminoacids related | 1.02 | Not significant | 5.030 (1.40) | 3.751 (1.07) | ↓↓ | 3.915 (1.24) | ↓ | |
| Taurine | Aminoacids related | 1.19 | Not significant | 22.47 (0.91) | 21.17 (1.12) | ↓ | 20.33 (1.02) | ↓↓ | |
| Hippuric acid | Carboxylic acids | 1.35 | Not significant | 2.045 (0.36) | 3.47 (0.65) | ↑↑ | 3.007 (0.38) | ↑ | |
| Cer(d18:1/22:0) * | Ceramides | 1.57 | Not significant | 0.379 (0.05) | 0.253 (0.05) | ↓ | 0.139 (0.03) | ↓↓ | |
| Cer(d18:1/23:0) * | Ceramides | 2.09 | 1.37 × 10⁻³ | Control–DRSP/30EE; DRSP/20EE–DRSP/30EE | 0.821 (0.13) | 0.693 (0.12) | ↓ | 0.203 (0.08) | ↓↓ |
| Cer(d18:1/24:1) *# | Ceramides | 1.09 | Not significant | 1.313 (0.30) | 0.993 (0.22) | ↓ | 1.445 (0.23) | ↑ | |
| Cer(d18:0/20:0) * | Dihydro-ceramides | 1.42 | Not significant | 0.043 (0.00) | 0.039 (0.00) | ↓ | 0.023 (0.00) | ↓↓ | |
| HexCer(d18:1/22:0) * | Hexosyl-ceramides | 1.21 | Not significant | 1.821 (0.39) | 1.313 (0.35) | ↓ | 0.636 (0.26) | ↓↓ | |
| Cortisol | Hormones | 2.93 | 1.18 × 10⁻⁵ | DRSP/20EE–Control; DRSP/30EE–Control | 0.253 (0.02) | 0.405 (0.03) | ↑ | 0.513 (0.03) | ↑↑ |
| 3-Indolepropionic acid | Indoles derivatives | 1.12 | Not significant | 0.911 (0.14) | 0.803 (0.10) | ↓ | 0.598 (0.08) | ↓↓ | |
| PC aa C32:1 # | Phosphatidyl-cholines | 1.02 | Not significant | 5.270 (0.69) | 5.304 (0.64) | ↑ | 4.811 (0.72) | ↓ | |
| PC aa C34:3 # | Phosphatidyl-cholines | 1.02 | Not significant | 9.674 (1.04) | 9.923 (1.00) | ↑ | 8.411 (0.95) | ↓ | |
| PC aa C36:3 # | Phosphatidyl-cholines | 1.03 | Not significant | 88.06 (9.33) | 96.47 (9.10) | ↑ | 81.97 (9.09) | ↓ | |
| PC aa C38:5 | Phosphatidyl-cholines | 1.01 | Not significant | 26.30 (2.63) | 25.30 (2.14) | ↓ | 22.30 (2.13) | ↓↓ | |
| PC aa C42:4 | Phosphatidyl-cholines | 1.05 | Not significant | 0.158 (0.03) | 0.161 (0.02) | ↑ | 0.185 (0.02) | ↑↑ | |
| PC ae C36:4 | Phosphatidyl-cholines | 1.00 | Not significant | 10.10 (0.88) | 9.776 (0.88) | ↓ | 9.251 (0.84) | ↓↓ | |
| PC ae C36:5 | Phosphatidyl-cholines | 1.00 | Not significant | 7.953 (0.73) | 7.401 (0.74) | ↓↓ | 7.550 (0.71) | ↓ | |
| TG(16:0_38:4) # | Triglycerides | 1.04 | Not significant | 3.145 (0.77) | 3.581 (0.45) | ↑ | 2.249 (0.33) | ↓ | |
| TG(16:0_40:7) * | Triglycerides | 1.09 | Not significant | 1.801 (0.36) | 1.649 (0.31) | ↓ | 0.763 (0.21) | ↓↓ | |
| TG(18:0_36:2) | Triglycerides | 1.26 | Not significant | 11.36 (1.81) | 9.309 (1.02) | ↓ | 5.703 (1.31) | ↓↓ | |
| TG(18:1_30:2) | Triglycerides | 1.19 | Not significant | 1.682 (0.13) | 1.492 (0.12) | ↓ | 1.184 (0.10) | ↓↓ | |
| TG(18:1_34:4) * | Triglycerides | 1.10 | Not significant | 1.647 (0.40) | 1.523 (0.29) | ↓ | 1.349 (0.21) | ↓↓ | |
| TG(18:1_38:5) # | Triglycerides | 1.00 | Not significant | 2.593 (0.52) | 2.679 (0.35) | ↑ | 2.238 (0.32) | ↓ | |
| TG(18:2_28:0) * | Triglycerides | 1.70 | Not significant | 1.141 (0.21) | 0.850 (0.23) | ↓ | 0.304 (0.11) | ↓↓ | |
| TG(18:2_33:1) # | Triglycerides | 1.01 | Not significant | 2.085 (0.38) | 2.489 (0.37) | ↑ | 1.747 (0.27) | ↓ | |
| TG(18:2_35:3) *# | Triglycerides | 1.09 | Not significant | 0.564 (0.11) | 0.606 (0.09) | ↑ | 0.262 (0.08) | ↓ | |
| TG(18:2_36:5) * | Triglycerides | 1.07 | Not significant | 5.518 (1.40) | 3.08 (0.59) | ↓ | 1.770 (0.40) | ↓↓ | |
| TG(18:3_34:3) * | Triglycerides | 1.09 | Not significant | 3.889 (1.04) | 2.503 (0.65) | ↓ | 1.200 (0.41) | ↓↓ | |
| TG(18:3_36:2) | Triglycerides | 1.13 | Not significant | 6.652 (1.26) | 5.364 (0.74) | ↓ | 2.851 (0.61) | ↓↓ | |
| TG(20:4_35:3) | Triglycerides | 1.01 | Not significant | 0.116 (0.01) | 0.086 (0.01) | ↓ | 0.078 (0.01) | ↓↓ | |
| TG(22:4_32:0) * | Triglycerides | 1.63 | Not significant | 0.154 (0.02) | 0.153 (0.02) | ↓ | 0.067 (0.02) | ↓↓ | |
| TG(22:5_32:0) * | Triglycerides | 1.23 | Not significant | 0.218 (0.05) | 0.304 (0.05) | ↑↑ | 0.274 (0.04) | ↑ | |
| Choline | Vitamins & cofactors | 1.98 | 6.33 × 10⁻⁴ | DRSP/20EE–Control; DRSP/30EE–Control | 14.10 (0.56) | 18.25 (0.99) | ↑↑ | 18.00 (0.81) | ↑ |
Disclaimer/Publisher’s Note: The statements, opinions and data contained in all publications are solely those of the individual author(s) and contributor(s) and not of MDPI and/or the editor(s). MDPI and/or the editor(s) disclaim responsibility for any injury to people or property resulting from any ideas, methods, instructions or products referred to in the content. |
© 2023 by the authors. Licensee MDPI, Basel, Switzerland. This article is an open access article distributed under the terms and conditions of the Creative Commons Attribution (CC BY) license (https://creativecommons.org/licenses/by/4.0/).
Share and Cite
Grobler, T.; Opperman, M.; Bester, J.; Swanepoel, A.C.; du Preez, I. Metabolomic Profiling of Hormonal Contraceptive Use in Young Females Using a Commercially Available LC-MS/MS Kit. Metabolites 2023, 13, 1092. https://doi.org/10.3390/metabo13101092
Grobler T, Opperman M, Bester J, Swanepoel AC, du Preez I. Metabolomic Profiling of Hormonal Contraceptive Use in Young Females Using a Commercially Available LC-MS/MS Kit. Metabolites. 2023; 13(10):1092. https://doi.org/10.3390/metabo13101092
Chicago/Turabian StyleGrobler, Tania, Monique Opperman, Janette Bester, Albe Carina Swanepoel, and Ilse du Preez. 2023. "Metabolomic Profiling of Hormonal Contraceptive Use in Young Females Using a Commercially Available LC-MS/MS Kit" Metabolites 13, no. 10: 1092. https://doi.org/10.3390/metabo13101092
APA StyleGrobler, T., Opperman, M., Bester, J., Swanepoel, A. C., & du Preez, I. (2023). Metabolomic Profiling of Hormonal Contraceptive Use in Young Females Using a Commercially Available LC-MS/MS Kit. Metabolites, 13(10), 1092. https://doi.org/10.3390/metabo13101092