In this section, a Petri net-based model of the interaction pathways between DM and atherosclerosis, along with its analysis, is presented. It is worth noting that the model’s foundation is built upon data exclusively derived from the established and peer-reviewed biological and medical literature. This implies that the initial design and structure of the model are based on previously published experimental and clinical findings.
The model was analyzed using t-invariants, MCT sets, and through knockout analysis. By employing established Petri net methodologies, a solid theoretical foundation for the conclusions is ensured. The systematic nature of our modeling and analysis methods allows for replication by other researchers using identical data sources and tools. While the conclusions are rooted solely in silico analyses, they are consistent with experimental and clinical literature.
3.2. Knockout Analysis Based on t-Invariants
Scenario 1. Analysis of the importance of each functional biological unit (MCT set) and some selected transitions in the considered model.
As a next step, we have conducted the knockout analysis of the studied model. First, to estimate the importance of each functional biological activity (represented by non-trivial and trivial MCT sets) of the net, each of them has been knocked out. The impact of turning off a single unit on the model was measured by the number of transitions affected by such a knockout. A transition is affected by a knockout if it is present only in the supports of the affected t-invariants (i.e., t-invariants that have knocked-out transitions in their supports). For example, if transition is knocked out, then transition is not considered to be affected by if it is present in at least one t-invariant that does not contain in its support.
The results of the knockout analysis are given in
Table 2 (single transitions that have a significant effect, i.e., affecting more than 2% of all transitions, have been shown). Since knocking out any transition belonging to an MCT set has exactly the same impact on t-invariants, two values are given for each MCT set in
Table 2. The first one provides the percentage of all disabled transitions, including those comprising the MCT set, while the second one, given in parenthesis, is the percentage of transitions outside of the knocked-out MCT set that are also disabled.
The results indicate that the most critical to the analyzed model are the following pathways: protein kinase C pathway, NADP usage, NADPH formation, ROS reaction with NO, and atherosclerosis development affected by ROS and oxidized LDL. All these processes contribute to the onset and progression of atherosclerosis and the associated oxidative stress.
Furthermore, recent research has revealed that hyperglycemia induces oxidative stress by promoting the production of ROS. This phenomenon is initiated by the activation of diverse molecular pathways, including PKC (
and
) activation, advanced glycation end products (AGEs) formation, enhanced polyol pathway flux, and hyperactivation of the hexosamine pathway [
1,
48]. Thus, the results obtained are in line with those of recent studies.
Table 2.
The impact of a knockout of selected net elements (MCT sets or single transitions) depending on the percentage of affected transitions, calculated on the basis of both approaches described in [
49] and simulation knockout (identically as in [
43,
44]).
| MCT Set/Transition | Biological Function | Affected Transitions |
|---|
| Protein kinase C pathway | 69.23% (48.75%) |
| NADP usage | 52.56% |
| NADPH formation | 50.00% |
| Atherosclerosis development and progression affected by ROS and oxidized LDL | 44.87% (29.51%) |
| ROS reaction with NO | 34.62% |
| Antioxidant defense mechanism involving glutathione-dependent enzymes | 32.05% (29.49%) |
| Activation of the thromboxane receptor leading to apoptosis, vascular muscle cell activation, and vascular cell adhesion molecules expression | 24.36% (21.80%) |
| Activation of proatherogenic proteins leading to atherosclerosis progression | 20.51% (19.23) |
| Impact of peroxynitrite on nitric oxide (NO) synthesis | 15.38% (14.10%) |
| Vasoconstriction and endothelial dysfunction induced by PGI synthase disruption and inactivation | 14.10% (12.82%) |
| ROS production by AGE-RAGE complex | 3.85% |
| Metabolic pathway that converts glucose into glyceraldehyde 3-phosphate | 2.56% (0%) |
| Increased production of ROS as a consequence of mitochondrial dysfunction resulting from hyperglycemia | 1.28% (0%) |
| Glucose uptake and transport across the cell membrane | 1.28% (0%) |
Scenario 2. Inhibition of PKC (β and γ) pathway in glucose metabolism.
Many studies have established that hyperglycemia-induced atherosclerosis is significantly influenced by the activation of PKC (
and
), which induces various cellular responses, including the expression of growth factors, activation of different signaling pathways, and increase in oxidative stress [
19]. In addition, impaired antioxidant defense can cause persistent high levels of ROS, leading to inflammatory and apoptotic responses in diabetic cells. PKC (
and
)-dependent activation of nicotinamide adenine dinucleotide phosphate (NADPH) oxidase contributes to increased ROS generation. It has been shown that inhibiting PKC (
and
) can reduce the induction of NADPH oxidase in a high-glucose environment [
48].
To simulate the impact of PKC (
and
) inhibition, we have removed the following transitions from the net:
(PKC (
and
) expression) and
(PKC (
and
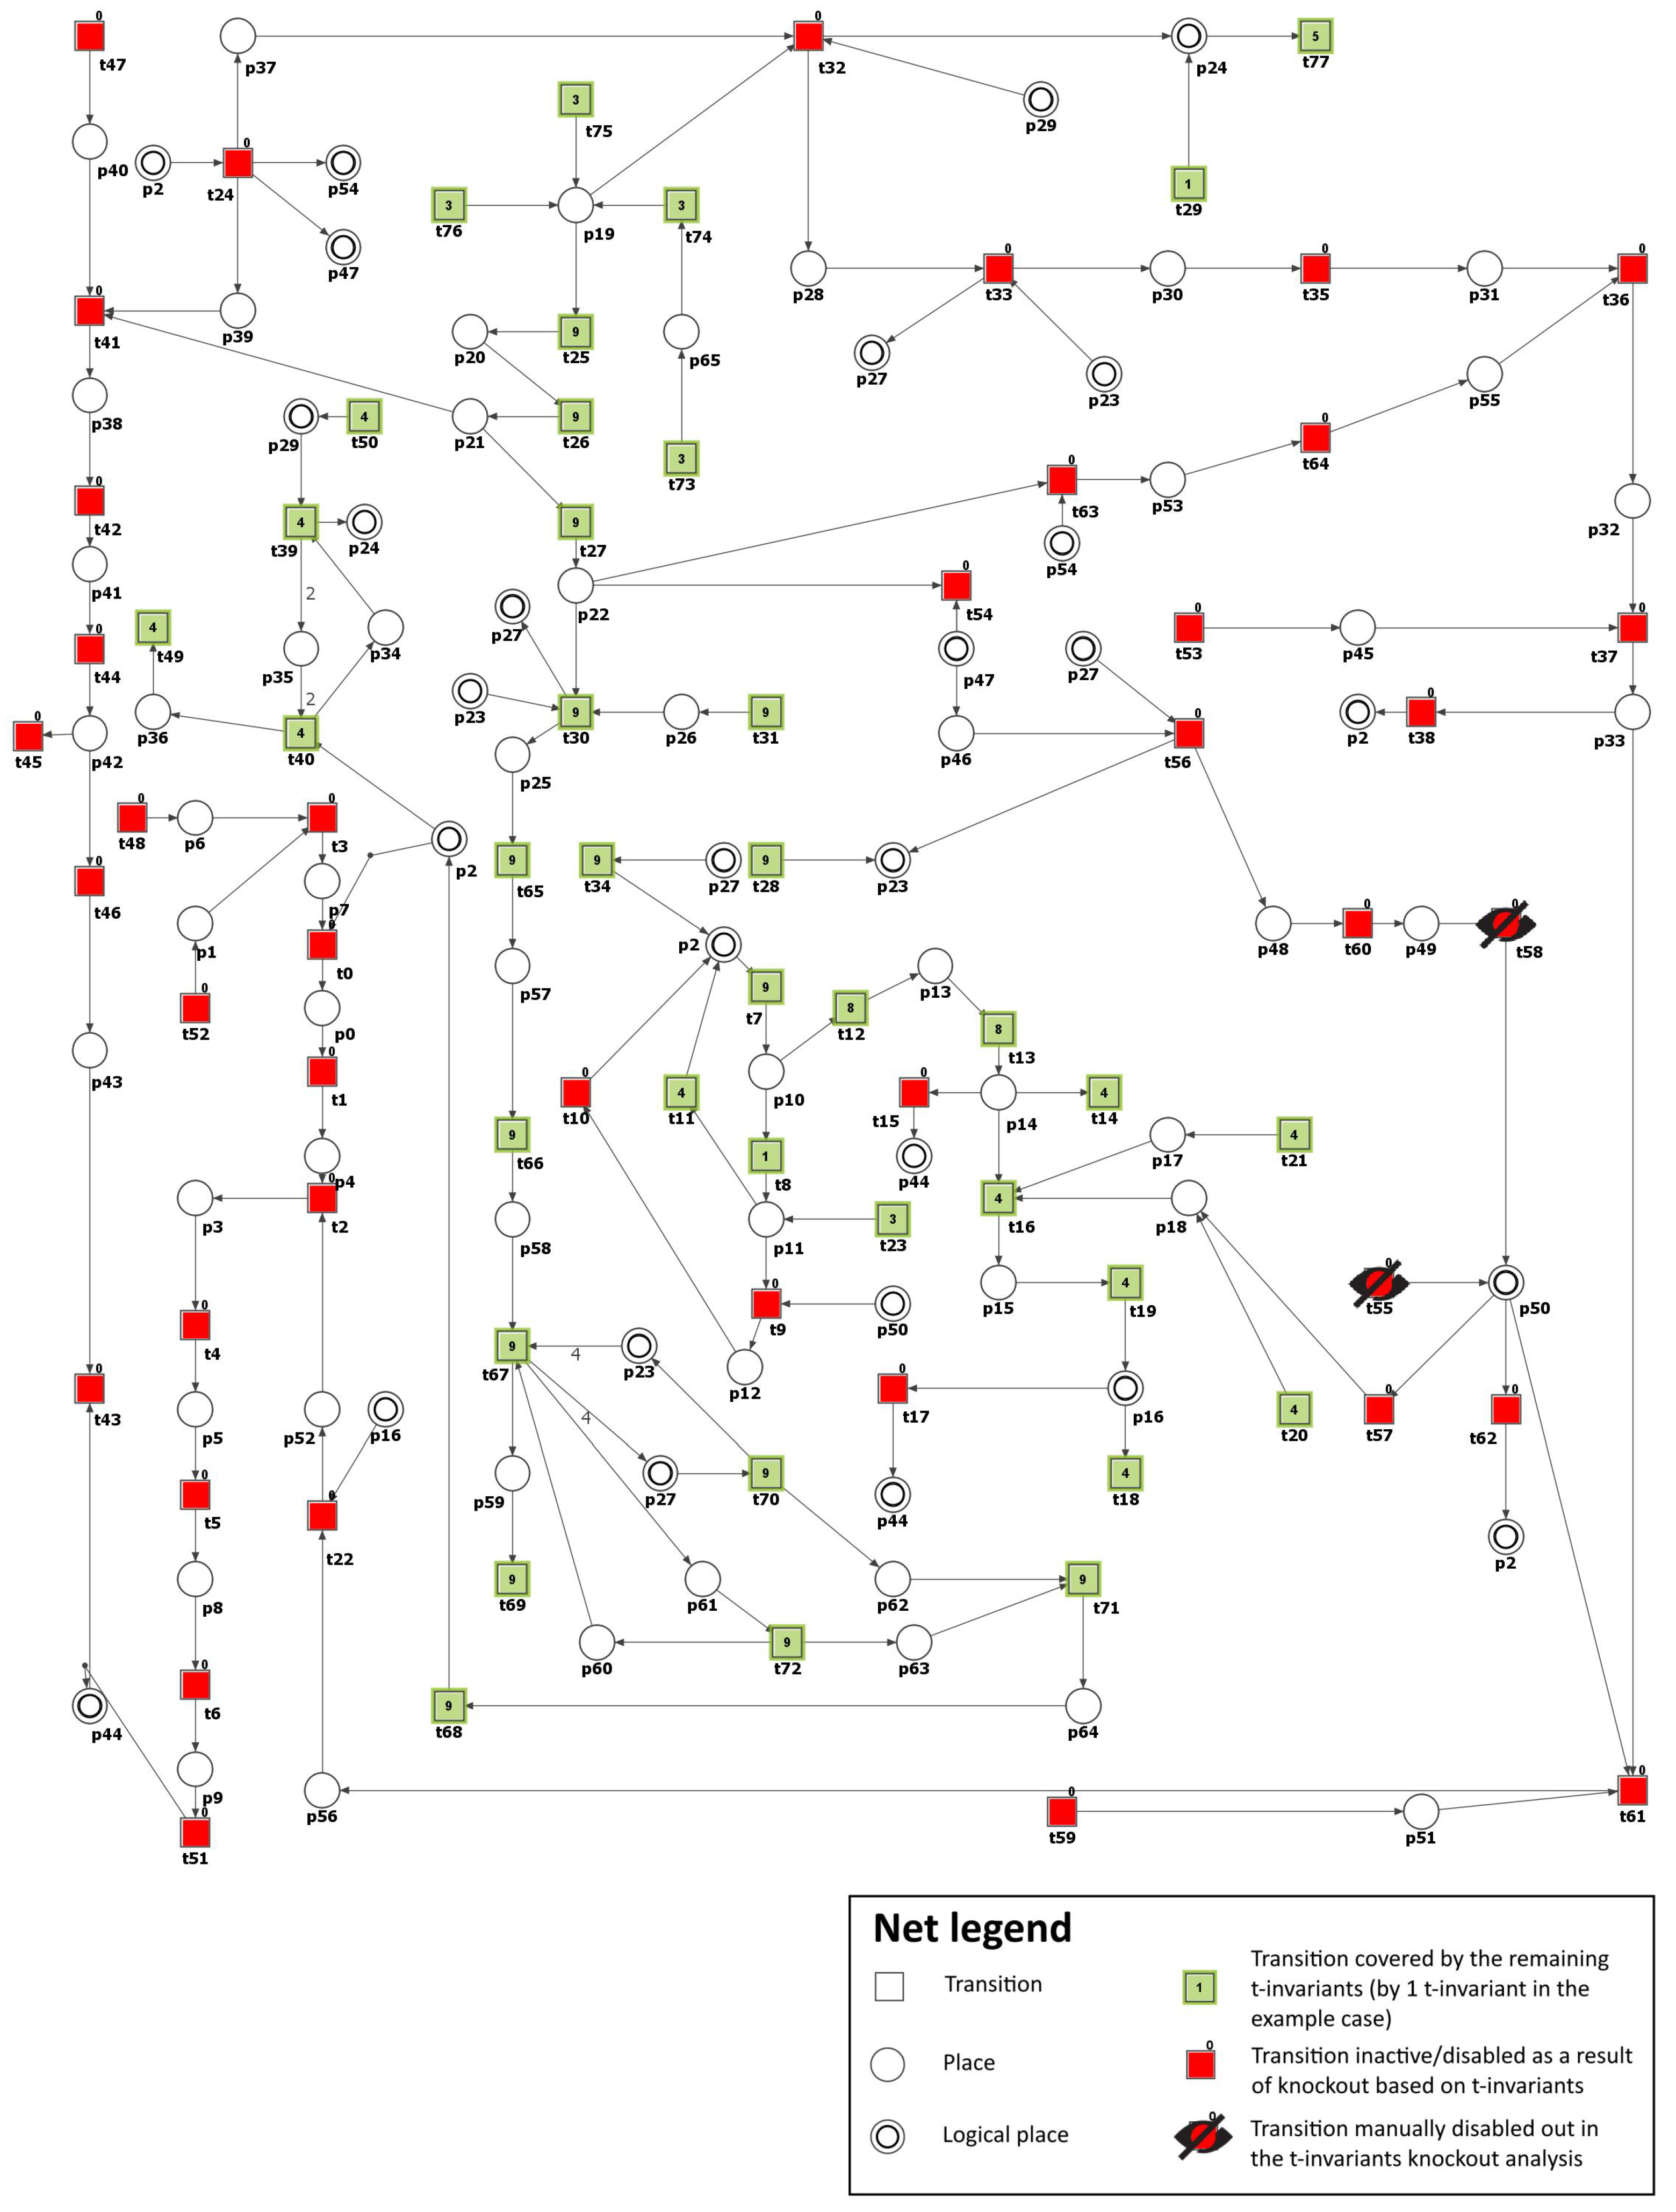
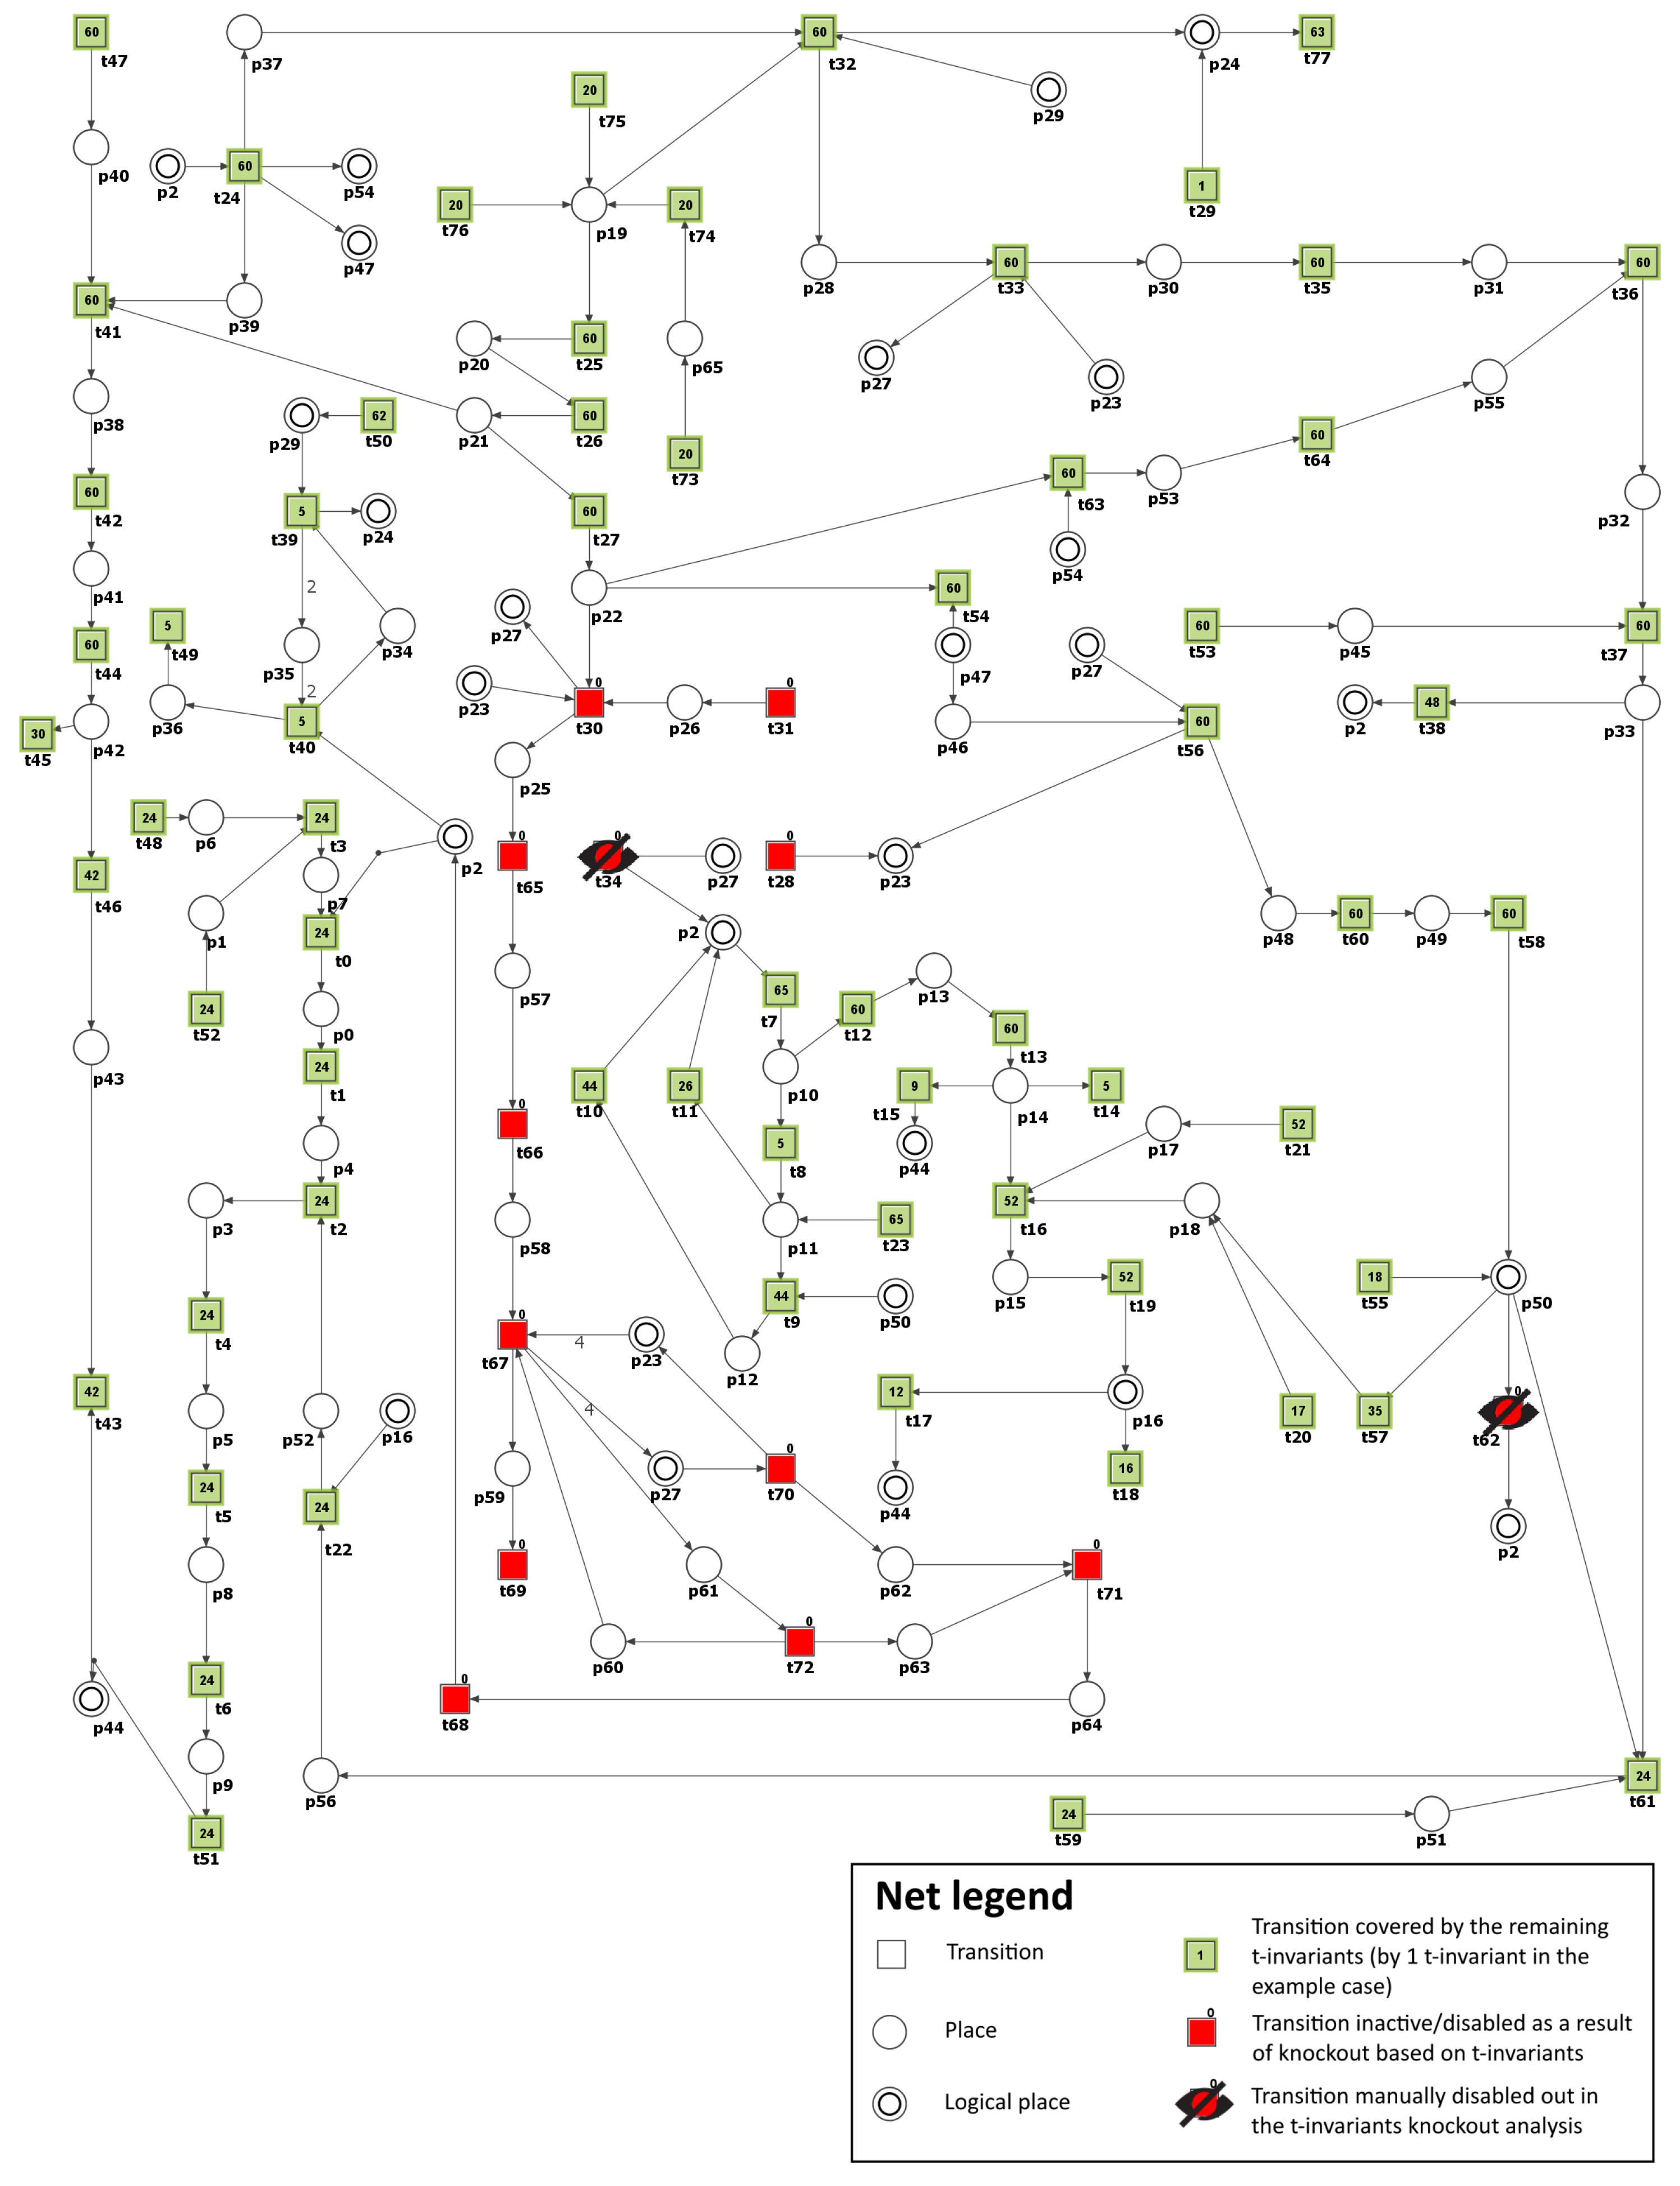
) activation by DAG). Consequently, the number of t-invariants that contribute to the progression of atherosclerosis decreased from 90 to 0 (see
Figure 4 and
Table 3), as observed. This implies that the development of atherosclerosis has been halted in the modeled system.
In addition, by knocking out transitions
and
, the following transitions and MCT sets were excluded:
,
,
,
,
,
,
,
,
,
,
, which are engaged in the activation of proatherogenic proteins, NADPH oxidase by protein kinase C, atherosclerosis progression affected by ROS, and degradation of atheroprotective proteins. Simultaneously, the glucose metabolism and the defense mechanism against oxidation, which includes enzymes dependent on glutathione, remained unaffected. The oxidative stress was significantly decreased but was still observed, with 13 out of 149 t-invariants remaining, as calculated by Holmes [
45] (based on place
(ROS)).
These findings align with the results presented in [
19]. However, although researchers have revealed the potential effect of PKC inhibition in attenuating the progression of microvascular complications in diabetes, only the PKC
inhibitor ruboxistaurin (RBX) has shown potential for use in diabetic retinopathy. Still, other PKC inhibitors have not shown satisfactory results [
50]. RBX has undergone phase III clinical trials and is awaiting approval for treating diabetic retinopathy in the U.S. and Europe [
51]. While more profound studies are needed to confirm the findings, the ongoing studies suggest that PKC (
and
) may hold promise not only in the context of diabetic retinopathy but also, in general, for atherosclerosis associated with diabetes.
Scenario 3. Inhibition of polyol pathway in glucose metabolism.
In health conditions, when glucose homeostasis is maintained, the polyol pathway constitutes a secondary route of glucose metabolism that operates in parallel with glycolysis. However, glucose flux through this pathway increases significantly during hyperglycemia, resulting in excessive sorbitol formation and accounting for up to 30% of total glucose consumption. This leads to the depletion of reducing equivalents and accumulation of osmotically active polyols [
52].
Aldose reductase (AR) is the first enzyme of the polyol pathway catalyzing the conversion of glucose to sorbitol. In hyperglycemia, AR reduces high levels of intracellular glucose to sorbitol, and this reaction consumes NADPH, a cofactor necessary to regenerate reduced glutathione, a key antioxidant. Therefore, decreasing the level of reduced glutathione, AR increases the intracellular potential for oxidative stress. In addition, DM is associated with platelet hyperactivity, and AR is involved in it since it was found to synergistically modulate the platelet response to both hyperglycemia and collagen exposure in human platelets through a signaling pathway involving ROS, PKC, and MAPK [
53]. Human AR expression in transgenic mice has been observed to accelerate DM-related atherosclerosis, suggesting that AR may play an important role in atherothrombosis [
54]. Moreover, AR gene polymorphisms have been found to be associated with most diabetic complications [
55].
Apart from being involved in diabetic complications, AR also plays several other physiological roles, which include (1) the production of intermediates facilitating the production of AGE precursors; (2) a process that diverts glucose from glycolysis and glucose oxidation; (3) participation in the metabolism of steroids, norepinephrine intermediates, aldehyde detoxification or glutathionylated derivatives; and (4) modulating lipid metabolism through the ability of AR to regulate histone deacetylase 3 (HDAC3) degradation and consequently PPAR
activation [
55]. However, there are still conflicting reports regarding AR’s roles in mammals in physiological and pathophysiological conditions. On the one hand, previous studies have suggested a beneficial role for AR in the detoxification of toxic lipid aldehydes produced by oxidative stress; on the other hand, the accelerated flux of sorbitol through the polyol pathway, thanks to AR, and the resulting increase in oxidative stress observed in DM is strongly associated with the development of secondary complications of DM. The fact that AR, aldehyde reductases, and aldehyde dehydrogenases can generally compete for different aldehydes makes it challenging to determine the specific physiological role of AR.
Due to numerous properties, AR has recently gained attention, and its inhibitors are of pharmacotherapeutic interest to the pharmaceutical community as potential and promising agents down-regulating major inflammatory pathologies [
25,
56,
57]. AR inhibitors such as epalrestat have been shown to protect against diabetic peripheral neuropathy by mitigating oxidative stress and inhibiting polyol pathways [
58].
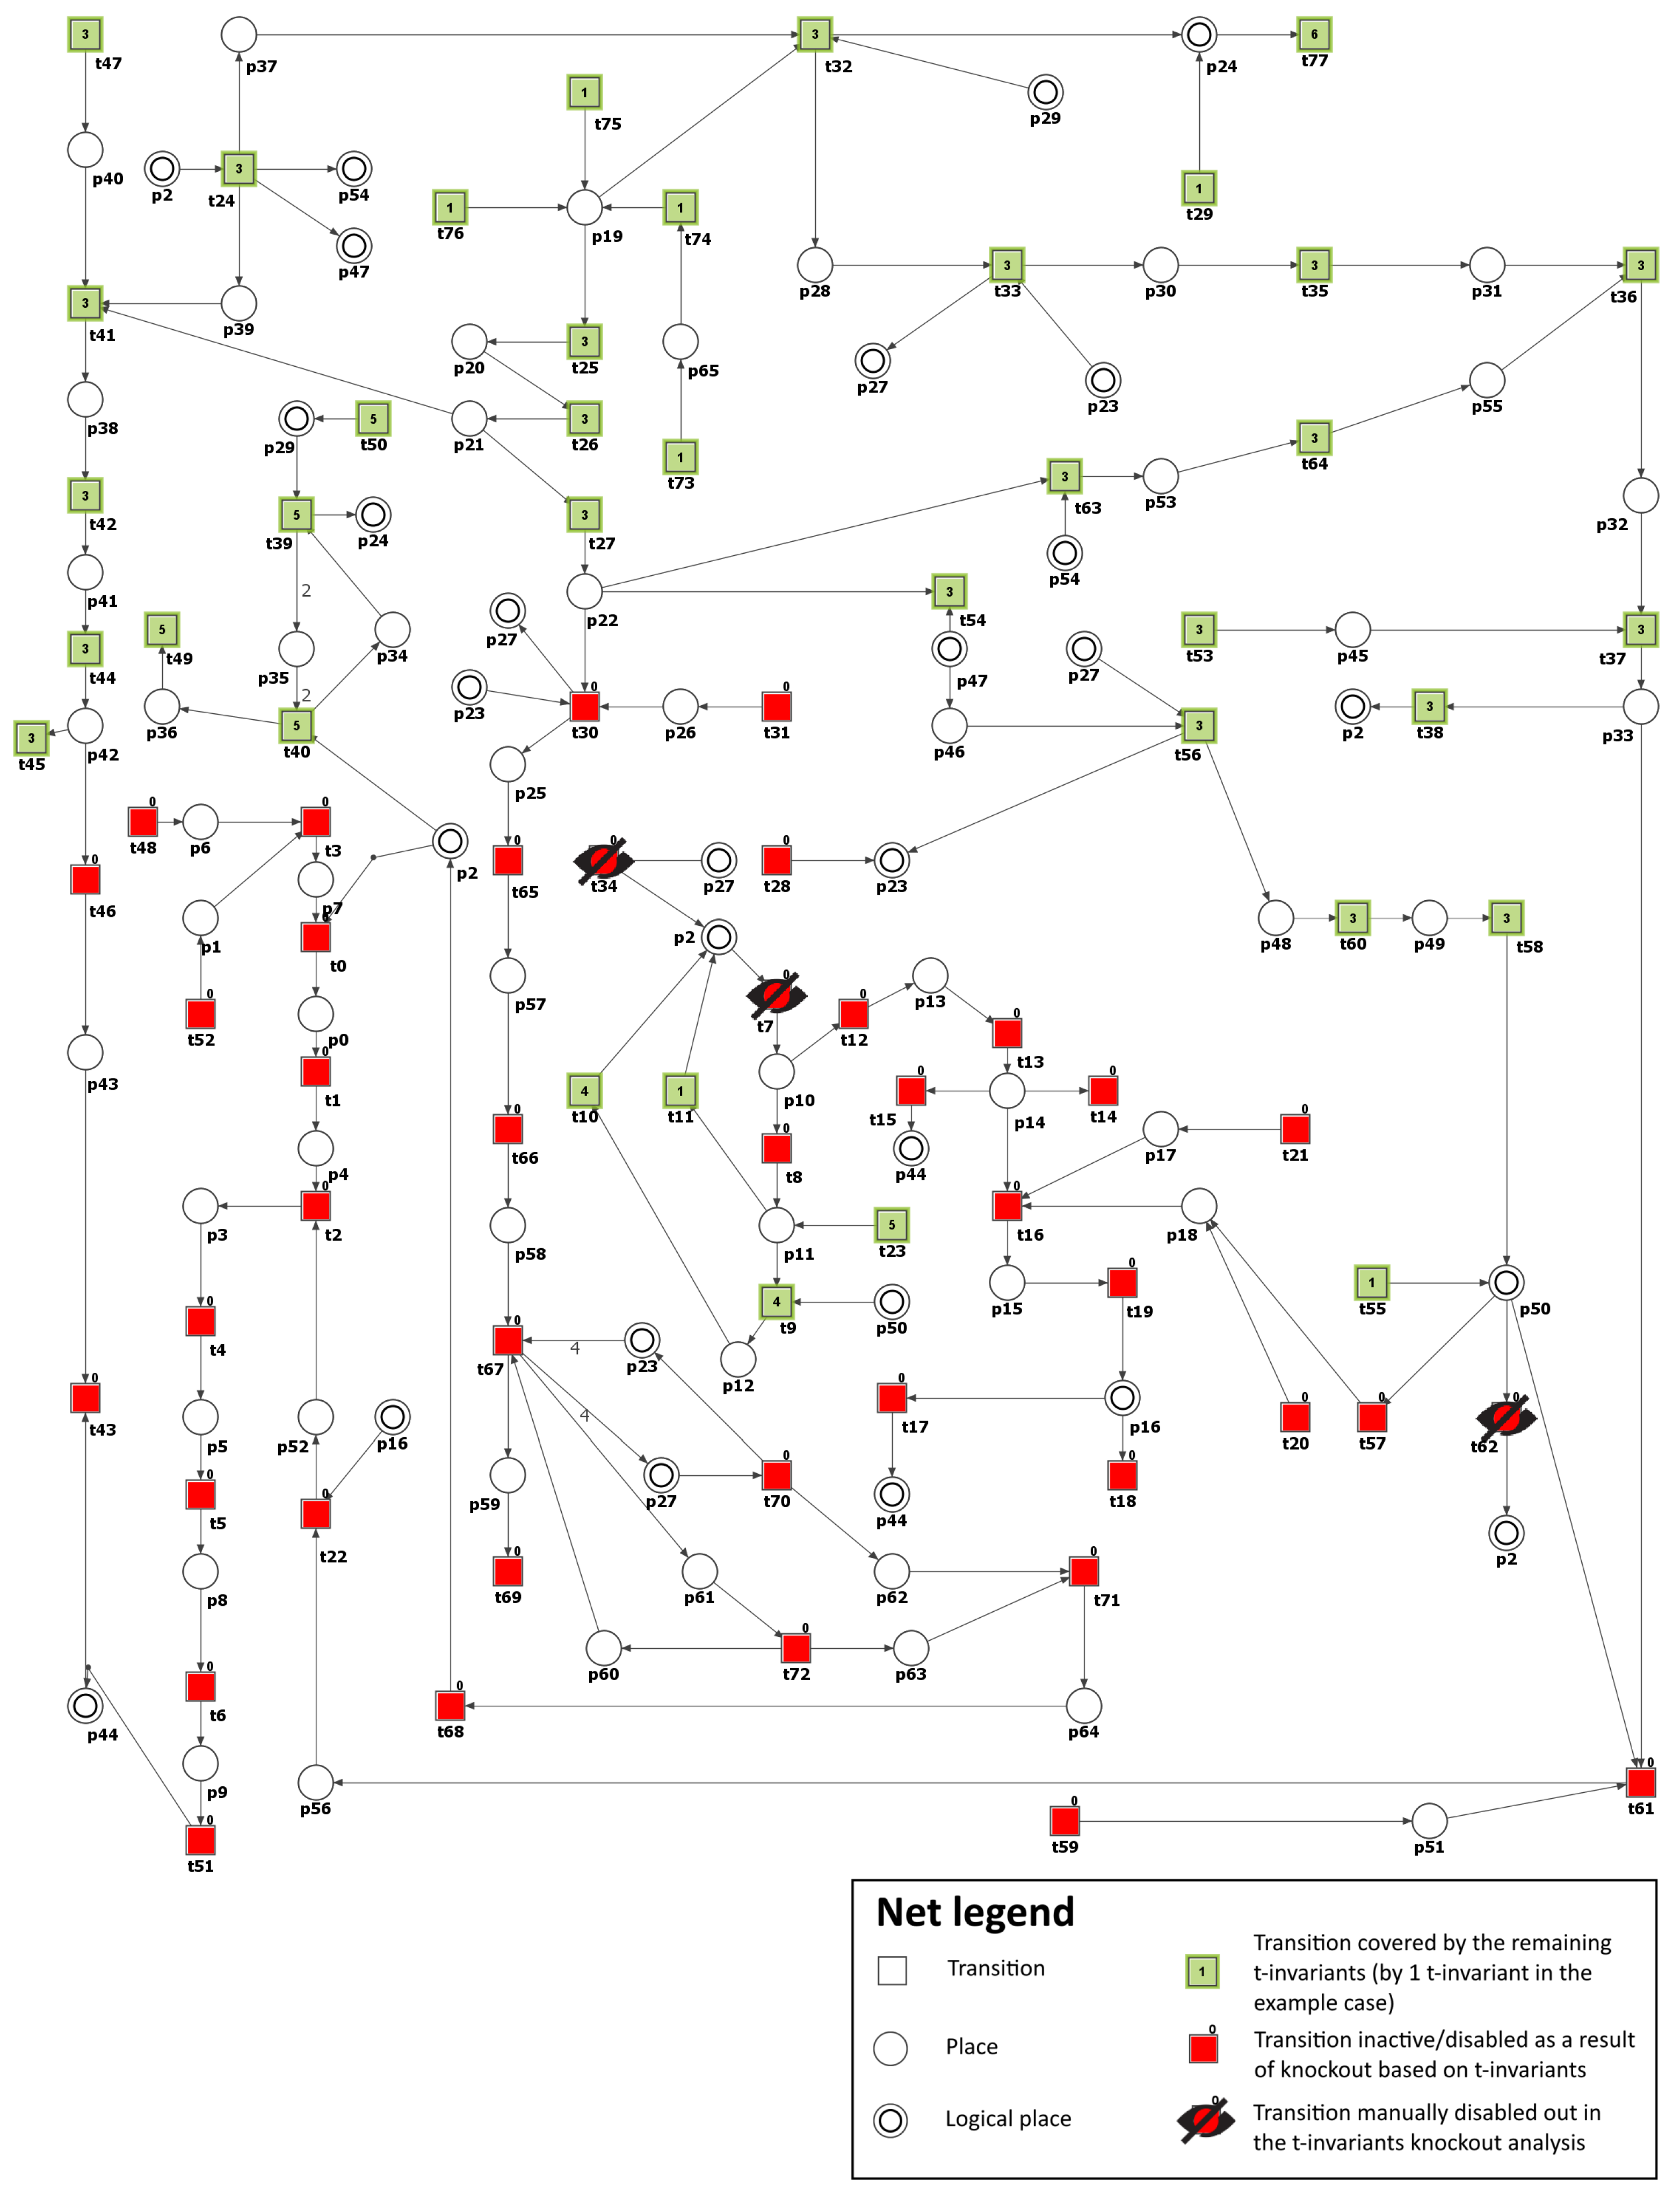
To model the effect of AR inhibitors, the formation of sorbitol (
) has been blocked by excluding from the net transition
(reaction catalyzed by aldose reductase). As a result, it was possible to observe that the number of t-invariants contributing to the atherosclerosis progression dropped from 90 to 0 (see
Figure 5 and
Table 3). This means that atherosclerosis development has been stopped.
Moreover, the knockout of transition
has prompted the exclusion of the following transitions and MCT sets:
,
,
,
,
,
,
, which are involved in the activation of pro-atherogenic proteins, PKC (
and
) pathway, and atherosclerosis progression affected by ROS and oxidized LDL. Similarly, as in Scenario 2, glucose metabolism and the antioxidant defense mechanism involving glutathione-dependent enzymes stayed intact. AR has a low affinity for glucose. Therefore, in hyperglycemia, there is an increased flux of glucose metabolism via the polyol pathway, enhancing oxidative stress. In our model, the oxidative stress decreased but remained present (26 out of 149 remaining t-invariants, calculated using Holmes [
45], based on place
(ROS)).
These findings are consistent with the results presented in [
59,
60], where it was shown that AR blockage could prevent atherosclerosis. Additionally, it was presented in [
61] that AR inhibition led to decreased expression of PKC (
and
) enzyme in the course of diabetes. Therefore, AR inhibitors (ARIs) represent a promising therapeutic approach for treating a wide range of diabetic complications.
Based on the premise that AR inhibition can prevent numerous diabetic complications, a number of AR inhibitors have been developed and tested; however, their clinical usefulness was found to be low. In addition, a recent study has shown that AR detoxifies aldehydes formed by the lipids’ peroxidation and their glutathione conjugates. Although, in some situations, this antioxidant function helps AR protect against tissue damage and dysfunction, the metabolic transformation of glutathione conjugates with aldehydes derived from lipid peroxidation can also produce reactive metabolites, stimulating mitogenic and inflammatory processes. Thus, AR inhibition may have both beneficial and harmful effects. However, accumulating evidence suggests that AR inhibition may modify the effects of cardiovascular disease, asthma, sepsis, and cancer; therefore, additional studies are needed to target AR inhibitors to specific disease states [
25,
57].
Mechanisms examining cellular and in vivo studies to establish the link between AR and inflammation have revealed that flux through impaired AR drives changes in inflammatory genes via early growth response protein-1 (Egr-1). AR activity and flux changes reduce NAD
levels, decreasing NAD
-dependent deacetylase Sirtuin 1 (Sirt-1) activity and subsequent acetylation and Egr-1 expression in hyperglycemic states. These data established the existence of a new AR-SIRT1-EGR1 mechanism by which glucose may lead to a pro-inflammatory and pro-thrombotic response in hyperglycemia-induced atherosclerosis [
55]
Scenario 4. Inhibition of the advanced glycation end-products (AGEs).
AGEs are a chemically diverse group of compounds, formed non-enzymatically as a result of condensation between the carbonyl groups of reducing sugars and free amino groups of proteins, lipids, and nucleic acids [
62]. They are created exogenously or endogenously via various pathways, specifically, the Maillard reaction, polyol pathway, and oxidation reactions. A moderate presence of AGEs has been observed among healthy individuals, whereas in hyperglycemia, due to the increased glucose availability, their formation increases. According to one hypothesis based on the “glycometabolic theory”, early hyperglycemia leads to a proportional increase in the formation of AGEs and oxidative stress. Over time, proteins of the mitochondrial respiratory chain become increasingly glycated, leading to mitochondrial DNA damage and promoting a self-perpetuating cycle of AGE formation and oxidative stress independent of hyperglycemia [
63]. At the cellular level, AGEs, through interaction with their receptors, mostly RAGE (found on the various cells’ surface, like monocytes and macrophages, endothelial cells, smooth muscle cells, and fibroblasts) modulate properties of the cells by (1) activation of signaling cascades (including extracellular signal-regulated kinase 1/2 (ERK 1/2), MAPK, NF-
B, Janus kinases (JAKs), and signal transducer and activator of transcription proteins (STATs) (STATs)), leading to ROS generation and oxidative stress development; (2) contribution to the inflammatory process via generating many proinflammatory cytokines and vascular adhesion molecules; and (3) promotion of autophagy and apoptosis. In addition, AGEs cause covalent modifications and cross-linking of serum proteins and ECM, changing their structure, stability, and functions, which disrupts cell–matrix and matrix–matrix interactions, influencing intercellular signaling and leading to profibrotic effects, reduced elasticity, and increased vascular stiffness, among other effects (see [
64]). All this contributes to the acceleration of atherosclerosis in DM [
62].
Recent population-based research has demonstrated that AGE–protein cross-links are related to the pathogenesis of atherosclerosis and CVD [
65]. Moreover, one study indicated that the accumulation of AGEs was independently linked with heart failure, with the association being more significant in individuals with diabetes [
66].
The adverse impact of AGEs has become the basis for an intensive search for pharmacological agents that can interfere with glycation reactions and their consequences. Various compounds with diverse chemical structures have been identified as inhibitors of the AGEs’ formation and accumulation or disrupt the associated signaling pathways. Some of these agents have shown promising results in protecting against end-organ damage in chronic conditions such as diabetes [
62,
67]. Different drugs, like metformin or pioglitazone, have already shown the ability to block AGEs’ formation in in vitro studies [
68]. ACE inhibitors used in hypertension were also capable of reducing AGEs’ formation, and an angiotensin II receptor blocker, telmisartan, downregulated RAGE mRNA levels and inhibited superoxide generation [
69]. A number of other compounds also have AGE-lowering properties. The flavonoid quercitin, for instance, can trap glyoxal and MGO and thereby inhibit the AGEs’ formation [
70]. Rosiglitazone, a peroxisome proliferator-activated receptor
(PPAR
) agonist, also decreased AGE levels and increased serum levels of sRAGE [
71], known for their properties to neutralize AGEs’ negative effects [
72]). However, because the listed compounds have a broad spectrum of activity, it is not yet elucidated to what extent their AGE-reducing properties contribute to their beneficial effects.
To simulate the impact of AGE inhibitors on atherosclerosis in our model, transition
(reaction forming MGO) was excluded from the network, which prevented the formation of MGO (
), a major precursor of AGE. Consequently, the number of t-invariants contributing to the progression of atherosclerosis decreased from 90 to 0, as shown in
Table 3. This indicates that the progression of atherosclerosis has been significantly reduced. It should be underlined here that we are far from believing that blocking MGO will completely inhibit the formation of AGEs in the human organism. Moreover, we know that certain processes and effects of chemical compounds occurring in the human body cannot be completely eliminated by blocking their endogenous synthesis in vivo. In this case, it is known that MGO is not only an endogenous metabolite but can be delivered exogenously through food, drinks, air pollution, and cigarette smoke; hence, its complete blockage seems impossible. In addition, as known, there are many precursors of AGE [
73]. Hence, in the organism, a single MGO blockade will never stop AGE formation. Our motivation to inhibit AGE formation by blocking its main source in the system was to show how AGE is crucial for atherosclerosis plaque progression in DM.
The obtained results are identical to those for Scenario 3 (see
Figure 5 and
Table 3). This suggests that targeting the AGE-RAGE axis could be a promising therapeutic approach for managing atherosclerosis in individuals with diabetes [
66].
Scenario 5. Inhibition of NADPH oxidase.
NADPH oxidase is a crucial enzyme responsible for the formation of ROS in human blood vessels. Typically, the expression of NADPH oxidases in non-phagocytic cells is relatively low. However, it can be significantly upregulated in response to stimuli such as hyperglycemia and hyperlipidemia, increasing ROS production and oxidative stress. Experimental and clinical studies suggest that NADPH oxidase plays a critical role in the initiation and progression of atherosclerosis [
33].
To model the effects of inhibitors targeting NADPH oxidase, the transitions
(ROS production via NADH oxidase by increased NADH) and
(ROS production by activated NADPH-dependent oxidase) were removed from the network. As a result, the number of t-invariants associated with the advancement of atherosclerosis dropped from 90 to 42, as demonstrated in
Table 3. This suggests a moderate slowdown in the development of atherosclerosis rather than a complete halt (see
Figure 6). It is essential to highlight that, contrary to the scenarios mentioned above, the increased production of mitochondrial ROS associated with mitochondrial dysfunction has effectively ceased (see
Figure 6). However, the analysis of the remaining t-invariants showed that the formation of AGEs still occurs, leading to the progression of atherosclerosis.
Building on this, when transitions
and
, and also transition
(increase in AGE formation), are knocked out, the number of t-invariants linked to the progression of atherosclerosis dramatically decreases from 90 to 0 (see
Table 3). This suggests that, in this context, the progression of atherosclerosis is inhibited.
Furthermore, to evaluate the influence of inhibiting LDL oxidation in the studied model, in addition to transitions
and
, the
(oxidation) transition was deactivated. This transition is part of
, and the analysis performed in Scenario 1 revealed its considerable significance in the model. Consequently, the number of t-invariants associated with the advancement of atherosclerosis continued to decrease to 18, as illustrated in
Table 3. This means that the progression of the disease has been further slowed down.
According to
Table 3, which presents the results of the analysis conducted within Scenario 1, another transition of significant importance and impact on the modeled phenomenon is
(ROS reaction with NO). For this reason, as well, the
transition was additionally deactivated, except for transitions
and
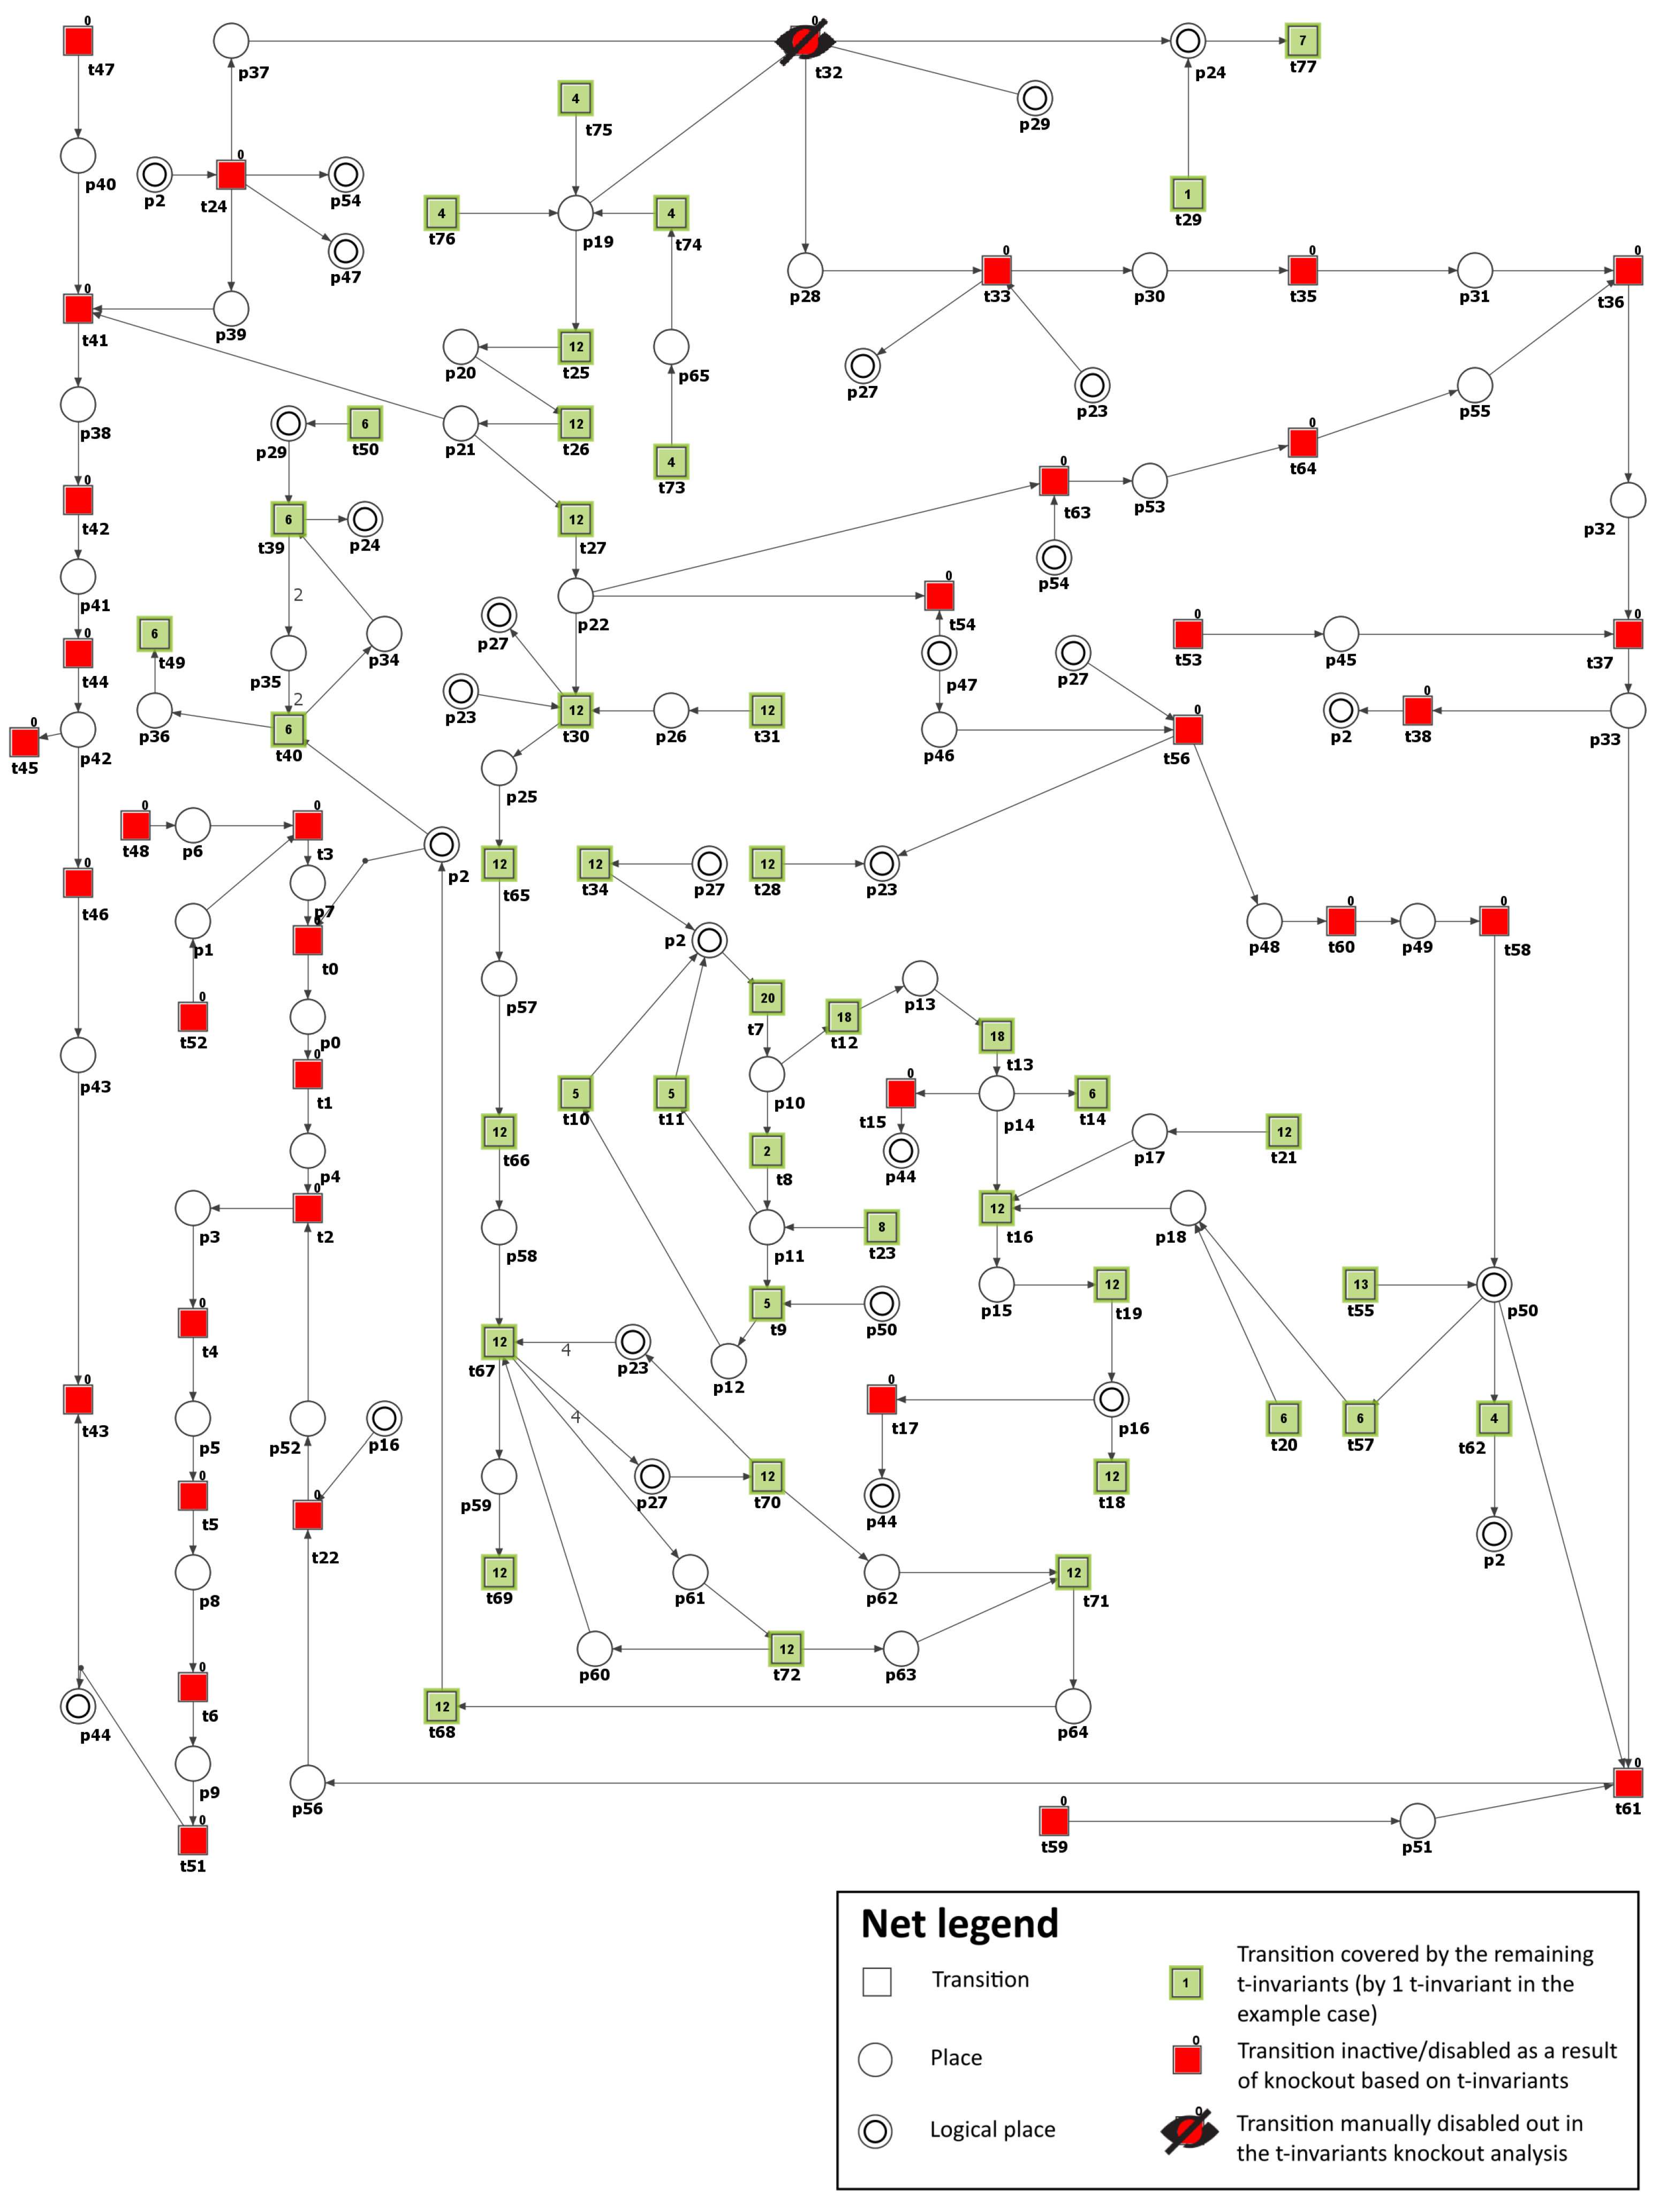
. As a consequence, the number of t-invariants linked to the progression of atherosclerosis decreased significantly from 90 to 0 (see
Table 3), indicating that the advancement of the disease has been completely halted (see
Figure 7).
Furthermore, similar to Scenario 2, the integrity of glucose metabolism and the antioxidant defense mechanism, including glutathione-dependent enzymes, remained intact. Additionally, it is essential to highlight that, simultaneously, the oxidative stress has experienced a substantial decrease (5 out of 149 remaining t-invariants, calculated using Holmes [
45] based on the place
(ROS)).
In conclusion, the blockade of NADPH oxidase is a promising but challenging strategy. A more comprehensive understanding of NADPH oxidase’s roles in ROS formation and other cellular functions, along with the underlying mechanisms of atherosclerosis, might be necessary to make this approach more effective. Future research may need to focus on combining the blockade of NADPH oxidase with other therapeutic strategies to enhance its impact on atherosclerosis development.
It should be noted that some drugs, like metformin or liraglutide, inhibit hyperglycemia-induced ROS production through the downregulation of PKC-dependent NADPH oxidase in human ECs [
19].
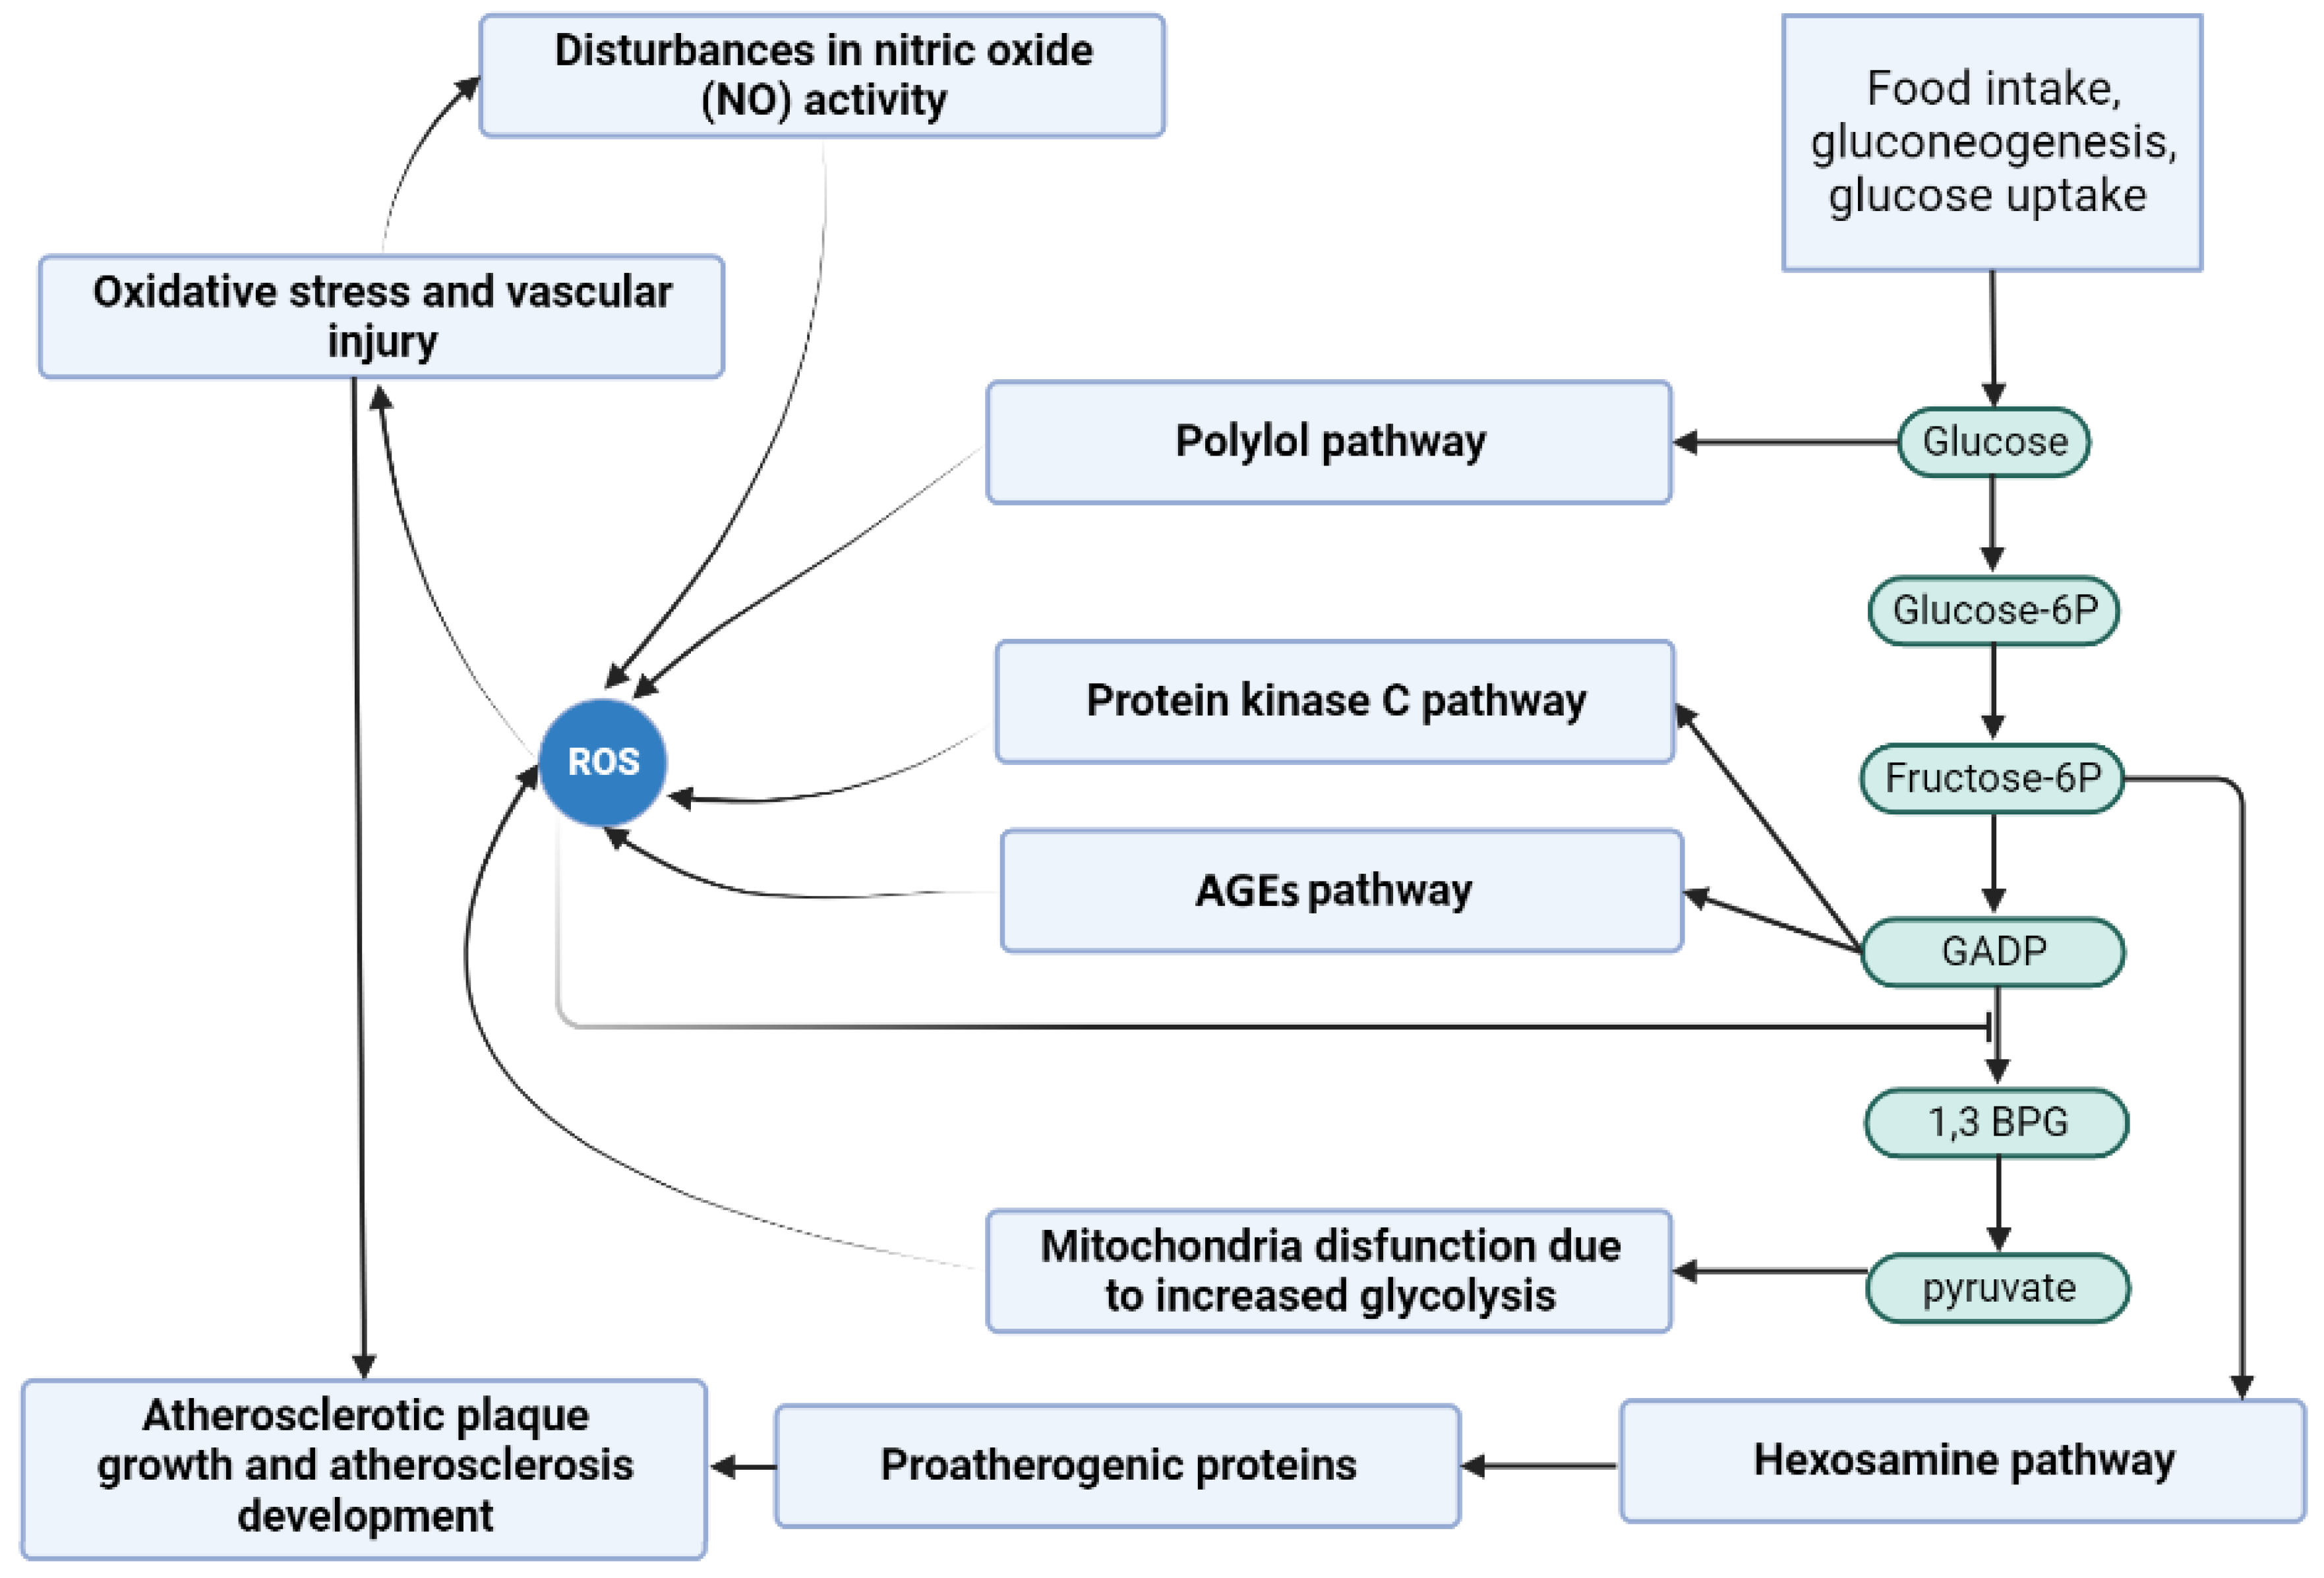
In
Figure 8, the scheme of the study has been presented. It is based on the main pathways that are involved in DM-related atherosclerosis. Activation of the polyol pathway contributes to the following: (A) fructose and its metabolites are strong glycating agents, and when their production is accelerated, more AGEs are produced; (B) in the polyol pathway, where NADPH is converted to NADP
and NAD
to NADH, NADPH depletion reduces the production of reduced glutathione, which accelerates oxidative stress; (C) an increase in NADH levels causes an increase in glycerol-3-phosphate levels, which activates protein kinase C (PKC pathway). The figure further highlights the scenarios that were considered in this study (except Scenario 1, which was used to identify important pathways), showing possible capture points for inhibiting compounds that could be useful in reducing atherosclerosis underlying DM.


