
Metabolite Changes in Indonesian Tempe Production from Raw Soybeans to Over-Fermented Tempe

 ,
,  ,
,
Abstract
: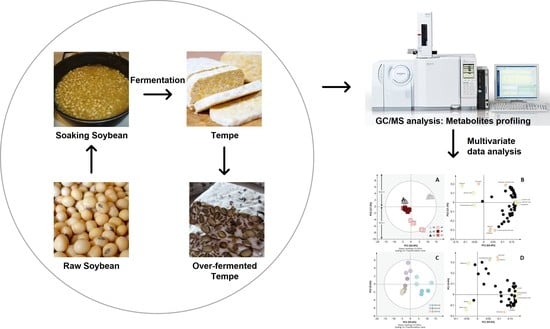
1. Introduction
2. Materials and Methods
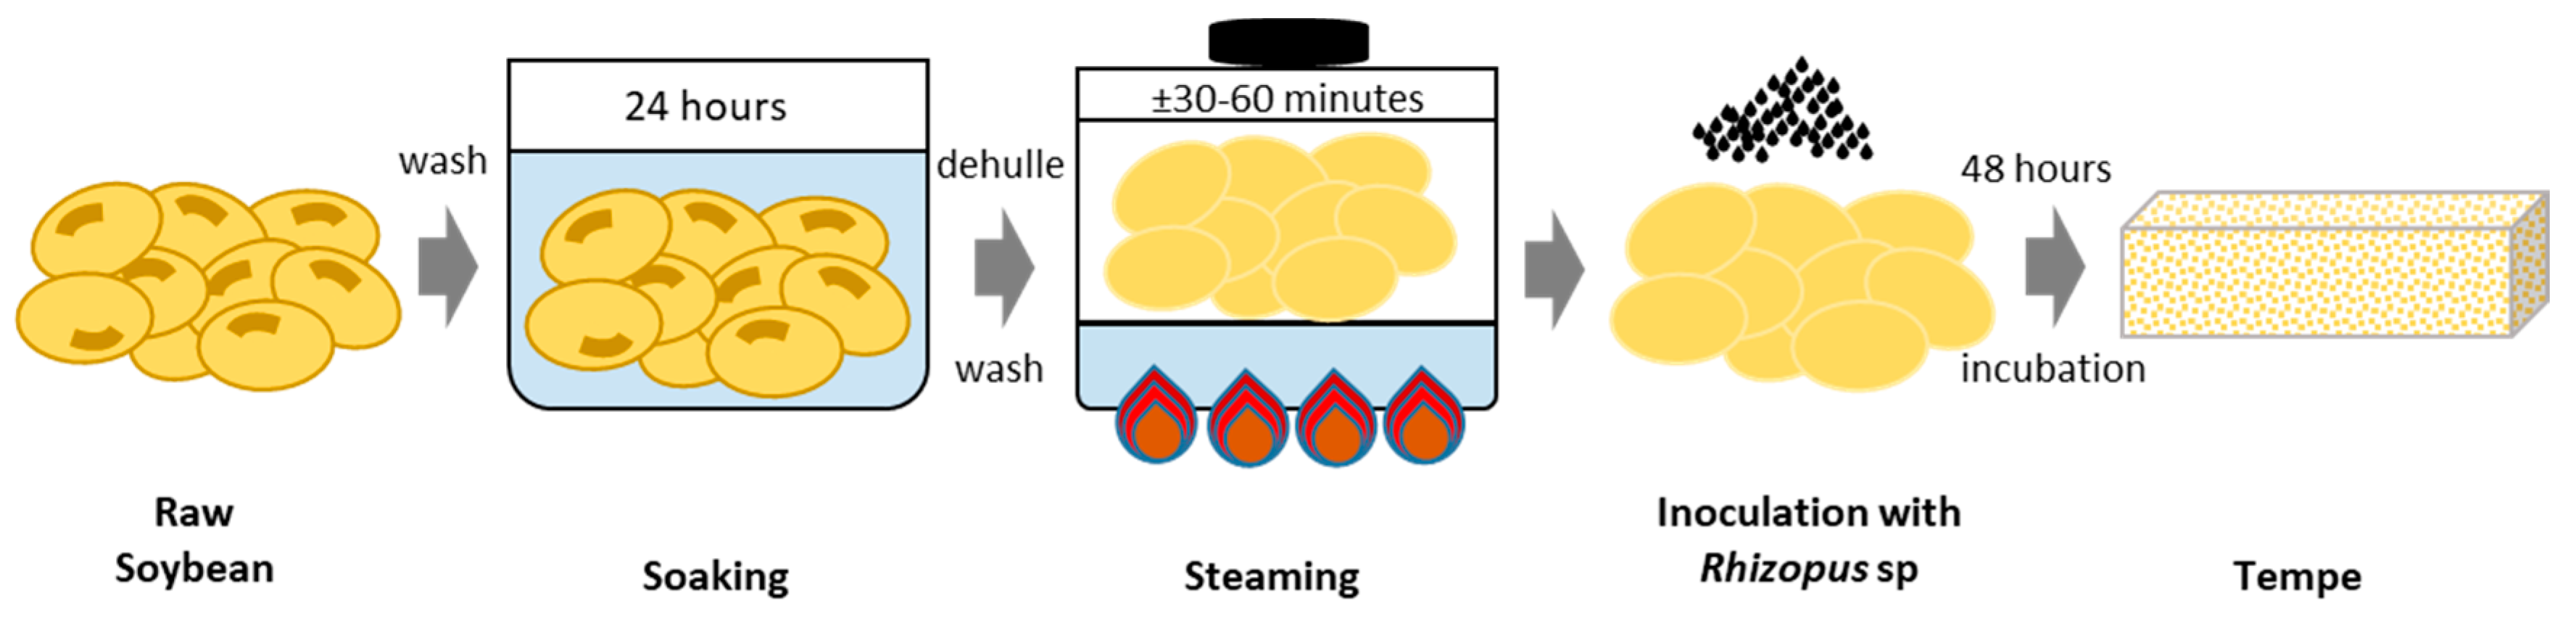
2.1. Sample Preparation before Transportation
2.2. Extraction and Derivatization
2.3. GC–MS Analysis
2.4. Data Processing
2.5. Statistical Analysis
3. Results and Discussion
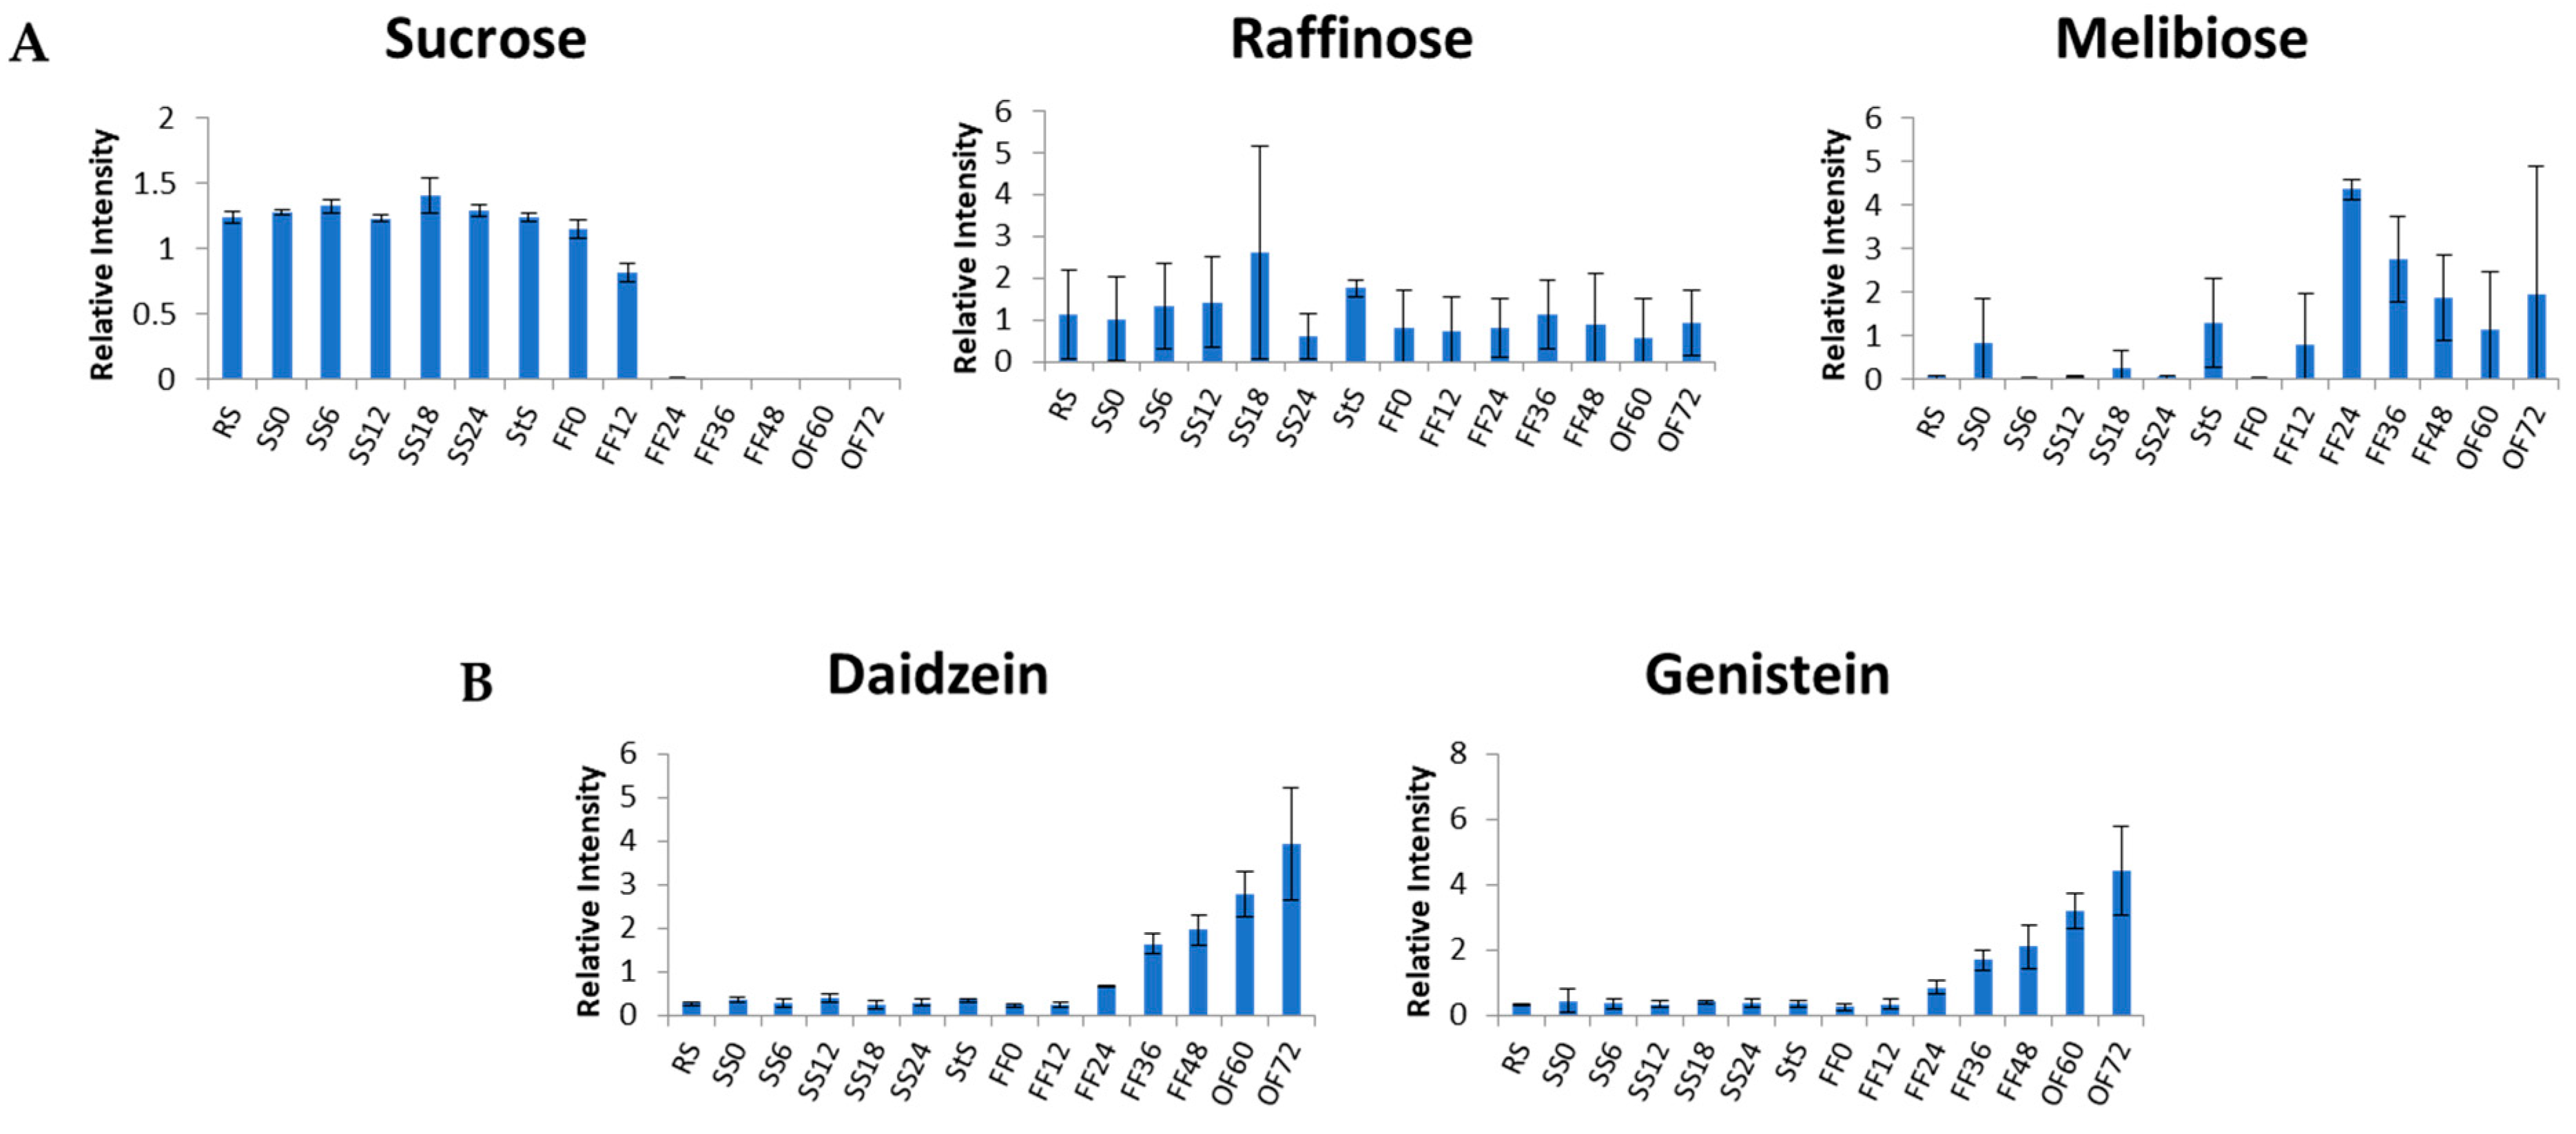
3.1. Metabolite Changes in the SS Process
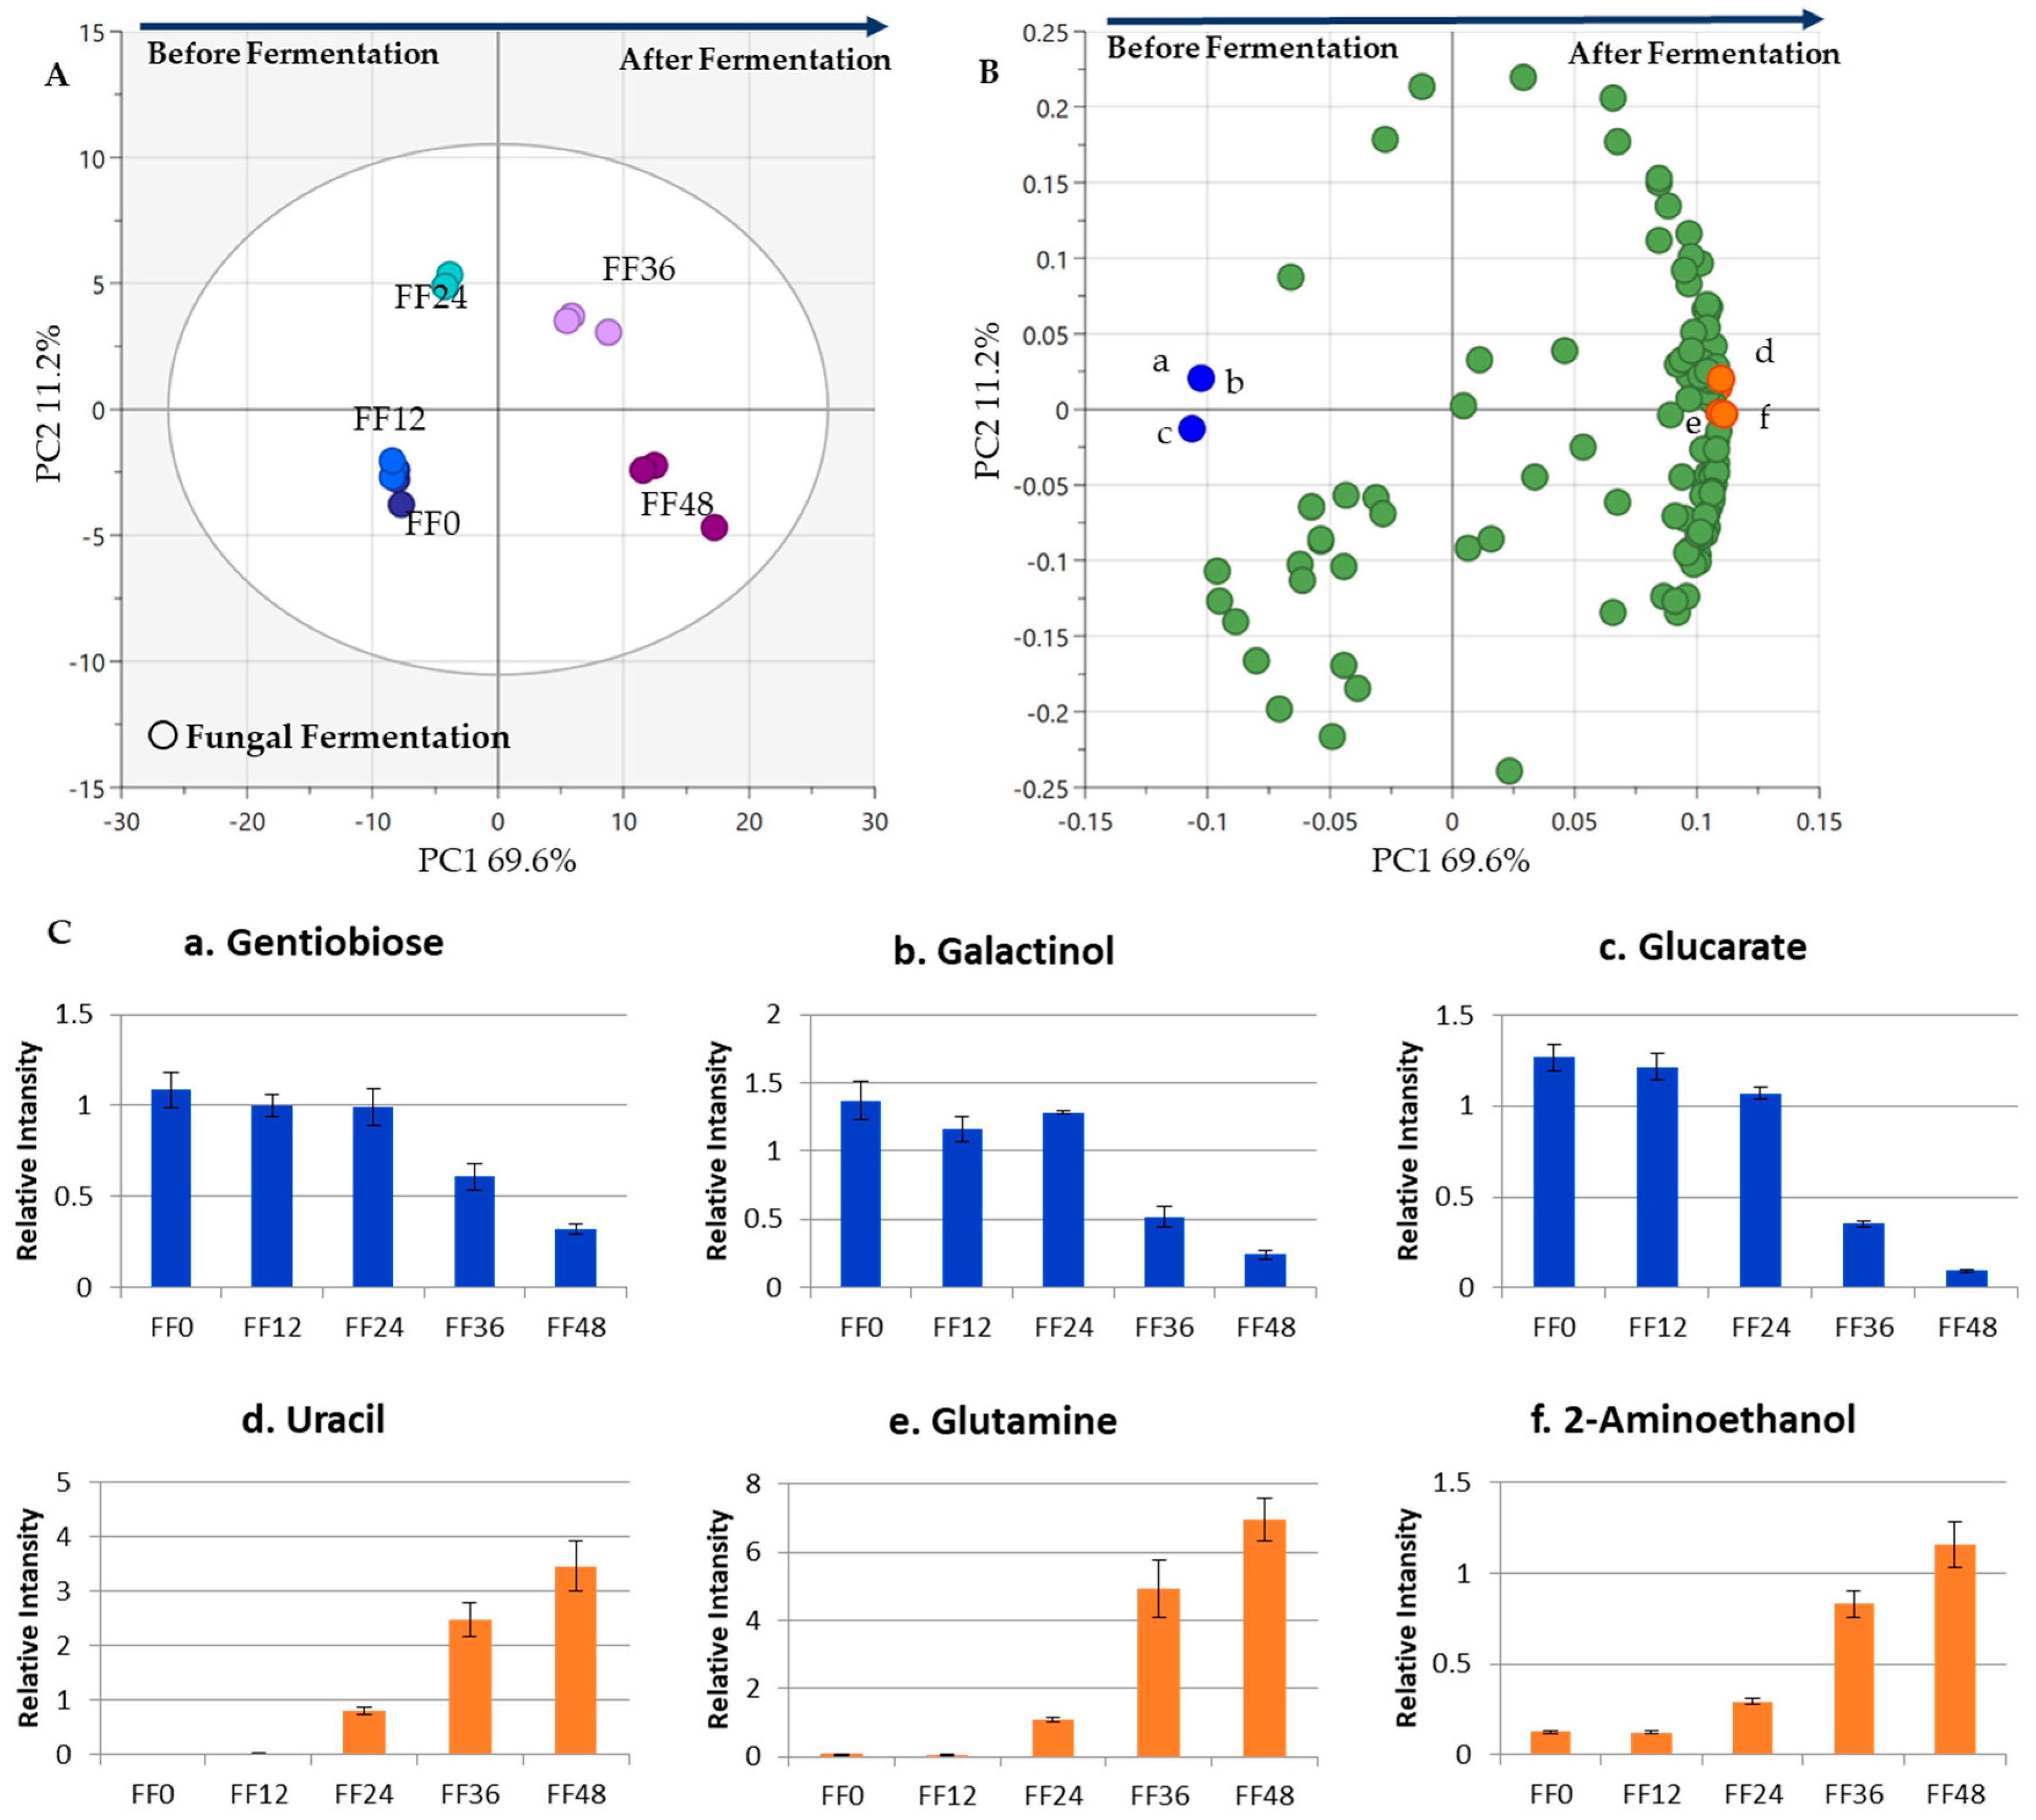
3.2. Metabolite Changes in the Fungal Fermentation (FF)
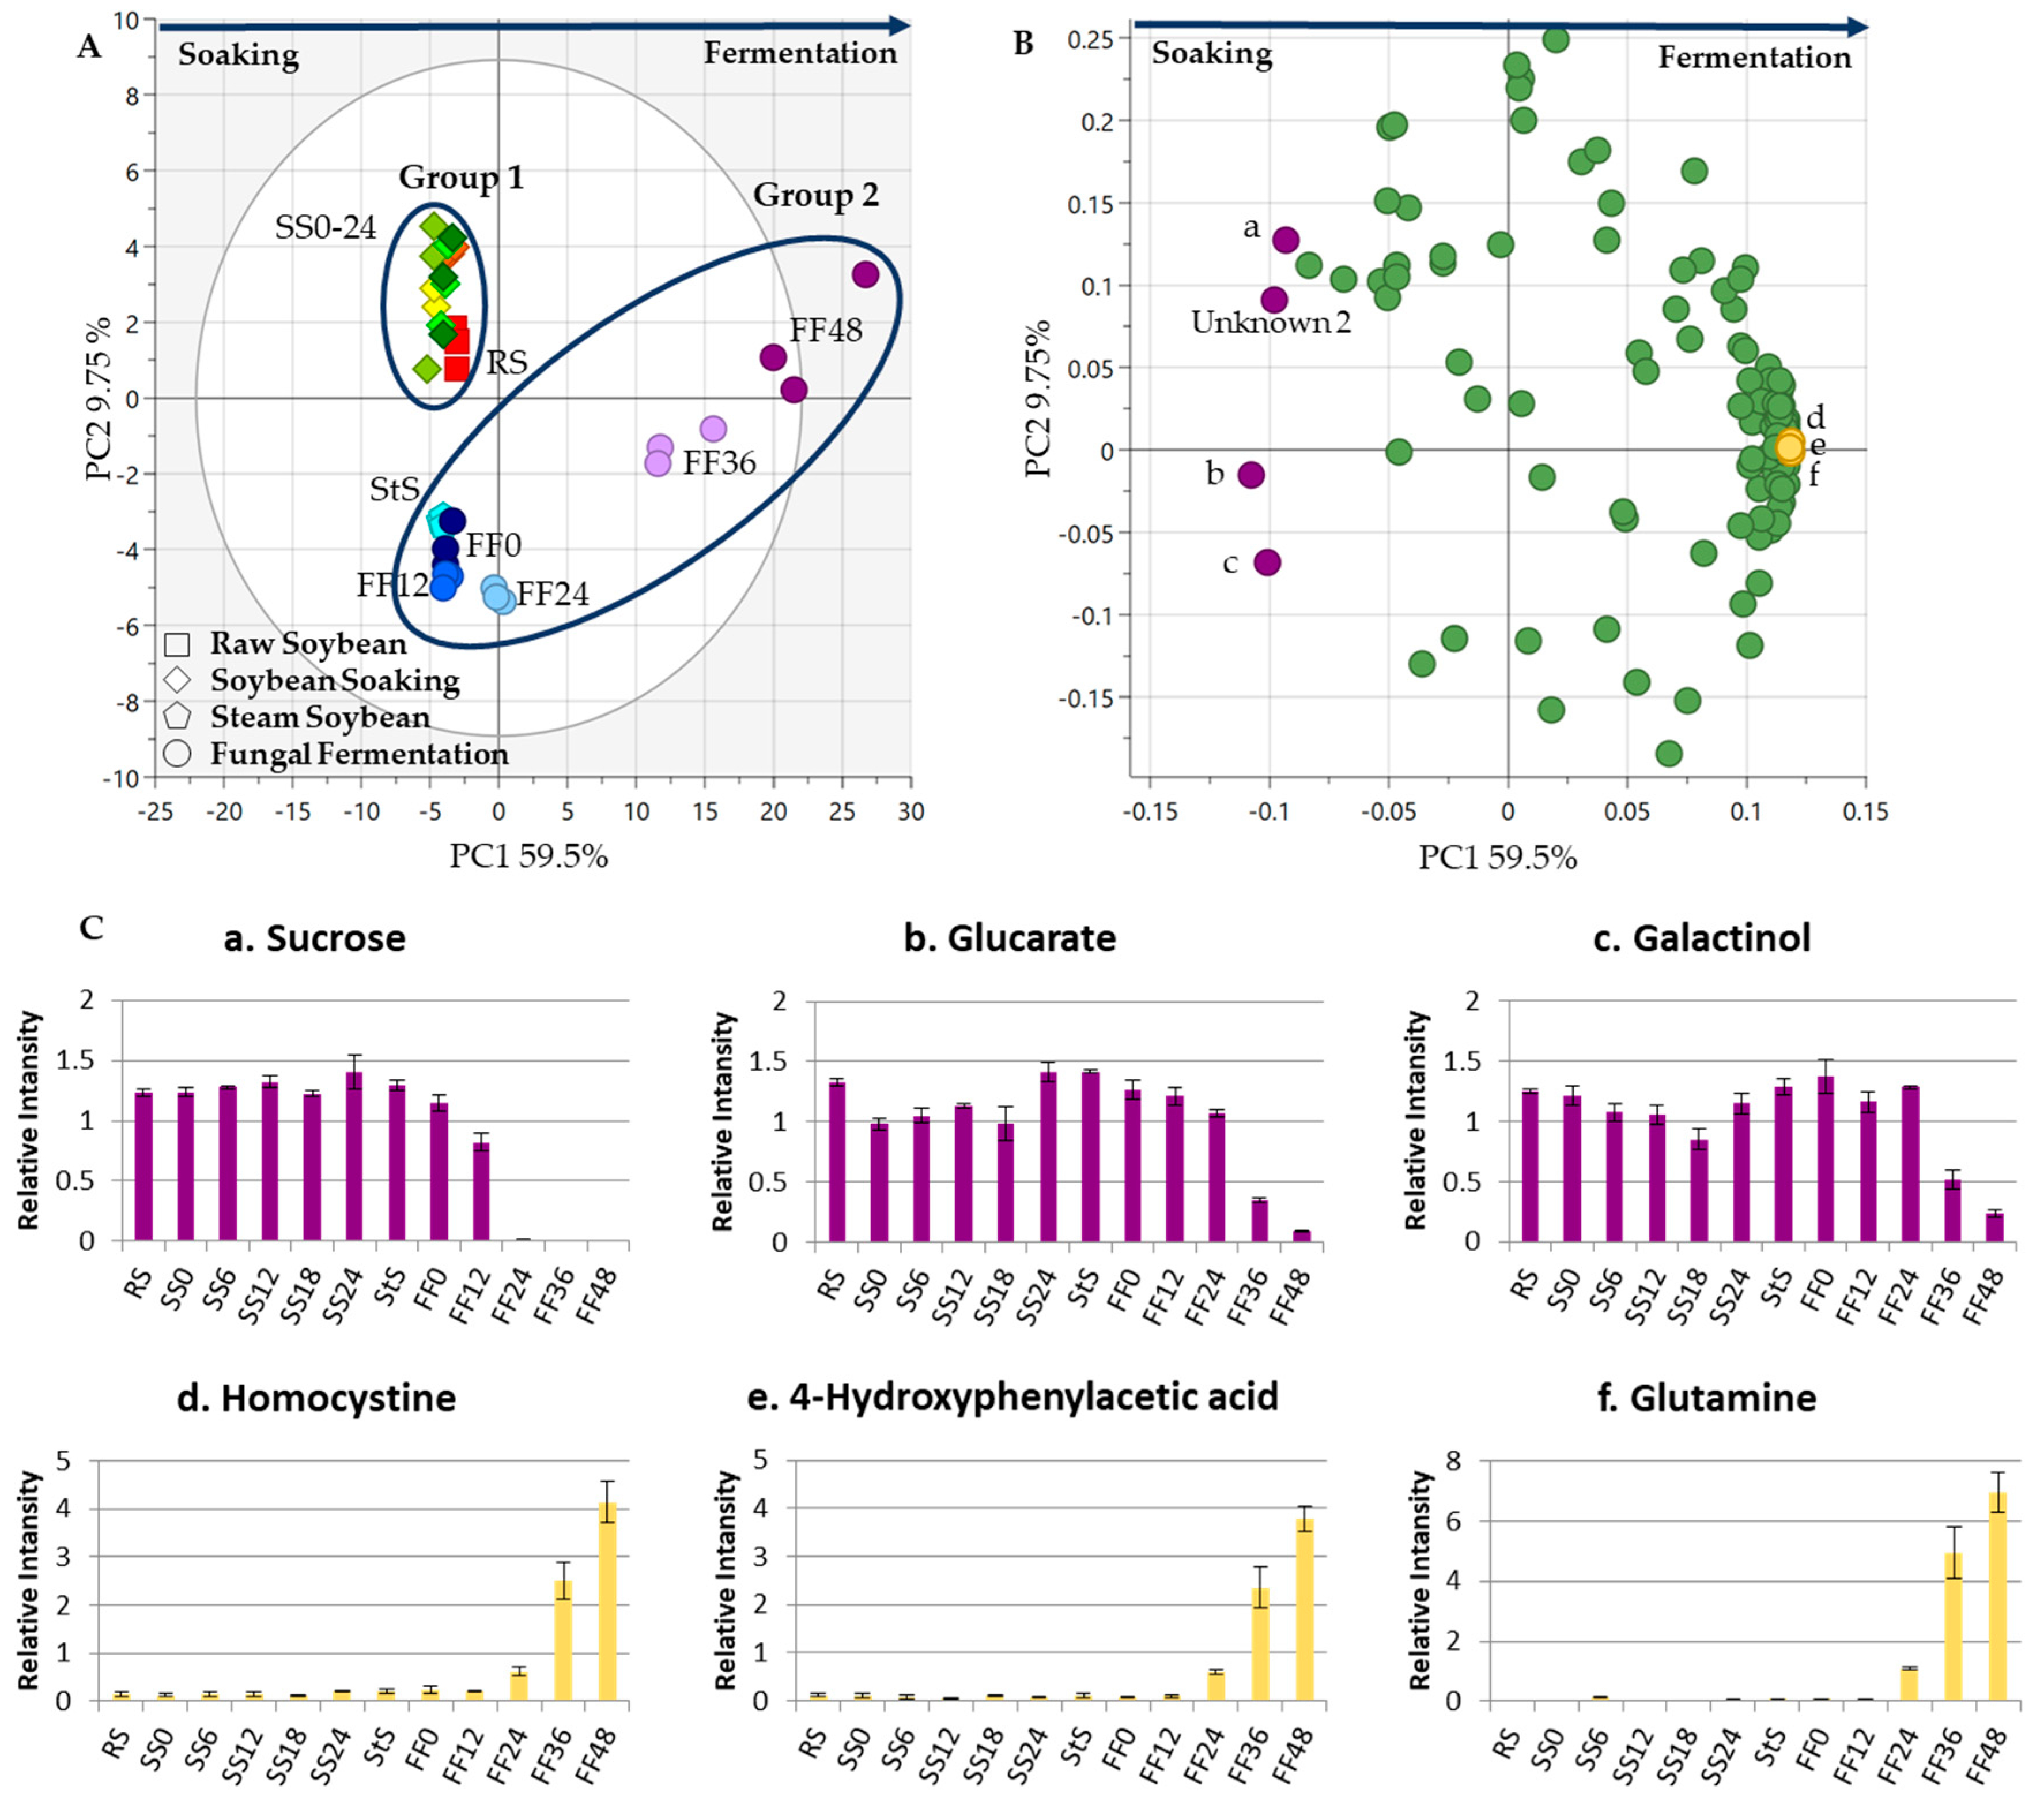
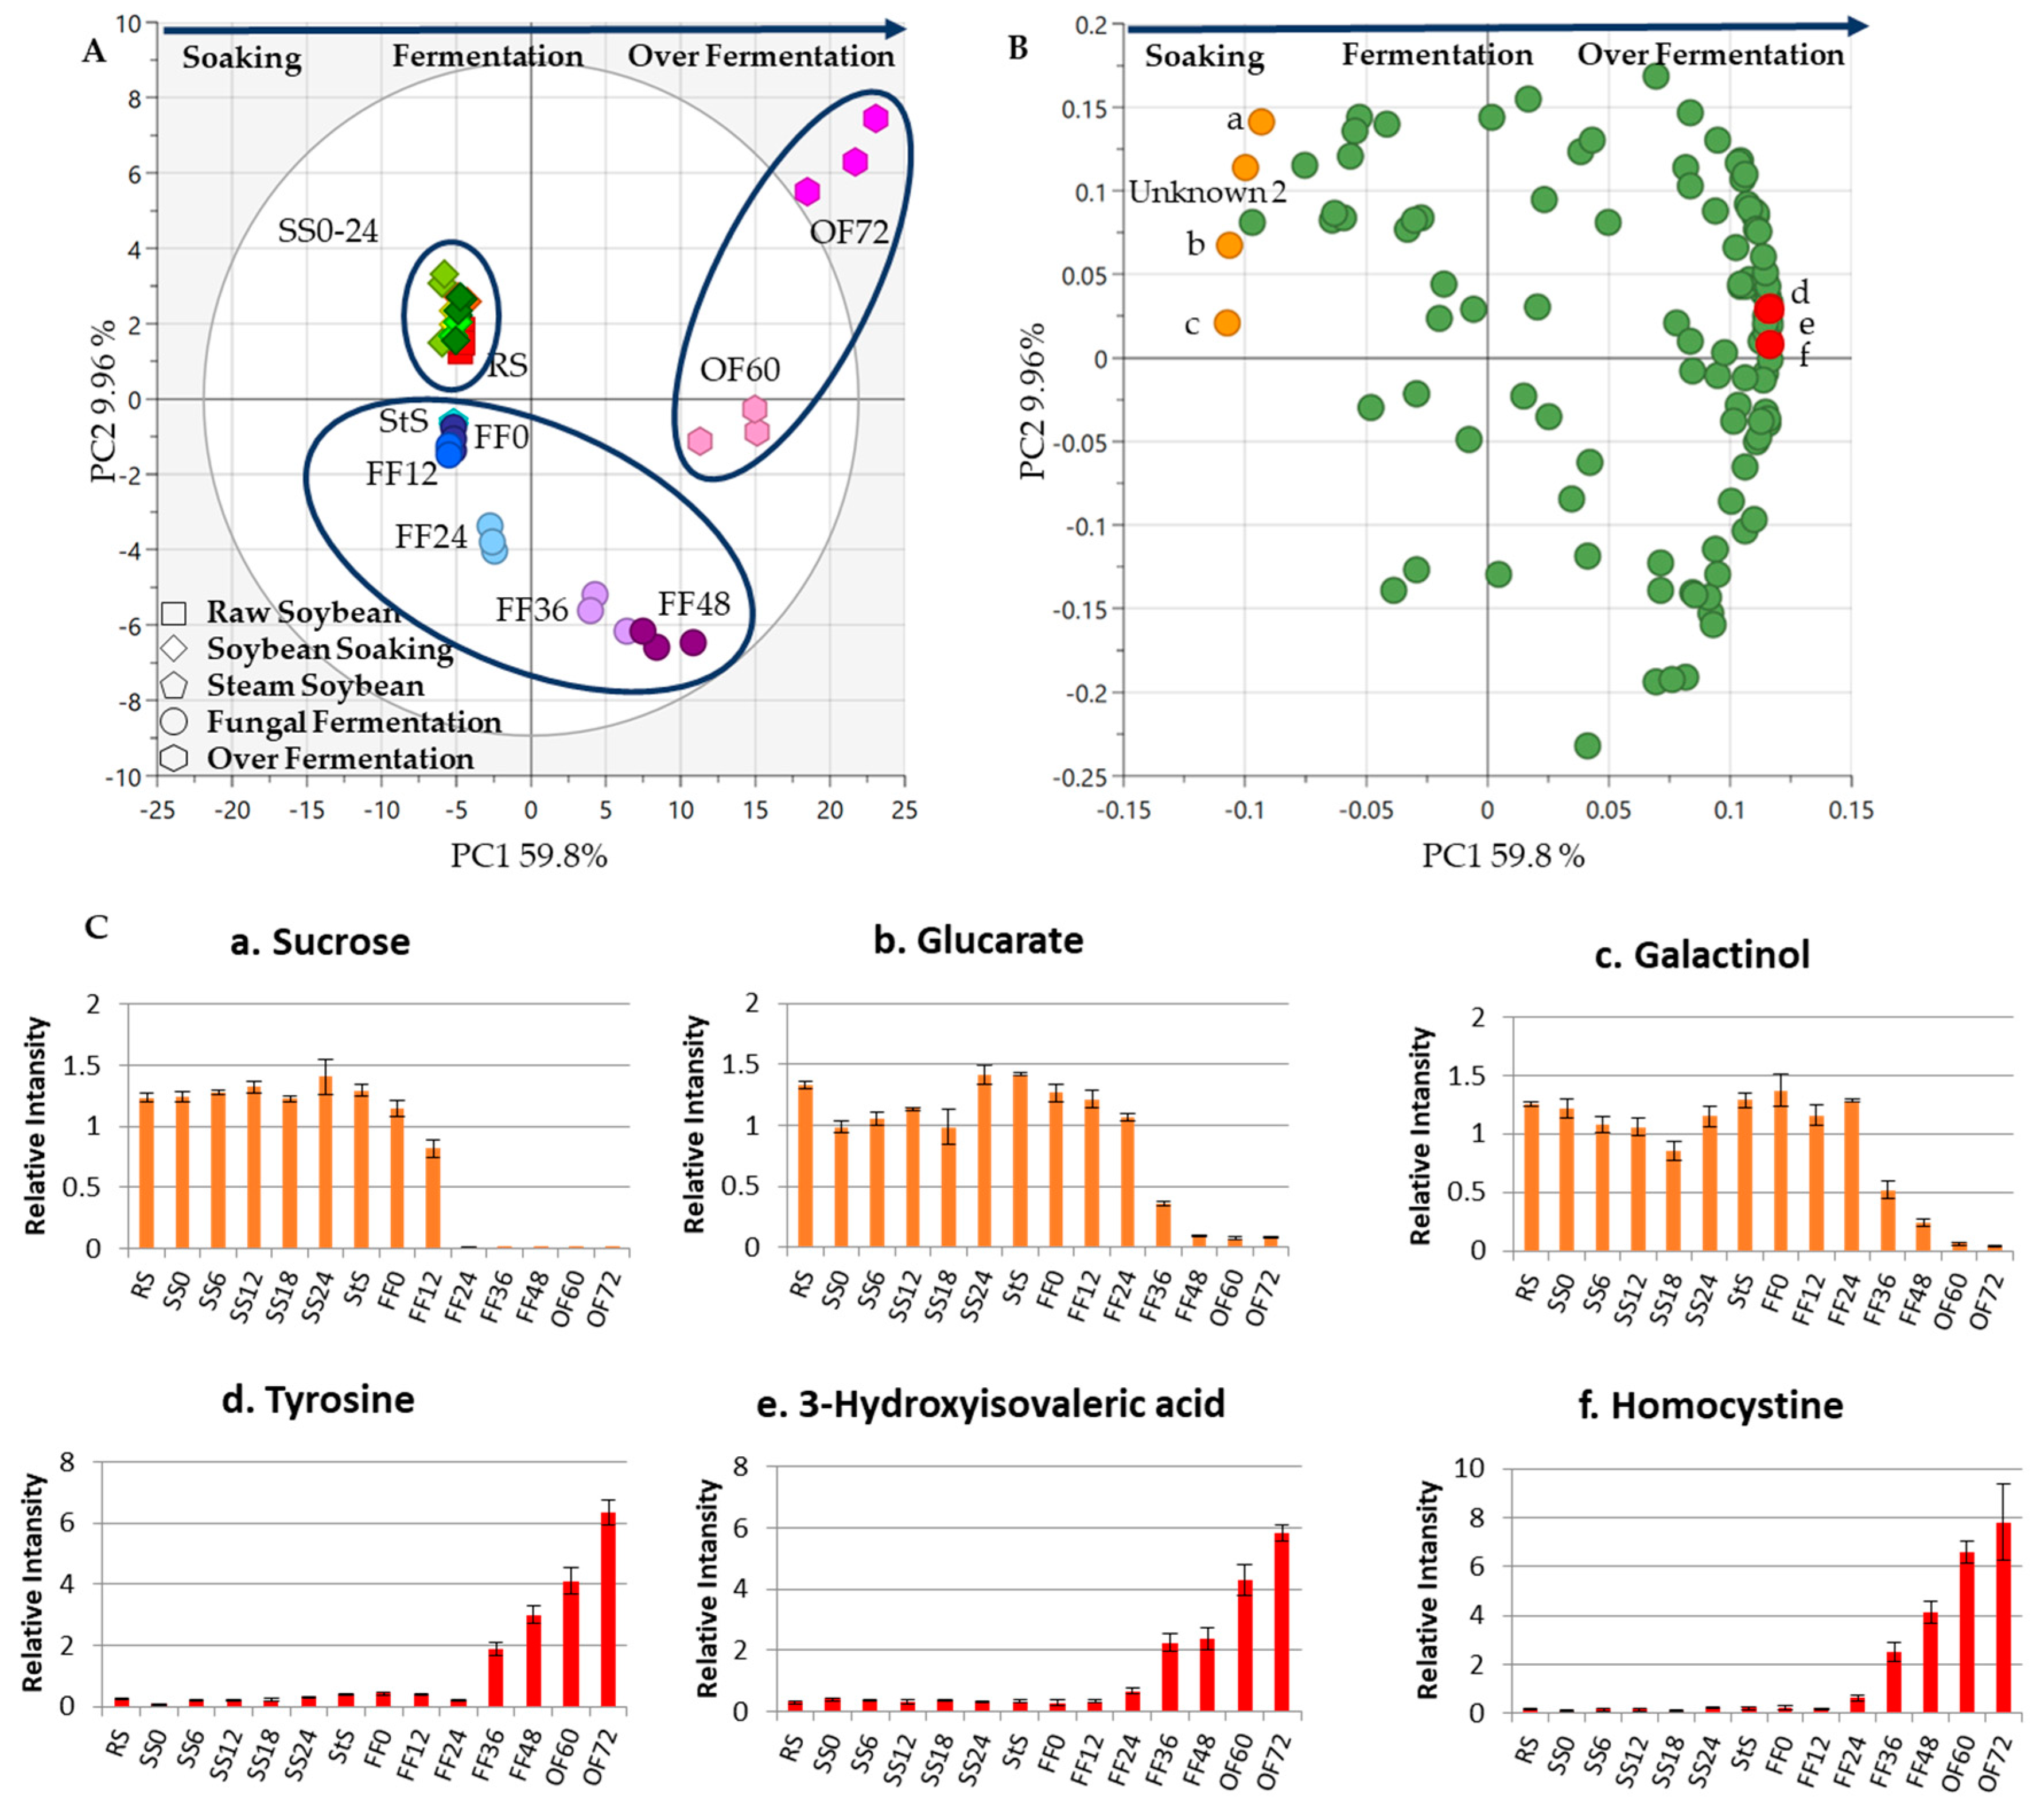
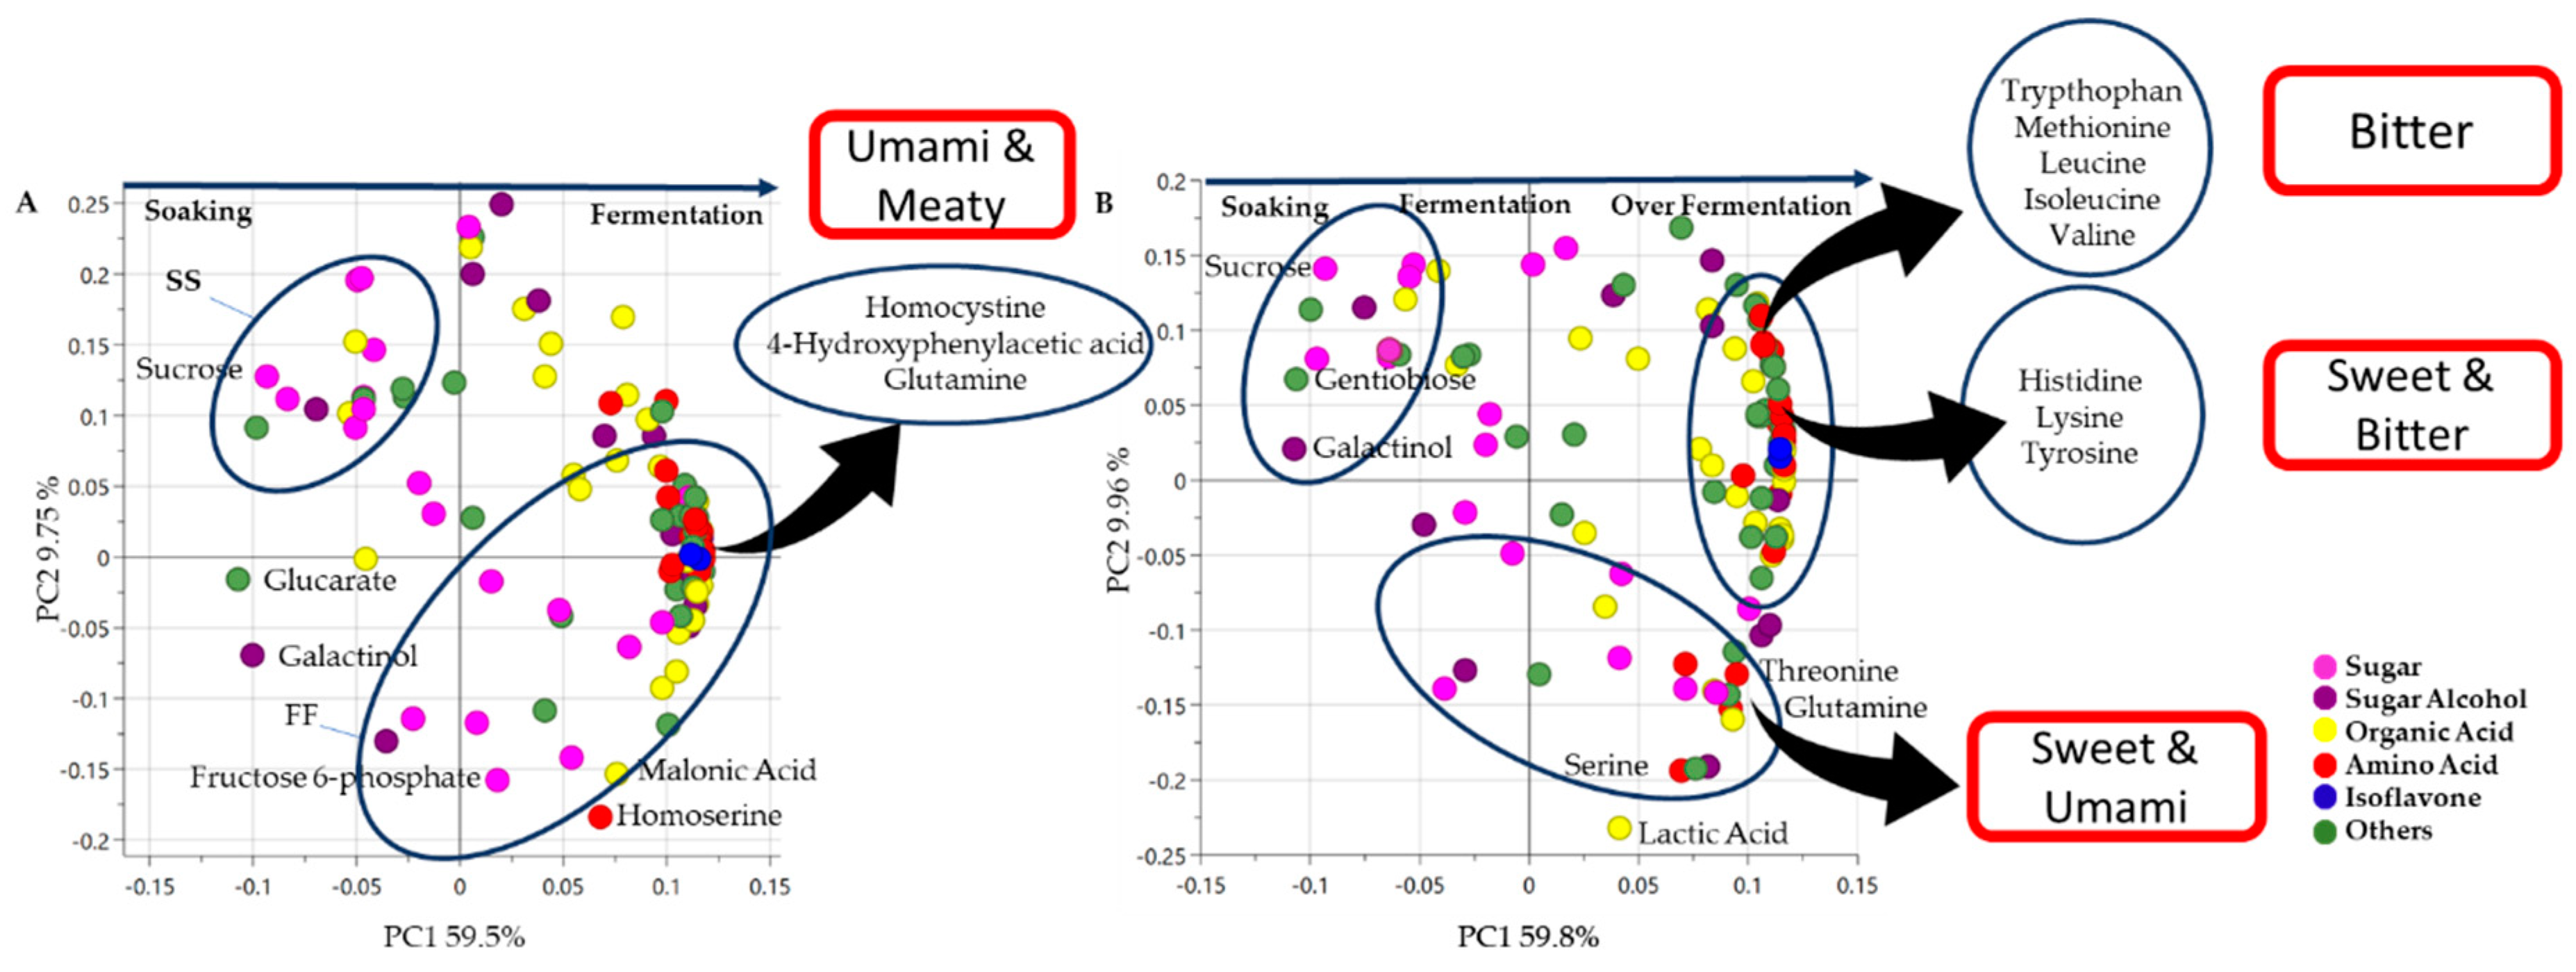
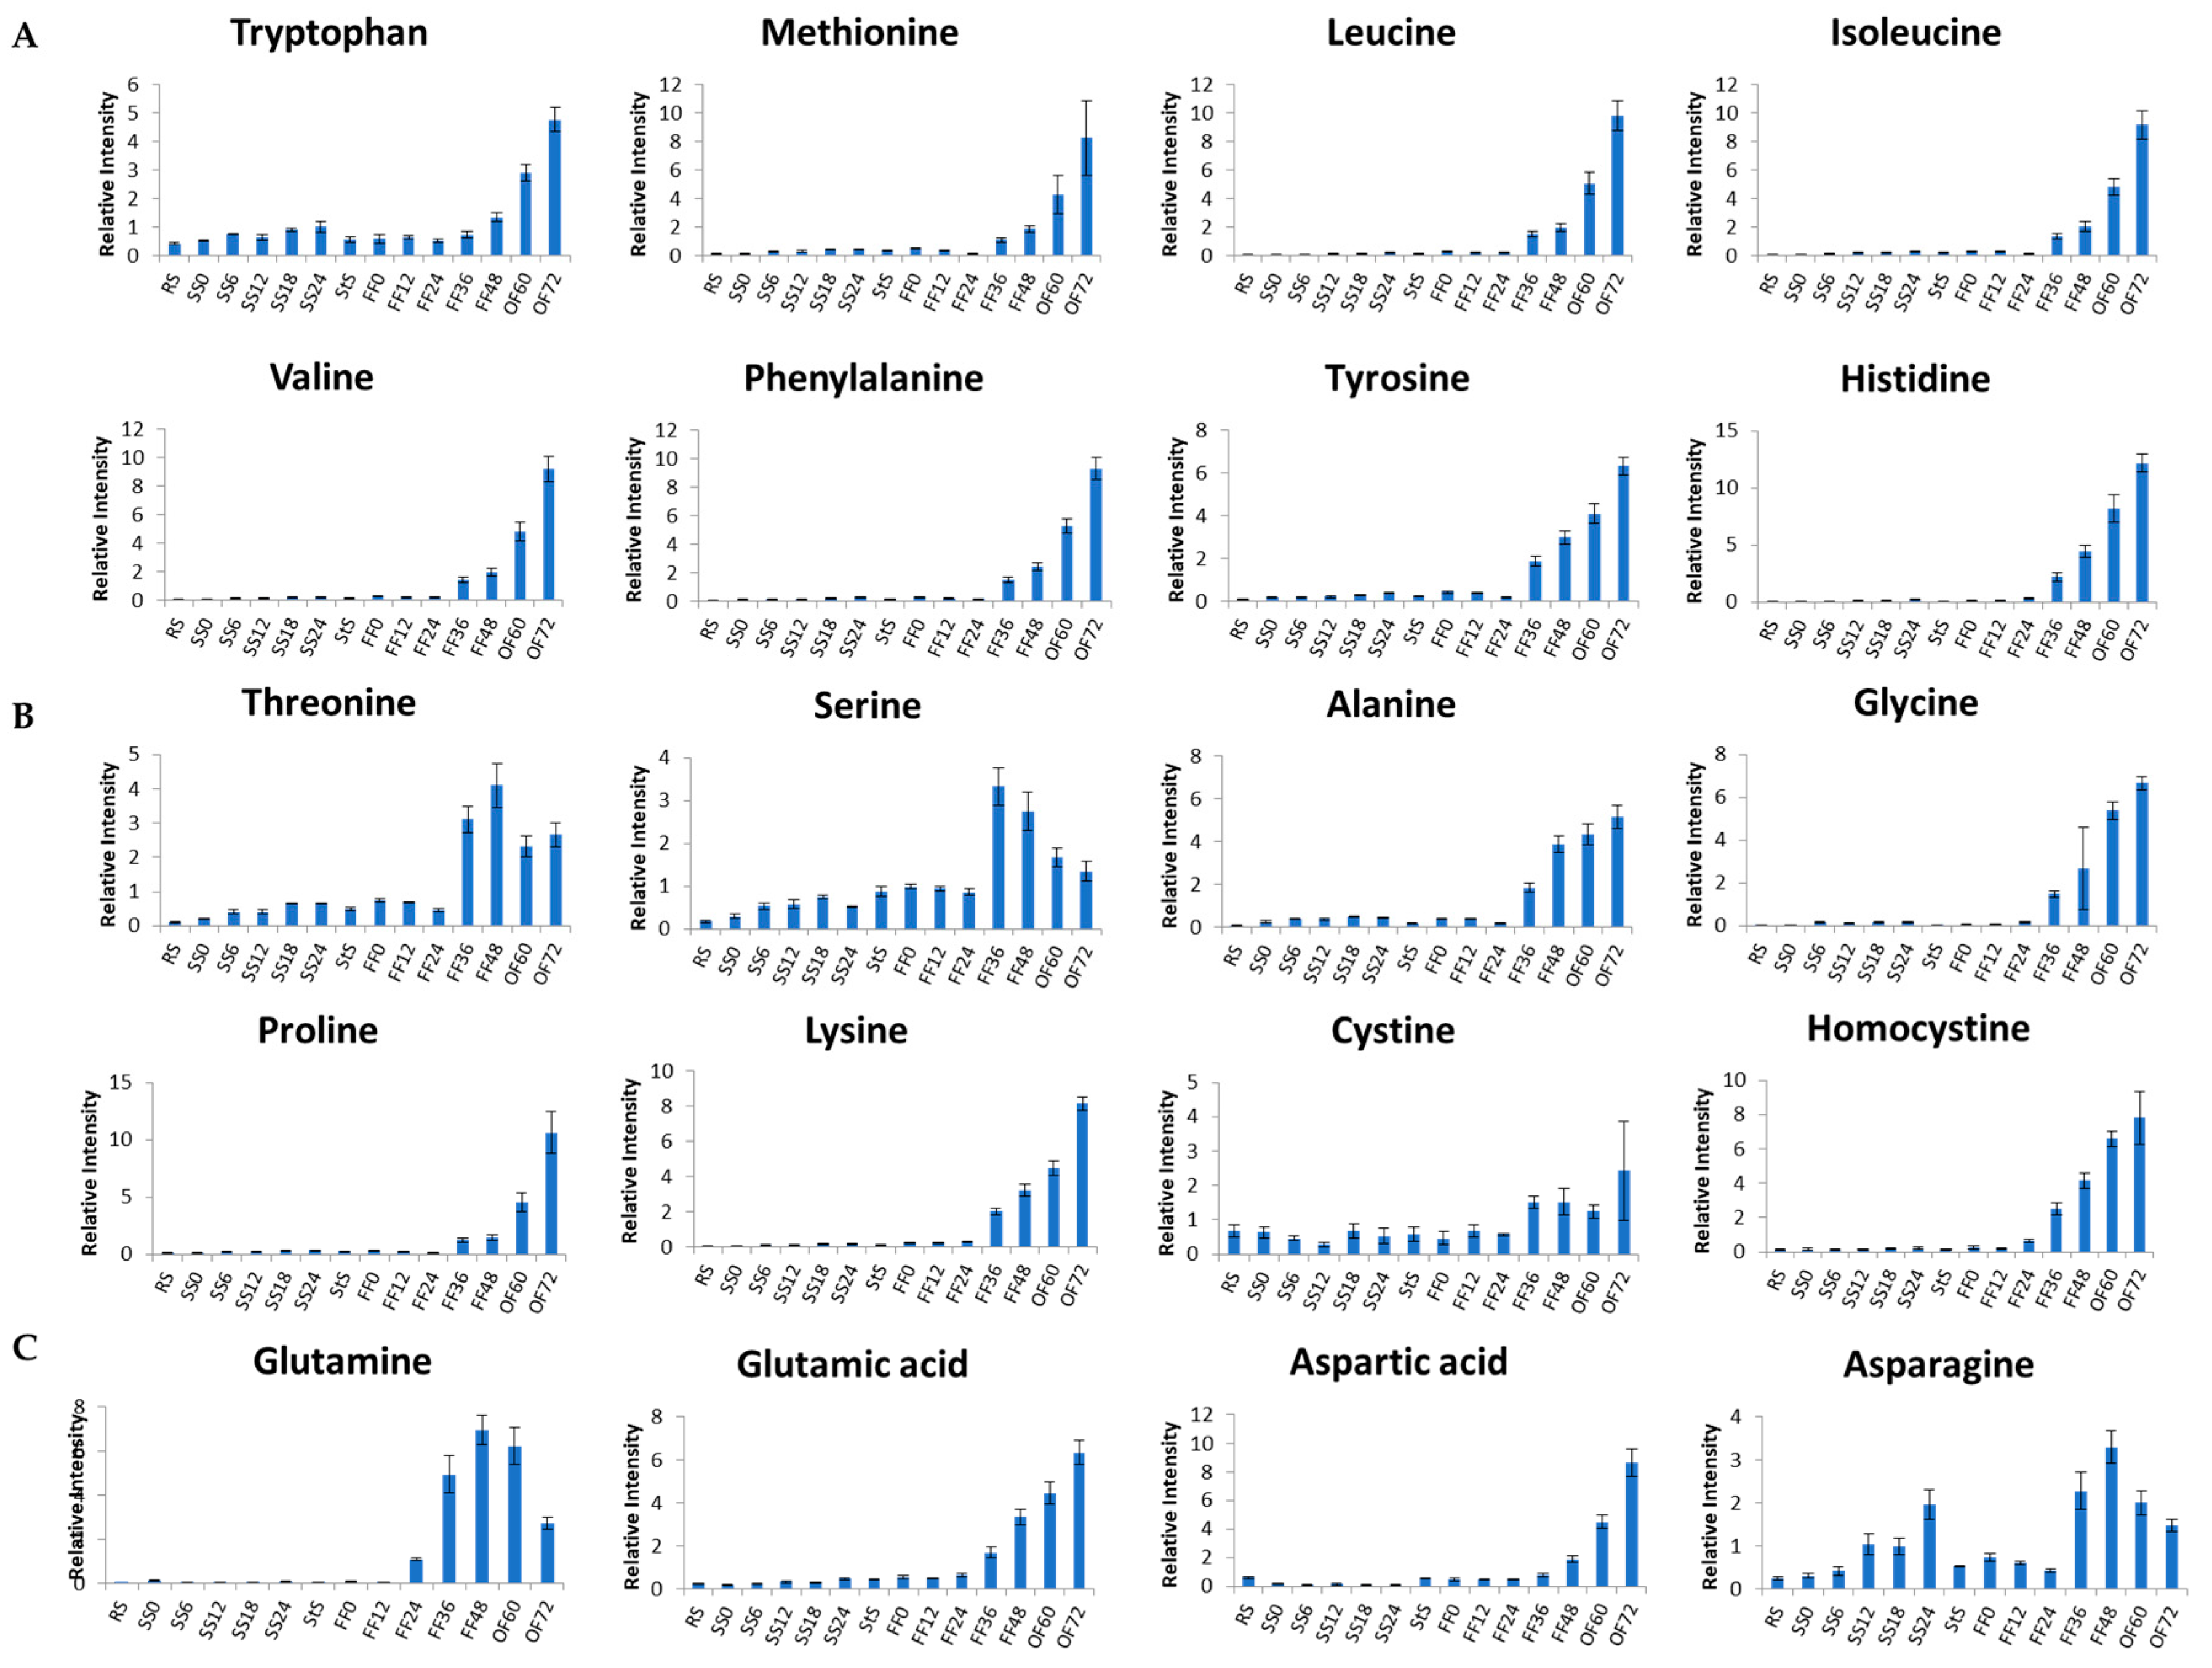
3.3. Metabolite Changes in Tempe Production, from RS to 48 h of FF
3.4. Metabolite Changes in Tempe Production from RS to 72 h of OF
4. Conclusions
Supplementary Materials
Author Contributions
Funding
Institutional Review Board Statement
Informed Consent Statement
Data Availability Statement
Acknowledgments
Conflicts of Interest
References
- Mary, A.; Meliala, A.; Dalais, F.S.; Wahlqvist, M.L. Tempe, a nutritious and healthy food from Indonesia. Asia Pac. J. Clin. Nutr. 2000, 9, 322–325. [Google Scholar] [CrossRef]
- Nout, M.J.R.; Kiers, J.L. Tempe fermentation, innovation and functionality: Update into the third millenium. J. Appl. Microbiol. 2005, 4, 789–805. [Google Scholar] [CrossRef] [PubMed]
- Keuth, S.; Bisping, B. Vitamin B12 production by Citrobacter freundii or Klebsiella pneumoniae during tempeh fermentation and proof of enterotoxin absence by PCR. Appl. Environ. Microbiol. 1994, 60, 1495–1499. [Google Scholar] [CrossRef] [PubMed] [Green Version]
- Klus, K.; Börger-Papendorf, G.; Barz, W. Formation of 6,7,4′-trihydroxyisoflavone (factor 2) from soybean seed isoflavones by bacteria isolated from tempe. Phytochemistry 1993, 34, 979–981. [Google Scholar] [CrossRef]
- Roubos-Van Den Hil, P.J.; Dalmas, E.; Nout, M.J.R.; Abee, T. Soya bean tempe extracts show antibacterial activity against Bacillus cereus cells and spores. J. Appl. Microbiol. 2010, 109, 137–145. [Google Scholar] [CrossRef] [Green Version]
- Witono, Y.; Widjanarko, S.B.; Mujianto; Rachmawati, D.T. Amino Acids Identification of Over Fermented Tempeh, The Hydrolysate and The Seasoning Product Hydrolysed by Calotropin from Crown Flower (Calotropis gigantea). Int. J. Adv. Sci. Eng. Inf. Technol. 2015, 5, 47–50. [Google Scholar]
- Egounlety, M.; Aworh, O.C. Effect of soaking, dehulling, cooking and fermentation with Rhizopus oligosporus on the oligosaccharides, trypsin inhibitor, phytic acid and tannins of soybean (Glycine max Merr.), cowpea (Vigna unguiculata L. Walp) and groundbean (Macrotyloma geocarpa Harms). J. Food Eng. 2003, 56, 249–254. [Google Scholar] [CrossRef]
- Rehms, H.; Barz, W. Degradation of stachyose, raffinose, melibiose and sucrose by different tempe-producing Rhizopus fungi. Appl. Microbiol. Biotechnol. 1995, 44, 47–52. [Google Scholar] [CrossRef]
- Reddy, N.R.; Pierson, M.D. Reduction in antinutritional and toxic components in plant foods by fermentation. Food Res. Int. 1994, 27, 281–290. [Google Scholar] [CrossRef]
- Moa, H.; Kariluoto, S.; Piironen, V.; Zhu, Y.; Sanders, M.G.; Vincken, J.P.; Wolkers-Rooijackers, J.; Nout, M.J.R. Effect of soybean processing on content and bioaccessibility of folate, vitamin B12 and isoflavones in tofu and tempe. Food Chem. 2013, 141, 2418–2425. [Google Scholar] [CrossRef]
- Kadar, A.D.; Aditiawati, P.; Astawan, M.; Putri, S.P.; Fukusaki, E. Gas chromatography coupled with mass spectrometry-based metabolomics for the classification of tempe from different regions and production processes in Indonesia. J. Biosci. Bioeng. 2018, 126, 411–416. [Google Scholar] [CrossRef] [PubMed]
- Handoyo, T.; Morita, N. Structural and Functional Properties of Fermented Soybean (Tempeh) by Using Rhizopus Oligosporus. Int. J. Food Prop. 2006, 9, 347–355. [Google Scholar] [CrossRef] [Green Version]
- Nurdini, A.L.; Nuraida, L.; Suwanto, A.S. Microbial growth dynamics during tempe fermentation in two different home industries. Int. Food Res. J. 2015, 22, 1668–1674. [Google Scholar]
- Mulyowidarso, R.K.; Fleet, G.H.; Buckle, K.A. Association of bacteria with the fungal fermentation of soybean tempe. J. Appl. Bacteriol. 1990, 68, 43–47. [Google Scholar] [CrossRef] [PubMed]
- Roubos-Van Den Hil, P.J.; Schols, H.A.; Rob Nout, M.J.; Zwietering, M.H.; Gruppen, H. First characterization of bioactive components in soybean tempe that protect human and animal intestinal cells against enterotoxigenic Escherichia coli (ETEC) infection. J. Agric. Food Chem. 2010, 58, 7649–7656. [Google Scholar] [CrossRef] [Green Version]
- Nout, M.J.R.; de Dreu, M.A.; Zuurbier, A.M.; Bonants-van Laarhoven, T.M.G. Ecology of controlled soyabean acidification for tempe manufacture. Food Microbiol. 1987, 4, 165–172. [Google Scholar] [CrossRef]
- Kato, H.; Rhue, M.R.; Nishimura, T. Role of Free Amino Acids and Peptides in Food Taste. In Proceedings of the Flavor Chemistry: Trends and Developments; ACS Symposium Series 388; American Chemical Society: Washington, DC, USA, 1989; pp. 158–174. [Google Scholar]
- Nishimura, T.; Kato, H. Taste of free amino acids and peptides. Food Rev. Int. 1988, 4, 175–194. [Google Scholar] [CrossRef]
- Hong, K.J.; Lee, C.H.; Sung, W.K. Aspergillus oryzae GB-107 fermentation improves nutritional quality of food soybeans and feed soybean meals. J. Med. Food 2004, 7, 430–435. [Google Scholar] [CrossRef]
- Kadar, A.D.; Astawan, M.; Putri, S.P.; Fukusaki, E. Metabolomics based study of the effect of raw materials to the end product of tempe—An indonesian fermented soybean. Metabolites 2020, 10, 367. [Google Scholar] [CrossRef]
- Ikram, M.M.M.; Ridwani, S.; Putri, S.P.; Fukusaki, E. GC-MS based metabolite profiling to monitor ripening-specific metabolites in pineapple (Ananas comosus). Metabolites 2020, 10, 134. [Google Scholar] [CrossRef] [Green Version]
- Ariani, S.R.D.; Matsjeh, S.; Mustofa; Purwono, B. Quantitative analysis of L-Dopa (L-3,4-dihydroxyphenylalanine) content in extracts of various products from velvet bean (Mucuna pruriens (L.) DC.) tempe processing. Orient. J. Chem. 2016, 32, 2921–2927. [Google Scholar] [CrossRef] [Green Version]
- Roswanjaya, Y.P. Pembuatan Kecap yang Mengandung Isoflavon Faktor-2 (6,7,4′-Trihidroksi Isoflavon) Dari Bahan Dasar Tempe; ITB: Bandung, Indonesia, 2006. [Google Scholar]
- Bujang, A.; Taib, N.A. Changes on amino acids content in soybean, garbanzo bean and groundnut during pre-treatments and tempe making. Sains Malays. 2014, 43, 551–557. [Google Scholar]
- Mulyowidarso, R.K.; Fleet, G.H.; Buckle, K.A. The microbial ecology of soybean soaking for tempe production. Int. J. Food Microbiol. 1989, 8, 35–46. [Google Scholar] [CrossRef] [PubMed]
- Shibata, K.; Miyoshi, K.; Watanabe, Y.; Yasuhara, Y. Effects of Boiling and Steaming by Steam Convection Oven on Isoflavone Derivatives in Soybeans. Nippon. Eiyo Shokuryo Gakkaishi 2006, 59, 305–312. [Google Scholar] [CrossRef] [Green Version]
- Prameswari, H.A.; Nursiwi, A.; Zaman, M.Z.; Ishartani, D.; Sari, A.M. Changes in chemical and sensory characteristics of gunungkidul’s lamtoro (Leucaena leucocephala) tempeh during extended fermentation. IOP Conf. Ser. Earth Environ. Sci. 2021, 828, 012001. [Google Scholar] [CrossRef]
- Utami, R.; Hanny Wijaya, C.; Nuryani Lioe, H. Taste of Water-Soluble Extracts Obtained from Over-Fermented Tempe. Int. J. Food Prop. 2015, 19, 2063–2073. [Google Scholar] [CrossRef]
- Gunawan-Puteri, M.D.P.T.; Hassanein, T.R.; Prabawati, E.K.; Wijaya, C.H.; Mutukumira, A.N. Sensory Characteristics of Seasoning Powders from Overripe Tempeh, a Solid State Fermented Soybean. Procedia Chem. 2015, 14, 263–269. [Google Scholar] [CrossRef] [Green Version]
- Kim, Y.-B.; Choi, Y.-S.; Ku, S.-K.; Jang, D.-J.; binti Ibrahim, H.H.; Moon, K.B. Comparison of quality characteristics between belacan from Brunei Darussalam and Korean shrimp paste. J. Ethn. Foods 2014, 1, 19–23. [Google Scholar] [CrossRef] [Green Version]
- Mulyowidarso, R.K.; Fleet, G.H.; Buckle, K.A. Changes in the concentration of carbohydrates during the soaking of soybeans for tempe production. Int. J. Food Sci. Technol. 1991, 26, 595–606. [Google Scholar] [CrossRef]
- Rahmawati, D.; Astawan, M.; Putri, S.P.; Fukusaki, E. Gas chromatography-mass spectrometry-based metabolite profiling and sensory profile of Indonesian fermented food (tempe) from various legumes. J. Biosci. Bioeng. 2021, 132, 487–495. [Google Scholar] [CrossRef]
- Kim, S.H.; Lee, K.A. Evaluation of taste compounds in water-soluble extract of a doenjang (soybean paste). Food Chem. 2003, 83, 339–342. [Google Scholar] [CrossRef]
- Hassanein, T.R.; Prabawati, E.K.; Gunawan-Puteri, D.M.T.P. Analysis of Chemical and Microbial Changes during Storage of Overripe Tempeh Powder as Seasoning Material. Int. J. Sci. Eng. 2015, 8, 131–134. [Google Scholar] [CrossRef]
- Zhou, Y.; Zhu, Y.; Dai, L.; Men, Y.; Wu, J.; Zhang, J.; Sun, Y. Efficiency Analysis and Mechanism Insight of that Whole-Cell Biocatalytic Production of Melibiose from Raffinose with Saccharomyces cerevisiae. Appl. Biochem. Biotechnol. 2017, 181, 407–423. [Google Scholar] [CrossRef] [PubMed]
- Dajanta, K.; Chukeatirote, E.; Apichartsrangkoon, A.; Frazier, R.A. Enhanced aglycone production of fermented soybean products by Bacillus species. Acta Biol. Szeged. 2009, 53, 93–98. [Google Scholar]


| No | Data Set | Time Treatment | Sampling Code |
|---|---|---|---|
| 1. | Soybean soaking | Raw soybean | RS |
| 0 h | SS0 | ||
| 6 h | SS6 | ||
| 12 h | SS12 | ||
| 18 h | SS18 | ||
| 24 h | SS24 | ||
| Steamed soybean | StS | ||
| 2. | Fungal fermentation | 0 h | FF0 |
| 12 h | FF12 | ||
| 24 h | FF24 | ||
| 36 h | FF36 | ||
| 48 h | FF48 | ||
| 3. | Over-fermentation | 60 h | OF60 |
| 72 h | OF72 |
Disclaimer/Publisher’s Note: The statements, opinions and data contained in all publications are solely those of the individual author(s) and contributor(s) and not of MDPI and/or the editor(s). MDPI and/or the editor(s) disclaim responsibility for any injury to people or property resulting from any ideas, methods, instructions or products referred to in the content. |
© 2023 by the authors. Licensee MDPI, Basel, Switzerland. This article is an open access article distributed under the terms and conditions of the Creative Commons Attribution (CC BY) license (https://creativecommons.org/licenses/by/4.0/).
Share and Cite
Prativi, M.B.N.; Astuti, D.I.; Putri, S.P.; Laviña, W.A.; Fukusaki, E.; Aditiawati, P. Metabolite Changes in Indonesian Tempe Production from Raw Soybeans to Over-Fermented Tempe. Metabolites 2023, 13, 300. https://doi.org/10.3390/metabo13020300
Prativi MBN, Astuti DI, Putri SP, Laviña WA, Fukusaki E, Aditiawati P. Metabolite Changes in Indonesian Tempe Production from Raw Soybeans to Over-Fermented Tempe. Metabolites. 2023; 13(2):300. https://doi.org/10.3390/metabo13020300
Chicago/Turabian StylePrativi, Mahensa Billqys Nurhayati, Dea Indriani Astuti, Sastia Prama Putri, Walter A. Laviña, Eiichiro Fukusaki, and Pingkan Aditiawati. 2023. "Metabolite Changes in Indonesian Tempe Production from Raw Soybeans to Over-Fermented Tempe" Metabolites 13, no. 2: 300. https://doi.org/10.3390/metabo13020300