Abstract
Triploid rainbow trout can adapt to various dietary lipid levels; however, the mechanisms of systematic adaptation are not well understood. To investigate how adult triploid rainbow trout maintains lipid hemostasis under different exogenous lipid intake, a 77-day feeding trial was conducted. Diets with lipid contents of 20%, 25%, and 30% were formulated and fed to triploid rainbow trout with an initial weight of 3 ± 0.02 kg, and they were named L20, L25, and L30 group, respectively. Results showed that the condition factor, hepatosomatic index, liver color, and plasma triglyceride were comparable among three groups (p > 0.05), whereas the value of specific growth rate, viscerosomatic index, and liver glycogen content gradually increased with increasing dietary lipid level (p < 0.05). A significantly highest value of plasma glucose and nonesterified fatty acids were found in the L30 group (p < 0.05), whereas the significantly higher content of plasma total cholesterol, high-density lipoprotein–cholesterol, and low-density lipoprotein–cholesterol was found in the L25 group compared with those in L20 group (p < 0.05). As for lipid deposition, abdominal adipose tissue, and muscle were the main lipid storage place for triploid rainbow trout when tissues’ weight is taken into consideration. Overall quantitative PCR showed that the lipid transport and glycolysis were upregulated, and fatty acids oxidative was downregulated in liver when fish were fed low lipid diets. It meant that the liver was the primary lipid metabolizing organ to low lipid diet feeding, which could switch energy supply between glycolysis and fatty acids oxidation. Fish fed with a moderate dietary lipid level diet could increase lipid uptake and promote lipogenesis in muscle. Abdominal adipose tissue could efficiently uptake excess exogenous free fatty acid through upregulating fatty acid uptake and synthesis de novo and then storing it in the form of triglyceride. Excess lipid uptake is preferentially stored in abdominal adipose tissue through coordinated fatty acid uptake and fatty acid synthesis de novo as dietary lipid levels increased. In summary, triploid rainbow trout can adapt to various dietary lipid levels by coordinating metabolism in different tissues.
1. Introduction
Rainbow trout (Oncorhynchus mykiss) is one of the most widely cultured fish species in the world. Early sexual development in salmonids is a financial cost for aquaculture because metabolic energy is diverted from somatic growth to reproduction, resulting in a decline in appearance and fillet quality []. Therefore, rainbow trout with three sets of chromosomes (triploid rainbow trout) were produced to avoid gonads development. Due to their fast growth, delicious flesh, and high economic value, triploid rainbow trout have been widely cultured in China. Diets are essential for intensive fish farming. Dietary lipids play a vital role in fish growth, development, and metabolic processes. According to our previous study, subadult triploid rainbow trout can maintain lipid homeostasis by accumulating lipids in the muscle under various dietary lipid levels and tolerate high dietary lipid levels (up to 29.4%) with no negative effect on fish growth and liver health [,]. Few studies, or studies that only looked at specific organs, have been done on the impact of dietary lipids on lipid metabolism in adult triploid rainbow trout. Only one article in Nile tilapia (Oreochromis niloticus) reported the systematic adaptation of lipid metabolism through coordinating different tissues []. It is necessary to acquire additional knowledge about the systematic adaptation of adult triploid rainbow trout under various dietary lipid levels.
Increasing dietary lipid content generally improves lipid deposition in fish [,], and it is well known that excessive lipids are mainly stored in tissues including the liver, intestine, abdominal cavity, and muscle []. From the substance and energy metabolism point of view, the deposition of lipids in cells depends on lipid synthesis and lipolysis, which correlate with energy homeostasis []. Several key enzymes and transcriptional factors are involved in regulating these metabolic processes []. By hydrolyzing circulating triglycerides in the form of chylomicrons and very low-density lipoproteins, lipoprotein lipase (LPL) produces free fatty acids and 2-monoacylglycerols []. The free fatty acids were then taken up by the cluster of differentiation (cd36) [] and transported intracellularly by fatty acid binding proteins (FABPs) []. Fatty acid synthetase (fas) is involved in fatty acid synthesis, whereas carnitine palmitoyl transferase 1 (cpt1) catalyzes the transport of long-chain fatty acids into the mitochondrial matrix, where they are required for the process of β-oxidation []. Being nuclear transcription factors, peroxisome proliferator-activated receptor (ppar) α, β/δ, and γ are believed to modulate lipid homeostasis by regulating the expression of the above genes []. Additionally, as neutral lipids are deposited as lipid droplets within cells, the accumulation and mobilization of lipid droplets are crucial in regulating lipid hemostasis from the perspective of subcellular structure. Lipid droplets are the universal cellular organelles for the transitory or long-term storage of lipids, consisting of a core of neutral lipids surrounded by a phospholipid monolayer (probably derived from the endoplasmic reticulum) and several dozens of associated proteins [,]. The perilipin family is the predominant structural protein of lipid droplets (LD), which sequester lipids by preventing lipase action on lipid droplets [,]. Long-lived proteins, LDs, or organelles that are no longer required can be destroyed via the evolutionarily conserved intracellular process known as autophagy for quick cell turnover [,]. The coordination of the above genes’ expression in different tissues has not been reported in triploid rainbow trout.
Therefore, the objective of the present study was to elucidate and clarify how adult triploid rainbow trout maintain lipid hemostasis in related tissues to adapt to various dietary lipid levels.
2. Materials and Methods
2.1. Fish Feed, Feeding, and Sampling
The current investigation was carried out in compliance with the Standard Operating Procedures of the Qinghai University Guide for the Use of Experimental Animals. A group of female triploid rainbow trout with an initial average weight of 3 ± 0.02 kg was obtained from Qinghai Minze Longyangxia Ecological Aquaculture Co., Ltd., China. We evenly divired 4500 fish into nine net cages (8 m × 8 m × 8 m). Three isonitrogenous experimental diets (dietary protein level: 38% dry matter) with graded lipid levels of 20, 25, and 30% were formulated as described in [], and they were named L20, L25, and L30 groups, respectively. Diet formulation and proximate compositions of the experimental diets are shown in Table 1. Each diet was randomly fed three net cages for 77 days. The water temperature stayed between 8 and 16 °C, and the dissolved oxygen concentration exceeded 7 mg/L. At the end of the feeding trial, all the experimental fish fasted for 3 days. One fish per net cage was stored at −20 °C for the determination of whole-body lipid content. Six fish per net cage was randomly selected and anesthetized with eugenol (1: 10,000) (Shanghai Reagent Corp, Shanghai, China). After the weight of the body, viscera, and liver were recorded, and the length of fish was measured, liver, abdominal adipose tissue, and dorsal muscle samples were taken and kept in liquid nitrogen, then stored at −80 °C for later analysis. Blood collection from the caudal vein, and sampled blood were kept at 4 °C; the serum was separated by centrifugation (3000 rpm for 10 min) at 4 °C and stored in liquid nitrogen before being frozen at −80 °C. The liver samples of three fish per cage were preserved with 4% paraformaldehyde for morphological analysis.

Table 1.
Formulation and proximate compositions of the experimental diets (% dry matter).
2.2. Chemical Analysis
The plasma glucose, triglyceride, total cholesterol, higher-density lipoprotein cholesterol (HDL-C), and low-density lipoprotein cholesterol (LDL-C) were assayed the same as described in []. Plasma non-esterified fatty acids (NEFA) were determined using commercial kits (Jiancheng Bioengineering Institute, Nanjing, China) according to the manufacturer’s protocols. As previously reported [], the lipid content of whole fish, abdominal adipose tissue, liver, and dorsal muscle was extracted using chloroform: methanol (2:1, v/v).
2.3. Hepatic Morphology Analysis
The paraffin sections were prepared using normal histological procedures. Briefly, they were transformed into paraffin wax blocks, sectioned to a thickness of 6 μm using a microtome, and stained with hematoxylin and eosin (HE) or periodic acid-Schiff (PAS) for examination by light microscopy (ECLIPSE NieU, Nikon Corporation, Tokyo, Japan). For frozen sections, another sample was randomly selected from each cage and sliced with a freezing microtome into 7-μm-thick sections that were dyed with oil red (OR).
2.4. qRT-PCR Analysis of Lipid-Related Genes
RNA isolation, cDNA synthesis, and qPCR were performed as described previously []. RNA simple total RNA Kit (TIANGEN, China) was used to isolate total RNA from the liver, abdominal adipose tissue, and muscle of triploid rainbow trout according to the manufacturer’s protocol. RNA quality and quantity were determined by measuring absorbance at 260 nm and 280 nm. RNA was reverse transcribed into cDNA using the PrimeScriptTM RT reagent Kit (Takara, Japan).
The mRNA expression levels of the genes in the liver, abdominal adipose tissue, and muscle were assayed by quantitative RT-PCR using the TB GREEN® Premix Ex TaqTMII (Tli RNaseH Plus) Kit (Takara, Japan). PCR reactions of 10 μL final volume contained 1 μL of cDNA, 0.3 μL (10 μM) of forward and backward primer, 5 μL of PCRTaqMix (2×), and 3.4 μL of ddH2O. The PCR process was performed as follows: 95 °C for 5 min, 95 °C for 5 s, and 60 °C for 30 s, followed by 72 °C for 1 s. The relative mRNA expression levels of target genes were calculated by the 2−ΔΔCt method.
The genes investigated in this study were related to lipid uptake (lipoprotein lipase [lpl], cluster of differentiation 36 [cd36], fatty acid transport protein 1 [fatp1], fatty acid transport protein 5 [fatp5]); intracellular fatty acid transportation (fatty acid binding protein 3 [fabp3], fatty acid binding protein 4 [fabp4]); fatty acid biosynthesis de novo (fatty acid synthase [fas], acetyl-CoA carboxylase α [accα]); fatty acid β-oxidation (carnitine palmitoyl transferase 1 [cpt1], acetyl-CoA oxidase [aco]); metabolic regulatory factors (peroxisome proliferator-activated receptor α [pparα], peroxisome proliferator-activated receptorβ [pparβ], peroxisome proliferator-activated receptorγ [pparγ] and sterol regulatory element binding protein 1 [srebp1]); very low-density lipoprotein related protein (apoprotein B100 [apoB100] and apoprotein E [apoE]); lipid droplet metabolism (perilipin1 [plin1], perilipin3 [plin3]) and autophagy (autophagy-related gene 7 [atg7], autophagy-related gene 12 [atg12]); carbohydrate metabolism (glucokinase [gk], pyruvate kinase [pk], glucose-6-phosphatase [g6pase], and phosphoenol pyruvate carboxykinase [pepck]). Specific primer of the genes was designed referring to the relevant cDNA sequences of rainbow trout listed in Table 2.
Table 2.
Primer sequences for real-time quantitative PCR.
2.5. Calculations
Specific growth rate (SGR, %/day) = 100 × ln [final body weight (g)/initial body weight (g)]/days of the experiment;
Condition factor (CF) = 100 × [body weight (g)]/[body length (cm)]3;
Viscerosomatic index (VSI, %) = 100 × [viscera weight (g)]/[body weight (g)];
Hepatosomatic index (HSI, %) = 100 × [hepatic weight (g)]/[body weight (g)].
2.6. Statistical Analysis
Data were assessed by one-way ANOVA using SPSS 25.0 for windows. When differences were significant (p < 0.05), Tukey’s test was used to compare the means among individual treatments.
3. Results
3.1. Growth Performance, Organ Indexes, and Plasma Biochemistry
As shown in Table 3, fish from the L30 group had significantly higher values of SGR than the L20 and L25 groups (p < 0.05). No significant difference was found in CF, HSI, and liver color (p > 0.05). As the level of dietary lipid increased, VSI gradually increased with a significantly higher value observed in the L30 group compared with the L20 group (p < 0.05). The liver glycogen content significantly increased as dietary lipid content increased from 20% to 30% (p < 0.05).
Table 3.
Growth performance, organ indexes, and lipid content of whole fish, abdominal adipose tissue, liver, and muscle of triploid rainbow trout fed the experimental diets for 77 days 1.
No significant difference was found in plasma triglyceride (p > 0.05). A significantly higher value of plasma glucose and NEFA were found in the L30 group compared to L20 and L25 groups (p < 0.05), respectively. A significantly higher content of plasma total cholesterol, HDL-C, and LDL-C was found in the L25 group compared with those in the L20 group (p < 0.05).
3.2. Lipid Deposition
The lipid content of whole fish, abdominal adipose tissue, liver, and muscle tissues are shown in Table 4. The significantly higher value of whole fish lipid content (calculated as g/100 g tissue wet weight) was observed in L25 and L30 groups (p < 0.05). As dietary lipid content increased, the lipid content of abdominal adipose tissue and muscle gradually increased and reached their maximum average value in the L30 group (p < 0.05). No significant difference was observed for hepatic lipid content (p > 0.05). When the weight of tissues and the whole body were considered (calculated as g/tissue of a 100 g fish), the lipid content of muscle gradually increased as dietary lipid increased (p < 0.05), the significantly highest value of abdominal adipose tissue lipid content was found in the L30 group (p < 0.05). No significant difference in hepatic lipid content was observed (p > 0.05).
Table 4.
Plasma biochemical parameters of triploid rainbow trout fed the experimental diets for 77 days 1.
3.3. The Histological Appearance of Liver
As shown in Figure 1, the hepatocellular structure of all treatments seems not obviously different by using HE staining (A1, B1, C1). By applying PAS (A2, B2, C2) and OR (A3, B3, C3) staining, glycogen and lipid droplets were stained with purple and red color, respectively. With increasing dietary lipid levels, liver glycogen staining deepens in purple, whereas OR staining found no significant changes in lipid droplet size or quantity.
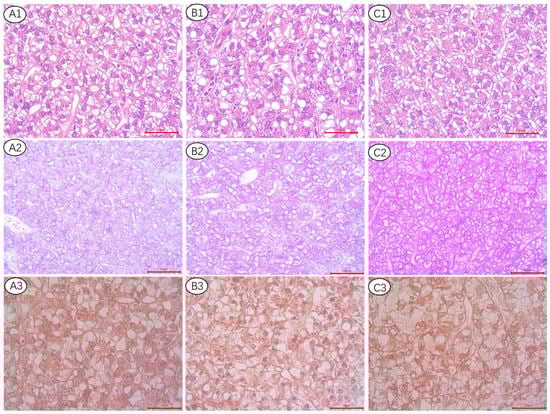
Figure 1.
Histological appearance of liver from triploid rainbow trout fed the 20% lipid content (A1–A3), 25% lipid content (B1–B3), and 30% lipid content (C1–C3) diet, respectively. Hematoxylin-eosin (HE) staining: (A1–C1). Magnification ×400. Periodic acid-Schiff (PAS) staining: (A2–C2), Magnification ×400. Oil red staining: (A3–C3), Magnification ×400.
3.4. The Relative mRNA Expression Levels of Hepatic Metabolism Genes
Data on hepatic mRNA expression of genes related to lipid metabolism and glycometabolics are shown in Figure 2. The mRNA expression of fatp5 and fatp1 genes were down-regulated in the L30 group compared with that in the L20 group (p < 0.05). However, there were no significant differences in the mRNA expression levels of lpl and cd36 genes (p > 0.05). Dietary lipid level did not significantly influence the gene expression of fabp4, accα, and apoE (p > 0.05); however, the significantly higher gene expression of fabp3 and fas were found in the L25 group compared with that in the L30 group (p < 0.05). The hepatic mRNA expression levels of cpt1 and aco genes increased in fish-fed diets with high dietary lipid levels (p < 0.05). The significantly highest gene expression of apoB100 was found in the L25 group compared with that in L20 and L30 groups (p < 0.05). There were no significant differences in the hepatic mRNA levels of pparα, pparβ, plin1, and atg7 (p > 0.05). A significantly higher expression level of plin3 was observed in the L20 group (p < 0.05). The gene expression of pparγ and atg12 decreased as dietary lipid levels increased (p < 0.05). The significantly higher expression levels of gk, pk, and G6pase genes were observed in the L20 group (p < 0.05). There was no significant difference in the mRNA expression levels of pepck (p > 0.05).
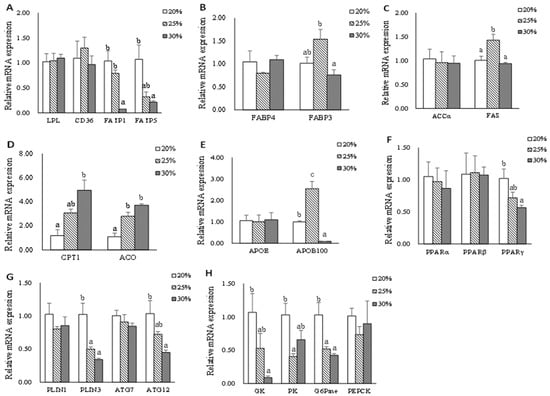
Figure 2.
The mRNA expression of genes related to lipid metabolism in hepatic of triploid rainbow trout fed with diets containing low (20%), medium (25%), and high (30%) lipid content for 77 days. (A) The relative mRNA abundance of lpl, cd36, fatp1, and fatp5 shows the ability of lipid uptake. (B) The relative mRNA abundance of fabp3 and fabp4 shows the activity of intracellular FA transport. (C) The relative mRNA abundance of accα and fas shows the FA biosynthetic activity de novo. (D) The relative mRNA abundance of cpt1 and aco shows the activity of FA β-oxidation. (E) The relative mRNA abundance of apoE and apoB100 which are important components of VLDL. (F) The relative mRNA abundance of pparα, pparβ, and pparγ in the liver. (G) The relative mRNA abundance of plin1, plin3, atg7, and atg12 in the liver. (H) The relative mRNA abundance of gk, pk, G6Pase, and pepck in the liver. Values are expressed as the means ± S.E.M. (n = 3). Statistical significance was evaluated using one-way ANOVA, followed by Tukey’s test. Values with different letters on columns statistically differ at p < 0.05.
3.5. The Relative mRNA Expression Levels of Abdominal Adipose Tissue Metabolism Genes
Data on adipose tissue mRNA expression of genes related to lipid metabolism are shown in Figure 3. The significantly highest gene expression of lpl was found in the L25 group compared with that in L20 and L30 groups (p < 0.05). The mRNA expressions of cd36 and fabp4 were up-regulated (p < 0.05). The significantly higher gene expression of fatp1 was found in the L25 group compared with that in L20 and L30 groups (p < 0.05). However, the significantly higher gene expression of fatp5 was found in L20 and L25 groups compared with that in the L30 group (p < 0.05). The mRNA expression levels of accα, fas, and aco genes in the L30 group were significantly higher than the L20 group (p < 0.05). The mRNA expression of the cpt1 gene was up-regulated in the L25 group compared with that in the L20 group (p < 0.05). The significantly highest gene expression of pparβ and pparγ was found in the L25 group, whereas the significantly highest gene expression of the pparα gene was found in the L20 group (p < 0.05). The significantly higher expression levels of plin1, plin3, atg7, and atg12 genes were observed in the L25 group (p < 0.05).
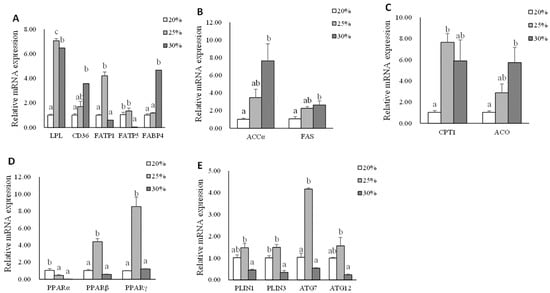
Figure 3.
The mRNA expression of genes related to lipid metabolism in abdominal adipose tissue of triploid rainbow trout fed with diets containing low (20%), medium (25%), and high (30%) lipid content for 77 days. (A) The relative mRNA abundance of lpl, cd36, fatp1, fatp5, and fabp4 shows the ability of lipid uptake. (B) The relative mRNA abundance of accα and fas shows the FA biosynthetic activity de novo. (C) The relative mRNA abundance of cpt1 and aco shows the activity of FA β-oxidation. (D) The relative mRNA abundance of pparα, pparβ, and pparγ in adipose tissue. (E) The relative mRNA abundance of plin1, plin 3, atg7, and atg12 in adipose tissue. Values are expressed as the means ± S.E.M. (n = 3). Statistical significance was evaluated using one-way ANOVA, followed by Tukey’s test. Values with different letters on columns statistically differ at p < 0.05.
3.6. The Relative mRNA Expression Levels of Muscle Metabolism Genes
Data on muscle mRNA expression of genes related to lipid metabolism are shown in Figure 4. The significantly higher gene expression of lpl was found in L20 and L25 groups compared with that in the L30 group (p < 0.05). The mRNA expression levels of cd36, fatp1, fatp5, fabp3, fabp4, cpt1, aco, and srebp1 genes in L25 group were significantly higher than L20 and L30 groups (p < 0.05). There were no significant differences in the mRNA expression levels of the accα gene in the muscle of triploid rainbow trout (p > 0.05). The mRNA expression of fas gene was down-regulated as dietary lipid level increased (p < 0.05). The significantly higher gene expression of pparα was found in L25 and L30 groups compared with that in the L20 group (p < 0.05). There were no significant differences in the mRNA expression levels of pparβ, pparγ, plin1, plin3, atg7, and atg12 (p > 0.05).
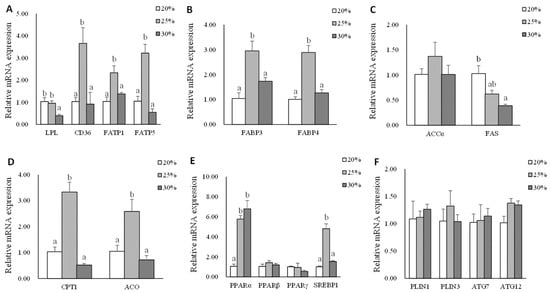
Figure 4.
The mRNA expression of genes related to lipid metabolism in muscle of triploid rainbow trout fed with diets containing low (20%), medium (25%), and high (30%) lipid content for 77 days. (A) The relative mRNA abundance of lpl, cd36, fatp1, and fatp5 shows the ability of lipid uptake. (B) The relative mRNA abundance of fabp3 and fabp4 shows the activity of intracellular FA transport. (C) The relative mRNA abundance of accα and fas shows the FA biosynthetic activity de novo. (D) The relative mRNA abundance of cpt1 and aco shows the activity of FA β-oxidation. (E) The relative mRNA abundance of pparα, pparβ, pparγ, and srebp1 in muscle. (F) The relative mRNA abundance of plin1, plin3, atg7, and atg12 in muscle. Values are expressed as the means ± S.E.M. (n = 3). Statistical significance was evaluated using one-way ANOVA, followed by Tukey’s test. Values with different letters on columns statistically differ at p < 0.05.
4. Discussion
In this study, triploid rainbow trout grew from 3 to 4 kg during 77 days. At the end of the trial, fish from the L30 group had a significantly higher value of specific growth rate (SGR) than the L20 group (p < 0.05). This was in accordance with our previous study on subadult triploid rainbow trout []. Although there was no significant difference for CF in the present study, the upward trend of VSI and lipid content of whole fish was consistent. A previous study in rainbow trout also found that VSI and final whole-body lipid content was positively related to dietary lipid levels and increased lipid deposition in the visceral cavity of larger trout mostly due to a hypertrophic response []. No significant changes in the hepatosomatic index (HSI), liver color, and hepatic lipid content were observed among the three groups, which suggested that adult triploid rainbow trout could maintain hepatic lipid homeostasis and therefore, tolerate dietary lipid levels (varied from 20% to 30%). Similar findings in our previous study showed that subadult triploid rainbow trout could maintain hepatic lipid homeostasis when fed diets with lipid levels ranging from 14.8% to 29.4% []. When it comes to lipid synthesis and storage, visceral adipose tissue and the liver of fish are both important organs that play a role in maintaining lipid homeostasis and energy balance [,,]. Thus, we further analyzed the lipid content of different tissues. The results of the study found that the lipid content of abdominal adipose tissue and muscle gradually increased and reached their maximum average value in the L30 group. When the weight of tissues and the whole body were evaluated (measured as g/tissue of a 100 g fish), the muscle tissue (average value ranged from 7.8–8.59 g/tissue of a 100 g fish) contributes slightly more to the lipid deposition than abdominal adipose tissue (average value ranged from 6.57–8.07 g/tissue of a 100 g fish). This is different from subadult rainbow trout, in which was found that the muscle tissue (average value ranged from 5.64–6.74 g/tissue of a 100 g fish) contributes equally as visceral tissue (average value ranged from 4.97–6.42 g/tissue of a 100 g fish) to the lipid accumulation from the whole fish perspective. Although both abdominal adipose tissue and muscle are the main lipid deposition sites for triploid rainbow trout, adult triploid rainbow trout seemed to prefer to accumulate lipids in the muscle. A similar study on another fatty fish, Atlantic salmon (Salmo salar) largely confirmed these findings, Bjerkeng et al. [] observed that fish fed high lipid levels diets obtained higher lipid content of total carcass lipid, abdomen, and myosepta.
The liver, which plays a crucial role in regulating lipid metabolism, uptakes and processes chylomicron remnants and actively produces cholesterol, bile acids, and fatty acids during the postprandial period. The esterified fatty acids are then stored in lipid droplets or released as VLDL [,,]. To explore the mechanism of rainbow trout adapting to various lipid levels, we further examined the key gene expression of lipid metabolism. Significantly higher fatty acid transport (fatp1 and fatp5) and lower fatty acids (FA) oxidation gene (cpt1 and aco) expression were observed in the L20 group, which suggested that rainbow trout increased lipid transport and decreased fatty acids oxidative energy supply to counter the potential negative effects of limited exogenous lipid. This might be related to the higher mRNA expression of pparγ in the L20 group. By specifically regulating the expression of the genes for fatp1 and cd36, pparγ regulates adipogenesis and keeps the balance between glucose and lipid oxidation []. Accordingly, glycolysis (gk, pk) was also upregulated in the L20 group. This is similar to our previous results on subadult rainbow trout, which suggested that rainbow trout could switch energy supply between glycolysis and fatty acids oxidation []. The results of the study also found that liver glycogen content significantly increased with increasing dietary lipid levels, which was consistent with the histomorphology reflection of the liver. LD-associated proteins perilipin (plin) are crucial for both adipogenesis and lipolysis []. Perilipin 3 covers nascent neutral lipids and affects the ability of the cell to accumulate TG [,]. Autophagy is crucial for basal homeostasis and is associated with the energy balance and nutritional state of cells []. This process is carried out by autophagy-related genes (ATGs), which mobilize lipid droplets to provide fatty acids for mitochondrial oxidation []. In the present study, the mRNA expression of lipid droplet mobilization (plin3) and autophagy (atg12) genes were upregulated in the L20 group. This suggests that when exogenous lipid intake is limited, the liver regulates lipid droplet mobilization and autophagy to maintain intracellular lipid homeostasis. Consistently, hepatic OR staining showed that the size or number of lipid droplets had no significant changes among the three groups suggesting that triploid rainbow trout had adaptive mechanisms to maintain lipid homeostasis in the liver. Adipose and muscle tissues reacted similarly when fish were fed an L20 diet, both adapted to low lipid intake by down regulated lipid uptake, transport, and β-oxidation. The plasma TG content was kept constant as a result of lipid homeostasis. Therefore, fish fed with a low lipid diet could increase FA uptake and accelerate the utilization of carbohydrates to satisfy the physiological requirement of lipid utilization, and this process is mainly performed in the liver.
When fish were fed with moderate dietary lipid levels, the liver reacted actively by upregulated lipid transportation (fabp3), de novo synthesis (fas), and VLDL assembly (apoB100), which was in accordance with the trend of plasma total cholesterol, HDL-C, and LDL-C. These results agree well with the finding in Nile tilapia (Oreochromis niloticus) [] and Turbot (Scophthalmus maximus L.) []. According to earlier research, plasma apolipoproteins influence the transport and redistribution of lipids among tissues and cells as well as lipoprotein metabolism []. The high expression of hepatic lipoprotein in the L25 group suggested that freshly produced TG may also be delivered efficiently to peripheral tissues for further utilization. The previous study showed that pparγ slows down the rate of lipolysis, principally in adipose tissue [,], and pparβ is found at high levels in many tissues and increases the oxidation of fatty acids in skeletal muscle and adipose tissue [,]. The present results also found that adipose tissue in the L25 group upregulated the expression of pparβ and pparγ, therefore, stimulating lipid uptake (lpl and fatp1), fatty acid β-oxidation (cpt1), and lipid droplet (plin1 and plin3), indicating that adipose tissue reacted actively when fish were fed diets with moderate dietary lipid levels. It was interesting that autophagy (atg7 and atg12) was also stimulated in the L25 group. By searching the literature, a previous transcriptomic analysis reported that rainbow trout preadipocytes upregulated autophagy-related genes expression during the adipogenic process in vitro (proliferation and differentiation phases) [], suggesting a possible role of autophagy mediators in fish adipogenesis. Moreover, the higher mRNA expression of lipid uptake (cd36, fatp1, and fatp5), fatty acids transport (fabp3 and fabp4), and fatty acids β-oxidation (cpt1 and aco) of muscle tissue in the L25 group indicated that the muscle of triploid rainbow trout fed with the moderate dietary lipid level diet was highly probable to be stimulated. Srebp1 plays important role in lipogenesis []. The significantly highest gene expression of srebp1 was found in the L25 group and promised that the FA would be efficiently synthesized and esterified to form TG in muscle. Fish fed an L25 diet could increase lipid uptake and promote lipogenesis in the muscle which is in line with the increased lipid content in the muscle of the fish.
When fish were fed with a high lipid diet, significantly lower lipid uptake (fatp1, fatp5, and fabp3) and higher fatty acids oxidation gene (cpt1 and aco) expression in the liver were observed in the L30 group, which suggested that rainbow trout decreased lipid uptake and increased fatty acids oxidation to adapt excess exogenous lipid intake. The results of the study also found that the mRNA expressions of plin3, atg12, gk, pk, and apoB100 were downregulated. The possible reason was that the liver regulated the source of energy supply, reduced lipoprotein secretion, and lipid deposition to maintain lipid homeostasis when fish were fed a diet with high dietary lipid levels. Additionally, the higher mRNA expression of the genes related to exogenous FA uptake (cd36, lpl), FA transport (fabp4), and FA synthesis de novo (accα and fas) in the L30 groups indicated that abdominal adipose tissue could efficiently uptake excess exogenous FFA and store it in the form of TG. In a previous study on Nile tilapia (Oreochromis niloticus), it was determined that diet-derived FFAs are mostly absorbed by adipocytes, and that in the presence of a high lipid intake, the FA synthesis de novo also increases []. FA oxidation-related genes, such as cpt1 and aco, were also expressed higher in the L30 group, suggesting that excess TG in abdominal adipose tissue would be lipolyzed to limit the capacity for lipid accumulation. According to our findings, the principal sites for lipid deposition in adult triploid rainbow trout are abdominal adipose tissue and muscle. Both of these tissues’ lipid contents showed an upward trend with increasing dietary lipid levels. However, it was noticed that the muscle lpl mRNA expression was down-regulated with increasing dietary lipid levels in the present study. A different result was reported by Dong et al. [], who observed the mRNA expression lpl gene was up-regulated of grass carp (Ctenopharyngodon idella) of increasing conjugated linoleic acid diet intake. The differences in these results may arise from the discrepancy in lipid tolerance in different fish species. Additionally, a significantly lower expression level of the fas gene was observed in the L30 group. This may be related to the high content of fish oil which is rich in n-3 long-chain polyunsaturated fatty acid (n-3LC PUFA), especially EPA (20: 5n-3) and DHA (22: 6n-3) in high lipid diet []. Through broad modulation of lipid metabolism by blocking lipogenesis, the n-3 PUFA primarily exerts its fat-reducing impact []. PPARα, which is a subtype of the PPAR subfamily, is a key regulator of peroxisomal and mitochondrial β-oxidation of fatty acids, ketone body synthesis, and systemic lipid metabolism that can regulate lipolysis [,]. The mRNA expression of the PPARα gene was up-regulated when the dietary lipid level increased. However, the mRNA levels of some pparα-targeted genes in FA β-oxidation, such as cpt1 and aco, had no significant difference compared to the L20 group. The potential cause was the discrepancy between mRNA levels, protein levels/activities, and metabolic flux. These results suggested that the abdominal adipose tissue of triploid rainbow trout is more likely to be the primary organ that responds to a high lipid intake than the muscle.
In conclusion, when lipid intake is limited, the liver counters the negative effects by increasing lipid uptake and switching the energy supply between glycolysis and fatty acid oxidation. In contrast, excess lipid uptake is preferentially stored in abdominal adipose tissue through coordinated FA uptake and FA synthesis de novo as dietary lipid levels increased. Triploid rainbow trout can adapt to various lipid levels by coordinating metabolism in different tissues.
Author Contributions
G.L.: Investigation, Data curation, Formal analysis, Writing—original draft. L.C.: Gene expression analysis. H.T.: Project administration. G.S. and F.W.: Methodology. Y.M.: Review and Editing, Funding acquisition, Validation. R.M.: Conceptualization, Project administration, Funding acquisition. All authors critically reviewed the manuscript for intellectual content and gave final approval for the version to be published. All authors have read and agreed to the published version of the manuscript.
Funding
This research was funded by the National Natural Science Foundation of China (No. 31860731) and the Provincial Natural Science Foundation of Qinghai, China, (2023-ZJ-912M).
Institutional Review Board Statement
Adult triploid rainbow trout from the same population were obtained from Qinghai Minze Longyangxia Ecological Aquaculture Co., Ltd., China with the approval of the Regulations for the Administration of Affairs Concerning Experimental Animals (China) (approval ID: GDOU-IACUC-2021-A0189; approval date: 5 March 2021).
Informed Consent Statement
Not applicable.
Data Availability Statement
The raw data supporting the conclusions of this article will be made available by the authors, without undue reservation. Data available on request due to restrictions eg privacy or ethical.
Acknowledgments
The authors wish to acknowledge the financial support received from the National Natural Science Foundation of China (No. 31860731) and the Provincial Natural Science Foundation of Qinghai, China, (2023-ZJ-912M). We would like to thank Jiao Li, Lingling Guan, Songjing Cao, and Yang Liu for their support and help during this study.
Conflicts of Interest
The authors declare that the research was conducted in the absence of any commercial or financial relationships that could be construed as a potential conflict of interest.
References
- Ojolick, E.; Cusack, R.; Benfey, T.; Kerr, S. Survival and growth of all-female diploid and triploid rainbow trout (Oncorhynchus mykiss) reared at chronic high temperature. Aquaculture 1995, 131, 177–187. [Google Scholar] [CrossRef]
- Meng, Y.; Qian, K.; Ma, R.; Liu, X.; Han, B.; Wu, J.; Zhang, L.; Zhan, T.; Hu, X.; Tian, H.; et al. Effects of dietary lipid levels on sub-adult triploid rainbow trout (Oncorhynchus mykiss): 1. Growth performance, digestive ability, health status and expression of growth-related genes. Aquaculture 2019, 513, 734394. [Google Scholar] [CrossRef]
- Meng, Y.; Tian, H.; Hu, X.; Han, B.; Li, X.; Cangzhong, L.; Ma, R.; Kubilay, A. Effects of Dietary Lipid Levels on the Lipid Deposition and Metabolism of Subadult Triploid Rainbow Trout (Oncorhynchus mykiss). Aquacult. Nutr. 2022, 2022, 6924835. [Google Scholar] [CrossRef]
- He, A.Y.; Ning, L.J.; Chen, L.Q.; Chen, Y.L.; Xing, Q.; Li, J.M.; Qiao, F.; Li, D.L.; Zhang, M.L.; Du, Z.Y. Systemic adaptation of lipid metabolism in response to low-and high-fat diet in Nile tilapia (Oreochromis niloticus). Physiol. Rep. 2015, 3, e12485. [Google Scholar] [CrossRef] [PubMed]
- Gélineau, A.; Corraze, G.; Boujard, T.; Larroquet, L.; Kaushik, S. Relation between dietary lipid level and voluntary feed intake, growth, nutrient gain, lipid deposition and hepatic lipogenesis in rainbow trout. Reprod. Nutr. Dev. 2001, 41, 487–503. [Google Scholar] [CrossRef]
- Johnsen, M.H.F. High-energy/low-protein diets for Atlantic salmon: Effects on growth, nutrient retention and slaughter quality. Aquaculture 1994, 124, 109–116. [Google Scholar] [CrossRef]
- Phan, L.T.T.; Kals, J.; Masagounder, K.; Mas-Munoz, J.; La, N.T.H.; Schrama, J.W. Effect of dietary carbohydrate and fat supplementation on the yield and chemical composition of fillet and the location of fat deposition in striped catfish (Pangasius hypophthalmus), African catfish (Clarias gariepinus) and snakehead (Channa striata). Aquac. Rep. 2021, 21, 100806. [Google Scholar] [CrossRef]
- Grahn, T.H.; Zhang, Y.; Lee, M.J.; Sommer, A.G.; Mostoslavsky, G.; Fried, S.K.; Greenberg, A.S.; Puri, V. FSP27 and PLIN1 interaction promotes the formation of large lipid droplets in human adipocytes. Biochem. Biophys. Res. Commun. 2013, 432, 296–301. [Google Scholar] [CrossRef]
- Chen, Q.L.; Gong, Y.; Luo, Z.; Zheng, J.L.; Zhu, Q.L. Differential effect of waterborne cadmium exposure on lipid metabolism in liver and muscle of yellow catfish Pelteobagrus fulvidraco. Aquat. Toxicol. 2013, 142–143, 380–386. [Google Scholar] [CrossRef]
- Albalat, A.; Saera-Vila, A.; Capilla, E.; Gutierrez, J.; Perez-Sanchez, J.; Navarro, I. Insulin regulation of lipoprotein lipase (LPL) activity and expression in gilthead sea bream (Sparus aurata). Comp. Biochem. Physiol. B Biochem. Mol. Biol. 2007, 148, 151–159. [Google Scholar] [CrossRef]
- Zhao, M.; Shen, X.; Li, X.; Chen, B.; Fan, L.; Xia, Q.; Zhao, L. Chitooligosaccharide supplementation prevents the development of high fat diet-induced non-alcoholic fatty liver disease (NAFLD) in mice via the inhibition of cluster of differentiation 36 (CD36). J. Funct. Foods 2019, 57, 7–18. [Google Scholar] [CrossRef]
- Islam, A.; Kagawa, Y.; Sharifi, K.; Ebrahimi, M.; Miyazaki, H.; Yasumoto, Y.; Kawamura, S.; Yamamoto, Y.; Sakaguti, S.; Sawada, T.; et al. Fatty Acid Binding Protein 3 Is Involved in n-3 and n-6 PUFA transport in mouse trophoblasts. J. Nutr. 2014, 144, 1509–1516. [Google Scholar] [CrossRef] [PubMed]
- Kerner, J.; Hoppel, C. Fatty acid import into mitochondria. Biochim. Biophys. Acta Mol. Cell Biol. Lipids 2000, 1486, 1–17. [Google Scholar] [CrossRef] [PubMed]
- Wahli, W.; Michalik, L. PPARs at the crossroads of lipid signaling and inflammation. Trends Endocrinol. Metab. 2012, 23, 351–363. [Google Scholar] [CrossRef]
- Meyers, A.; Weiskittel, T.M.; Dalhaimer, P. Lipid droplets: Formation to breakdown. Lipids 2017, 52, 465–475. [Google Scholar] [CrossRef]
- Thiam, A.R.; Beller, M. The why, when and how of lipid droplet diversity. J. Cell Sci. 2017, 130, 315–324. [Google Scholar] [CrossRef] [PubMed]
- Huang, X.; Sun, J.; Bian, C.; Ji, S.; Ji, H. Perilipin 1-3 in grass carp Ctenopharyngodon idella: Molecular characterization, gene structure, tissue distribution, and mRNA expression in DHA-induced lipid droplet formation in adipocytes. Fish Physiol. Biochem. 2020, 46, 2311–2322. [Google Scholar] [CrossRef]
- Sztalryd, C.; Brasaemle, D.L. The perilipin family of lipid droplet proteins: Gatekeepers of intracellular lipolysis. Biochim. Biophys. Acta Mol. Cell Biol. Lipids 2017, 1862, 1221–1232. [Google Scholar] [CrossRef]
- Hu, Z.; Zhang, J.; Zhang, Q. Expression pattern and functions of autophagy-related gene atg5 in zebrafish organogenesis. Autophagy 2011, 7, 1514–1527. [Google Scholar] [CrossRef]
- Scorletti, E.; Carr, R.M. A new perspective on NAFLD: Focusing on lipid droplets. J. Hepatol. 2022, 76, 934–945. [Google Scholar] [CrossRef]
- Meng, Y.; Han, B.; Li, C.; Qian, K.; Liu, X.; Hu, X.; Yang, X.; Tian, H.; Ma, R. Digestive characteristics and blood chemistry profile of triploid rainbow trout Oncorhynchus mykiss: Influence of body size and seasonal variation. Fish. Sci. 2019, 85, 1001–1010. [Google Scholar] [CrossRef]
- Ma, R.; Liu, X.; Meng, Y.; Wu, J.; Zhang, L.; Han, B.; Qian, K.; Luo, Z.; Wei, Y.; Li, C. Protein nutrition on sub-adult triploid rainbow trout (1): Dietary requirement and effect on anti-oxidative capacity, protein digestion and absorption. Aquaculture 2019, 507, 428–434. [Google Scholar] [CrossRef]
- Chen, Q.-L.; Luo, Z.; Pan, Y.-X.; Zheng, J.-L.; Zhu, Q.-L.; Sun, L.-D.; Zhuo, M.-Q.; Hu, W. Differential induction of enzymes and genes involved in lipid metabolism in liver and visceral adipose tissue of juvenile yellow catfish Pelteobagrus fulvidraco exposed to copper. Aquat. Toxicol. 2013, 136, 72–78. [Google Scholar] [CrossRef] [PubMed]
- Nanton, D.A.; Vegusdal, A.; Rørå, A.M.B.; Ruyter, B.; Baeverfjord, G.; Torstensen, B.E. Muscle lipid storage pattern, composition, and adipocyte distribution in different parts of Atlantic salmon (Salmo salar) fed fish oil and vegetable oil. Aquaculture 2007, 265, 230–243. [Google Scholar] [CrossRef]
- Sheridan, M.A.; Kao, Y.-H. Regulation of metamorphosis-associated changes in the lipid metabolism of selected vertebrates. Am. Zool. 1998, 38, 350–368. [Google Scholar] [CrossRef]
- Bjerkeng, B.; Refstie, S.; Fjalestad, K.; Storebakken, T.; Rødbotten, M.; Roem, A. Quality parameters of the flesh of Atlantic salmon (Salmo salar) as affected by dietary fat content and full-fat soybean meal as a partial substitute for fish meal in the diet. Aquaculture 1997, 157, 297–309. [Google Scholar] [CrossRef]
- Mattijssen, F.; Georgiadi, A.; Andasarie, T.; Szalowska, E.; Zota, A.; Krones-Herzig, A.; Heier, C.; Ratman, D.; De Bosscher, K.; Qi, L. Hypoxia-inducible lipid droplet-associated (HILPDA) is a novel peroxisome proliferator-activated receptor (PPAR) target involved in hepatic triglyceride secretion. J. Biol. Chem. 2014, 289, 19279–19293. [Google Scholar] [CrossRef]
- McPherson, P.A.C.; McEneny, J. The biochemistry of ketogenesis and its role in weight management, neurological disease and oxidative stress. J. Physiol. Biochem. 2012, 68, 141–151. [Google Scholar] [CrossRef]
- Sun, Z.; Lazar, M.A. Dissociating fatty liver and diabetes. Trends Endocrinol. Metab. 2013, 24, 4–12. [Google Scholar] [CrossRef]
- Berger, J.; Moller, D.E. The mechanisms of action of PPARs. Annu. Rev. Med. 2002, 53, 409–435. [Google Scholar] [CrossRef]
- Espinosa, A.; Ross, A.; Dovale-Rosabal, G.; Pino-de la Fuente, F.; Uribe-Oporto, E.; Sacristán, C.; Ruiz, P.; Valenzuela, R.; Romero, N.; Aubourg, S.P. EPA/DHA concentrate by urea complexation decreases hyperinsulinemia and increases Plin5 in the liver of mice fed a high-fat diet. Molecules 2020, 25, 3289. [Google Scholar] [CrossRef] [PubMed]
- Skinner, J.R.; Shew, T.M.; Schwartz, D.M.; Tzekov, A.; Lepus, C.M.; Abumrad, N.A.; Wolins, N.E. Diacylglycerol enrichment of endoplasmic reticulum or lipid droplets recruits perilipin 3/TIP47 during lipid storage and mobilization. J. Biol. Chem. 2009, 284, 30941–30948. [Google Scholar] [CrossRef] [PubMed]
- Wolins, N.E.; Quaynor, B.K.; Skinner, J.R.; Schoenfish, M.J.; Tzekov, A.; Bickel, P.E. S3-12, Adipophilin, and TIP47 package lipid in adipocytes. J. Biol. Chem. 2005, 280, 19146–19155. [Google Scholar] [CrossRef] [PubMed]
- Singh, R.; Cuervo, A.M. Autophagy in the cellular energetic balance. Cell Metab. 2011, 13, 495–504. [Google Scholar] [CrossRef]
- Klionsky, D.J.; Emr, S.D. Autophagy as a regulated pathway of cellular degradation. Science 2000, 290, 1717–1721. [Google Scholar] [CrossRef]
- Tian, J.; Wu, F.; Yang, C.-G.; Jiang, M.; Liu, W.; Wen, H. Dietary lipid levels impact lipoprotein lipase, hormone-sensitive lipase, and fatty acid synthetase gene expression in three tissues of adult GIFT strain of Nile tilapia, Oreochromis niloticus. Fish Physiol. Biochem. 2015, 41, 1–18. [Google Scholar] [CrossRef]
- Zhang, W.; Dan, Z.; Zhuang, Y.; Zheng, J.; Gong, Y.; Liu, Y.; Mai, K.; Ai, Q.; Leng, X. Effects of Dietary Lipid Levels on Growth, Digestive Enzyme Activities, Antioxidant Capacity, and Lipid Metabolism in Turbot (Scophthalmus maximus L.) at Three Different Stages. Aquacult. Nutr. 2022, 2022, 1042263. [Google Scholar] [CrossRef]
- Weisgraber, K.H. Apolipoprotein E: Structure-function relationships. Adv. Protein Chem. 1994, 45, 249–302. [Google Scholar] [CrossRef]
- Rosen, E.D.; Sarraf, P.; Troy, A.E.; Bradwin, G.; Moore, K.; Milstone, D.S.; Spiegelman, B.M.; Mortensen, R.M. PPARγ is required for the differentiation of adipose tissue in vivo and in vitro. Mol. Cell 1999, 4, 611–617. [Google Scholar] [CrossRef]
- Tontonoz, P.; Spiegelman, B.M. Fat and beyond: The diverse biology of PPARγ. Annu. Rev. Biochem. 2008, 77, 289–312. [Google Scholar] [CrossRef]
- Kleiner, S.; Nguyen-Tran, V.; Baré, O.; Huang, X.; Spiegelman, B.; Wu, Z. PPARδ agonism activates fatty acid oxidation via PGC-1α but does not increase mitochondrial gene expression and function. J. Biol. Chem. 2009, 284, 18624–18633. [Google Scholar] [CrossRef] [PubMed]
- Roberts, L.D.; Murray, A.J.; Menassa, D.; Ashmore, T.; Nicholls, A.W.; Griffin, J.L. The contrasting roles of PPARδ and PPARγ in regulating the metabolic switch between oxidation and storage of fats in white adipose tissue. Genome Biol. 2011, 12, R75. [Google Scholar] [CrossRef] [PubMed]
- Bou, M.; Montfort, J.; Le Cam, A.; Rallière, C.; Lebret, V.; Gabillard, J.-C.; Weil, C.; Gutiérrez, J.; Rescan, P.-Y.; Capilla, E. Gene expression profile during proliferation and differentiation of rainbow trout adipocyte precursor cells. BMC Genom. 2017, 18, 347. [Google Scholar] [CrossRef] [PubMed]
- Eberlé, D.; Hegarty, B.; Bossard, P.; Ferré, P.; Foufelle, F. SREBP transcription factors: Master regulators of lipid homeostasis. Biochimie 2004, 86, 839–848. [Google Scholar] [CrossRef]
- Dong, G.-F.; Zou, Q.; Wang, H.; Huang, F.; Liu, X.-C.; Chen, L.; Yang, C.-Y.; Yang, Y.-O. Conjugated linoleic acid differentially modulates growth, tissue lipid deposition, and gene expression involved in the lipid metabolism of grass carp. Aquaculture 2014, 432, 181–191. [Google Scholar] [CrossRef]
- Turchini, G.M.; Ng, W.-K.; Tocher, D.R. Fish Oil Replacement and Alternative Lipid Sources in Aquaculture Feeds; CRC Press: Boca Raton, FL, USA, 2010. [Google Scholar]
- Tai, C.C.; Ding, S.T. N-3 polyunsaturated fatty acids regulate lipid metabolism through several inflammation mediators: Mechanisms and implications for obesity prevention. J. Nutr. Biochem. 2010, 21, 357–363. [Google Scholar] [CrossRef]
- Huang, D.; Liang, H.; Ren, M.; Ge, X.; Ji, K.; Yu, H.; Maulu, S. Effects of dietary lysine levels on growth performance, whole body composition and gene expression related to glycometabolism and lipid metabolism in grass carp, Ctenopharyngodon idellus fry. Aquaculture 2021, 530, 735806. [Google Scholar] [CrossRef]
- Varga, T.; Czimmerer, Z.; Nagy, L. PPARs are a unique set of fatty acid regulated transcription factors controlling both lipid metabolism and inflammation. Biochim. Biophys. Acta Mol. Basis Dis. 2011, 1812, 1007–1022. [Google Scholar] [CrossRef]
Disclaimer/Publisher’s Note: The statements, opinions and data contained in all publications are solely those of the individual author(s) and contributor(s) and not of MDPI and/or the editor(s). MDPI and/or the editor(s) disclaim responsibility for any injury to people or property resulting from any ideas, methods, instructions or products referred to in the content. |
© 2023 by the authors. Licensee MDPI, Basel, Switzerland. This article is an open access article distributed under the terms and conditions of the Creative Commons Attribution (CC BY) license (https://creativecommons.org/licenses/by/4.0/).