Article

Multi-Omics Analysis of Lung Tissue Demonstrates Changes to Lipid Metabolism during Allergic Sensitization in Mice

1
Department of Medicine, Vanderbilt University, Nashville, TN 37203, USA
2
Department of Pharmaceutical Sciences, University of Colorado, Aurora, CO 80045, USA
3
Department of Environmental and Occupational Health, University of Colorado, Aurora, CO 80045, USA
*
Author to whom correspondence should be addressed.
These authors contributed equally to this work.
Metabolites 2023, 13(3), 406; https://doi.org/10.3390/metabo13030406
Submission received: 1 February 2023 / Revised: 24 February 2023 / Accepted: 2 March 2023 / Published: 9 March 2023
(This article belongs to the Section Advances in Metabolomics)

Abstract

:
Allergy and asthma pathogenesis are associated with the dysregulation of metabolic pathways. To understand the effects of allergen sensitization on metabolic pathways, we conducted a multi-omics study using BALB/cJ mice sensitized to house dust mite (HDM) extract or saline. Lung tissue was used to perform untargeted metabolomics and transcriptomics while both lung tissue and plasma were used for targeted lipidomics. Following statistical comparisons, an integrated pathway analysis was conducted. Histopathological changes demonstrated an allergic response in HDM-sensitized mice. Untargeted metabolomics showed 391 lung tissue compounds were significantly different between HDM and control mice (adjusted p < 0.05); with most compounds mapping to glycerophospholipid and sphingolipid pathways. Several lung oxylipins, including 14-HDHA, 8-HETE, 15-HETE, 6-keto-PGF1α, and PGE2 were significantly elevated in HDM-sensitized mice (p < 0.05). Global gene expression analysis showed upregulated calcium channel, G protein–signaling, and mTORC1 signaling pathways. Genes related to oxylipin metabolism such as Cox, Cyp450s, and cPla2 trended upwards. Joint analysis of metabolomics and transcriptomics supported a role for glycerophospholipid and sphingolipid metabolism following HDM sensitization. Collectively, our multi-omics results linked decreased glycerophospholipid and sphingolipid compounds and increased oxylipins with allergic sensitization; concurrent upregulation of associated gene pathways supports a role for bioactive lipids in the pathogenesis of allergy and asthma.

1. Introduction

Asthma is characterized by airway hyper-responsiveness, mucus hypersecretion, infiltration of the airway by eosinophils and type 2 (T2) immune response, and airway remodeling [1,2]. Evidence suggests that cytokine imbalance and metabolic perturbance are responsible for the inflammation and tissue damage resulting from asthma [3]. In addition to increased inflammation, both systemically and locally in the lung, this perturbance results in increased oxidative stress, decreased antioxidants, and increased inflammatory cytokine markers [4,5,6]. However, our understanding of allergic asthma etiology and biological mechanisms is incomplete. This is partly due to the invasive nature of lung sampling techniques, which is a major impediment in developing prophylaxis and treatment for asthma.
Experimental animal models were developed to mimic the clinical symptoms and pathological sequalae of asthma to overcome the challenges with studying relevant human tissue. The mouse model of house dust mite (HDM)-induced allergic airways disease mimics many of the features of human asthma symptoms, including airway hyperreactivity and airway inflammation, and is increasingly used to elucidate asthma/allergic airways pathology and to evaluate new therapeutic agents [7]. However, allergic airways/asthma etiology and biological mechanisms in this experimental model were not well characterized.
The application of high throughput ‘omics’ approaches to both human studies and animal models has shown great potential in identifying pathological mechanisms and biomarkers of asthma. For example, metabolomics measures a variety of small molecules that are part of a biological system and have potential to capture the cellular response to past and present exposures relevant to asthma etiology [8,9,10]. Since lung tissue provides an integrated, multi-cellular platform, a metabolomic investigation utilizing lung tissues may better illustrate the etiology of allergic airways/asthma and will have a significant translational value compared to those performed in isolated cells or in vitro systems [11]. Metabolomic analysis of bronchoalveolar lavage fluid (BALF) [12,13] and lung tissue [14] in sensitized mice and BALF and sputum of patients with allergic asthma [15,16] have uncovered a panel of potential allergic airway-related metabolic biomarkers and pathways. However, most of these studies did not take a multiplatform and systems approach and, hence, may have missed important relationships.
To date, various ‘omics’ approaches increasingly implicated lipids as biomarkers for the pathogenesis and severity of asthma symptoms [17,18,19,20]. Specifically, excessive oxidative stress and its endogenous and exogenous reactive oxygen and nitrogen species, decreased activities of antioxidants, and increased production of bioactive lipids that are synthesized from arachidonic acid (AA) are all associated with airway inflammation and, consequently, with allergic asthma and its severity [21,22,23,24]. Conversely, the roles of endogenous bioactive oxylipins derived from eicosapentaenoic acid (EPA) and docosahexaenoic acid (DHA) as counter-regulators of inflammation and activators of resolution is still being established [25,26,27]. These bioactive lipids, termed oxylipins, are rapidly metabolized and are challenging to detect through untargeted metabolomics analysis. However, targeted analysis of these molecules using tandem liquid chromatography mass spectrometry (LC/MS/MS) was used extensively in the analysis of these important lipid molecules [17,28,29].
Furthermore, since genetics plays a major role in regulation of the metabolome [30] and asthma etiology, integrating metabolomics with gene expression data enhances the potential to unravel relevant pathways in diseases with gene-X-environmental etiological components such as asthma and allergic airways [31,32]. Overlaying molecular pathways based on metabolomics and gene expression data help to extract more insightful and comprehensive snapshots of biological systems and molecular processes in the etiology of asthma. Therefore, the aim of this study is to understand the upstream molecular processes underlying allergic asthma etiology in HDM-induced allergic mice using a multi-omics approach that comprises untargeted metabolomics, targeted analysis of oxylipins, and transcriptomics of lung tissue. This integrated analysis of metabolomics, lipidomics, and gene expression data provides additional insight into novel links between metabolic, immune, and neuronal signaling pathways triggered by HDM sensitization which can be investigated for possible intervention targets in future studies.

2. Materials and Methods

2.1. Animals

Six-week-old male BALB/cJ (BALB) mice were obtained from Jackson Laboratories (Bar Harbor, ME). This strain was chosen because it is Th2-dominant and commonly used in lung allergic airway models due to their classic allergic responses, including increased Th2-immune responses, eosinophilia, and airway hyperresponsiveness [33,34]. The mouse numbers used for each endpoint were based on animal requirements for significance in previous studies [35,36] as well as a power analysis. All mice were maintained on an ovalbumin (OVA)-free Teklad diet (Envigo). Mice were acclimated for one week prior to sensitization. Studies were conducted under a protocol (#01031) approved by the Institutional Animal Care and Use Committee at University of Colorado Anschutz Medical Campus (Aurora, CO).

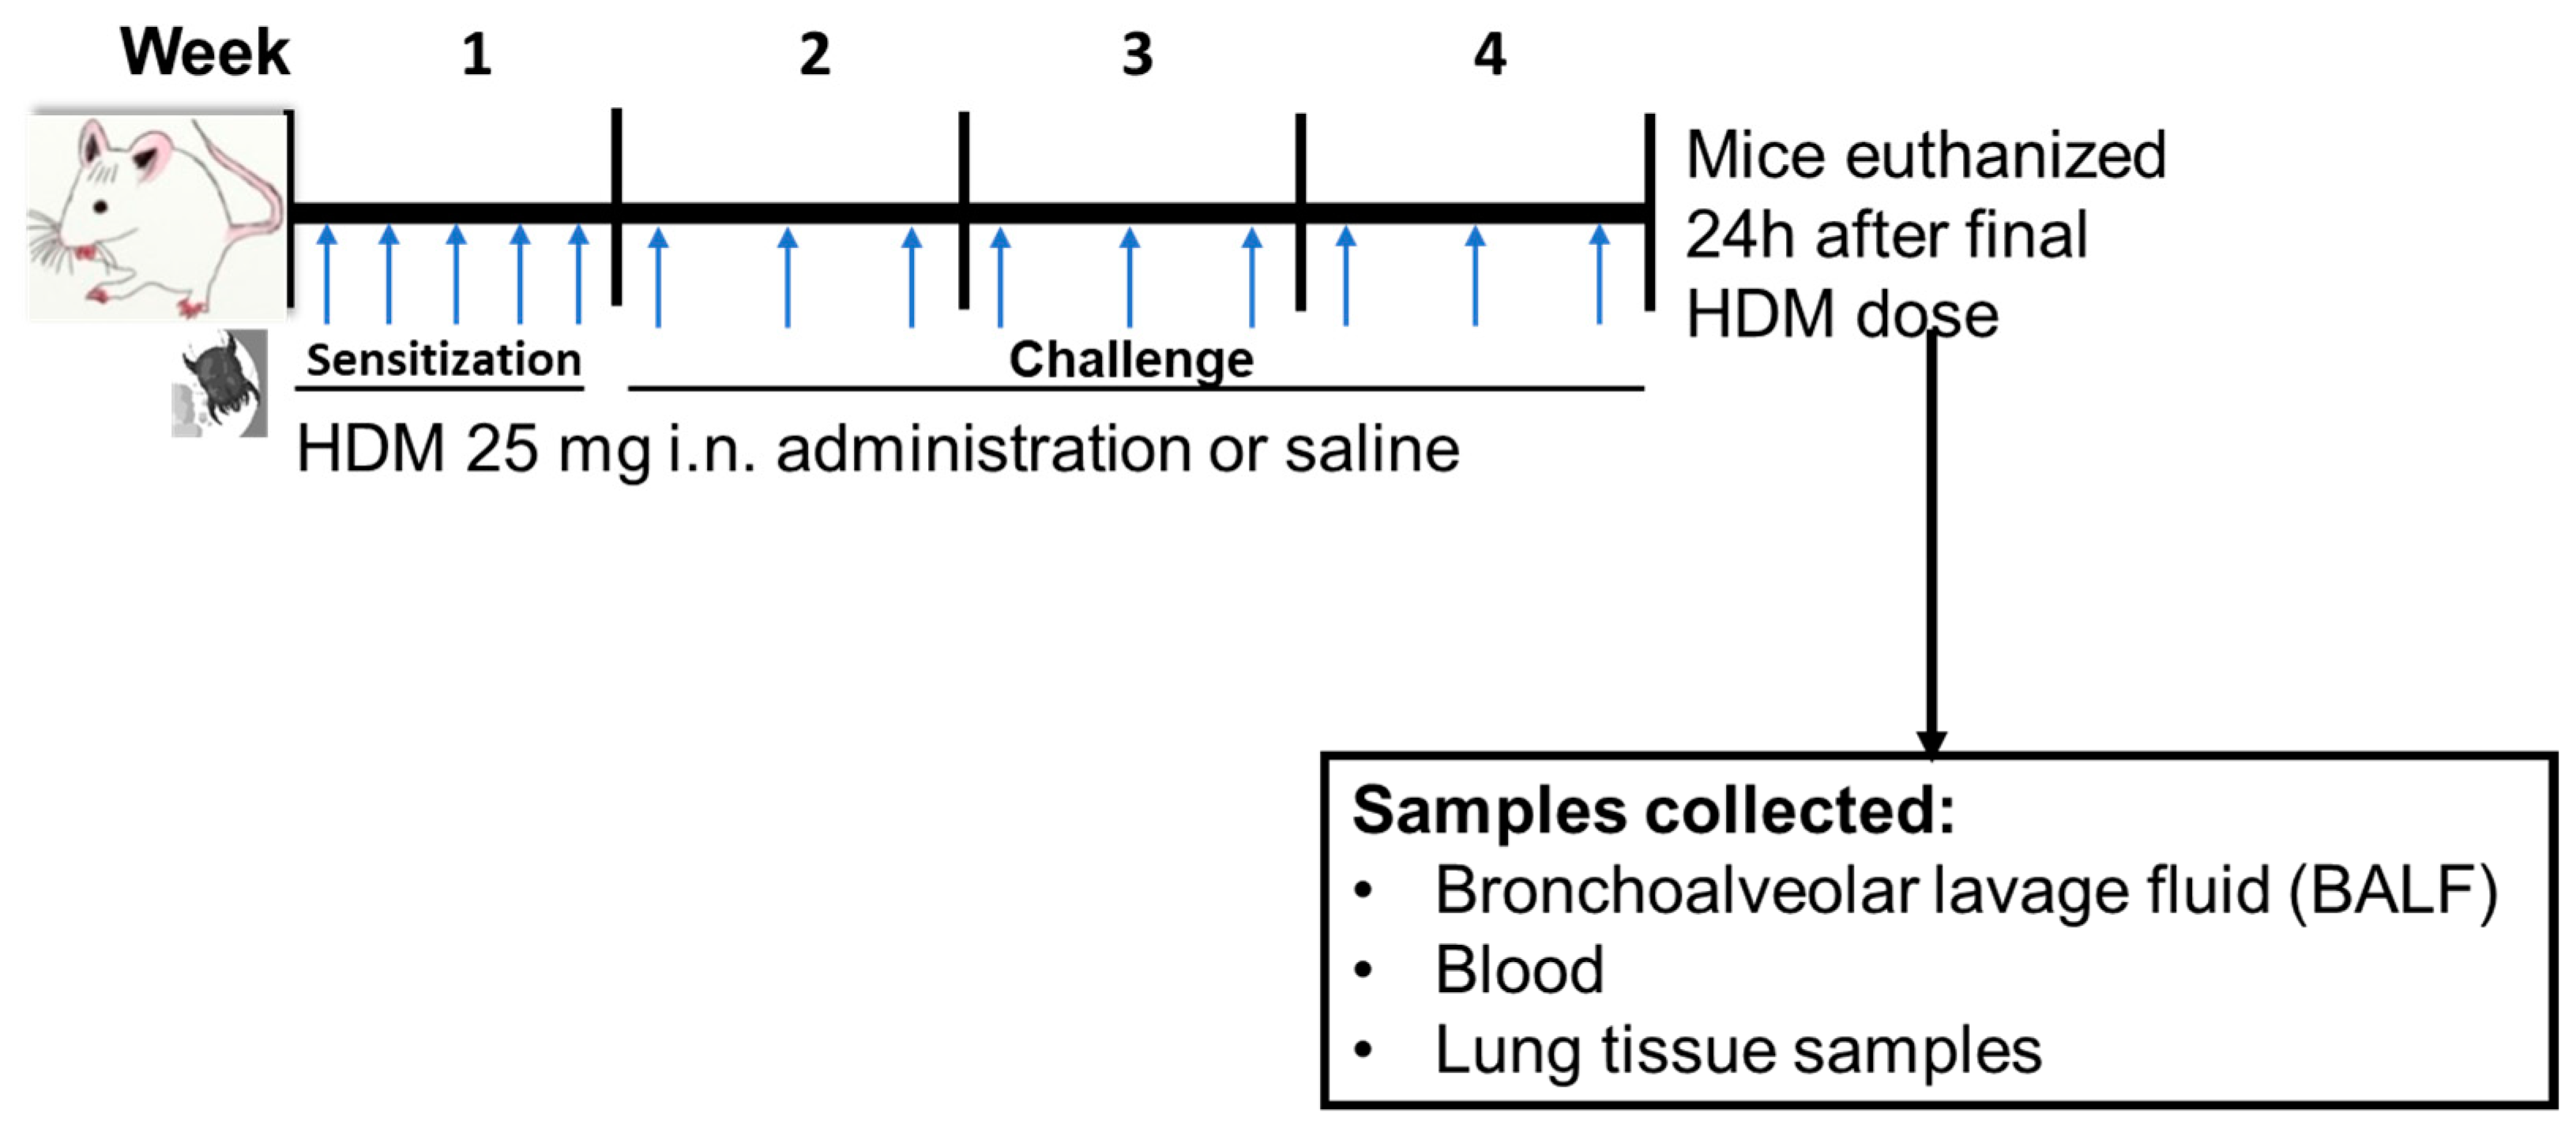
2.2. HDM Sensitization

Mice were sensitized to sterile filtered 25 µg HDM extract (HDM, GREER Labs; in 35 µL saline) or saline through internasal (i.n.) administration for 5 days/week for week 1 and then challenged with 25 µg HDM (35 µL saline) or 35 µL saline for 3 days/week for weeks 2–4 of the experiment (Figure 1). All mice used in this study were treated at the same time and were euthanized 24 h following the final dose of HDM in week 4. The HDM sensitization dose, frequency, and duration was based on a recently published 4-week HDM-induced allergic airways inflammation mouse model [37].

2.3. Differential Cells Counts and Histology

Blood was collected via cardiac puncture and, following processing using EDTA tubes (Thermo Fisher Scientific, Waltham, MA 02451, USA), plasma was snap frozen. Bronchoalveolar lavage fluid (BALF) was collected with Hanks balanced salt solution (HBSS), described previously [38,39], using n = 5 mice per group. Cell differentials and total protein (reflective of lung hyperpermeability) was performed on BALF, as performed in Cho [39] and Bauer [36]. Following lung perfusion with sterile saline, these lungs were also inflation fixed (n = 5) with 10% neutral buffered formalin for 24 h, followed by processing by the University of Colorado Cancer Center (UCCC) Pathology Shared Resource. Hematoxylin and eosin (H&E), periodic acid–Schiff (PAS), and trichrome stained slides were performed for each of these mouse lungs (n = 5). In another group of mice (n = 4), non-lavaged and non-perfused lung lobes (with no lymph nodes) were divided for untargeted metabolomics, targeted lipidomics, and RNA transcriptomics assays.

2.4. Untargeted Metabolomics:

Lung samples (n = 4 for control and n = 4 for HDM) for untargeted metabolomics analysis were prepared as previously described [40,41,42]. Briefly, lungs were homogenized using a bead homogenizer with methanol and small molecules were extracted from 100 µL lung tissue homogenate using methyl tert-butyl ether (MTBE). Aqueous and lipid fractions were analyzed separately by liquid chromatography mass spectrometry (LC/MS) on a quadrupole time-of-flight (6545 QTOF, Agilent Technologies, Santa Clara, CA 95051, USA) mass spectrometer using published methods [13,43], except that 10 µL of the lipid fraction samples were injected on the instrument. All samples were prepared in a single batch and, therefore, no batch-to-batch quality control (QC) sample was used to control for sample preparation variance. However, all experimental lung samples were spiked with 29 labeled authentic standards and an aliquot of each sample was pooled post sample preparation to make a pooled QC sample to control for LCMS instrument variance [13,43]. Following analysis of QC data to ensure reproducibility (see Text S1 for details on quality control), metabolomics spectral data were extracted and recursively filtered, aligned, and binned using Agilent Profinder ver 10.0 SP1 and Mass Profiler Professional Ver. 15.1 (MPP, Agilent Technologies, Santa Clara, CA 95051, USA) [42]. Compounds found in at least one blank were removed. Remaining compounds were limited to those found in 75% of samples in at least one group (HDM or control). Aqueous samples were additionally limited to compounds eluting before 11.5 min since compounds eluting past this time had poor signal to noise ratios. Normalization was conducted using adjustment to total signal for all compounds not found in blanks.
Compounds were annotated by searching a custom in-house database comprised of data from authentic standards and public databases consisting of compounds from METLIN, Lipid Maps, Kyoto Encyclopedia of Genes and Genomes (KEGG), and Human Metabolome Database (HMDB), using accurate mass and isotope ratios. These compounds were designated Metabolomics Standards Initiative (MSI) level three [13]. Compounds matching in retention time and mass to compounds in the in-house database were designated MSI level one.

2.5. Quantitative Targeted Analysis of Oxylipins (Lipidomics)

Liquid chromatography tandem mass spectrometry (LC/MS/MS) and isotope dilution was used to quantitate 87 pro-inflammatory and pro-resolving lipids and isoprostanes in plasma and lung using a single, validated assay [44,45]. Briefly, samples were extracted with methanol followed by solid phase extraction to enrich for oxylipins. Internal standards, comprised of labeled analogs corresponding to 12 molecules of various lipid subclasses, were added prior to extraction. Samples were analyzed using a triple quadrupole mass spectrometer (QQQ 6490, Agilent Technologies, Santa Clara, CA 95051, USA) as previously described [44,45,46].

2.6. Global Gene Expression

The RNA preparation and sequencing was carried out at the UCCC Genomics Core. mRNA was isolated from mice lung tissue using TRI-Reagent (Sigma-Aldrich, St. Louis, MO 68178, USA) followed by Zymo-Seq Ribo Free Total RNA Library Kit for the library preparation. cRNA (1.5 μg) was used for whole-genome gene expression direct hybridization assay with mouse WG-6 v2.0 Expression Beadchip (Illumina, San Diego, CA 92122, USA), following the manufacturer’s instructions. The average reads/bases quality for all the samples in the lane was at least 88% ≥ Q30. The filtered reads distribution for all the samples in the lane ranged from approximately 11 M to 18 M clusters (22 M to 36 M paired end reads). Sequence data quality was evaluated using fastqcr, an R wrapper for freely available quality control software (FastQC) [47,48]. The software suites of Rsubread [49] and R package were used for mRNA read mapping, with the reference mice genome (GRCm38 primary assembly genome) and the feature counts function to quantify read counts.

2.7. Statistical Analysis

Compounds from untargeted metabolomics were assigned class hierarchy if they had a KEGG compound number provided and were annotated by compound class, subclass 1, subclass 2, subclass 3, and subclass 4; this provided several options to analyze and visualize data [50]. Changes in compounds between HDM and control mice were evaluated by multiple t-testing using a false discovery rate (FDR) of 5% and fold change for compounds were generated [50]. The number of significantly changed compounds between HDM-sensitized and control mice were counted based on the KEGG class annotation and visualized with bar plots. Similarly, compound abundance was aggregated by KEGG subclasses and compared between HDM-sensitized mice and control and visualized with boxplots [50]. Enrichment and pathway analyses were conducted for significantly different compounds. Metabolic reaction pathways were predicted to identify active and suppressed metabolic conversion based on upregulated and downregulated lipid compounds using Lipid Map’s BioPAN online software suite [51]. Metabolic network, network diffusion, and network topology and clustering analysis were conducted using combination of FELLA (R package) [52] and Cytoscape software suite [53]. Changes in oxylipins (from targeted lipidomics analysis) between HDM and control mice were evaluated by multiple t-testing using a false discovery rate (FDR) of 5%. Changes in BALF cells and protein were determined using t-tests (Graphpad Prism 9) on log transformed data, with p < 0.05 considered significant.
Gene expression read count data were converted into log2 counts using the rlog function in DESeq2 and plotted to assess data quality [54]. The read count data was filtered for zero counts before differential expression analysis was conducted. Differential gene expression (log2 fold changes [log2FC]) was conducted using negative binomial generalized linear equation in DESeq2, which accounted for library size and group mean and variance internally [54]. The estimated log2FC were shrunk to aid visualization and ranking of genes and p-valued corrected for inflation and biases using bacon package [55]. Enrichment and pathway analysis were conducted for significantly different genes using BioMart suite retrieving GO and KEGG molecular and functional knowledge databases [56]. Joint metabolomics and gene expression data pathway analysis were conducted using KEGG molecular knowledge databases to understand the potential interactions and involvement between the compounds and genes that were significantly changed between HDM-sensitized and control mice in the biological process and molecular functions. All statistical analyses were performed using R software version 4.1.1 (https://www.r-project.org accessed on 25 August 2021).

3. Results

3.1. Inflammatory Cells and Histopathology Changes in HDM-Sensitized Mice

BALF inflammatory cell analysis demonstrated that significant increases in macrophages, PMNs, and eosinophils (p < 0.05) were observed in HDM-sensitized mice compared to control (Figure 2a). Lymphocytes and epithelial cells appeared to be elevated compared to control, but these increases were not significant, at p < 0.08 and p < 0.1720, respectively. Total protein was also significantly elevated in HDM-sensitized mice compared to control (p < 0.0232) (Figure 2b). These results demonstrate that an inflammatory response to HDM allergic sensitization occurred.
The analysis of histopathological changes in lung by H&E staining showed the typical pathological features of allergic airways and asthma in HDM-sensitized mice compared to control (Figure 2c) including inflammatory cell infiltration, specifically peribronchial inflammation (Figure 2d,e, red arrow, inset). Increased collagen deposition was also observed in the HDM-exposed mice using trichome staining (Figure 2f) and some goblet cell hyperplasia was seen in the HDM-sensitized mice compared to controls (Figure 2g). Collectively, this model had numerous similarities to human asthma and was a valuable model to use for our additional studies below.

3.2. Differentially Regulated Compouds (Untargeted Metabolomics) in HDM-Sensitized Mice

Following untargeted metabolomics analysis of lung tissue, 1316 compounds were determined to be present in at least 75% of sample per group. Of these, 391 compounds were significantly different between the HDM and control mice (adjusted p < 0.05). Most of these compounds were not annotated and, therefore, were not pursued in downstream analysis and interpretations such as pathway enrichment analysis. The five most significantly upregulated compounds included 7-8-dihydro-L-biopterin, palmitoyl ethanolamide, a phosphatidylglycerol (PG [16:0/0:0]), sphinganine, and butyryl-L-carnitine (Table S1). The five most significantly downregulated compounds were Fagaramide, s-(5′-adenosyl)-l-homocysteine, adenine, PC(20:4/18:0), and PC(20:3/16:0) (Table S1). Note that these annotations were MSI level three and were hence considered putative. Changes were visualized using volcano plots for lipids (Figure 3a) and non-lipid compounds (Figure 3b).
Figure 3c shows number of significantly up- and downregulated compounds in each KEGG subclass. Most of the upregulated compounds were in diacyglycerolphosphoserines, fatty acyls (including fatty acyl carnitines and primary amides), and glycerolphosphocholines (monoacylglycerolphosphocholines and diacylglycerolphosphocholines) pathways. Note that the diacylglycerophospholipids are generally referred to as glycerophospholipids while the monoacylated forms are referred to as lyso-glycerophospholipids; however, the KEGG nomenclature was used in the current study to allow for multi-omics analysis. Enrichment analysis demonstrated that the upregulated KEGG pathways were significantly (p-value < 0.05) enriched in glycerophospholipid metabolism, purine metabolism, and one carbon pool by folate pathways before FDR adjustment; however, none were significant after FDR adjustment (see Figure S1 for list of pathways and Figure S2 for list of predicted enzymes). The majority of downregulated compounds were in glycerophospholipid (including diacyglycerolphosphocholines, monocyglycerolphosphocholines, diacylglycerophosphoethanolamines, and 1-Z-alkenyl,2-acyglycerolphosphocholines, as shown in Table S1), and phosphosphingolipids (including ceramide phosphoethanolamines and ceramide phosphocholines [shingomyelins]) (Figure 3c). At least one compound was changed in the following pathways: glycerophosphoinositols, flavonoids, purines, and eicosanoids (only PGD2 was significant) pathways (Figure 3c). Enrichment analysis demonstrated that the upregulated KEGG pathways were significantly (p-value < 0.05) enriched in sphingolipid metabolism, glycerophospholipid metabolism, and taurine and hypotaurine metabolism pathways before FDR adjustment. However, only sphingolipid metabolism pathway was significant after FDR adjustment (see Figure S1 for list of pathways and Figure S2 for list of predicted enzymes). Pathways such as glycerophosphatidylcholines, phosphatidylserines, sphingoid bases, and purines contained a mix of up- and downregulated individual compounds; the results from above were based on the direction of the majority of the compounds.
Moreover, expansion of compounds’ knowledge-based network (network diffusion) by including KEGG metabolic pathways and GO terms indicates that the dysregulated compounds were associated with inflammatory pathways (see Supplemental Text S1 and Figure S3 for detail of results). In addition, since most of the significantly altered compounds were lipids, we conducted an analysis of predicted reaction pathway for differentially abundant lipid compounds to identify most active lipid conversions in our experiment. The reaction prediction was conducted in Lipid Map’s BioPAN [51] software suite. The reaction pathway prediction showed that the most active conversion pathways were from phosphotidylcholines and phosphotidylethanolamines to phosphotidylserines and from sphingomyelins (n-acyl-sphing-4-enine-1-phosphocholine) to ceramides (n-acyl-sphing-4-enine) (Figure S4).

3.3. Differentially Regulated Oxylipins (Targeted Lipidomics) in HDM-Sensitized Mice

A targeted quantitation of 87 oxylipins was conducted in plasma and lung tissue using mass spectrometry. Twenty-one plasma and twenty-eight lung lipid mediators had values above the detection limit for 80% of the samples. In plasma, 12,13-epoxyoctadecenoic acid (12,13-EpOME; p = 0.003) and its downstream metabolites 9,10-dihydroxy-octadecenoic acid (9,10-DiHOME; p = 0.01), 12,13-dihydroxy-octadecenoic acid (12,13-DiHOME; p = 0.02), 9-hydroxy-octadecadienoic acid (9-HODE; p = 0.03), and 13-hydroxy-octadecadienoic acid (13-HODE; p = 0.05) were significantly higher in the HDM group compared to control, but only 12,13-EpOME was significant (adjusted p = 0.07) after adjusting for multiple-testing using FDR at 10%. In addition, analysis of lung tissue oxylipins showed that 11-hydroxydocosahexaenoic acid (11-HDoHE, p = 0.002), 12,13-dihydroxy-octadecenic acid (12,13-DiHOME, p = 0.05), 13-hydroxyoctadecatrienoic acid (13-(S)-HOTrE; p = 0.02), 14-hydroxy-docosahexaenoic Acid (14-HDHA, p = 0.002), 8-hydroxyeicosatetraenoic Acid (8-HETE, p = 0.002), 15-hydroxyeicosatetraenoic Acid (15-HETE, p = 0.02), (19,20-DiHDPA, p = 0.01), 6-keto-prostaglandin F1α (6-keto-PGF1α; p = 0.04), prostaglandin E2 (PGE2; p = 0.004) were significantly elevated in the HDM-sensitized group; but none were significant after adjusting for multiple testing (Figure 4; see Figures S5 and S6 for additional lipids identified in plasma and lung samples, respectively).

3.4. Differentially Expressed Genes (Global Gene Expression) in HDM-Sensitized Mice

The global gene expression analysis of lung tissue showed that several genes (143 genes) were differentially expressed after adjusting for multiple testing at adjusted p-value of 0.05 and fold change cutoff value of 1.5, where the majority (88 genes) of the genes were upregulated (Figure 5 and Table S2). The top five upregulated genes included Col24a, Nlrp4g, Samd4b, Med29, and Ganab. Additional immune response genes that were upregulated in the HDM-sensitized group included Chil4, Chil6, Cxcr6, Macir, and Clec2g, and metabolism related upregulated genes included Atp10d and Ivd. Although not statistically significant, cytochrome c oxidase (Cox)-10, cytochrome P450 (Cyp450)-2E1, Cyp450-2j3, and cytosolic phospholipase A2 (cPla2)-g4, and elongation of very long chain fatty acids protein 4 (Elov4) were among many lipid metabolism regulation genes that were upregulated with log2 foldchange >2. The top five downregulated genes included Ces2a, Sptbn4, Hsd17b1, Nrxn2, and Gpr137c. Additional immune response genes that were downregulated in the HDM-sensitized mice included Btnl4, Lifr, Atm, and Zcchc9, and additional metabolism genes that were downregulated in the HDM-sensitized mice included Mtm1, Ggta, Akt2, Repin1, Rabgap1l, Pask, and Csad. The supportive literature for the functions of these genes are summarized in Table S3.
To summarize the biological and molecular context of significantly expressed genes (multiple testing adjusted p-value < 0.05), we conducted enrichment analyses using the GO knowledge database. The GO biological process enrichment analysis showed that the following were the most enriched biological processes pathways for significantly upregulated genes in the HDM-sensitized mice compared to control: regulation of cardiac muscle (cell contraction) by regulation of the release and transportation of sequestered calcium ion, metal ion transport, collagen fibril organization, and calcium-mediated signaling. Regulation of vesicle fusion, central nervous system neuron axonogenesis, regulation of glycogen biosynthetic process, regulation of torc1 signaling, and regulation of B-cell proliferation were the five most enriched biological processes for downregulated genes in HDM-sensitized mice compared to control (Table 1).
Similarly, the GO molecular function enrichment analysis of significantly expressed genes showed that voltage-gated calcium channel activity involved in muscle cell action potential, benzodiazepine receptor binder, solute and sodium bicarbonate symporter activity, oncostatin M receptor activity, leukemia inhibitory factor receptor activity, and g protein-coupled serotonin receptor binding were the five most enriched pathways for upregulated genes. Testosterone dehydrogenase [nad] activity, phosphatidylinositol-3,5-bisphospate 3-phosphatase activity, neuroligin family protein binding, ccr5 chemokine receptor binding, and annealing activity were the five most downregulated molecular functions in downregulated genes in HDM compared to control mice (Table 2).

3.5. Joint Pathways of Differentially Regulated Metabolic Compounds and Differentially Expressed Genes in HDM-Sensitized Mice

A joint KEGG pathways enrichment analysis was conducted for significantly changed compounds and genes between HDM-sensitized and control mice to understand the comprehensive metabolic pathway dysregulation that we hypothesized as occurring with allergic responses to HDM. Accordingly, glycerophospholipid and sphingolipid metabolism were the most jointly enriched KEGG molecular pathways (Figure S7) affected by HDM sensitization. In addition, joint enrichment of insulin secretion, cholinergic synapse, adrenergic signaling in cardiomyocytes, choline metabolism, calcium signaling, and apelin signaling pathways was seen. However, only glycerophospholipid metabolism and sphingolipid metabolism were significant after FDR adjustment. Genes that were involved in regulation of lipid phosphorylation, including Mtm1, Ggta, and Mtmr4, were downregulated.

4. Discussion

This study aimed to better understand the effects of allergen sensitization on metabolic and immune signaling pathways by comparing small molecule and gene expression differences between HDM-sensitized and control mice using a multi-omics approach. Overall, our findings confirmed previous results by our group [13] and others that demonstrated the dysregulation of purine, glycerophospholipid, and sphingolipid metabolism, as well as the AA and LA oxidation products 9-HODE and 12,13-EpOME (and its downstream metabolites) in allergen-sensitized mice. Furthermore, the current study demonstrated that additional signaling pathways, such as cardiolipin and insulin secretion pathways, were dysregulated in allergen-sensitized mice.
Our results from untargeted metabolomics indicated that the majority of dysregulated compounds were glycerophospholipids, similar to previous reports [12,57]. Compounds within the class of phosphosphingolipids and certain sub-classes of glycerophospholipids, including glycerophosphatidylcholines, glycerophosphatidylethanolamines, and glycerophosphatidylinositols were downregulated, whereas diacyglycerolphosphoserines and glycerophosphate were upregulated. These compounds are all part of the highly interconnected glycerophospholipid pathway, whereby glycerophosphate (1,2-diacyl-sn-glycerol-3-phosphate) acts as a precursor to the glycerophospholipids through the intermediates phosphatidic acid, sn-1,2-diacylglycerol, and/or CDP-diacylglycerol. Similarly, the diacylglycerophospholipids are metabolized to corresponding monoacylated forms and can also be used to generate phosphatidic acid. It is possible that glycerophosphatidylcholines, glycerophosphatidylethanolamines, and glycerophosphatidylinositols were depleted to meet cellular demands during inflammation. For example, the prediction model based on our data shows that, in HDM-sensitized mice, phosphatidylcholines and phosphatidylethanolamines were actively converting to phosphatidylserines, whereas sphingomyelins were actively converting to ceramides. Under normal physiological conditions, significant amounts of phosphatidylserines turn over to form phosphatidylethanolamines [58]; however, the conversion may be reversed in disease-like conditions, such as allergic airways.
The importance of phospholipids in asthma pathogenesis were previously described [59]. For example, phosphatidylcholines were decreased in asthmatic lungs [12,57] and children with risk allelles in the 17q12-21 genetic region have decreased sphingolipid synthesis [60]. This is consistent with our finding that glycerophosphatidylcholine levels were decreased in sensitized mouse lung. Similarly, decreased levels of glycerophosphatidylethanolamines and glycerophosphatidylinositols and increased diacyglycerolphosphoserines in plasma samples among asthmatic patients were previously observed [61]. Although not directly measured in the current study, the observed downregulation of glycerophosphatidylcholines in lung following allergic sensitization may be interpreted to reflect metabolism of EPA or DHA via cPLA2 to more pro-resolving and/or anti-inflammatory oxylipins. In addition, glycerophosphotidylcholines have roles in anti-inflammatory mechanisms including suppression of TNF production in macrophages and interference with pro-inflammatory cytokines secreted by phagocytes [62,63,64]. Finally, the precursor of diacyglycerolphosphoserines, phosphatidylserine, may play an important role in T2 immune response induction and airway hyperreactivity [65]. Thus, by extension, upregulated diacyglycerolphosphoserines in HDM-sensitized mice in our study is consistent with allergic asthma pathogenesis.
As previously mentioned, membrane glycerophospholipids such as glycerophosphoserine contain fatty acids such as AA, LA, EPA, and DHA, which are precursors of bioactive lipid mediators such as oxylipins and endocannabinoids [66,67,68,69]. While the untargeted metabolomics analysis of lung tissue showed that most glycerophospholipids were decreased in HDM-sensitized mice, the targeted analysis of oxylipins in the same tissue led to an increase in these bioactive lipids in HDM-sensitized mice. In addition, we observed upregulated but statistically insignificant genes related to the release and metabolism of membrane fatty acids to bioactive lipids such as Cox, Cyp450s, and cPla2 as well as calcium binding regulator genes. Thus, based on the observed depletion of glycerophospholipids and increased oxylipins, along with the upregulation of related genes, we speculate that allergic sensitization results in a conversion of membrane lipids to oxylipins. In support of this, we observed increases in AA-derived 8-HETE, 15-HETE, PGE2, and 6-keto-α-prostaglandin F (6keto-α-PF), which are known for both pro-inflammatory and anti-inflammatory properties often depending on receptor and tissue type (see Figure 6 for illustration). For example, PGE2 was shown to increase mast cell degranulation and IL-6 production, IL-8-induced neutrophil recruitment, vasodilation, among others [70]. 6-keto-α-prostaglandin F is a less potent and stable derivative of prostacyclin I2 (PGI2) known to serve as antiplatelet aggregation though the upregulation of cAMP activities [71,72] and immune regulators [73].
Increased LA oxidation products such as 9-HODE and 12,13-EpOME (and its downstream metabolites 9,10-DiHOME and 12,13-DiHOME) were also observed in HDM-sensitized mice, which is consistent with their known pro-inflammatory roles. For example, 9-HODE plays a role in inflammation by activating the G protein coupled receptor 132 (G2A), inhibiting the peroxisome proliferator-activated receptor γ (PPARγ), and increasing production of inflammatory cytokines such as IL-6, IL-8, and GM-CSF [74]. Similarly, 12,13-EpOME (and its downstream metabolites) increased inflammation by activating NF-κB and AP-1 transcription factors and inhibiting PPARγ [75,76,77]. Generally, increased LA oxidation products associate with features of severe airway obstruction, lung remodeling, increase in epithelial stress related to pro-inflammatory cytokines and airway neutrophilia in mice [78]. A potential future intervention study could inhibit LA oxidation to determine if the inflammatory response to allergic challenges and symptoms of asthma improve.
Alpha linoleic acid (αLA) and DHA-derived oxylipins known for their pro-resolving characteristics were also increased in sensitized mice. For example, 13-(S)-HOTrE, which is derived from αLA, exhibited anti-inflammation properties through inhibition of NF-κB and NLRP3 and through activation of PPARγ [79,80]. Likewise, DHA-derived 19,20-DiHDPA was shown to modulate leukocyte recruitment and infiltration via reduced ICAM-1 and E-selectin expression in endothelial cells [81,82]. The increase in these oxylipins during HDM sensitization suggests a counterbalance exists between pro-inflammatory and pro-resolving oxylipins.
Moreover, lipids are also known to modulate the activity of voltage-gated ion channels including calcium channel and G protein–signaling mechanisms [83,84]. As previously mentioned, phospholipases such as cPLA2 hydrolyze glycerophospholipids by binding to membrane G-protein-coupled receptors and releasing free fatty acids, such as AA and LA, from the membrane [85,86]. Our pathway analysis of differentially expressed genes confirmed the involvement of ion channels and bioactive lipids signaling pathways during HDM sensitization. We observed the upregulation of pathways such as release and transportation of sequestered calcium ion release, sequestration and transportation, metal ion transport, collagen fibril organization, and calcium mediated signaling in sensitized mice. The increase in Ca2+ in cytoplasm is associated with asthma pathology including activation of respiratory smooth muscle, mast cells, vagal reflex stimulation, secretion of the airway submucous glands, and chemotaxis of eosinophils [87,88]. Based on combined results from gene expression and metabolomics data, we speculate that one effect of Ca2+ on asthma pathology may be through modulation of lipid signaling pathways.
This study used multi-omics to comprehensively illustrate molecular pathways involved during allergic sensitization in an animal model; however, it did have several limitations. First, the experiment was only conducted in male mice, which limited our ability to explore sex differences. Second, the lung tissue sample had to be rationed for histology, untargeted metabolomics, targeted lipidomics, and global gene expression data generation from different mice; thus, the metabolomics and gene expression data were not generated from the same animal. Third, the lung lobes for the omics studies were not perfused and, therefore, may have contained blood. While this could have impacted the responses observed, the filtering of compounds during data processing and the application of MTC during data analysis minimized the potential for artifacts related to blood contamination. In addition, previous studies utilized non-perfused tissues for molecular and omics research since immune cells infiltrate the lung via the blood and may contribute to the inflammatory response observed. Finally, the majority of our metabolomics data were annotated to an MSI level three and may have included mis-annotations, which can affect downstream pathway analysis.

5. Conclusions

The metabolomics data demonstrated downregulation of glycerophosphatidylcholines, glycerophosphatidylethanolamines, phosphosphingolipids, and glycerophosphoinositols, whereas several diacyglycerolphosphoserines and glycerophosphate were upregulated in HDM-sensitized mice. A focused analysis of oxylipins from lung tissue and plasma showed consistent results with previous studies linking decreased glycerophospholipid and sphingolipid compounds with increased bronchoreactivity and increased 12,13-EpOME (and its downstream compounds) and prostaglandins with allergic sensitization. The global gene expression analysis added another layer by linking differential changes in bioactive lipids to up- and downregulated signaling pathways such as calcium ion channels and G protein–signaling. For example, calcium channels and G protein–signaling modulate cPLA2 for the release of membrane lipids, which are substrates for downstream bioactive lipids. In summary, our study, using multi-omic analyses of mouse lung tissue during HDM sensitization, provided additional insight into molecular cascades during allergic sensitization including supporting known roles for AA metabolism.

Supplementary Materials

The following supporting information can be downloaded at: https://www.mdpi.com/article/10.3390/metabo13030406/s1, Figure S1: Dot plot showing pathway enrichment analysis of up-(a) and down-(b) regulated compounds in house dust mite (HDM)-sensitized mice experiment. Figure S2: Dot plot showing predicted enzyme dysregulation based on enrichment analysis of up- and down- (b) regulated compounds found to be significant in house dust mite (HDM)-sensitized experiment. Figure S3: Molecular network expansions (diffusion method) applied to metabolic signaling pathways. Figure S4: Lipid reaction prediction: the most active lipid conversion pathway. Figure S5: Box plots of plasma bioactive lipids comparing house dust mite (HDM)-sensitized to control mice. Figure S6: Box plots of lung tissue bioactive lipids comparing house dust mite (HDM)-sensitized to control mice. Figure S7: Joint metabolomics and gene expression data pathway enrichment analysis. Table S1: Significantly up- and downregulated compounds in house dust mite (HDM)-sensitized mice compared to control mice. Table S2: Significantly up- and downregulated genes in house dust mite (HDM)-sensitized mice compared to control mice. Table S3: Relevant genes function literature review. Text S1: Untargeted metabolomics quality control and metabolic knowledge-based network. Data S1: Lung Metabolomics Lipid Positive. Data S2: Lung Metabolomics Aqueous Positive.

Author Contributions

K.N.T., N.R. and A.K.B. contributed to the study design; C.R.M., K.A.D., N.R., J.M. and A.K.B. contributed to sample preparation and data acquisition. K.N.T. and A.K.B. performed statistical analysis; K.N.T. drafted the manuscript; C.R.M., K.A.D., N.R. and A.K.B. edited the manuscript. All authors have read and agreed to the published version of the manuscript.

Funding

This work was supported by the National Institute of Health, grant K01 HL149989, to KNT. The funding was provided by National Heart, Lung, and Blood Institute (NHLBI)—The Programs to Increase Diversity among Individuals Engaged in Health-Related Research (PRIDE)—Impact of Ancestry and Gender on Omics of Lung Diseases (AGOLD)—Small Research Project to KNT through R25HL146166. Support was also provided by NIH-NCRR grant 1S10OD010366-01A1 and R01HL123385 to N.R. In addition, the authors appreciate the contribution to this research made by E. Erin Smith, HTL (ASCP) CM QIHC; Allison Quador, HTL (ASCP) CM; and Jessica Arnold HTL (ASCP) CM of the University of Colorado Cancer Center Pathology Shared Resource and the Genomics Core. This resource was supported in part by the Cancer Center Support Grant (P30CA046934). The funding agencies did not have any role in the study design, collection, analysis and interpretation of data, the writing of this report, or the decision to submit for publication.

Institutional Review Board Statement

This study was conducted under protocols approved by the Institutional Animal Care and Use Committee at University of Colorado Anschutz Medical Campus (Aurora, CO).

Informed Consent Statement

Not applicable.

Data Availability Statement

Metabolomics data are available as supplement to this manuscript.

Acknowledgments

The authors are grateful to Dawn Newcomb of Vanderbilt University Medical Center for her contribution in experimental design, assisting with imaging the pathology slides, and feedback on the draft manuscript.

Conflicts of Interest

The authors have no conflict of interest to declare.

References

  1. Endo, Y.; Hirahara, K.; Yagi, R.; Tumes, D.J.; Nakayama, T. Pathogenic memory type Th2 cells in allergic inflammation. Trends Immunol. 2014, 35, 69–78. [Google Scholar] [CrossRef]
  2. Athari, S.S. Targeting cell signaling in allergic asthma. Signal Transduct. Target. Ther. 2019, 4, 45. [Google Scholar] [CrossRef] [PubMed] [Green Version]
  3. Comhair, S.A.; McDunn, J.; Bennett, C.; Fettig, J.; Erzurum, S.C.; Kalhan, S.C. Metabolomic Endotype of Asthma. J. Immunol. 2015, 195, 643–650. [Google Scholar] [CrossRef] [PubMed] [Green Version]
  4. Kleniewska, P.; Pawliczak, R. The participation of oxidative stress in the pathogenesis of bronchial asthma. Biomed. Pharmacother. 2017, 94, 100–108. [Google Scholar] [CrossRef] [PubMed]
  5. Wang, I.J.; Karmaus, W.J.; Yang, C.C. Polycyclic aromatic hydrocarbons exposure, oxidative stress, and asthma in children. Int. Arch. Occup. Environ. Health 2017, 90, 297–303. [Google Scholar] [CrossRef]
  6. Ple, C.; Fan, Y.; Ait Yahia, S.; Vorng, H.; Everaere, L.; Chenivesse, C.; Balsamelli, J.; Azzaoui, I.; de Nadai, P.; Wallaert, B.; et al. Polycyclic aromatic hydrocarbons reciprocally regulate IL-22 and IL-17 cytokines in peripheral blood mononuclear cells from both healthy and asthmatic subjects. PLoS ONE 2015, 10, e0122372. [Google Scholar] [CrossRef]
  7. Shin, Y.S.; Takeda, K.; Gelfand, E.W. Understanding asthma using animal models. Allergy Asthma Immunol. Res. 2009, 1, 10–18. [Google Scholar] [CrossRef] [Green Version]
  8. Turi, K.N.; Romick-Rosendale, L.; Ryckman, K.K.; Hartert, T.V. A review of metabolomics approaches and their application in identifying causal pathways of childhood asthma. J. Allergy Clin. Immunol. 2018, 141, 1191–1201. [Google Scholar] [CrossRef] [Green Version]
  9. Pite, H.; Aguiar, L.; Morello, J.; Monteiro, E.C.; Alves, A.C.; Bourbon, M.; Morais-Almeida, M. Metabolic Dysfunction and Asthma: Current Perspectives. J. Asthma Allergy 2020, 13, 237–247. [Google Scholar] [CrossRef]
  10. Reisdorph, N.; Wechsler, M.E. Utilizing metabolomics to distinguish asthma phenotypes: Strategies and clinical implications. Allergy 2013, 68, 959–962. [Google Scholar] [CrossRef]
  11. Mahood, T.H.; Pascoe, C.D.; Karakach, T.K.; Jha, A.; Basu, S.; Ezzati, P.; Spicer, V.; Mookherjee, N.; Halayko, A.J. Integrating Proteomes for Lung Tissues and Lavage Reveals Pathways That Link Responses in Allergen-Challenged Mice. Acs Omega 2021, 6, 1171–1189. [Google Scholar] [CrossRef] [PubMed]
  12. Ho, W.E.; Xu, Y.J.; Xu, F.G.; Cheng, C.; Peh, H.Y.; Tannenbaum, S.R.; Wong, W.S.F.; Ong, C.N. Metabolomics Reveals Altered Metabolic Pathways in Experimental Asthma. Am. J. Respir. Cell Mol. Biol. 2013, 48, 204–211. [Google Scholar] [CrossRef] [Green Version]
  13. Quinn, K.D.; Schedel, M.; Nkrumah-Elie, Y.; Joetham, A.; Armstrong, M.; Cruickshank-Quinn, C.; Reisdorph, R.; Gelfand, E.W.; Reisdorph, N. Dysregulation of metabolic pathways in a mouse model of allergic asthma. Allergy 2017, 72, 1327–1337. [Google Scholar] [CrossRef]
  14. Lee, H.S.; Seo, C.; Hwang, Y.H.; Shin, T.H.; Park, H.J.; Kim, Y.; Ji, M.; Min, J.; Choi, S.; Kim, H.; et al. Metabolomic approaches to polyamines including acetylated derivatives in lung tissue of mice with asthma. Metabolomics 2019, 15, 8. [Google Scholar] [CrossRef] [PubMed]
  15. Kang, Y.P.; Lee, W.J.; Hong, J.Y.; Lee, S.B.; Park, J.H.; Kim, D.; Park, S.; Park, C.S.; Park, S.W.; Kwon, S.W. Novel Approach for Analysis of Bronchoalveolar Lavage Fluid (BALF) Using HPLC-QTOF-MS-Based Lipidomics: Lipid Levels in Asthmatics and Corticosteroid-Treated Asthmatic Patients. J. Proteome Res. 2014, 13, 3919–3929. [Google Scholar] [CrossRef]
  16. Tian, M.; Chen, M.; Bao, Y.L.; Xu, C.D.; Qin, Q.Z.; Zhang, W.X.; He, Y.T.; Shao, Q. Sputum metabolomic profiling of bronchial asthma based on quadruple time-of-flight mass spectrometry. Int. J. Clin. Exp. Pathol. 2017, 10, 10363–10373. [Google Scholar]
  17. Johnson, R.K.; Manke, J.; Campbell, M.; Armstrong, M.; Boorgula, M.P.; Pinheiro, G.; Santana, C.V.N.; Mathias, R.A.; Barnes, K.C.; Cruz, A.; et al. Lipid mediators are detectable in the nasal epithelium and differ by asthma status in female subjects. J. Allergy Clin. Immunol. 2022, 150, 965–971.e968. [Google Scholar] [CrossRef] [PubMed]
  18. Johnson, R.K.; Brunetti, T.; Quinn, K.; Doenges, K.; Campbell, M.; Arehart, C.; Taub, M.A.; Mathias, R.A.; Reisdorph, N.; Barnes, K.C.; et al. Discovering metabolite quantitative trait loci in asthma using an isolated population. J. Allergy Clin. Immunol. 2022, 149, 1807–1811.e1816. [Google Scholar] [CrossRef]
  19. Rabinovitch, N.; Mauger, D.T.; Reisdorph, N.; Covar, R.; Malka, J.; Lemanske, R.F., Jr.; Morgan, W.J.; Guilbert, T.W.; Zeiger, R.S.; Bacharier, L.B.; et al. Predictors of asthma control and lung function responsiveness to step 3 therapy in children with uncontrolled asthma. J. Allergy Clin. Immunol. 2014, 133, 350–356. [Google Scholar] [CrossRef] [PubMed] [Green Version]
  20. Rabinovitch, N.; Reisdorph, N.; Silveira, L.; Gelfand, E.W. Urinary leukotriene E(4) levels identify children with tobacco smoke exposure at risk for asthma exacerbation. J. Allergy Clin. Immunol. 2011, 128, 323–327. [Google Scholar] [CrossRef] [Green Version]
  21. Calhoun, W.J.; Reed, H.E.; Moest, D.R.; Stevens, C.A. Enhanced superoxide production by alveolar macrophages and air-space cells, airway inflammation, and alveolar macrophage density changes after segmental antigen bronchoprovocation in allergic subjects. Am. Rev. Respir. Dis. 1992, 145, 317–325. [Google Scholar] [CrossRef]
  22. Comhair, S.A.; Erzurum, S.C. Redox control of asthma: Molecular mechanisms and therapeutic opportunities. Antioxid. Redox Signal. 2010, 12, 93–124. [Google Scholar] [CrossRef] [Green Version]
  23. Sahiner, U.M.; Birben, E.; Erzurum, S.; Sackesen, C.; Kalayci, O. Oxidative stress in asthma. World Allergy Organ. J. 2011, 4, 151–158. [Google Scholar] [CrossRef] [Green Version]
  24. Ono, E.; Dutile, S.; Kazani, S.; Wechsler, M.E.; Yang, J.; Hammock, B.D.; Douda, D.N.; Tabet, Y.; Khaddaj-Mallat, R.; Sirois, M.; et al. Lipoxin generation is related to soluble epoxide hydrolase activity in severe asthma. Am. J. Respir. Crit. Care Med. 2014, 190, 886–897. [Google Scholar] [CrossRef] [Green Version]
  25. Serhan, C.N. Pro-resolving lipid mediators are leads for resolution physiology. Nature 2014, 510, 92–101. [Google Scholar] [CrossRef] [PubMed] [Green Version]
  26. Levy, B.D.; Clish, C.B.; Schmidt, B.; Gronert, K.; Serhan, C.N. Lipid mediator class switching during acute inflammation: Signals in resolution. Nat. Immunol. 2001, 2, 612–619. [Google Scholar] [CrossRef] [PubMed]
  27. Basil, M.C.; Levy, B.D. Specialized pro-resolving mediators: Endogenous regulators of infection and inflammation. Nat. Rev. Immunol. 2016, 16, 51–67. [Google Scholar] [CrossRef] [PubMed]
  28. Polinski, K.J.; Armstrong, M.; Manke, J.; Seifert, J.; Crume, T.; Yang, F.; Clare-Salzler, M.; Holers, V.M.; Reisdorph, N.; Norris, J.M. Collection and Storage of Human Plasma for Measurement of Oxylipins. Metabolites 2021, 11, 137. [Google Scholar] [CrossRef] [PubMed]
  29. Larsson, N.; Lundström, S.L.; Pinto, R.; Rankin, G.; Karimpour, M.; Blomberg, A.; Sandström, T.; Pourazar, J.; Trygg, J.; Behndig, A.F.; et al. Lipid mediator profiles differ between lung compartments in asthmatic and healthy humans. Eur. Respir. J. 2014, 43, 453–463. [Google Scholar] [CrossRef] [Green Version]
  30. Gieger, C.; Geistlinger, L.; Altmaier, E.; de Angelis, M.H.; Kronenberg, F.; Meitinger, T.; Mewes, H.W.; Wichmann, H.E.; Weinberger, K.M.; Adamski, J.; et al. Genetics Meets Metabolomics: A Genome-Wide Association Study of Metabolite Profiles in Human Serum. PLoS Genet. 2008, 4, e1000282. [Google Scholar] [CrossRef] [Green Version]
  31. Romero, R.; Espinoza, J.; Gotsch, F.; Kusanovic, J.P.; Friel, L.A.; Erex, O.; Mazaki-Tovi, S.; Than, N.G.; Hassan, S.; Tromp, G. The use of high-dimensional biology (genomics, transcriptomics, proteomics, and metabolomics) to understand the preterm parturition syndrome. BJOG Int. J. Obstet. Gynaecol. 2006, 113 (Suppl. S3), 118–135. [Google Scholar] [CrossRef]
  32. Valcarcel, B.; Ebbels, T.M.D.; Kangas, A.J.; Soininen, P.; Elliot, P.; Ala-Korpela, M.; Jarvelin, M.R.; de Iorio, M. Genome metabolome integrated network analysis to uncover connections between genetic variants and complex traits: An application to obesity. J. R. Soc. Interface 2014, 11, 20130908. [Google Scholar] [CrossRef] [PubMed]
  33. Castaneda, A.R.; Pinkerton, K.E. Investigating the Effects of Particulate Matter on House Dust Mite and Ovalbumin Allergic Airway Inflammation in Mice. Curr. Protoc. Toxicol. 2016, 68, 18.18.1–18.18.18. [Google Scholar] [CrossRef] [Green Version]
  34. Acciani, T.H.; Brandt, E.B.; Hershey, G.K.K.; Le Cras, T.D. Diesel exhaust particle exposure increases severity of allergic asthma in young mice. Clin. Exp. Allergy 2013, 43, 1406–1418. [Google Scholar] [CrossRef]
  35. Bauer, A.K.; Fostel, J.; Degraff, L.M.; Rondini, E.A.; Walker, C.; Grissom, S.F.; Foley, J.; Kleeberger, S.R. Transcriptomic analysis of pathways regulated by toll-like receptor 4 in a murine model of chronic pulmonary inflammation and carcinogenesis. Mol. Cancer 2009, 8, 107. [Google Scholar] [CrossRef] [Green Version]
  36. Bauer, A.K.; Rondini, E.A.; Hummel, K.A.; Degraff, L.M.; Walker, C.; Jedlicka, A.E.; Kleeberger, S.R. Identification of candidate genes downstream of TLR4 signaling after ozone exposure in mice: A role for heat-shock protein 70. Environ. Health Perspect. 2011, 119, 1091–1097. [Google Scholar] [CrossRef]
  37. Woo, L.N.; Guo, W.Y.; Wang, X.; Young, A.; Salehi, S.; Hin, A.; Zhang, Y.; Scott, J.A.; Chow, C.W. A 4-Week Model of House Dust Mite (HDM) Induced Allergic Airways Inflammation with Airway Remodeling. Sci. Rep. 2018, 8, 6925. [Google Scholar] [CrossRef] [Green Version]
  38. Bauer, A.K.; Umer, M.; Richardson, V.L.; Cumpian, A.M.; Harder, A.Q.; Khosravi, N.; Azzegagh, Z.; Hara, N.M.; Ehre, C.; Mohebnasab, M.; et al. Requirement for MUC5AC in KRAS-dependent lung carcinogenesis. JCI Insight 2018, 3, e120941. [Google Scholar] [CrossRef] [PubMed]
  39. Cho, H.Y.; Morgan, D.L.; Bauer, A.K.; Kleeberger, S.R. Signal transduction pathways of tumor necrosis factor—Mediated lung injury induced by ozone in mice. Am. J. Respir. Crit. Care Med. 2007, 175, 829–839. [Google Scholar] [CrossRef] [Green Version]
  40. Yang, Y.H.; Cruickshank, C.; Armstrong, M.; Mahaffey, S.; Reisdorph, R.; Reisdorph, N. New sample preparation approach for mass spectrometry-based profiling of plasma results in improved coverage of metabolome. J. Chromatogr. A 2013, 1300, 217–226. [Google Scholar] [CrossRef] [PubMed] [Green Version]
  41. Cruickshank-Quinn, C.; Quinn, K.D.; Powell, R.; Yang, Y.H.; Armstrong, M.; Mahaffey, S.; Reisdorph, R.; Reisdorph, N. Multi-step Preparation Technique to Recover Multiple Metabolite Compound Classes for In-depth and Informative Metabolomic Analysis. J. Vis. Exp. 2014, 11, e51670. [Google Scholar] [CrossRef] [Green Version]
  42. Hughes, G.; Cruickshank-Quinn, C.; Reisdorph, R.; Lutz, S.; Petrache, I.; Reisdorph, N.; Bowler, R.; Kechris, K. MSPrep-Summarization, normalization and diagnostics for processing of mass spectrometry-based metabolomic data. Bioinformatics 2014, 30, 133–134. [Google Scholar] [CrossRef] [Green Version]
  43. Depner, C.M.; Cogswell, D.T.; Bisesi, P.J.; Markwald, R.R.; Cruickshank-Quinn, C.; Quinn, K.; Melanson, E.L.; Reisdorph, N.; Wright, K.P., Jr. Developing preliminary blood metabolomics-based biomarkers of insufficient sleep in humans. Sleep 2020, 43, zsz321. [Google Scholar] [CrossRef]
  44. Armstrong, M.; Liu, A.H.; Harbeck, R.; Reisdorph, R.; Rabinovitch, N.; Reisdorph, N. Leukotriene-E4 in human urine: Comparison of on-line purification and liquid chromatography-tandem mass spectrometry to affinity purification followed by enzyme immunoassay. J. Chromatogr. B 2009, 877, 3169–3174. [Google Scholar] [CrossRef] [Green Version]
  45. Kosaraju, R.; Guesdon, W.; Crouch, M.J.; Teague, H.L.; Sullivan, E.M.; Karlsson, E.A.; Schultz-Cherry, S.; Gowdy, K.; Bridges, L.C.; Reese, L.R.; et al. B Cell Activity Is Impaired in Human and Mouse Obesity and Is Responsive to an Essential Fatty Acid upon Murine Influenza Infection. J. Immunol. 2017, 198, 4738–4752. [Google Scholar] [CrossRef] [Green Version]
  46. Armstrong, M.; Manke, J.; Nkrumah-Elie, Y.; Shaikh, S.R.; Reisdorph, N. Improved quantification of lipid mediators in plasma and tissues by liquid chromatography tandem mass spectrometry demonstrates mouse strain specific differences. Prostaglandins Other Lipid Mediat. 2020, 151, 106483. [Google Scholar] [CrossRef]
  47. Ward, C.M.; To, T.H.; Pederson, S.M. ngsReports: A Bioconductor package for managing FastQC reports and other NGS related log files. Bioinformatics 2020, 36, 2587–2588. [Google Scholar] [CrossRef]
  48. Brown, J.; Pirrung, M.; McCue, L.A. FQC Dashboard: Integrates FastQC results into a web-based, interactive, and extensible FASTQ quality control tool. Bioinformatics 2017, 33, 3137–3139. [Google Scholar] [CrossRef] [Green Version]
  49. Liao, Y.; Smyth, G.K.; Shi, W. The R package Rsubread is easier, faster, cheaper and better for alignment and quantification of RNA sequencing reads. Nucleic Acids Res. 2019, 47, e47. [Google Scholar] [CrossRef] [Green Version]
  50. Tiffany, C.R.; Bäumler, A.J. omu, a Metabolomics Count Data Analysis Tool for Intuitive Figures and Convenient Metadata Collection. Microbiol. Resour. Announc. 2019, 8, e00129-19. [Google Scholar] [CrossRef] [Green Version]
  51. Gaud, C.; Sousa, B.C.; Nguyen, A.; Fedorova, M.; Ni, Z.; O’Donnell, V.B.; Wakelam, M.J.; Andrews, S.; Lopez-Clavijo, A.F. BioPAN: A web-based tool to explore mammalian lipidome metabolic pathways on LIPID MAPS. F1000Res 2021, 10, 4. [Google Scholar] [CrossRef]
  52. Picart-Armada, S.; Fernandez-Albert, F.; Vinaixa, M.; Yanes, O.; Perera-Lluna, A. FELLA: An R package to enrich metabolomics data. BMC Bioinform. 2018, 19, 538. [Google Scholar] [CrossRef] [Green Version]
  53. Przulj, N. Cytoscape: A Tool for Analyzing and Visualizing Network Data. In Analyzing Network Data in Biology and Medicine; Cambridge University Press: Cambridge, UK, 2019; pp. 533–592. [Google Scholar] [CrossRef]
  54. Love, M.I.; Huber, W.; Anders, S. Moderated estimation of fold change and dispersion for RNA-seq data with DESeq2. Genome Biol. 2014, 15, 550. [Google Scholar] [CrossRef] [Green Version]
  55. van Iterson, M.; van Zwet, E.W.; Heijmans, B.T.; BIOS Consortium. Controlling bias and inflation in epigenome- and transcriptome-wide association studies using the empirical null distribution. Genome Biol. 2017, 18. [Google Scholar] [CrossRef] [Green Version]
  56. Smedley, D.; Haider, S.; Ballester, B.; Holland, R.; London, D.; Thorisson, G.; Kasprzyk, A. BioMart—Biological queries made easy. BMC Genom. 2009, 10, 22. [Google Scholar] [CrossRef] [Green Version]
  57. Chang, A.B.; Gibson, P.G.; Masters, I.B.; Dash, P.; Hills, B.A. The relationship between inflammation and dipalmitoyl phosphatidycholine in induced sputum of children with asthma. J. Asthma 2003, 40, 63–70. [Google Scholar] [CrossRef]
  58. Voelker, D.R. Phosphatidylserine Functions as the Major Precursor of Phosphatidylethanolamine in Cultured Bhk-21-Cells. Proc. Natl. Acad. Sci. USA 1984, 81, 2669–2673. [Google Scholar] [CrossRef] [Green Version]
  59. Yu, M.; Jia, H.M.; Cui, F.X.; Yang, Y.; Zhao, Y.; Yang, M.H.; Zou, Z.M. The Effect of Chinese Herbal Medicine Formula mKG on Allergic Asthma by Regulating Lung and Plasma Metabolic Alternations. Int. J. Mol. Sci. 2017, 18, 602. [Google Scholar] [CrossRef] [Green Version]
  60. Ono, J.G.; Kim, B.I.; Zhao, Y.Z.; Christos, P.J.; Tesfaigzi, Y.; Worgall, T.S.; Worgall, S. Decreased sphingolipid synthesis in children with 17q21 asthma risk genotypes. J. Clin. Investig. 2020, 130, 921–926. [Google Scholar] [CrossRef]
  61. Wang, S.S.; Tang, K.; Lu, Y.J.; Tian, Z.; Huang, Z.L.; Wang, M.J.; Zhao, J.P.; Xie, J.G. Revealing the role of glycerophospholipid metabolism in asthma through plasma lipidomics. Clin. Chim. Acta 2021, 513, 34–42. [Google Scholar] [CrossRef]
  62. Szondy, Z.; Sarang, Z.; Kiss, B.; Garabuczi, É.; Köröskényi, K. Anti-inflammatory Mechanisms Triggered by Apoptotic Cells during Their Clearance. Front. Immunol. 2017, 8, 909. [Google Scholar] [CrossRef] [Green Version]
  63. Klein, M.E.; Rieckmann, M.; Lucas, H.; Meister, A.; Loppnow, H.; Mäder, K. Phosphatidylserine (PS) and phosphatidylglycerol (PG) enriched mixed micelles (MM): A new nano-drug delivery system with anti-inflammatory potential? Eur. J. Pharm. Sci. 2020, 152, 105451. [Google Scholar] [CrossRef]
  64. Tokes, T.; Tuboly, E.; Varga, G.; Major, L.; Ghyczy, M.; Kaszaki, J.; Boros, M. Protective effects of L-alpha-glycerylphosphorylcholine on ischaemia-reperfusion-induced inflammatory reactions. Eur. J. Nutr. 2015, 54, 109–118. [Google Scholar] [CrossRef] [Green Version]
  65. Miki, H.; Nakahashi-Oda, C.; Sumida, T.; Shibuya, A. Involvement of CD300a Phosphatidylserine Immunoreceptor in Aluminum Salt Adjuvant-Induced Th2 Responses. J. Immunol. 2015, 194, 5069–5076. [Google Scholar] [CrossRef] [Green Version]
  66. Serhan, C.N.; Chiang, N.; Van Dyke, T.E. Resolving inflammation: Dual anti-inflammatory and pro-resolution lipid mediators. Nat. Rev. Immunol. 2008, 8, 349–361. [Google Scholar] [CrossRef] [Green Version]
  67. Shimizu, T. Lipid Mediators in Health and Disease: Enzymes and Receptors as Therapeutic Targets for the Regulation of Immunity and Inflammation. Annu. Rev. Pharmacol. 2009, 49, 123–150. [Google Scholar] [CrossRef] [Green Version]
  68. Vangaveti, V.; Baune, B.T.; Kennedy, R.L. Hydroxyoctadecadienoic acids: Novel regulators of macrophage differentiation and atherogenesis. Ther. Adv. Endocrinol. Metab. 2010, 1, 51–60. [Google Scholar] [CrossRef] [Green Version]
  69. Piomelli, D.; Sasso, O. Peripheral gating of pain signals by endogenous lipid mediators. Nat. Neurosci. 2014, 17, 164–174. [Google Scholar] [CrossRef] [Green Version]
  70. Cho, J.S.; Han, I.H.; Lee, H.R.; Lee, H.M. Prostaglandin E2 Induces IL-6 and IL-8 Production by the EP Receptors/Akt/NF-kappaB Pathways in Nasal Polyp-Derived Fibroblasts. Allergy Asthma Immunol. Res 2014, 6, 449–457. [Google Scholar] [CrossRef] [Green Version]
  71. Patrono, C.; Rotella, C.M.; Toccafondi, R.S.; Aterini, S.; Pinca, E.; Tanini, A.; Zonefrati, R. Prostacyclin stimulates the adenylate cyclase system of human thyroid tissue. Prostaglandins 1981, 22, 105–115. [Google Scholar] [CrossRef]
  72. Whittle, B.J.; Moncada, S. Prostacyclin and its analogues for the therapy of thromboembolic disorders. Adv. Exp. Med. Biol. 1984, 164, 193–209. [Google Scholar] [CrossRef]
  73. Hata, A.N.; Breyer, R.M. Pharmacology and signaling of prostaglandin receptors: Multiple roles in inflammation and immune modulation. Pharmacol. Ther. 2004, 103, 147–166. [Google Scholar] [CrossRef]
  74. Kern, K.; Schafer, S.M.G.; Cohnen, J.; Pierre, S.; Osthues, T.; Tarighi, N.; Hohmann, S.; Ferreiros, N.; Brune, B.; Weigert, A.; et al. The G2A Receptor Controls Polarization of Macrophage by Determining Their Localization Within the Inflamed Tissue. Front. Immunol. 2018, 9, 2261. [Google Scholar] [CrossRef]
  75. Fujimura, K.E.; Sitarik, A.R.; Haystad, S.; Lin, D.L.; Levan, S.; Fadrosh, D.; Panzer, A.R.; LaMere, B.; Rackaityte, E.; Lukacs, N.W.; et al. Neonatal gut microbiota associates with childhood multisensitized atopy and T cell differentiation. Nat. Med. 2016, 22, 1187–1191. [Google Scholar] [CrossRef] [Green Version]
  76. Levan, S.R.; Stamnes, K.A.; Lin, D.L.; Panzer, A.R.; Fukui, E.; McCauley, K.; Fujimura, K.E.; McKean, M.; Ownby, D.R.; Zoratti, E.M.; et al. Elevated faecal 12,13-diHOME concentration in neonates at high risk for asthma is produced by gut bacteria and impedes immune tolerance. Nat. Microbiol. 2019, 4, 1851–1861. [Google Scholar] [CrossRef]
  77. Hildreth, K.; Kodani, S.D.; Hammock, B.D.; Zhao, L. Cytochrome P450-derived linoleic acid metabolites EpOMEs and DiHOMEs: A review of recent studies. J. Nutr. Biochem. 2020, 86, 108484. [Google Scholar] [CrossRef]
  78. Mabalirajan, U.; Rehman, R.; Ahmad, T.; Kumar, S.; Singh, S.; Leishangthem, G.D.; Aich, J.; Kumar, M.; Khanna, K.; Singh, V.P.; et al. Linoleic acid metabolite drives severe asthma by causing airway epithelial injury. Sci. Rep. 2013, 3, 1349. [Google Scholar] [CrossRef] [Green Version]
  79. Kumar, N.; Gupta, G.; Anilkumar, K.; Fatima, N.; Karnati, R.; Reddy, G.V.; Giri, P.V.; Reddanna, P. 15-Lipoxygenase metabolites of alpha-linolenic acid, [13-(S)-HPOTrE and 13-(S)-HOTrE], mediate anti-inflammatory effects by inactivating NLRP3 inflammasome. Sci. Rep. 2016, 6, 31649. [Google Scholar] [CrossRef] [Green Version]
  80. Pauls, S.D.; Rodway, L.A.; Winter, T.; Taylor, C.G.; Zahradka, P.; Aukema, H.M. Anti-inflammatory effects of alpha-linolenic acid in M1-like macrophages are associated with enhanced production of oxylipins from alpha-linolenic and linoleic acid. J. Nutr. Biochem. 2018, 57, 121–129. [Google Scholar] [CrossRef]
  81. Walker, R.E.; Savinova, O.V.; Pedersen, T.L.; Newman, J.W.; Shearer, G.C. Effects of inflammation and soluble epoxide hydrolase inhibition on oxylipin composition of very low-density lipoproteins in isolated perfused rat livers. Physiol. Rep. 2021, 9, e14480. [Google Scholar] [CrossRef]
  82. Cucchi, D.; Camacho-Munoz, D.; Certo, M.; Niven, J.; Smith, J.; Nicolaou, A.; Mauro, C. Omega-3 polyunsaturated fatty acids impinge on CD4(+) T cell motility and adipose tissue distribution via direct and lipid mediator-dependent effects. Cardiovasc. Res. 2020, 116, 1006–1020. [Google Scholar] [CrossRef]
  83. Xu, S.Z.; Muraki, K.; Zeng, F.; Li, J.; Sukumar, P.; Shah, S.; Dedman, A.M.; Flemming, P.K.; McHugh, D.; Naylor, J.; et al. A sphingosine-1-phosphate-activated calcium channel controlling vascular smooth muscle cell motility. Circ. Res. 2006, 98, 1381–1389. [Google Scholar] [CrossRef]
  84. Sanderson, M.J.; Delmotte, P.; Bai, Y.; Perez-Zogbhi, J.F. Regulation of airway smooth muscle cell contractility by Ca2+ signaling and sensitivity. Proc. Am. Thorac. Soc. 2008, 5, 23–31. [Google Scholar] [CrossRef]
  85. Dennis, E.A.; Cao, J.; Hsu, Y.H.; Magrioti, V.; Kokotos, G. Phospholipase A(2) Enzymes: Physical Structure, Biological Function, Disease Implication, Chemical Inhibition, and Therapeutic Intervention. Chem. Rev. 2011, 111, 6130–6185. [Google Scholar] [CrossRef] [Green Version]
  86. Fink, E.L.; Clark, R.S.B.; Kochanek, P.M. Chapter 62—Hypoxic-Ischemic Encephalopathy: Pathobiology and Therapy of the Post-Resuscitation Syndrome in Children. In Pediatric Critical Care, 4th ed.; Fuhrman, B.P., Zimmerman, J.J., Eds.; Mosby: Saint Louis, MO, USA, 2011; pp. 871–892. [Google Scholar]
  87. So, S.Y.; Ip, M.; Lam, W.K. Calcium-Channel Blockers and Asthma. Lung 1986, 164, 1–16. [Google Scholar] [CrossRef]
  88. Chiu, K.Y.; Li, J.G.; Lin, Y. Calcium channel blockers for lung function improvement in asthma A systematic review and meta-analysis. Ann. Allergy Asthma Immunol. 2017, 119, 518–523. [Google Scholar] [CrossRef]
Figure 1. Experimental design for mice house dust mite (HDM) sensitization and challenge and sample collections. Mice were sensitized (week 1) or challenged (weeks 2–4) with HDM or saline (control) followed by euthanasia 24 h following final dose. i.n. = internasal. The blue arrow indicates timing of HDM or saline administration.
Metabolites 13 00406 g001
Figure 2. Inflammation increased in response to HDM. (a) BALF inflammatory cells, macrophages, polymorphonuclear leukocytes (PMNs), eosinophils, lymphocytes, and epithelial cells increased in response to the HDM allergen model in BALB mice. (b) Total BALF protein increased in response to HDM, indicative of lung hyperpermeability. Control n = 5; HDM n = 4. * p < 0.05 for HDM-sensitized mice compared to control mice. Histopathology in (cg) show differences between control (c) and HDM exposed mice (dg). (c) Control mouse stained with H&E at 4 and 20× magnification (inset at red arrow). (d) H&E of an HDM-exposed mouse at 4× (inset from region of orange arrow in (e) and (e) 20× magnification. Red arrow indicates peribronchial inflammation. (f) Collagen deposition in the same HDM-exposed mouse in trichome stained section (trichrome, blue; black arrow). (g) Goblet cell hyperplasia in PAS-stained section from the same HDM-exposed mouse (PAS staining (pinkish purple, red arrow); counterstain light green).
Metabolites 13 00406 g002
Figure 3. Differentially regulated compounds between house dust mite (HDM)-sensitized and control (see Table S1 for details on all significant compounds). (a) Differentially regulated lipid compounds between HDM-sensitized and control mice following metabolomics of lung tissue. The bubbles were colored according to the class of the compounds. The x-axis shows log 2 of the foldchange (log2 FC) and y-axis shows negative log 10 of the multiple tests adjusted p-values (padj). The compounds above horizontal dashed lines show significantly upregulated (log FC > 0) and downregulated (log FC < 0) lipid compounds. (b) Differentially regulated non-lipid compounds between house dust mite-sensitized and control mice following metabolomics of lung tissue. The bubbles were colored according to the class of the compounds. The x-axis shows log 2 of the foldchange (log2 FC) and y-axis shows negative log 10 of the multiple tests adjusted p-values (padj). The compounds above horizontal dashed lines show significantly upregulated (log FC > 0) and downregulated (log FC < 0) non-lipid compounds. (c) Histogram of significantly upregulated (red) and downregulated (blue) lung tissue compounds organized by subclass (x-axis). The number of compounds in each class (KEGG subclass 2) with significant differences between HDM-sensitized and control mice is shown.
Metabolites 13 00406 g003aMetabolites 13 00406 g003b
Figure 4. Box plots of significantly different oxylipins between house dust mite (HDM)-sensitized and control mice plasma and lung tissue. (a) Significantly different oxylipins in mice plasma (see Figure S5 for all oxylipins). (b) Significantly different oxylipins in mice lung tissue (see Figure S6 for all oxylipins). The t-test was used for statistical comparison for HDM-sensitized and control. p-values provided for each lipid panel were not adjusted for multiple testing.
Metabolites 13 00406 g004aMetabolites 13 00406 g004b
Figure 5. Volcano plot of differentially upregulated and downregulated genes following transcriptomics analysis of lung tissue (see Table S2 for details on all significant genes). The x-axis shows log 2 transformed fold-change and y-axis shows negative log 10 transformed p-value. Horizontal dashed line is a cut-off p-value at 0.05 adjusted for multiple testing. The two vertical dashed lines represent a fold-change window with genes to the left or right of the window at greater or less than 1.5 fold-change.
Metabolites 13 00406 g005
Figure 6. Allergy sensitization lipid regulation pathway. Pathways were constructed using results from current study (in blue boxes for metabolites and green for gene pathway) and previously published studies. Gray boxes show enzymes involved in bioactive lipids synthesis (related genes were upregulated, but not significant). The thick orange and blue arrows show the direction of the signaling pathways’ regulations based on previous studies.
Metabolites 13 00406 g006
Table 1. Significantly upregulated and downregulated Go biological processes pathways following gene expression analysis of HDM-sensitized and control mice lung tissue. The odds ratio was defined as the ratio of the proportion of a GO term in upregulated and downregulated genes to the proportion of this GO term in all diatom genes.
TermOdds RatioGenesRegulation
Positive regulation of vesicle fusion 142.41Akt2, Doc2bDown
Regulation of vesicle fusion 101.71Akt2, Doc2bDown
Central nervous system neuron axonogenesis 64.71Chrnb2, Sptbn4Down
Central nervous system projection neuron axonogenesis 64.71Chrnb2, Sptbn4Down
Regulation of glycogen biosynthetic process 29.64Akt2, PaskDown
Positive regulation of organelle organization 22.94Akt2, Doc2bDown
Regulation of TORC1 signaling 21.55Atm, Gpr137cDown
Regulation of B cell proliferation 16.15Chrnb2, AtmDown
Organic hydroxy compound biosynthetic process 14.80Osbpl6, Hsd17b1Down
Regulation of calcium ion transmembrane transport
via high voltage-gated calcium channel
52.66Camk2d, Cacna2d1Up
Regulation of cardiac muscle contraction by regulation of
the release of sequestered calcium ion
31.59Ryr2, Camk2dUp
Cardiac muscle cell contraction 27.87Camk2d, Cacna2d1Up
Regulation of cardiac muscle contraction by calcium ion signaling 24.93Ryr2, Camk2dUp
Calcium ion transport into cytosol 24.93Ryr2, Cacna2d1Up
Calcium-mediated signaling using intracellular calcium source 24.93Ryr2, StimateUp
Regulation of release of sequestered calcium ion into cytosol by
sarcoplasmic reticulum
22.55Ryr2, Camk2dUp
Regulation of calcium ion transmembrane transport 22.55Camk2d, Cacna2d1Up
Regulation of cardiac muscle cell action potential 20.59Ryr2, Camk2dUp
Regulation of cardiac muscle cell contraction 18.94Ryr2, Camk2dUp
Cytosolic calcium ion transport 18.21Ryr2, Cacna2d1Up
Ion homeostasis 16.91Slc4a8, Camk2dUp
Cardiac muscle cell action potential involved in contraction 16.33Ryr2, Cacna2d1Up
Cardiac muscle contraction 14.79Ryr2, Camk2dUp
Metal ion transport 8.43Ryr2, Cacna2d1, Cdh23Up
Collagen fibril organization 8.33Col24a1, Col11a2, Col19a1Up
Calcium-mediated signaling 7.23Ryr2, Stimate, Cxcr6Up
Table 2. Significantly upregulated and downregulated GO Molecular processes pathways following gene expression analysis of HDM-sensitized and control mice lung tissue. The odds ratio was defined as the ratio of the proportion of a GO term in upregulated and downregulated genes to the proportion of this GO term in all diatom genes.
TermOdds.RatioGenesRegulation
Testosterone dehydrogenase [NAD(P)] activity87.45Hsd17b1Down
Chromatin insulator sequence binding87.45Repin1Down
RNA strand annealing activity87.45Eif4bDown
Neuroligin family protein binding87.45Nrxn2Down
CCR5 chemokine receptor binding87.45Cnih4Down
Phosphatidylinositol-3,5-bisphosphate 3-phosphatase activity87.45Mtm1Down
Annealing activity87.45Eif4bDown
Oncostatin M receptor activity69.95LifrDown
Leukemia inhibitory factor receptor activity69.95LifrDown
Mannosyl-oligosaccharide 1,2-alpha-mannosidase activity58.29Man1b1Down
Mannosyl-oligosaccharide mannosidase activity58.29Man1b1Down
Phosphatidylinositol-3,5-bisphosphate phosphatase activity58.29Mtm1Down
Estradiol 17-beta-dehydrogenase activity49.96Hsd17b1Down
Ciliary neurotrophic factor receptor activity49.96LifrDown
Ciliary neurotrophic factor receptor binding43.71LifrDown
1-phosphatidylinositol-3-kinase activity38.86AtmDown
Acetylcholine-gated cation-selective channel activity34.97Chrnb2Down
Phosphatidylinositol 3-kinase activity31.79AtmDown
Water channel activity29.14Aqp6Down
Phosphatidylinositol kinase activity 24.97AtmDown
Water transmembrane transporter activity24.97Aqp6Down
Phosphatidylinositol-3-phosphatase activity 24.97Mtm1Down
Nuclear import signal receptor activity23.31Ipo4Down
Ribosomal small subunit binding 21.85Eif4bDown
Phosphatidylinositol monophosphate phosphatase activity 21.85Mtm1Down
phosphatidylinositol binding 7.88Pask, Mtm1Down
Benzodiazepine receptor binding58.56Tspoap1Up
Voltage-gated calcium channel activity involved in
cardiac muscle cell action potential
58.56Cacna2d1Up
Oncostatin M receptor activity46.84PrlrUp
Sodium:bicarbonate symporter activity46.84Slc4a8Up
Solute:bicarbonate symporter activity46.84Slc4a8Up
Alpha-glucosidase activity46.84GanabUp
Leukemia inhibitory factor receptor activity46.84PrlrUp
G protein-coupled serotonin receptor binding46.84Gna11Up
Bicarbonate transmembrane transporter activity36.45Slc4a8, Slc26a3Up
Chloride transmembrane transporter activity33.84Slc4a8, Slc26a3Up
Ciliary neurotrophic factor receptor activity33.46PrlrUp
Sodium channel inhibitor activity33.46Camk2dUp
Glucosidase activity33.46GanabUp
Ciliary neurotrophic factor receptor binding29.27PrlrUp
Oxalate transmembrane transporter activity29.27Slc26a3Up
Acyl-CoA dehydrogenase activity29.27IvdUp
Lys63-specific deubiquitinase activity26.02Otud4Up
Intracellular ligand-gated ion channel activity23.42Ryr2Up
Small GTPase binding4.15Unc13b, Dock4, Golga5Up
Disclaimer/Publisher’s Note: The statements, opinions and data contained in all publications are solely those of the individual author(s) and contributor(s) and not of MDPI and/or the editor(s). MDPI and/or the editor(s) disclaim responsibility for any injury to people or property resulting from any ideas, methods, instructions or products referred to in the content.

