Article

Evaluation of GC/MS-Based 13C-Positional Approaches for TMS Derivatives of Organic and Amino Acids and Application to Plant 13C-Labeled Experiments

by
Younès Dellero
1,2,3,*,
Olivier Filangi
1,2,3 and
Alain Bouchereau
1,2,3
1
Institute for Genetics, Environment and Plant Protection (IGEPP), National Research Institute for Agriculture, Food and Environment (INRAE), Institut Agro, Université Rennes, 35650 Le Rheu, France
2
Metabolic Profiling and Metabolomic Platform (P2M2), Biopolymers Interactions Assemblies, Institute for Genetics, Environment and Plant Protection, 35650 Le Rheu, France
3
MetaboHUB, National Infrastructure of Metabolomics and Fluxomics, 35650 Le Rheu, France
*
Author to whom correspondence should be addressed.
Metabolites 2023, 13(4), 466; https://doi.org/10.3390/metabo13040466
Submission received: 28 February 2023 / Revised: 20 March 2023 / Accepted: 20 March 2023 / Published: 23 March 2023
(This article belongs to the Section Plant Metabolism)

Abstract

:
Analysis of plant metabolite 13C-enrichments with gas-chromatography mass spectrometry (GC/MS) has gained interest recently. By combining multiple fragments of a trimethylsilyl (TMS) derivative, 13C-positional enrichments can be calculated. However, this new approach may suffer from analytical biases depending on the fragments selected for calculation leading to significant errors in the final results. The goal of this study was to provide a framework for the validation of 13C-positional approaches and their application to plants based on some key metabolites (glycine, serine, glutamate, proline, α-alanine and malate). For this purpose, we used tailor-made 13C-PT standards, harboring known carbon isotopologue distributions and 13C-positional enrichments, to evaluate the reliability of GC-MS measurements and positional calculations. Overall, we showed that some mass fragments of proline_2TMS, glutamate_3TMS, malate_3TMS and α-alanine_2TMS had important biases for 13C measurements resulting in significant errors in the computational estimation of 13C-positional enrichments. Nevertheless, we validated a GC/MS-based 13C-positional approach for the following atomic positions: (i) C1 and C2 of glycine_3TMS, (ii) C1, C2 and C3 of serine_3TMS, and (iii) C1 of malate_3TMS and glutamate_3TMS. We successfully applied this approach to plant 13C-labeled experiments for investigating key metabolic fluxes of plant primary metabolism (photorespiration, tricarboxylic acid cycle and phosphoenolpyruvate carboxylase activity).

Graphical Abstract

1. Introduction

Plant growth and seed yield establishment are supported at the molecular level by the activity of central metabolic pathways [1]. These pathways act together to sustain carbon and nutrient uptake, their assimilation and use and ultimately their remobilization from source-to-sink tissues [1,2,3]. Hence, it is essential to develop methods and tools to monitor the activity of these pathways. For this purpose, labeling experiments with stable isotopes (13C and 15N) was applied to plants and provided valuable information at different levels of integration [4]. Indeed, analysis of 15N-enrichments at the organ level after a pulse-chase experiment allowed the separate evaluation of the contribution of nitrogen uptake and remobilization processes to seed filling [5]. Conversely, labeling experiments with 13C or 15N metabolic probes followed by analysis of 13C or 15N enrichments at the metabolite level allowed the evaluation of protein turnover and carbon allocations to major metabolites, thereby reflecting the regulation of the activity of central metabolic pathways [6,7,8,9,10,11,12,13,14]. However, there may be more than one pathway contributing to the biosynthesis of some important metabolites [4,15]. Thus, access to positional information of 13C-enrichments is sometimes a prerequisite for determining the contributions of individual metabolic pathways [16]. This positional information may also help to resolve some flux identifiability issues encountered in metabolic flux analysis [17].
Analysis of 13C-enrichment in plant metabolites is generally performed using either Nuclear Magnetic Resonance (NMR) or Mass Spectrometry (MS). Although 13C-NMR analysis is less sensitive than MS analysis, it can directly give access to each carbon of a metabolite with a good resolution for separation in either purified or complex plant matrices [18]. Notably, 13CO2 incorporation into illuminated leaves combined with 13C-NMR analysis successfully determined the metabolic origin of carbon atoms in malate and glutamate by identifying the respective contributions of phosphoenolpyruvate carboxylase (PEPc) and the tricarboxylic acid (TCA) cycle [15,19,20]. 13C-NMR was also recently used to evaluate the concurrent contribution of mevalonate and methylerythritol-phosphate pathways to the biosynthesis of sclareol precursors [21]. Unlike 13C-NMR, analysis of 13C by MS is a very sensitive method, but it mainly provides information at the isotopologue level. Thus, the labeled molecules are separated according to their numbers of 13C atoms for a given metabolite (isotopologues) resulting in mass shifts from M0 non-labeled molecules [22]. Since an isotopologue can contain several isotopomers, i.e., molecules labeled with the same numbers of 13C but differing in position, the analysis of the results can be relatively more complex [23]. Nevertheless, this MS method was successfully applied to monitor the fate of 13C-metabolic probes within plant metabolism due to the ability to monitor some pathway-specific isotopologues [12,24,25,26,27,28]. Approaches using 13C-positional GC-EI-MS have emerged recently to improve the level of information obtained by MS [17,29,30]. These methods combined mean 13C-enrichments of multiple fragments from the same derivative to calculate 13C-positional enrichments. To date, this approach has been limited to the study of TMS derivatives for malate, glutamate and glucose in the field of plant science [29]. Indeed, the possibility to extrapolate this positional approach to multiple metabolites is restricted by the availability of the informative ions and by their intensity. A recent GC-MS study confirmed that the fragmentation pattern of TMS derivatives for succinate, citrate and fumarate prevented the use of this positional 13C approach [31]. Regarding TMS derivatives of amino acids, most of them showed only an intense ion resulting from an alpha-cleavage of the aliphatic carbon [32,33]. However, some amino acids, such as alpha-alanine, glycine, proline and serine, also have intense ions from additional fragmentation pathways (alpha-cleavage to nitrogen and loss of a methyl radical followed by CO elimination) and could be used to obtain valuable information on plant metabolism [32].
To date, 13C-positional approaches have been mainly applied to assess the contribution of PEPc activity to malate/glutamate biosynthesis and to gluconeogenesis in guard cells and leaves from Arabidopsis and tobacco [29,34]. However, this 13C-positional method did not consider potential errors of measurements associated to the MS fragments that could be derived from both analytical and matrixial biases [26,35,36]. In addition, these errors of measurements may easily be larger in the calculated 13C-positional enrichments by combining several biased fragments in several calculations. Finally, the proposed method used relative 13C-enrichment values normalized to the “0” time point of the experiment (division) before the calculations [29,34]. This normalization step is extremely dangerous because (i) no enrichment is expected at the “0” time point if measurements are highly accurate, except natural 13C abundance; and (ii) some mass fragments can have very poor accuracies at natural 13C abundance. These problems will distort the normalization scales between different fragments of a same TMS derivative, thereby affecting the accuracy of 13C-positional enrichment calculations. Thus, the reliability of the 13C-positional GC-MS approaches remain to be assessed prior to its wide application to plant 13C-labeled experiments. The accuracy of 13C measurements by GC-MS has been thoroughly evaluated recently at the isotopologue level using tailor-made 13C standards (13C-PT) harboring a fully controlled carbon isotopologue distribution (CID) pattern [26]. Interestingly, these standards had equal proportions of each possible isotopologue and each possible associated 13C isotopomer leading to a positional mean 13C-enrichment of 50% for each carbon of each metabolite [36]. Thus, these standards could be used to assess the accuracy of calculations from 13C-positional GC-MS approaches. Here, we took advantage of 13C-PT standard samples to evaluate such calculation accuracy for some important metabolites of plant metabolism (glycine, serine, glutamate, proline, α-alanine and malate). First, we selected multiple mass fragments from a same metabolite (TMS derivative) and assessed their CID patterns. Next, we used the mean 13C-enrichment of these fragments to calculate some 13C-positional enrichments. Finally, we applied the validated calculations to plant 13C-labeled experiments and reconnected some calculated 13C-positional enrichments to known metabolic processes regulated by light and dark conditions (photorespiration and PEPc/TCA cycle).

2. Materials and Methods

2.1. Positional Identification of Carbon Backbones from Mass Fragments of TMS Derivatives

For Glutamate_3TMS and Malate_3TMS, the identity of carbons contained in TMS derivative mass fragments was based on previously published studies that used metabolites labeled in specific positions [29,31]. For Proline_2TMS, we separately injected a non-labeled proline standard and a commercial U-13C-Proline standard (13C isotopic purity of 99%, Cambridge Isotope Laboratories (Eurisotop, Saint-Aubin, France)). For other TMS derivatives, we retrieved mass tables from GC-MS spectra of the Golm Metabolome Database corresponding to the injection of either 13C-reference substances or 13C-analytes produced with a determined 13C isotopic signature [37,38]. For each TMS derivative and each fragment analyzed, the mass isotopic cluster was used to calculate the area distribution for each m/z expressed as a percentage of the total area for the mass isotopic cluster (relative intensity from 0 to 100%).

2.2. Analysis of Carbon Isotopologue Distributions (CID) from 13C-PT Standards and Plant 13C-Labeled Experiments

We retrieved processed GC-MS spectra from two distinct GC-MS-based experiments. The first experiment consisted of the injection of tailor-made isotopic standards (13C-PT samples) [26]. These standards harbored a fully controlled carbon isotopologue distribution following a binomial pattern [36]. Consequently, all fragments produced from the TMS derivatives of these standards had a fractional mean 13C enrichment of 0.5 and their CIDs were predicted according to the number of carbons present within each mass fragment. The amino acids were analyzed with the 13C-PT protein hydrolysates (4 biological replicates), while malate was analyzed with the 13C-PT full metabolite extract (4 biological replicates). The second experiment consisted of the injection of 48 polar metabolite extracts from incorporation kinetics of U-13C-pyruvate into Brassica napus (B. napus) leaf discs in either light or dark conditions for up to 6 h (4 biological replicates per condition and per timepoint) [26]. The previous processing of the spectra for all samples comprised the adjustment of the retention time with a mixture of alkanes and the peak identification with respect to authentic standards derivatized and by reference to GC-EI-MS mass spectra of TMS derivatives in the US National Institute of Standards and Technology database and in the Golm metabolome database [38].
Then, the spectra were processed again with a modified method based on the new fragments presented in Table 1. Raw areas were subjected to correction for the contribution of naturally occurring isotopes of all elements except the carbon arising from the metabolite backbone using the IsoCor v2.1.4 package of Python (https://github.com/MetaSys-LISBP/IsoCor, accessed on 20 February 2023) in low-resolution mode. For samples arising from U-13C-pyruvate incorporations, an additional correction was performed to account for the contribution of naturally occurring isotopes of the carbon arising from the metabolite backbone and the isotopic purity of the tracer U-13C-pyruvate (99%). Practically, this correction led to a value of 0% if labeling was at natural 13C abundance (1.1%) and a value of 100% if labeling was at the maximal possible 13C enrichment. Samples of 13C-PT were not concerned by this additional correction since they already held fully controlled 12C/13C patterns at all positions. A corrective method dedicated to IsoCor was specifically created for the TMS-derivative fragments described in this study (Table 1). The IsoCor files and a GC-MS example file are available in the following INRAE dataverse, and all information will be updated indefinitely [39]. The method is publicly available and can also be run directly from GC-MS source files using a Galaxy Workflow URL available at the previously mentioned INRAE dataverse. For this purpose, each raw GC-MS dataset should contain a column “Name” for the fragments considered and a column “Area”. The name of each fragment must be written exactly as specified in the GC-MS example file from the previously mentioned INRAE dataverse. Fractional CIDs and fractional mean 13C enrichments were directly obtained from IsoCor outputs (isotopologue_fraction and mean_enrichment). For 13C-PT samples, CIDs were rescaled to Pascal’s Triangle coefficients by multiplying with 2n, where n is the number of carbon atoms [36].

2.3. Calculations of 13C-Positional Enrichments

13C-positional enrichments were calculated by combining mean 13C enrichments of several mass fragments that shared part of the carbon backbone from the same TMS derivative. A workflow has been created to calculate these 13C-positional enrichments directly from the outputs of our 13C-processing method with a URL and explanations available at the dedicated INRAE dataverse [39]. Briefly, by considering a metabolite X with 3 carbons, the mean 13C enrichment (M13C) of the mass fragment containing the C1-C2-C3 carbons (M13C(X)C1C2C3) can be written as a function of positional mean 13C enrichments (using fractional values here):
M 13 C ( X ) C 1 C 2 C 3 = M 13 C ( X ) C 1 + M 13 C ( X ) C 2 + M 13 C ( X ) C 3 3
Considering another fragment containing the C2-C3 carbons, the mean 13C enrichment (M13C(X)C2-C3) is calculated by:
M 13 C ( X ) C 2 C 3 = M 13 C ( X ) C 2 + M 13 C ( X ) C 3 2
Then, the mean 13C enrichment for the C1 carbon (M13C(X)C1) can be calculated by:
M13C(X)C1 = (3 × M13C(X)C1C2C3) − (2 × M13C(X)C2C3)
Following the same rationale, we calculated some 13C-positional enrichments based on the mass fragments detailed in Table 1. For alanine_2TMS, we used the following equations by combining the C2C3 fragment at either m/z 116 or 190 with C1 and C1C2 fragments:
M 13 C ( Alanine ) C 1 C 2 C 3 = M 13 C ( A l a n i n e ) C 1 + M 13 C ( A l a n i n e ) C 2 C 3 2 M 13 C ( Alanine ) C 2 = ( 2 × M 13 C ( Alanine ) C 1 C 2 ) M 13 C ( Alanine ) C 1 M 13 C ( Alanine ) C 3 = ( 2 × M 13 C ( Alanine ) C 2 C 3 ) M 13 C ( Alanine ) C 2
For glutamate_3TMS, we used the following equation by combining the C2C3C4C5 fragment at either m/z 156 or 246 with the C1C2C3C4C5 fragment:
M13C(Glutamate)C1 = (5 × M13C(Glutamate)C1C2C3C4C5) − (4 × M13C(Glutamate)C2C3C4C5)
For glycine_3TMS, we used the following equation by combining the C2 fragment at either m/z 174, 100 or 86 with the C1C2 fragment:
M13C(Glycine)C1 = (2 × M13C(Glycine)C1C2) − M13C(Glycine)C2
For proline_2TMS, we used the following equation by combining the C2C3C4C5 fragment at either m/z 142 or 216 with the C1C2C3C4C5 fragment:
M13C(Proline)C1 = (5 × M13C(Proline)C1C2C3C4C5) − (4 × M13C(Proline)C2C3C4C5)
For serine_3TMS, we used the following equations by combining the C1C2 and C2C3 (m/z 204) fragments with either the C2 fragment (Method A; Equation (8)) or the C1C2C3 fragment (Method B; Equation (9)):
M13C(Serine)C1 = (2 × M13C(Serine)C1C2) − M13C(Serine)C2
M13C(Serine)C3 = (2 × M13C(Serine)C2C3) − M13C(Serine)C2
M13C(Serine)C1C2C3 = M13C(Serine)C1 + M13C(Serine)C2 + M13C(Serine)C3
M13C(Serine)C1 = (3 × M13C(Serine)C1C2C3) − (2 × M13C(Serine)C1C2)
M13C(Serine)C3 = (3 × M13C(Serine)C1C2C3) − (2 × M13C(Serine)C2C3)
M13C(Serine)C1 = (3 × M13C(Serine)C1C2C3) − (M13C(Serine)C1 + M13C(Serine)C1C2)
For malate_3TMS, we used the following equations by combining the C1C2C3C4 fragment at either m/z 335 or 245 with the C2, C2C3 and C2C3C4 fragments:
M13C(Malate)C1 = (4 × M13C(Malate)C1C2C3C4) − (3 × M13C(Malate)C2C3C4)
M13C(Malate)C4 = (3 × M13C(Malate)C2C3C4) − (2 × M13C(Malate)C2C3)
M13C(Malate)C3 = (3 × M13C(Malate)C2C3C4) − (M13C(Malate)C2 + M13C(Malate)C4)
M13C(Malate)C3 = (4 × M13C(Malate)C1C2C3C4) − (M13C(Malate)C1 + M13C(Malate)C2 + M13C(Malate)C4)
The C3 13C-positional enrichment of malate_3TMS was also calculated by combining the C2, C4 and C2C3C4 fragments:
M13C(Malate)C3C4 = (3 × M13C(Malate)C2C3C4) − (M13C(Malate)C2)
M13C(Malate)C3 = (2 × M13C(Malate)C3C4) − (M13C(Malate)C4)

2.4. Data Management, Visualization and Statistical Analysis

Raw data were retreated and visualized using custom R scripts based on the packages tidyr, dplyr and ggplot2 [40,41,42]. For 13C-PT standards, the normal distribution of data was assumed based on the observed normal distribution for measurement errors (CID accuracy) [26,35]. Thus, comparison of measured/calculated values with theorical (expected) values was based on the 95% confidence intervals calculated with a Student’s t-test table: (mean − 1.96 * (SD/√(number of samples); mean + 1.96 * (SD/√(number of samples)). For plant 13C-labeled experiments, the data did not follow a normal distribution based on a Shapiro–Wilk test for each group of mean values (1 metabolite/1 fragment/1 time point/1 condition). Thus, statistical comparisons of two groups of mean values was achieved with a Wilcoxon–Mann–Whitney test (p-value < 0.05, two sided) using built-in functions from Rstudio v2022.07.2 build 576 [43].

3. Results

A recent study previously reported the use of some fragments for a 13C-positional GC-MS approach without a reliable evaluation of measurement accuracy [29]. Here, we evaluated this accuracy for both compounds (malate and glutamate) but also for some key metabolites of plant central metabolism (glycine, serine, proline and α-alanine). These last metabolites had promising fragmentation patterns for 13C-positional approaches (Table 1). Besides this, glycine and serine could also be used to follow the metabolic pathways involved in serine biosynthesis (glycolysis versus photorespiration), while α-alanine could be used as a proxy for pyruvate (same carbon backbone). Finally, proline could also be used as a proxy to evaluate PEPc contribution to glutamate biosynthesis.

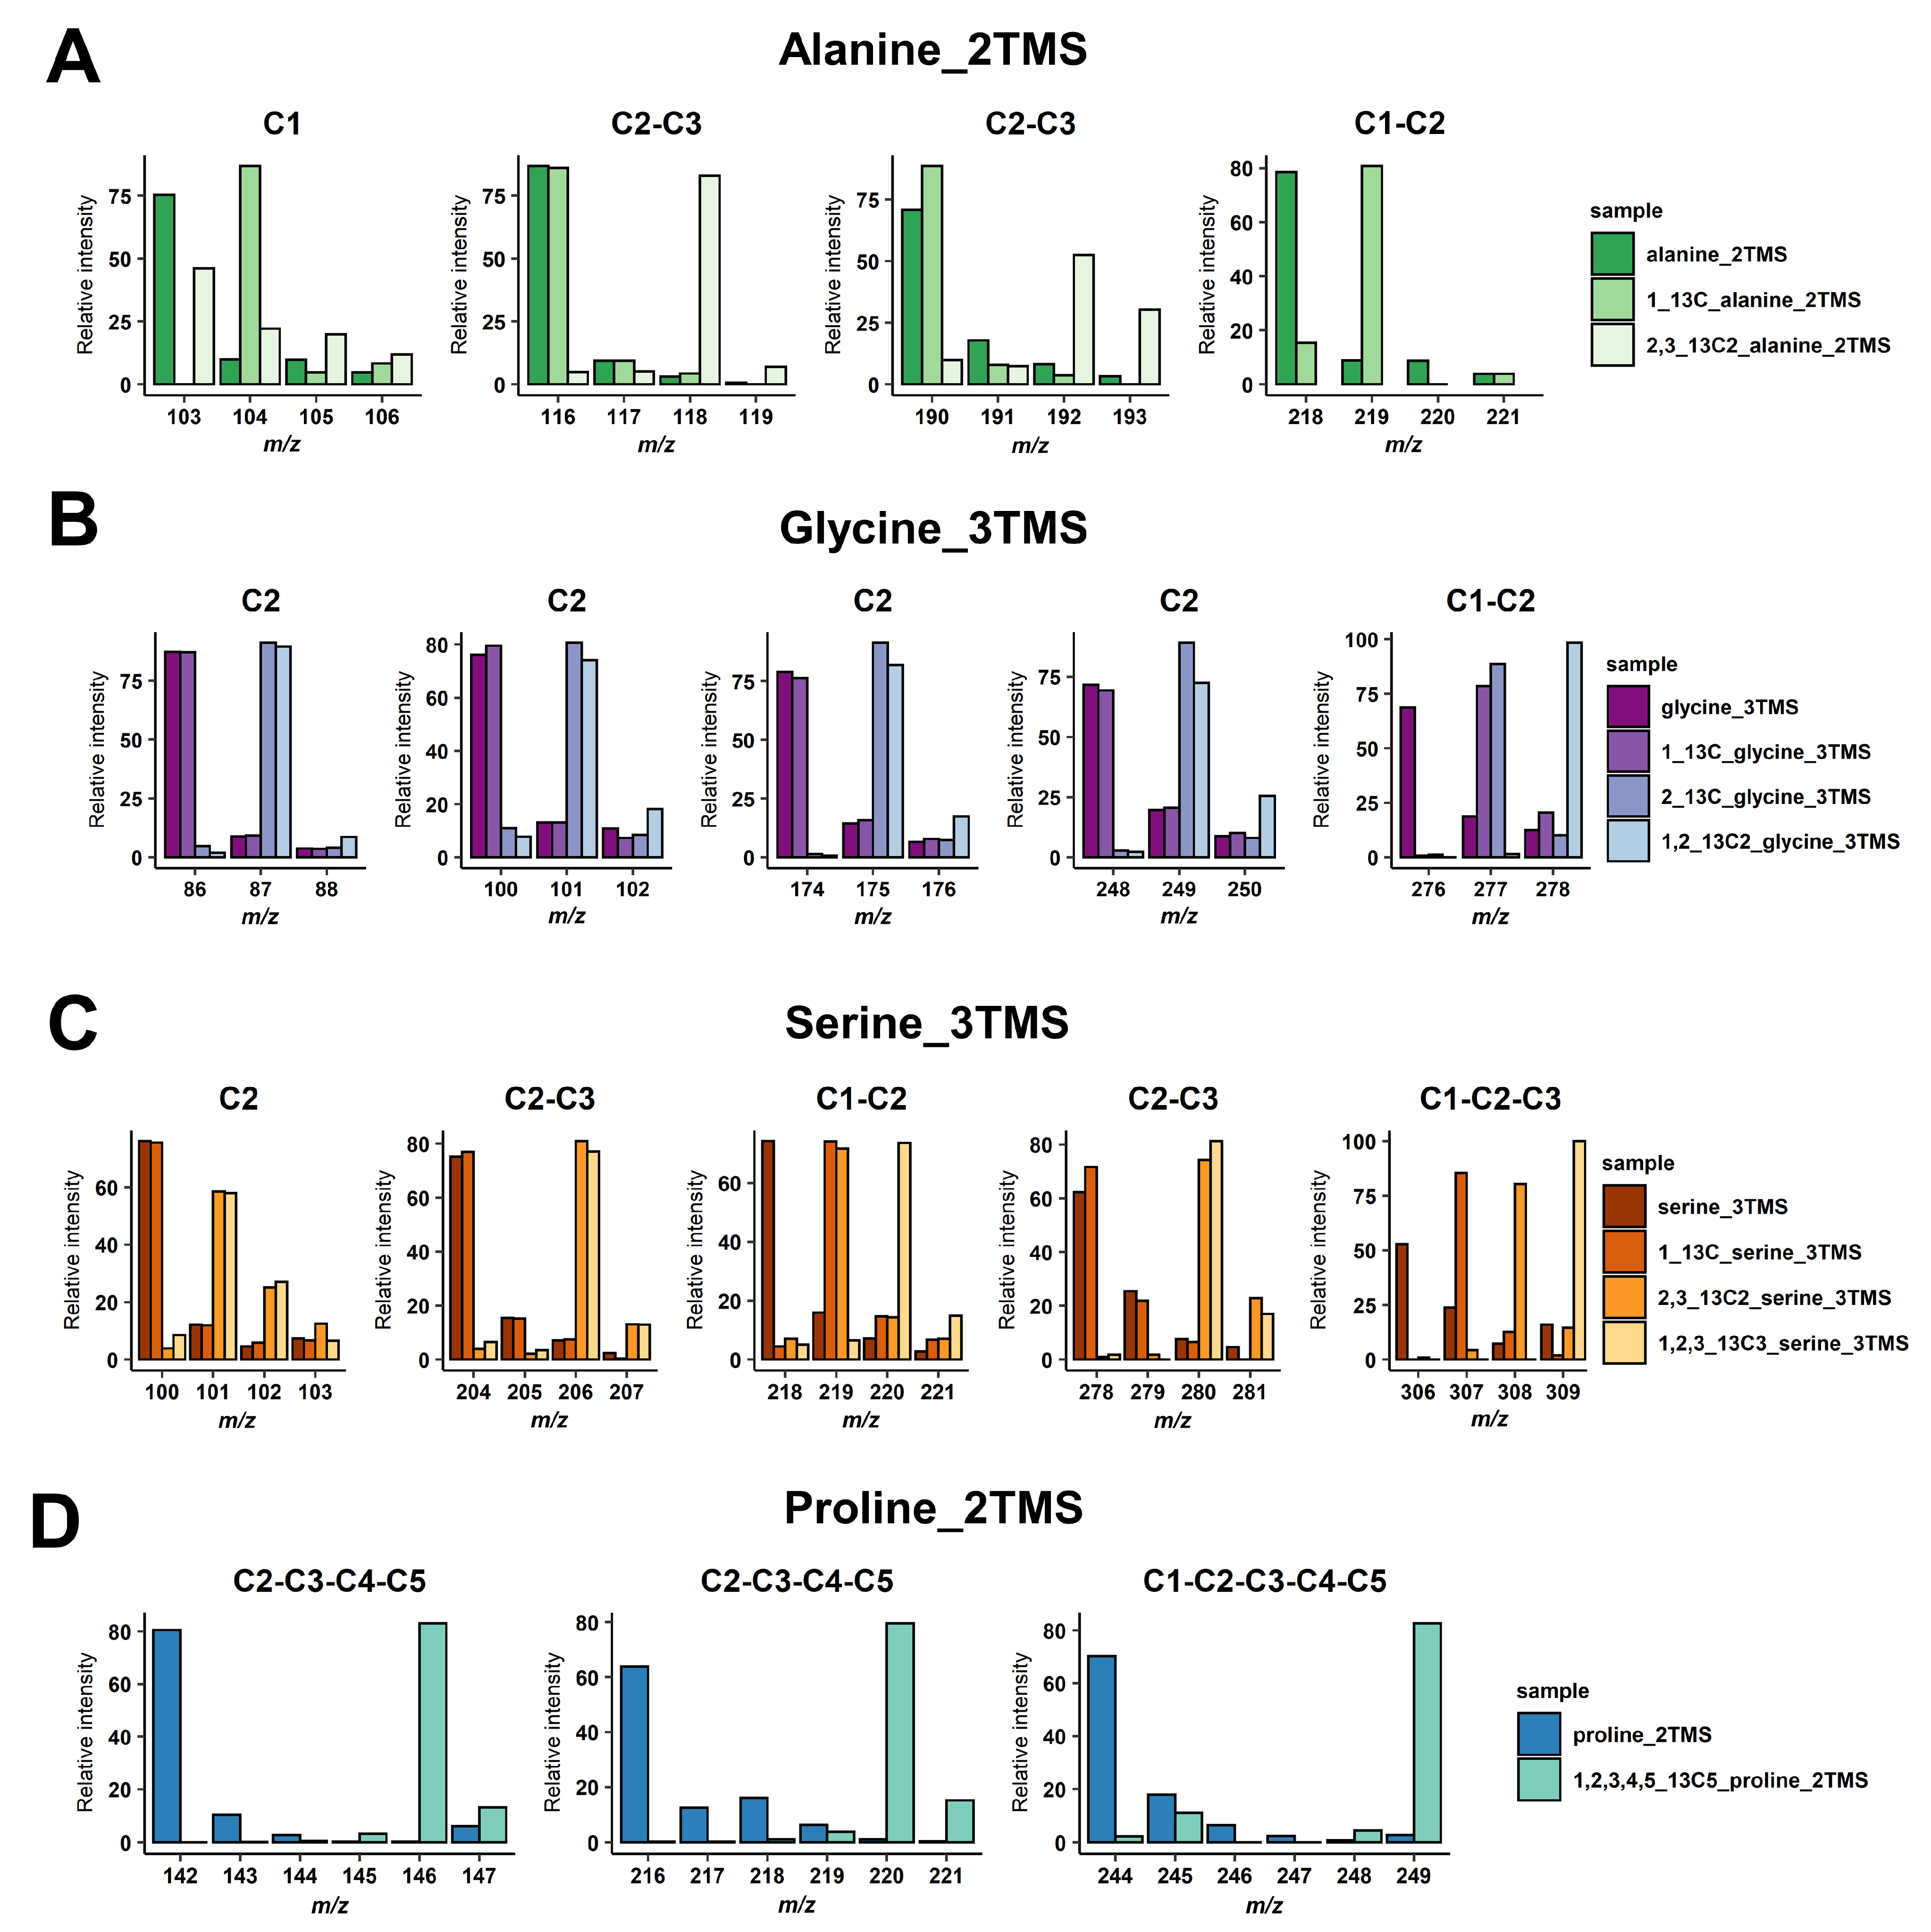
3.1. Selection of Mass Fragments

For malate and glutamate, we took advantage of previously identified fragments for malate_3TMS and glutamate_3TMS derivatives [29,31], summarized in Table 1. These fragments allowed for the calculation of all 13C-positional enrichments for malate and C1 13C-enrichment for glutamate (reflecting potentially PEPc contribution). For others, we performed injections of 13C-reference substances or analyzed GC-MS spectra of the Golm Metabolome Database corresponding to the injection of either 13C-reference substances or 13C analytes produced with a controlled 13C pattern [37,38]. The molecular losses and chemical formulas of mass fragments were then determined according to common rules of mass fragmentations for amino acids [32] (Table 1). Overall, the identity of the carbons contained in each mass fragment was confirmed by mass shifts with 13C-labeled molecules (Figure 1). For alanine_2TMS, we obtained mass fragments containing C1, C2-C3 and C1-C2 carbons allowing us to perform multiple calculations to get access to 13C enrichments at C2 and C3 positions (Figure 1A). For glycine_3TMS, there were several mass fragments containing the C2 carbon, thus allowing us to select the most accurate fragments for calculations of 13C enrichment at C1 position (Figure 1B). For serine_3TMS, we obtained fragments containing C2, C1-C2, C2-C3 and C1-C2-C3 carbons, thus allowing us to calculate 13C enrichments at C1 and C3 positions with two possible combinations of mass fragments (based on C2 or on C1-C2-C3 fragments) (Figure 1C). Finally, there were three mass fragments for proline (two C2-C3-C4-C5 and one C1-C2-C3-C4-C5) for calculating 13C enrichment at the C1 position and identifying a potential PEPc contribution.

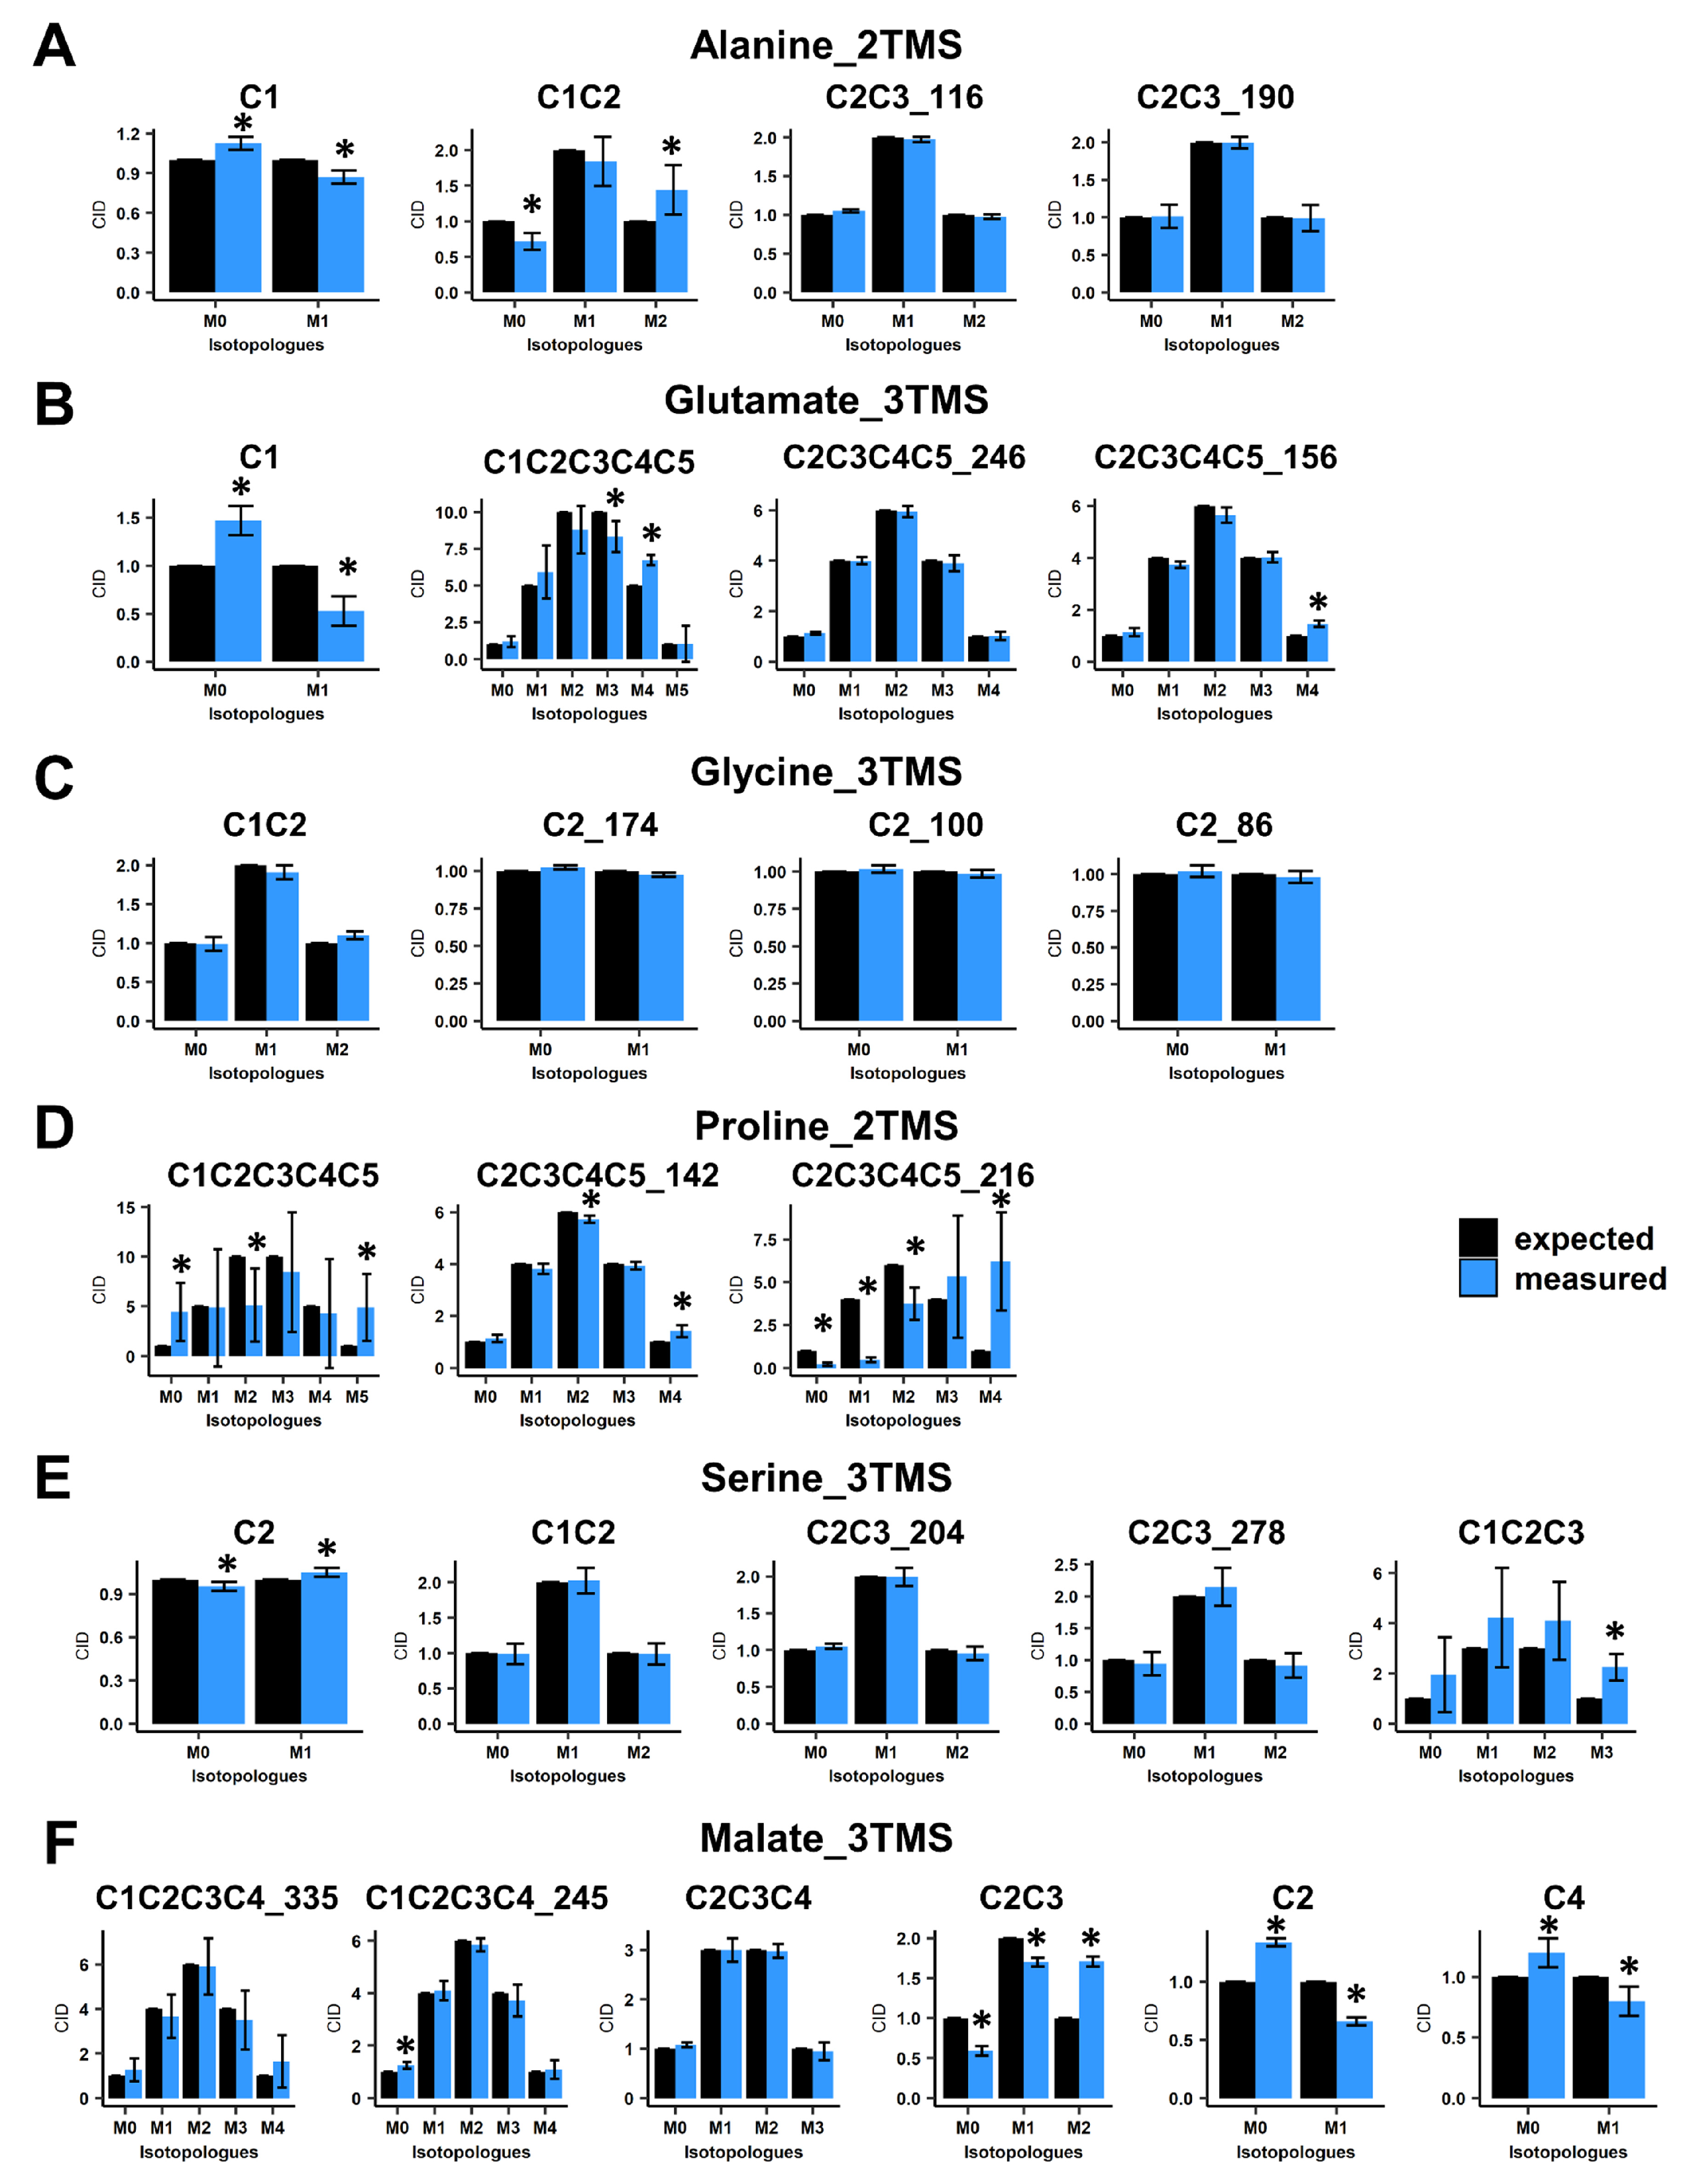
3.2. Validation of GC/MS Based 13C-Positional Approaches

Next, we evaluated the accuracy of CID measurements associated with the selected mass fragments by using 13C-PT standards. These standards harbored a binomial distribution for their carbon isotopologues for each fragment of each TMS derivative. For alanine_2TMS, both C2-C3 fragments showed a good accuracy, while C1 and C1-C2 fragments had some minor biases of measurements (Figure 2A). However, their statistical evaluation questioned the possibility of performing 13C-positional enrichment calculations for alanine. Regarding glutamate_3TMS, only the C2-C3-C4-C5_246 fragment (with M0 at m/z 246) had a good accuracy, while other fragments showed also minor biases of measurements with significant statistical differences (Figure 2B). Interestingly, all fragments for glycine_3TMS and serine_3TMS showed very good accuracies, except for the C1-C2-C3 fragment of serine_3TMS (Figure 2C,E). Nevertheless, it was still possible to calculate 13C enrichments at C1 and C3 positions by combining C2, C1-C2 and C2-C3 fragments. Mass fragments of proline_2TMS had the highest biases of measurements, except for the C2-C3-C4-C5_142 fragment (M0 at m/z 142) (Figure 2D). Finally, C2, C2-C3 and C4 mass fragments of malate_3TMS showed important biases of measurements compared to other fragments (Figure 2F). These results seriously questioned the 13C-positional enrichment calculations previously reported for C3 and C4 positions [29,34].
Then, we evaluated the accuracy of 13C-positional enrichment calculations (equations described in the material and methods). Indeed, 13C-PT standards had equal proportions of each possible isotopologue and each possible 13C-isotopomer leading to a positional mean 13C enrichment of 50% for each carbon of each metabolite [36]. For alanine_2TMS, we calculated 13C-enrichments for C1, C2 and C3 positions but also for the C1-C2-C3 molecule based on the C2-C3 fragment with M0 at either m/z 116 or 190 (Figure 3A). Overall, we showed that 13C-positional enrichment calculations for C2 and C3 positions were prone to large and statistically significant errors (calculated values around 0.75 and 0.20, respectively, compared to the expected value of 0.5). This result confirmed that the combination of small errors of measurements for C1 and C1-C2 fragments of alanine_2TMS resulted in larger errors after calculations. Thus, it is crucial to evaluate the measurement accuracy of mass fragments prior to application of 13C-positional GC-MS approaches to biological investigations. Besides this, the calculated fragment C1-C2-C3 for alanine_2TMS had a very good accuracy. For glutamate_3TMS, we only calculated 13C-enrichments for the C1 position based on the mass fragments available. While the direct measurement of 13C-enrichment for the C1 position was highly inaccurate (M0 at m/z 117), the combination of C1-C2-C3-C4-C5 and C2-C3-C4-C5_246 fragments surprisingly provided reasonable 13C-positonal enrichment values close to the expected 0.5 (Figure 3B). Thus, a combination of several fragments can represent a good alternative when some direct ions are inaccurate for MS measurements. For glycine_3TMS and serine_3TMS, the different combinations of accurate mass fragments yielded accurate 13C-positional enrichments for all calculations considered (Figure 3C,E). Nevertheless, for serine_3TMS, the combination “A” using C1-C2, C2-C3 and C2 fragments provided 13C-positional enrichments with smaller variability compared to combination “B” using C1-C2-C3, C1-C2 and C2-C3 fragments (see the C2 position, Figure 3E). For proline_2TMS, 13C-enrichment calculations at the C1 position using C1-C2-C3-C4-C5 and C2-C3-C4-C5_142 fragments were relatively accurate (mean value close to 0.5) but were subjected to an important variability (standard deviation close to ±0.4), thus preventing any further consideration for the study (Figure 3D). Finally, for malate_3TMS, the combination of C1-C2-C3-C4 fragments (M0 at m/z 245 or 335) with the C2-C3-C4 fragment allowed for the accurate calculation of 13C enrichment at the C1 position (Figure 3F). However, the fragment at m/z 245 showed a better resolution than the fragment at m/z 335, i.e., a small standard deviation after calculations. Conversely, the inaccuracy of mean 13C-enrichment measurements for C2, C2-C3 and C4 fragments led to statistically significant biases for calculations of 13C enrichments at C3 and C4 positions. Thus, only the C1 position was accurately determined for malate_3TMS. Overall, the results validated the use of some fragments and specific combinations to calculate accurate 13C-positional enrichments for the following atomic positions: (i) C1 and C2 of glycine_3TMS, (ii) C1, C2 and C3 of serine_3TMS, and (iii) C1 of malate_3TMS and glutamate_3TMS.

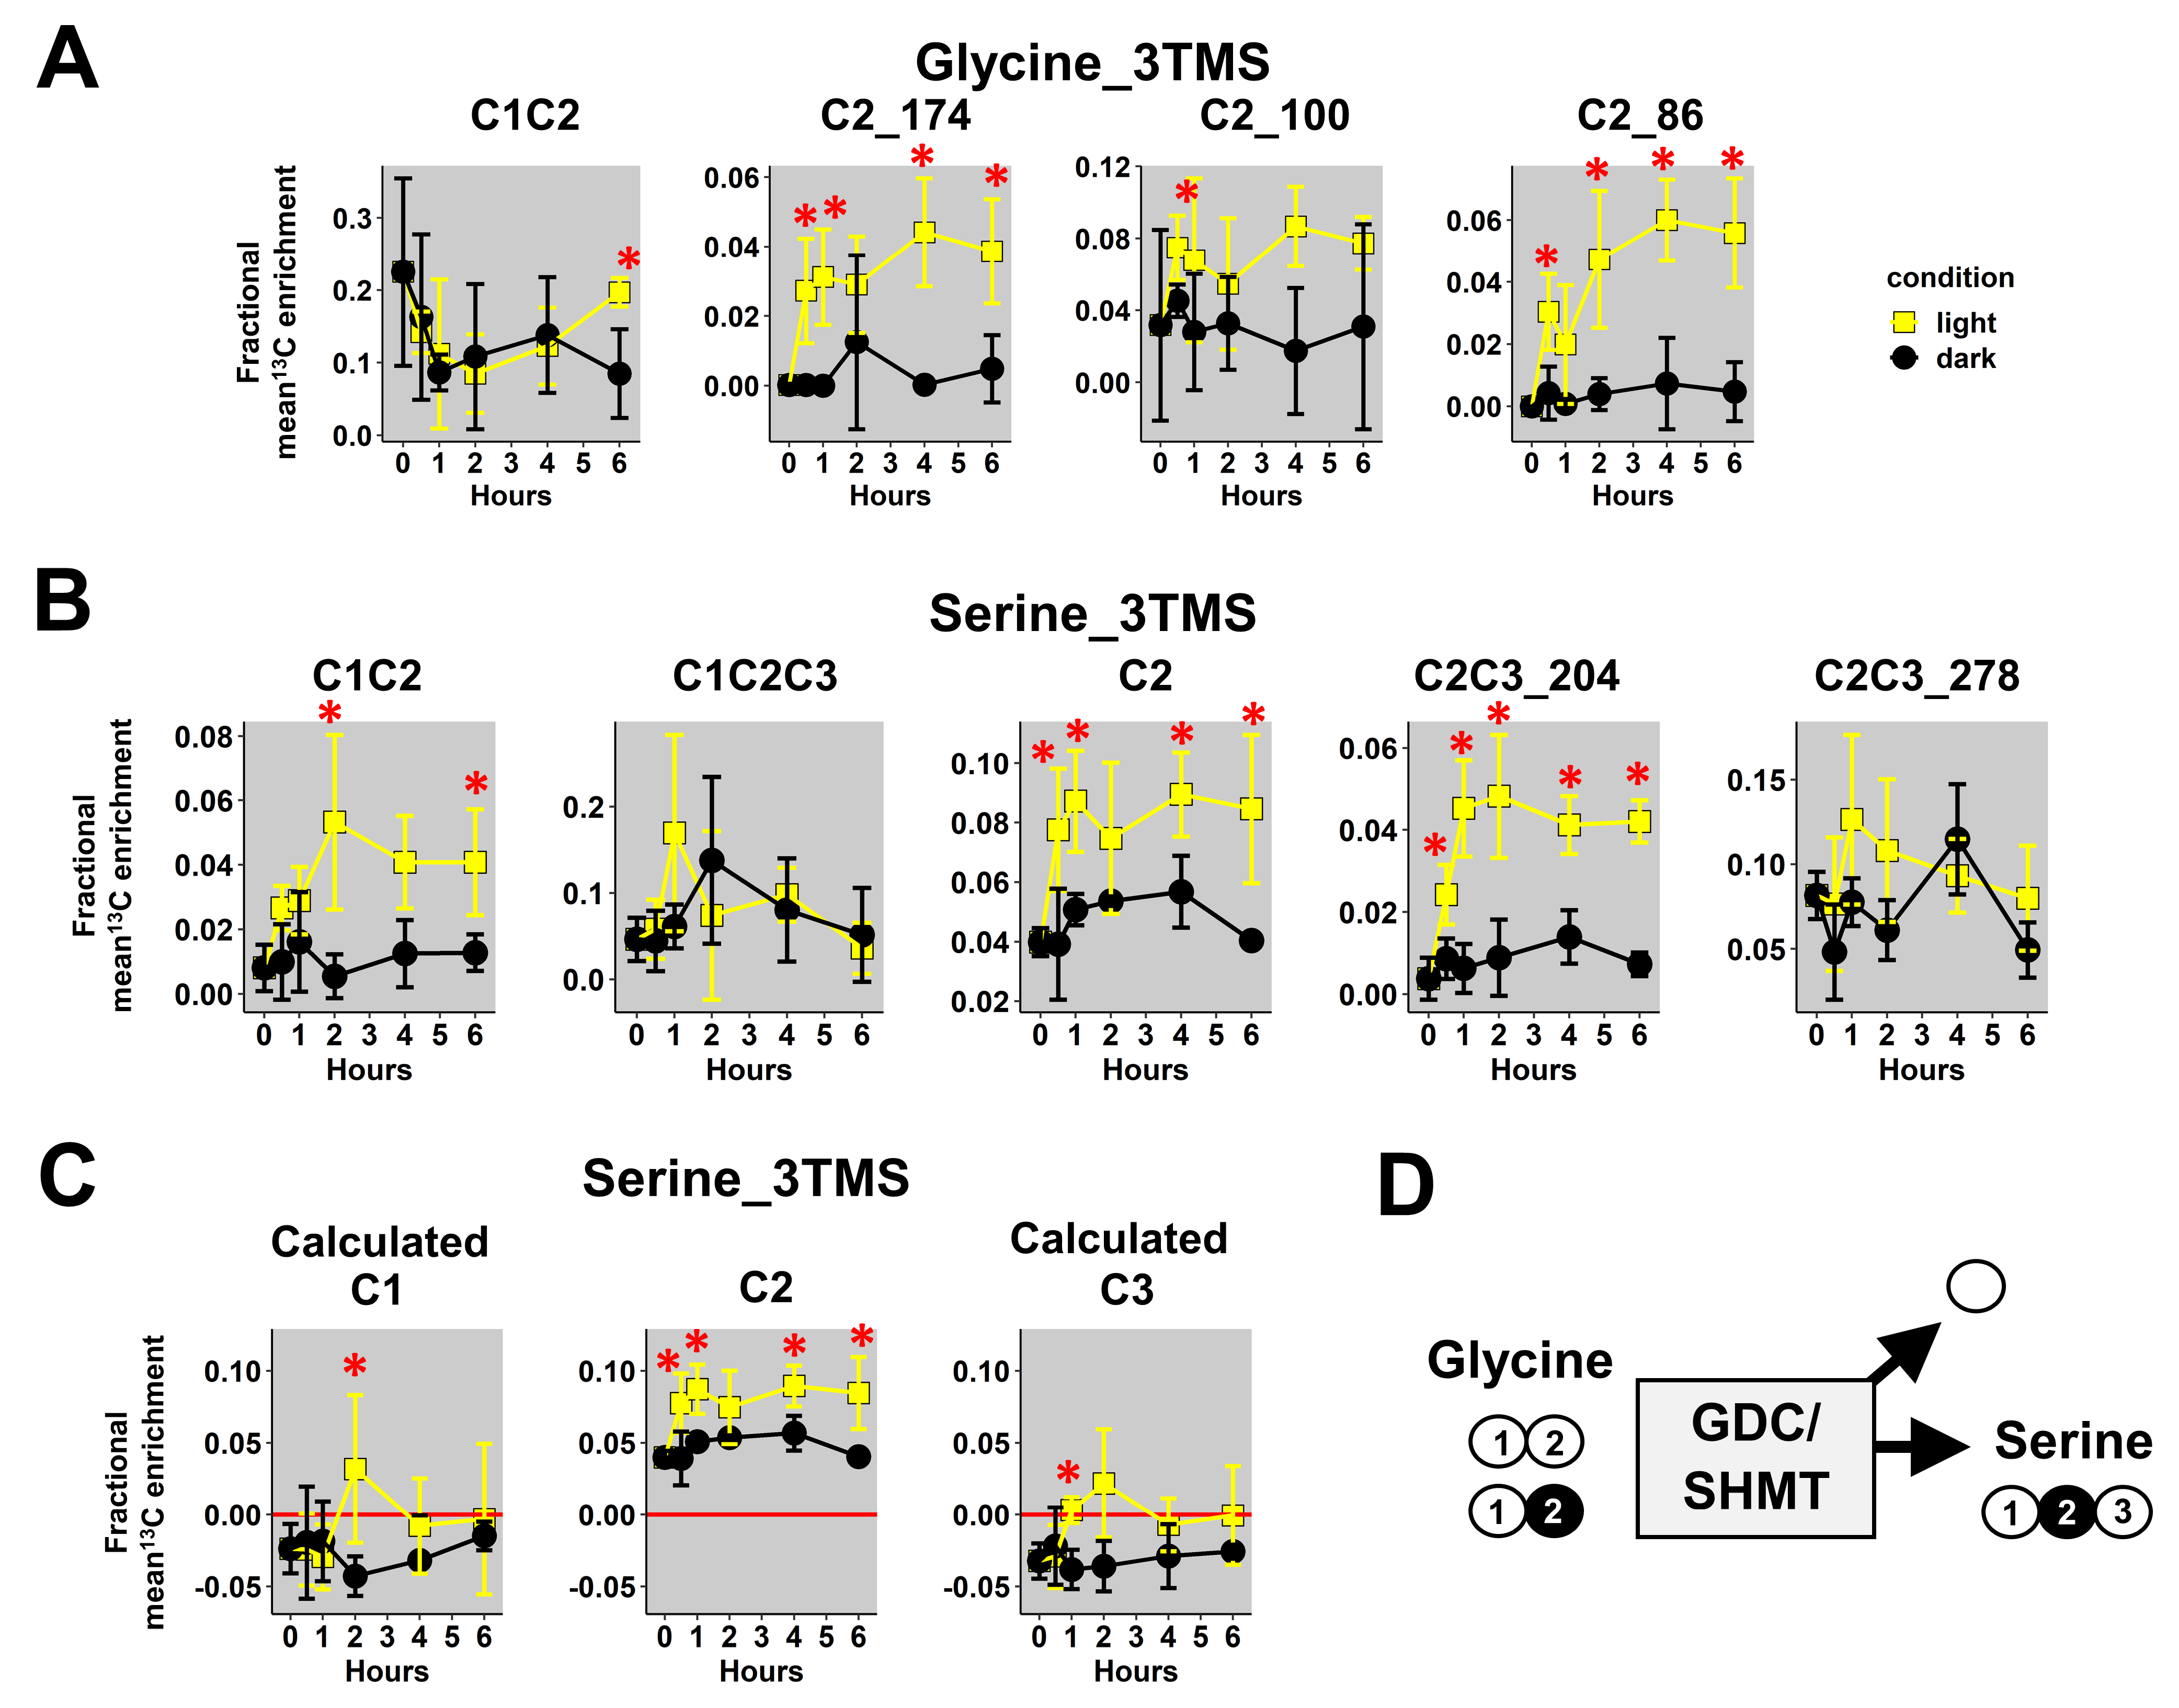
3.3. Application to Plant 13C-Labeled Experiments

Next, we used our validated 13C-positional approach to investigate key metabolic steps in plants by using incorporation kinetics of 13C-metabolic probes. For this purpose, we reanalyzed GC-MS spectra of a recent experiment, which followed the fate of U-13C-pyruvate into B. napus leaf discs during light or dark conditions [26]. Indeed, the light/dark regulation of photorespiration and PEPc activities introduced some differences of mean 13C-enrichments and isotopologues fractions into glycine, serine, malate and glutamate, but they were not investigated at the atomic position level.
First, we focused our analysis on mass fragments of glycine_3TMS and serine_3TMS. Previous results confirmed that decarboxylations from the TCA cycle were partly reassimilated by photosynthesis leading to 13C enrichments for glycine and serine under light conditions only (photorespiration).
Here, we observed a statistically significant increase of mean 13Cenrichments for the three fragments containing the C2 (M0 at m/z 174, 100 and 86) in light conditions compared to dark conditions (Figure 4A). There were no major differences for the C1-C2 fragment in both conditions, but it had a large biological variability in plant samples (mean value of 0.2 ± 0.1). Therefore, it was not possible to use a 13C-positional approach for glycine_3TMS. However, C1-C2, C2 and C2-C3_204 fragments of serine_3TMS showed statistically significant increases in 13C enrichment in light conditions compared to dark conditions with a relatively small biological variability (Figure 4B). Using the combination “A”, we calculated the 13C enrichment for C1 and C3 positions. Overall, the calculated 13C positional enrichments were below 0, and there were no major statistical differences between light and dark conditions except for the C2 position (Figure 4C). Thus, our 13C-positional approach formerly showed that serine was only labeled at the C2 position in light conditions during the experiment. Based on the properties of the glycine decarboxylase (GDC) and serine hydroxymethyl aminotransferase (SHMT), serine was produced from the combination of non-labeled glycine and 13C-2-glycine (13C at C2 position) (Figure 4D). Thus, we could also deduce that the C1 position of glycine_2TMS was not 13C labeled during the experiment.
Then, we focused our analysis on mass fragments of malate_3TMS and glutamate_3TMS. Previous analysis of the considered metabolic network showed that the C1 position of malate_3TMS and glutamate_3TMS could be 13C labeled through the activities of PEPc and TCA cycle enzymes (Figure 5A). Thus, the evaluation of 13C enrichment at the C1 position for these metabolites reflected the light-dependent regulation of both pathways [44,45]. Here, the additional mass fragments analyzed for malate_3TMS had good resolutions (small standard deviations), but there were no formal differences between light and dark conditions (Figure 5B). However, the C2-C3 fragment had a strong bias at natural 13C abundance, with a mean 13C enrichment starting at 0.36 at the “0” time point. Therefore, this fragment could not be considered for any isotopic study. Overall, the calculated 13C enrichment for the C1 position was relatively similar when using the two fragments (m/z 335 and 245) and was not significantly different between light and dark conditions (Figure 5C). Thus, the decrease of TCA cycle activity in light may have been compensated by an increase of PEPc activity leading to a similar 13C enrichment at the C1 position in both conditions. Regarding glutamate_3TMS, we also obtained good resolutions (small standard deviations) for the additional mass fragments analyzed, except for the C1 fragment, which may reflect its poor accuracy previously identified with 13C-PT standards (Figure 5D). Nevertheless, measurements at natural 13C abundance for the C2-C3-C4-C5_156 fragment was slightly biased in plant samples (around 0.06 at the “0” time point) and could explain the large bias identified after calculations (Figure 5E). Besides this, there were no statisticaldifferences between light and dark conditions for the mass fragments, although a trend could be observed in the C1-C2-C3-C4-C5 fragment (higher values in dark conditions than in light conditions) (Figure 5D). Calculations of the 13C-positional enrichment for the C1 position of glutamate_3TMS were only validated when using the C2-C3-C4-C5_246 fragment in plant samples (Figure 5E). Interestingly, this calculation successfully identified a statistically significant increase in 13C enrichment at the C1 position in dark conditions compared to light conditions after 4 h of labeling. However, this 13C-positional enrichment was not formerly modified during light conditions (along the kinetic), hence questioning the importance of PEPc and the cyclic mode of the TCA cycle in contributing to glutamate biosynthesis in the light. Therefore, this interesting result may essentially reflect a higher contribution of the cyclic mode of the TCA cycle to glutamate biosynthesis in the dark.

4. Discussion

4.1. Identification of Mass Fragment-Specific Analytical Biases and Consequences for GC/MS-Based 13C-Positional Approaches

In this study, we evaluated the accuracy of additional mass fragments for some TMS derivatives using 13C-PT standards and their use for 13C-positonal approaches. Overall, we showed that some mass fragments of proline_2TMS, glutamate_3TMS, malate_3TMS and α-alanine_2TMS had important biases for the measurement of mean 13C enrichments.
For proline_2TMS, we observed a large and significant inaccuracy for CID measurements with the C2-C3-C4-C5 fragment (M0 at m/z 216). Analysis of MS spectra confirmed the presence of a contaminant ion at m/z 218 in both standard mixtures and plant samples visible at a natural 13C abundance (Figure S1A). Interestingly, the C2-C3-C4-C5 fragment with M0 at m/z 142 was already reported as weakly inaccurate due to a contamination at m/z 146 by the co-elution of isoleucine [26,46]. Since the EI-induced fragmentation of isoleucine_2TMS also produced a massive ion at m/z 218, the contamination was due to co-elution issues. Nevertheless, the fragment at m/z 142 accurately calculated 13C enrichment at the C1 position for proline_2TMS (Figure 3B). Thus, this last fragment should be preferentially selected for 13C-labeling studies compared to the fragment at m/z 216.
Regarding the recent establishment of a GC/MS-based 13C-positional approach, we identified analytical biases for some fragments of glutamate and malate leading to large errors for calculations of 13C-positional enrichments. Notably, we showed that the C1 fragment of glutamate_2TMS largely underestimated the level of 13C-enrichment with a value of 0.25 compared to the theoretical value of 0.5 (Figure 3D). A previous analysis by high resolution mass spectrometry confirmed the presence of a contaminant mass at m/z 117 but used a linear correlation between calculated and measured 13C enrichments at the C1 position to correct for this bias [29]. However, this correction assumed a linear propagation of the bias and did not consider other possible biases for 13C-positional enrichment calculations. Here, we confirmed that both C2-C3-C4-C5 fragments (M0 at m/z 156 and 246) can be combined with the C1-C2-C3-C4-C5 fragment to calculate accurate 13C enrichments at the C1 position. However, we observed a factor of two between calculated and measured 13C-positional enrichments compared to the previous study, which found a factor of five. Thus, the bias associated to the C1 fragment at m/z 117 may not follow a linear propagation. Therefore, 13C enrichment at position C1 of glutamate_2TMS should always be calculated instead of directly measured with the fragment at m/z 117.
Besides this, we showed that the C2 (m/z 265), C2-C3 (m/z 189) and C4 (m/z 117) fragments of malate_3TMS contained significant biases for measurements of 13C enrichments leading to large errors in 13C-positional enrichment calculations at C3 and C4 positions (Figure 2F and Figure 3F). For the C2-C3 fragment of malate_3TMS, an exact mass GC-MS analysis identified a similar mass fragment at the same retention time arising from threitol_4TMS (m/z 189.07 versus m/z 189.11) [47]. Thus, a contamination by this compound in 13C-PT standards and plant samples was potentially expected. However, both reference chemical standards (12C) and plant samples had the same magnitude of inaccuracy for measurements of mean 13C enrichment and CIDs at natural 13C abundance (Figure S1). Thus, an analytical bias during the fragmentation process seems a more plausible explanation. For the C4 fragment of malate_3TMS, its chemical structure was unequivocally identified from injections of 13C standards labeled at specific positions [31]. A recent analysis by high resolution mass spectrometry revealed the presence of a contaminant mass at a weak intensity level (34% of m/z 117.0731 versus 66% of m/z 117.0366 (C4 fragment)) [29]. The authors proposed a chemical structure containing the C2 and C3 carbons based on mass fragmentation simulations and injections and a basic correction step based on the relative abundance of these two ions. However, this correction step did not consider: (i) the combination of multiple isotopic clusters starting at the same M0 for the correction of naturally occurring isotopes and (ii) possible biases arising from 13C-labeled C2 and C3 positions. In this study, we measured an important bias, i.e., a mean 13C enrichment of 0.4 compared to the expected value of 0.5. Thus, the use of the C4 fragment should only be considered for a qualitative evaluation of PEPc activity rather than an accurate measurement suitable for 13C-metabolic flux analysis.
Overall, our analysis revealed that measurements and calculations of 13C-positional enrichments for malate_3TMS were largely inaccurate except at the C1 position. Since some biases arise from mass contaminations, the use of high-resolution mass spectrometry will help to improve the accuracy of the GC/MS-based 13C-positional approach [47]. The use of TBDMS derivatives instead of TMS derivatives could also constitute an interesting alternative. A GC-tandem MS fragmentation approach was applied to TBDMS derivatives and succeeded at measuring the complete isotopomer distribution of aspartate [30]. This method relied on redundant measurements of carbon atom enrichments from different combinations of precursor and product ions followed by estimations of isotopomer distribution with least-squared regressions. Interestingly, aspartate represents a good proxy to evaluate the 13C composition of TCA cycle intermediates (oxaloacetate and malate) [30]. Since TBDMS derivatives of amino acids are more stable than TMS derivatives [26,48], this strategy seems highly promising for the field of plant science. In addition, a fragmentation map of precursor and product ions has been recently established for TBDMS derivatives of citrate and malate [31].

4.2. A GC/MS-Based 13C-Positional Approach Suitable for Investigating the Metabolic Fluxes Associated to Photorespiration, TCA Cycle and PEPc

Using 13C-PT standards, we validated a GC/MS-based 13C-positional approach for the following atomic positions: (i) C1 and C2 of glycine_3TMS, (ii) C1, C2 and C3 of serine_3TMS, and (iii) C1 of malate_3TMS and glutamate_3TMS. We showed that this approach could be successfully applied to plant 13C-labeled experiments for investigating key metabolic fluxes of plant primary metabolism. Photorespiration is a major flux involved in the recycling of by-products from RuBiSCO oxygenase activity [49,50]. Analysis of Arabidopsis mutant lines confirmed that the GDC/SHMT enzymes catalyzed the rate-limiting step of the photorespiratory flux by converting two molecules of glycine into one molecule of serine, CO2 and NH3 [51]. Since photorespiration is associated to carbon losses, crop improvement can require the accurate measurement of this metabolic flux with a 13C-labeling strategy [52]. Previous analysis showed that NMR was best suited for obtaining positional information into serine compared to LC-MS [53]. Here, we showed that GC-EI-MS can be highly accurate by combining multiple mass fragments. Since NMR analysis requires large amounts of material compared to MS analysis, this methodological improvement certainly represents a decisive advantage for 13C-metabolic flux analysis.
Regarding TCA cycle and its PEPc anaplerotic pathway, the positional approach provided additional information compared to previous results obtained only with isotopologues of malate and glutamate in B. napus. Indeed, a 13C-metabolic flux analysis with pathway-specific isotopologues showed that PEPc-dependent reassimilation of TCA cycle-derived CO2 had a small contribution to citrate biosynthesis in the light compared to TCA cycle [26]. These specific isotopologues included M1, M2 and M3 from glutamate_2TMS_C2C5 and malate_2TMS_C2C4 fragments and suggested the occurrence of a cyclic mode of the TCA cycle in the light. Here, we did not identify an increase of 13C enrichment at the C1 position for glutamate in the light conditions. Thus, the isotopologues produced by the TCA cycle in the light should not contain this labeling pattern (Figure 5A). However, such a scenario is practically impossible because (i) PEPc activity fixes 13C labeling at the C4 position of malate first, prior to a reversible fumarase step producing the same 13C-labeling at the C1 position of malate; and (ii) the contribution of PEPc to citrate biosynthesis has been formerly identified in the same experiment. Besides this, a recent analysis of U-13C-pyruvate incorporation in Arabidopsis leaves in the light provided contrasted results for 13C enrichment at the C1 position of glutamate [29]. The authors identified an increase in 13C enrichment for this C1 position and for the fragment m/z 246 containing the C2-C3-C4-C5 positions. However, these authors used the m/z 117 of glutamate_3TMS for the C1 positional analysis, i.e., a fragment that is prone to large biases (Figure 2B and Figure 3B). Therefore, the lack of 13C enrichment at the C1 position of glutamate in our experiment (light conditions) could be due to a weak accuracy at small 13C enrichments. Indeed, we observed significant differences for 13C enrichment at the C1 position of glutamate_2TMS between light and dark conditions that had an obvious biological explanation. The TCA cycle has a higher turnover in dark conditions compared to light conditions [45], and a second turn of the TCA cycle can produce 13C labeling at the C1 position of glutamate [26]. Thus, this positional approach seems to be well suited for investigating metabolic fluxes but only to compare light and dark conditions. Besides this, our analysis of 13C enrichment at the C1 position of malate did not reveal differences between light and dark conditions in B. napus leaves (Figure 5B,C). Since PEPc activity is inhibited in the dark compared to light conditions, our results suggested that the decrease in PEPc activity in the dark was perhaps compensated by higher TCA cycle activity. In this situation, a similar 13C enrichment at the C1 position of malate was expected for both light and dark conditions.

5. Conclusions

The accuracy of GC/MS-based 13C-positional approaches must be evaluated prior to further deployment for scientific investigations. For this purpose, tailor-made 13C-PT standards are a valuable resource for evaluating biases in CID measurements and in 13C-positional enrichment calculations. Overall, we showed that some mass fragments of proline_2TMS, glutamate_3TMS, malate_3TMS and α-alanine_2TMS had important biases for measurements of mean 13C enrichments. These biases were further transmitted to 13C-positional enrichments during calculations leading to larger biases. Nevertheless, we validated a GC/MS-based 13C-positional approach for the following atomic positions: (i) C1 and C2 of glycine_3TMS, (ii) C1, C2 and C3 of serine_3TMS, and (iii) C1 of malate_3TMS and glutamate_3TMS. We successfully applied this approach to plant 13C-labeling experiments and obtained complementary information regarding the light/dark regulation of the photorespiratory production of serine and the biosynthesis of malate and glutamate through the TCA cycle and PEPc activities.

Supplementary Materials

The following supporting information can be downloaded at: https://www.mdpi.com/article/10.3390/metabo13040466/s1. Figure S1, Analytical biases identified for the C2C3C4C5_216 fragment of proline_2TMS and the C2C3_189 fragment of malate_3TMS; Table S1, Complete dataset for 13C-PT standards; Table S2, Complete dataset for U-13C-pyruvate incorporation experiments.

Author Contributions

Conceptualization, Y.D. and A.B.; methodology, Y.D.; software, Y.D. and O.F.; validation, Y.D.; formal analysis, Y.D.; investigation, Y.D.; resources, Y.D. and O.F.; data curation, Y.D.; writing—original draft preparation, Y.D.; writing—review and editing, Y.D. and A.B.; visualization, Y.D.; supervision, Y.D.; project administration, Y.D.; funding acquisition, Y.D. and A.B. All authors have read and agreed to the published version of the manuscript.

Funding

This research was supported by the IB2021_TRICYCLE project funded by the INRAE BAP division and by the METABOHUB project funded by the program Investments for the Future of the French National Agency for Research (ANR grant number 11-INBS-0010).

Institutional Review Board Statement

Not applicable.

Informed Consent Statement

Not applicable.

Data Availability Statement

The data presented in this study are available in article and Supplementary Material.

Acknowledgments

P2M2 (Metabolic Profiling & Metabolomics Platform, Le Rheu, France, www6.inrae.fr/p2m2/, accessed on 1 February 2023) and its staff members are gratefully acknowledged for access to mass spectrometry facilities. We also thank Floriant Bellvert for interesting discussions that contributed to the development of this study.

Conflicts of Interest

The authors declare no conflict of interest.

References

  1. Fernie, A.R.; Bachem, C.W.B.; Helariutta, Y.; Neuhaus, H.E.; Prat, S.; Ruan, Y.L.; Stitt, M.; Sweetlove, L.J.; Tegeder, M.; Wahl, V.; et al. Synchronization of developmental, molecular and metabolic aspects of source-sink interactions. Nat. Plants 2020, 6, 55–66. [Google Scholar] [CrossRef]
  2. Dellero, Y. Manipulating Amino Acid Metabolism to Improve Crop Nitrogen Use Efficiency for a Sustainable Agriculture. Front. Plant Sci. 2020, 11, 602548. [Google Scholar] [CrossRef] [PubMed]
  3. Masclaux-Daubresse, C.; Chen, Q.; Havé, M. Regulation of nutrient recycling via autophagy. Curr. Opin. Plant Biol. 2017, 39, 8–17. [Google Scholar] [CrossRef]
  4. Clark, T.J.; Guo, L.; Morgan, J.; Schwender, J. Modeling Plant Metabolism: From Network Reconstruction to Mechanistic Models. Annu. Rev. Plant Biol. 2020, 71, 303–326. [Google Scholar] [CrossRef] [PubMed] [Green Version]
  5. Have, M.; Marmagne, A.; Chardon, F.; Masclaux-Daubresse, C. Nitrogen remobilization during leaf senescence: Lessons from arabidopsis to crops. J. Exp. Bot. 2017, 68, 2513–2529. [Google Scholar]
  6. Nelson, C.; Alexova, R.; Jacoby, R.P.; Millar, A.H. Proteins with High Turnover Rate in Barley Leaves Estimated by Proteome Analysis Combined with in Planta Isotope Labeling. Plant Physiol. 2014, 166, 91–108. [Google Scholar] [CrossRef] [PubMed] [Green Version]
  7. Abadie, C.; Bathellier, C.; Tcherkez, G. Carbon allocation to major metabolites in illuminated leaves is not just proportional to photosynthesis when gaseous conditions (CO2and O2) vary. New Phytol. 2018, 218, 94–106. [Google Scholar] [CrossRef] [Green Version]
  8. Dellero, Y.; Jossier, M.; Glab, N.; Oury, C.; Tcherkez, G.; Hodges, M. Decreased glycolate oxidase activity leads to altered carbon allocation and leaf senescence after a transfer from high CO2 to ambient air in Arabidopsis thaliana. J. Exp. Bot. 2016, 67, 3149–3163. [Google Scholar] [CrossRef] [Green Version]
  9. Daloso, D.M.; Müller, K.; Obata, T.; Florian, A.; Tohge, T.; Bottcher, A.; Riondet, C.; Bariat, L.; Carrari, F.; Nunes-Nesi, A.; et al. Thioredoxin, a master regulator of the tricarboxylic acid cycle in plant mitochondria. Proc. Natl. Acad. Sci. USA 2015, 112, E1392–E1400. [Google Scholar] [CrossRef] [Green Version]
  10. Dellero, Y.; Heuillet, M.; Marnet, N.; Bellvert, F.; Millard, P.; Bouchereau, A. Sink/Source Balance of Leaves Influences Amino Acid Pools and Their Associated Metabolic Fluxes in Winter Oilseed Rape (Brassica napus L.). Metabolites 2020, 10, 150. [Google Scholar] [CrossRef]
  11. Chu, K.L.; Koley, S.; Jenkins, L.M.; Bailey, S.R.; Kambhampati, S.; Foley, K.; Arp, J.J.; Morley, S.A.; Czymmek, K.J.; Bates, P.D.; et al. Metabolic flux analysis of the non-transitory starch tradeoff for lipid production in mature tobacco leaves. Metab. Eng. 2021, 69, 231–248. [Google Scholar] [CrossRef] [PubMed]
  12. Daloso, D.M.; Antunes, W.C.; Pinheiro, D.P.; Waquim, J.P.; Araújo, W.L.; Loureiro, M.E.; Fernie, A.R.; Williams, T.C.R. Tobacco guard cells fix CO2by both Rubisco and PEPcase while sucrose acts as a substrate during light-induced stomatal opening. Plant Cell Environ. 2015, 38, 2353–2371. [Google Scholar] [CrossRef] [PubMed] [Green Version]
  13. Dethloff, F.; Orf, I.; Kopka, J. Rapid in situ 13C tracing of sucrose utilization in Arabidopsis sink and source leaves. Plant Methods 2017, 13, 87. [Google Scholar] [CrossRef] [Green Version]
  14. Dellero, Y.; Clouet, V.; Marnet, N.; Pellizzaro, A.; Dechaumet, S.; Niogret, M.-F.; Bouchereau, A. Leaf status and environmental signals jointly regulate proline metabolism in winter oilseed rape. J. Exp. Bot. 2019, 71, 2098–2111. [Google Scholar] [CrossRef]
  15. Abadie, C.; Lothier, J.; Boex-Fontvieille, E.; Carroll, A.; Tcherkez, G. Direct assessment of the metabolic origin of carbon atoms in glutamate from illuminated leaves using 13 C- NMR. New Phytol. 2017, 216, 1079–1089. [Google Scholar] [CrossRef] [Green Version]
  16. Buescher, J.M.; Antoniewicz, M.R.; Boros, L.G.; Burgess, S.C.; Brunengraber, H.; Clish, C.B.; DeBerardinis, R.J.; Feron, O.; Frezza, C.; Ghesquiere, B.; et al. A roadmap for interpreting 13 C metabolite labeling patterns from cells. Curr. Opin. Biotechnol. 2015, 34, 189–201. [Google Scholar] [CrossRef]
  17. Schulze, D.; Kohlstedt, M.; Becker, J.; Cahoreau, E.; Peyriga, L.; Makowka, A.; Hildebrandt, S.; Gutekunst, K.; Portais, J.C.; Wittmann, C. Gc/ms-based (13)c metabolic flux analysis resolves the parallel and cyclic photomixotrophic metabolism of synechocystis sp. Pcc 6803 and selected deletion mutants including the entner-doudoroff and phosphoketolase pathways. Microb. Cell Fact. 2022, 21, 69. [Google Scholar] [CrossRef] [PubMed]
  18. Masakapalli, S.K.; Le Lay, P.; Huddleston, J.E.; Pollock, N.L.; Kruger, N.J.; Ratcliffe, R.G. Subcellular Flux Analysis of Central Metabolism in a Heterotrophic Arabidopsis Cell Suspension Using Steady-State Stable Isotope Labeling. Plant Physiol. 2009, 152, 602–619. [Google Scholar] [CrossRef] [PubMed] [Green Version]
  19. Abadie, C.; Tcherkez, G. In vivo phosphoenolpyruvate carboxylase activity is controlled by CO2 and O2 mole fractions and represents a major flux at high photorespiration rates. New Phytol. 2019, 221, 1843–1852. [Google Scholar] [CrossRef]
  20. Tcherkez, G.; Mahé, A.; Gauthier, P.; Mauve, C.; Gout, E.; Bligny, R.; Cornic, G.; Hodges, M. In Folio Respiratory Fluxomics Revealed by 13C Isotopic Labeling and H/D Isotope Effects Highlight the Noncyclic Nature of the Tricarboxylic Acid “Cycle” in Illuminated Leaves. Plant Physiol. 2009, 151, 620–630. [Google Scholar] [CrossRef] [PubMed] [Green Version]
  21. Chalvin, C.; Drevensek, S.; Gilard, F.; Mauve, C.; Chollet, C.; Morin, H.; Nicol, E.; Héripré, E.; Kriegshauser, L.; Gakière, B.; et al. Sclareol and linalyl acetate are produced by glandular trichomes through the MEP pathway. Hortic. Res. 2021, 8, 1–13. [Google Scholar] [CrossRef]
  22. Ratcliffe, R.G.; Shachar-Hill, Y. Measuring multiple fluxes through plant metabolic networks. Plant J. 2006, 45, 490–511. [Google Scholar] [CrossRef] [PubMed]
  23. Rosiers, C.D.; Lloyd, S.; Comte, B.; Chatham, J. A critical perspective of the use of 13C-isotopomer analysis by GCMS and NMR as applied to cardiac metabolism. Metab. Eng. 2003, 6, 44–58. [Google Scholar] [CrossRef] [PubMed]
  24. Medeiros, D.B.; Souza, L.P.; Antunes, W.C.; Araújo, W.L.; Daloso, D.M.; Fernie, A.R. Sucrose breakdown within guard cells provides substrates for glycolysis and glutamine biosynthesis during light-induced stomatal opening. Plant J. 2018, 94, 583–594. [Google Scholar] [CrossRef] [PubMed] [Green Version]
  25. Lima, V.F.; de Souza, L.P.; Williams, T.C.R.; Fernie, A.R.; Daloso, D.M. Gas Chromatography–Mass Spectrometry-Based 13C-Labeling Studies in Plant Metabolomics. Plant Metab. Methods Protoc. 2018, 1778, 47–58. [Google Scholar] [CrossRef]
  26. Dellero, Y.; Berardocco, S.; Berges, C.; Filangi, O.; Bouchereau, A. Validation of carbon isotopologue distribution measurements by GC-MS and application to 13C-metabolic flux analysis of the tricarboxylic acid cycle in Brassica napus leaves. Front. Plant Sci. 2023, 13, 885051. [Google Scholar] [CrossRef]
  27. Allen, D.K.; Young, J.D. Carbon and Nitrogen Provisions Alter the Metabolic Flux in Developing Soybean Embryos. Plant Physiol. 2013, 161, 1458–1475. [Google Scholar] [CrossRef] [Green Version]
  28. Schwender, J.; Shachar-Hill, Y.; Ohlrogge, J.B. Mitochondrial Metabolism in Developing Embryos of Brassica napus. J. Biol. Chem. 2006, 281, 34040–34047. [Google Scholar] [CrossRef] [Green Version]
  29. Lima, V.F.; Erban, A.; Daubermann, A.G.; Freire, F.B.S.; Porto, N.P.; Candido-Sobrinho, S.A.; Medeiros, D.B.; Schwarzlander, M.; Fernie, A.R.; Dos Anjos, L.; et al. Establishment of a gc-ms-based (13) c-positional isotopomer approach suitable for investigating metabolic fluxes in plant primary metabolism. Plant J. 2021, 108, 21. [Google Scholar] [CrossRef]
  30. Choi, J.; Grossbach, M.T.; Antoniewicz, M.R. Measuring Complete Isotopomer Distribution of Aspartate Using Gas Chromatography/Tandem Mass Spectrometry. Anal. Chem. 2012, 84, 4628–4632. [Google Scholar] [CrossRef]
  31. Okahashi, N.; Kawana, S.; Iida, J.; Shimizu, H.; Matsuda, F. Fragmentation of Dicarboxylic and Tricarboxylic Acids in the Krebs Cycle Using GC-EI-MS and GC-EI-MS/MS. Mass Spectrom. 2019, 8, A0073. [Google Scholar] [CrossRef] [Green Version]
  32. Harvey, D.J.; Vouros, P. Mass Spectrometric Fragmentation of Trimethylsilyl and Related Alkylsilyl Derivatives. Mass Spectrom. Rev. 2020, 39, 105–211. [Google Scholar] [CrossRef]
  33. Lai, Z.; Fiehn, O. Mass spectral fragmentation of trimethylsilylated small molecules. Mass Spectrom. Rev. 2016, 37, 245–257. [Google Scholar] [CrossRef] [PubMed]
  34. Porto, N.P.; Bret, R.S.; Souza, P.V.; Cândido-Sobrinho, S.A.; Medeiros, D.B.; Fernie, A.R.; Daloso, D.M. Thioredoxins regulate the metabolic fluxes throughout the tricarboxylic acid cycle and associated pathways in a light-independent manner. Plant Physiol. Biochem. 2022, 193, 36–49. [Google Scholar] [CrossRef] [PubMed]
  35. Heuillet, M.; Bellvert, F.; Cahoreau, E.; Letisse, F.; Millard, P.; Portais, J.-C. Methodology for the Validation of Isotopic Analyses by Mass Spectrometry in Stable-Isotope Labeling Experiments. Anal. Chem. 2017, 90, 1852–1860. [Google Scholar] [CrossRef] [PubMed]
  36. Millard, P.; Massou, S.; Portais, J.-C.; Létisse, F. Isotopic Studies of Metabolic Systems by Mass Spectrometry: Using Pascal’s Triangle To Produce Biological Standards with Fully Controlled Labeling Patterns. Anal. Chem. 2014, 86, 10288–10295. [Google Scholar] [CrossRef] [PubMed]
  37. Méret, M.; Kopetzki, D.; Degenkolbe, T.; Kleessen, S.; Nikoloski, Z.; Tellstroem, V.; Barsch, A.; Kopka, J.; Antonietti, M.; Willmitzer, L. From systems biology to systems chemistry: Metabolomic procedures enable insight into complex chemical reaction networks in water. RSC Adv. 2014, 4, 16777–16781. [Google Scholar] [CrossRef]
  38. Hummel, J.; Strehmel, N.; Selbig, J.; Walther, D.; Kopka, J. Decision tree supported substructure prediction of metabolites from GC-MS profiles. Metabolomics 2010, 6, 322–333. [Google Scholar] [CrossRef] [Green Version]
  39. Dellero, Y.; Filangi, O. Corrective Method Dedicated to Isocor for Calculations of Positional 13c-Enrichments from GCMS Runs, V1 ed.; Recherche Data Gouv: Paris, France, 2023. [Google Scholar]
  40. Wickham, H.; François, R.; Henry, L.; Müller, K. Dplyr: A Grammar of Data Manipulation. Available online: https://dplyr.tidyverse.org/ (accessed on 20 February 2023).
  41. Wickham, H.; Girlich, M. Tidyr: Tidy Messy Data. Available online: https://github.com/tidyverse/tidyr (accessed on 20 February 2023).
  42. Wickham, H. Ggplot2: Elegant Graphics for Data Analysis; Springer: New York, NY, USA, 2016. [Google Scholar]
  43. RStudio Team. Rstudio: Integrated Development for r; RStudio, Inc.: Boston, MA, USA, 2016. [Google Scholar]
  44. Tovar-Mendez, A.; Miernyk, J.A.; Randall, D.D. Regulation of pyruvate dehydrogenase complex activity in plant cells. JBIC J. Biol. Inorg. Chem. 2003, 270, 1043–1049. [Google Scholar] [CrossRef]
  45. Tcherkez, G.; Cornic, G.; Bligny, R.; Gout, E.; Ghashghaie, J. In Vivo Respiratory Metabolism of Illuminated Leaves. Plant Physiol. 2005, 138, 1596–1606. [Google Scholar] [CrossRef] [Green Version]
  46. Antoniewicz, M.R.; Kelleher, J.K.; Stephanopoulos, G. Accurate Assessment of Amino Acid Mass Isotopomer Distributions for Metabolic Flux Analysis. Anal. Chem. 2007, 79, 7554–7559. [Google Scholar] [CrossRef] [PubMed]
  47. Abadie, C.; Lalande, J.; Tcherkez, G. Exact mass GC-MS analysis: Protocol, database, advantages and application to plant metabolic profiling. Plant Cell Environ. 2022, 45, 3171–3183. [Google Scholar] [CrossRef] [PubMed]
  48. Cukier, C.; Lea, P.J.; Canas, R.; Marmagne, A.; Limami, A.M.; Hirel, B. Labeling maize (zea mays l.) leaves with (15) nh4(+) and monitoring nitrogen incorporation into amino acids by gc/ms analysis. Curr. Protoc. Plant Biol. 2018, 3, e20073. [Google Scholar] [CrossRef] [PubMed]
  49. Szecowka, M.; Heise, R.; Tohge, T.; Nunes-Nesi, A.; Vosloh, D.; Huege, J.; Feil, R.; Lunn, J.; Nikoloski, Z.; Stitt, M.; et al. Metabolic Fluxes in an Illuminated Arabidopsis Rosette. Plant Cell 2013, 25, 694–714. [Google Scholar] [CrossRef] [PubMed] [Green Version]
  50. Fu, X.; Gregory, L.M.; Weise, S.E.; Walker, B.J. Integrated flux and pool size analysis in plant central metabolism reveals unique roles of glycine and serine during photorespiration. Nat. Plants 2022, 9, 169–178. [Google Scholar] [CrossRef] [PubMed]
  51. Timm, S.; Hagemann, M. Photorespiration—How is it regulated and regulates overall plant metabolism? J. Exp. Bot. 2020, 71, 3955–3965. [Google Scholar] [CrossRef]
  52. South, P.F.; Cavanagh, A.P.; Liu, H.W.; Ort, D.R. Synthetic glycolate metabolism pathways stimulate crop growth and productivity in the field. Science 2019, 363, eaat9077. [Google Scholar] [CrossRef] [Green Version]
  53. Abadie, C.; Tcherkez, G. 13C Isotope Labelling to Follow the Flux of Photorespiratory Intermediates. Plants 2021, 10, 427. [Google Scholar] [CrossRef]
Figure 1. Identification of carbons contained in the mass fragments. (A) Alanine_2TMS, (B) glycine_3TMS, (C) serine_3TMS, and (D) proline_2TMS. The presence of 13C atoms from the original metabolite introduced mass shifts in the fragments of the TMS derivative analyzed.
Metabolites 13 00466 g001
Figure 2. Evaluation of carbon isotopologue distribution measurements for the selected mass fragments using 13C-PT standards. (A) Alanine_2TMS, (B) glutamate_3TMS, (C) glycine_3TMS, (D) serine_3TMS, (E) proline_2TMS, and (F) malate_3TMS. Black bars, expected CID; blue bars, measured CID. Values represent the mean ± SD for four biological replicates. Statistical differences between predicted and measured CID for each isotopologue of each fragment are denoted with an asterisk (*) and were established by considering the 95% confidence intervals of the measured CID. The complete dataset is available in Table S1.
Metabolites 13 00466 g002
Figure 3. Evaluation of 13C-positional enrichment calculations for the selected mass fragments using 13C-PT standards. (A) Alanine_2TMS, (B) glutamate_3TMS, (C) glycine_3TMS, (D) serine_3TMS, (E) proline_2TMS, and (F) malate_3TMS. Black bars, expected mean 13C-enrichments; blue bars, measured mean 13C-enrichments; red bars, calculated mean 13C-enrichments. Values represent the mean ± SD for four biological replicates. Statistical differences between predicted and measured/calculated mean 13C enrichments for each isotopologue of each fragment are denoted with an asterisk (*) and were established by considering the 95% confidence intervals of the measured/calculated values. For convenience, fragments containing similar carbons were denoted by adding the m/z at M0 (see blue bars “C2_174”, “C2_100” and “C2_186” for glycine_3TMS, for example). When multiple fragments could be used to calculate the same 13C-positional enrichment, the original fragment used for calculation was denoted by adding its m/z at M0 (see red bars “C1_174”, “C1_100” and “C1_186” for glycine_3TMS, for example). The complete dataset in available in Table S1.
Metabolites 13 00466 g003
Figure 4. 13C-positional enrichment analysis of glycine and serine during U-13C-pyruvate incorporation into B. napus leaf discs in light and dark conditions. (A) Glycine_3TMS, (B) serine_3TMS, (C) calculated positions for serine_3TMS, and (D) metabolic explanation. Black points, dark conditions; yellow points, light conditions. Values represent the mean ± SD for four biological replicates. Statistical differences between light and dark conditions are denoted with red stars according to a Wilcoxon–Mann–Whitney test (*, p-value < 0.05). The complete dataset is available in Table S2.
Metabolites 13 00466 g004
Figure 5. 13C-positional enrichment analysis of malate and glutamate during U-13C-pyruvate incorporation into B. napus leaf discs in light and dark conditions. (A) Metabolic network and possible isotopologues, (B) malate_3TMS, (C) calculated positions for malate_3TMS, (D) glutamate_3TMS, and (E) calculated positions for glutamate_3TMS. Black points, dark conditions; yellow points, light conditions. Values represent the mean ± SD for four biological replicates. Statistical differences between light and dark conditions are denoted with red stars according to a Wilcoxon–Mann–Whitney test (*, p-value < 0.05). The complete dataset is available in Table S2.
Metabolites 13 00466 g005
Table 1. Detailed list of the fragments considered in this study. TMS, C3H9Si.
TMS DerivativeLossFragment
FormulaMassFormulam/zCarbon Backbone
Alanine(2TMS)CH315C8H20NO2Si22181-2
CH3, CO43C7H20NOSi21902-3
TMS-CO2117C5H14NSi1162-3
unknown130C4H11OSi1031
Glutamate(3TMS)CH315C13H30NO4Si33481-2-3-4-5
TMS-CO2117C10H24NO2Si22452-3-4-5
TMS-CO2, TMS-OH207C7H14NOSi1562-3-4-5
TMS-NH-C3H5-CO2-TMS246C4H9O2Si1171
Glycine(3TMS)CH315C10H26NO2Si32761-2
CH3, CO43C9H26NOSi32482
TMS-CO2, TMS-H191C4H10NSi1002
TMS-CO2, TMS-CH3205C3H8NSi862
Malate(3TMS)CH315C12H27O5Si33351-2-3-4
C3HO385C10H29O2Si32652
TMS-OH, CH390C9H17O4Si22451-2-3-4
TMS-CO2117C9H21O3Si22332-3-4
TMS-CO2, CH3, COH161C7H17O2Si21892-3
C9H21O3Si2233TMS-CO21174
Proline(2TMS)CH315C10H22NO2Si2441-2-3-4-5
CH3, CO43C9H22NOSi2162-3-4-5
TMS-CO2117C7H16N1422-3-4-5
Serine(3TMS)CH315C11H28NO3Si33061-2-3
CH3, CO43C10H28NO2Si32782-3
TMS-CH2O103C8H20NO2Si22181-2
TMS-CO2117C8H22NOSi22042-3
unknown221C4H10NSi1002
Disclaimer/Publisher’s Note: The statements, opinions and data contained in all publications are solely those of the individual author(s) and contributor(s) and not of MDPI and/or the editor(s). MDPI and/or the editor(s) disclaim responsibility for any injury to people or property resulting from any ideas, methods, instructions or products referred to in the content.

