Abstract
Carob (Ceratonia siliqua) is an exceptional source of significant bioactive compounds with great economic importance in the Mediterranean region, where it is widely cultivated. Carob fruit is used for the production of a variety of products and commodities such as powder, syrup, coffee, flour, cakes, and beverages. There is growing evidence of the beneficial effects of carob and the products made from it on a range of health problems. Therefore, metabolomics could be used to explore the nutrient-rich compounds of carob. Sample preparation is a crucial step in metabolomics-based analysis and has a great impact on the quality of the data obtained. Herein, sample preparation of carob syrup and powder was optimized, to enable highly efficient metabolomics-based HILIC-MS/MS analysis. Pooled powder and syrup samples were extracted under different conditions by adjusting pH, solvent type, and sample weight to solvent volume ratio (Wc/Vs). The metabolomics profiles obtained were evaluated using the established criteria of total area and number of maxima. It was observed that the Wc/Vs ratio of 1:2 resulted in the highest number of metabolites, regardless of solvent type or pH. Aqueous acetonitrile with a Wc/Vs ratio of 1:2 satisfied all established criteria for both carob syrup and powder samples. However, when the pH was adjusted, basic aqueous propanol 1:2 Wc/Vs and acidic aqueous acetonitrile 1:2 Wc/Vs provided the best results for syrup and powder, respectively. We strongly believe that the current study could support the standardization of the metabolomics sample preparation process to enable more efficient LC-MS/MS carob analysis.
1. Introduction
The carob tree has been cultivated in the Mediterranean region for centuries, making an important contribution to the society and economy of many European (e.g., Spain, Italy, Portugal, Greece, Cyprus, etc.) and Middle Eastern countries (e.g., Egypt, Tunisia, Morocco, etc.). Its popularity is mainly due to its excellent nutritional and medicinal properties, as it is considered a functional food associated with the Mediterranean diet [1]. In the last decade, the interest in the sustainability and valorization of the carob tree (fruits, pods, and leaves) has increased beyond its unique agricultural importance as a fire- and drought-resistant tree [2]. Therefore, in modern societies, where the circular economy and climate change are gaining emerging attention, the potential contribution of the carob tree to the United Nations Sustainable Development Goals (UN SDGs) is driven by the promotion of social (no poverty), health (well-being), and ecological (restoration and support of terrestrial ecosystems) balance; as a nutraceutical product, it supports UN SDGs 1–3, 5, 12, and 15 [3].
The chemical composition of the carob fruit depends on multiple factors such as cultivar, origin, climate conditions and harvesting time. Carob contains high amount of sugars (mostly sucrose, glucose, and fructose), proteins, minerals, and dietary fibers. It is also rich in polyphenols, such as tannins, flavonoids, and phenolic acids, and contains lipids and vitamins, but is a caffeine- and theobromine-free pod with low fat content [4,5].
In analytical chemistry, there is a growing body of research on the importance of sample preparation, perhaps the most intensive, multi-stepped, time-consuming, and costly stage, before chemical analysis. As reported in Table 1, analysis of carob and its products includes the use of single, hyphenated, and instrumental platforms with low or advanced detection capabilities, covering mainly the fields of chromatography (liquid and gas chromatography), spectrometry (LC-MS, GC-MS, and tandem MS/MS) with low (photodiode array (PDA), refractive index (RI)) or high resolution (HR) detectors, and spectroscopy (NMR). As detailed below, almost all parts of the carob tree have been analysed for their phytochemical constituents. The nutritional benefits of carob pods, and traditional products of Cyprus origin are presented in [6]. The small molecules, called volatile organic compounds (VOCs), are responsible for the intense flavoring power of carob pods [7] and can be correlated with carob’s ripening [8]. VOCs in association with multivariate data analysis (MDA), achieved the discrimination of carob pods based on their geographical origin [9]; the same was performed using MDA and carob’s nutritional compositional values [10].
Lately, a wide range of sample extraction techniques have been applied to achieve better extraction performance from food matrices in general, and in particular for carob matrix: maceration (ME), liquid-liquid extraction (LLE), solid-phase extraction (SPE), pulsed or continuous ultrasound-assisted extraction (UAE), microwave-assisted extraction (MAE), Soxhlet extraction, supercritical fluid extraction (SFE), QuEChERS, etc. All approaches aim to improve the selectivity and sensitivity of analytical methods, while boosting green extraction techniques with the goals of protection of the operator and the environment by minimizing solvent use [11]. For example, the phenolic content and antioxidant capacity of carob pods varied significantly with type of extraction process (UAE, MAE, Soxhlet, and SFE-CO2 were investigated) [12]. The work of Christou et al. (2021) emphasized the importance of UAE parameters of solid-solvent ratio, solvent concentration, extraction time, sonication amplitude, and sonication mode in the extraction of carob polyphenols [13]. Huma et al. (2018) focused on the MAE technique and its optimal conditions: microwave power, ethanol concentration, and solvent-to-sample ratio were tested for the extraction of total phenolic content (TPC) and condensed tannins [14]. Other researchers used the extracts of different solvents (diethyl-ether and ethyl acetate) to highlight the anti-cancer activity of carob pods [15]. Overall, a wide variation is observed in the applied extraction techniques, the employed analytical tools, as well as the agricultural characteristics of the investigated carob samples (e.g., carob variety, geographical origin, cultivation practices, maturation, altitude, micro-environment, etc.) [16]. This creates variations in the published results both on qualitative and quantitative level.
The simultaneous analysis of several endogenous compounds in a single analytical run can present challenges due to the different physicochemical properties of analytes of interest. Hydrophilic interaction liquid chromatography (HILIC), suitable for the analysis of polar or/and semi-polar metabolites, has been employed as a complementary chromatographic technique to reverse phase (RP) chromatography or ion-pair chromatography (IPC) for MS analysis. Commonly, in HILIC mode chromatography, a polar stationary phase is used (e.g., non-silica-based amino packings, underivatized silica, or modified silica), combined with high organic content (>90% v/v) mobile phases with the addition of different additives, such as HCOONH4 or CH3COONH4 [17].
The most important but tedious and difficult part of the analysis is that of sample preparation. According to a recent study by Justyna Potka-Wasylka et al. (2022), nearly 80% of the workflow time for instrumental chemical analysis is spent on sample preparation before analysis, a difficult and time-consuming step that directly affects the quality of the results even though operators occasionally underestimate this step [18]. The present work aims to determine the optimal protocol for the analysis of two carob matrices, namely syrup (liquid) and powder (solid), in order to identify the largest number of metabolites; towards this, the effects of extraction, pH adjustment, solvent, and sample weight to solvent volume ratio (Wc/Vs) were examined. To our knowledge, there is no other work on sample optimization of carob products using HILIC-MS/MS.

Table 1.
Reported analytical methods for carob and carob byproducts profiling and characterization.
Table 1.
Reported analytical methods for carob and carob byproducts profiling and characterization.
| Concept | Substrate | Method | Sample Preparation | Number and Chemical Classes of Detected Compounds | Ref. |
|---|---|---|---|---|---|
| Roasting | Carob beans from Egypt, unroasted & roasted pods | HS-SPME-GC/MS | 100 mg carob pod + IS ((Z)-3-hexenyl acetate), 30 min at 50 °C with the SPME fiber | 31 volatile compounds: short chain fatty acids, aldehydes, acids, alcohols, aldehydes/ketones, esters, furans/pyrans, sesquiterpenes, hydrocarbons | [19] |
| Different geographical origin, ripening stage and roasting process | Pods from different locations in Egypt Different ripening stages (unripe green, mid ripe to full ripe) | GC-MS and UHPLC-ESI-HR-MS/PDA | 18 mg dried fruit powder homogenization in 1.2 mL MeOH + IS (umbelliferon) + ultrasonic bath for 20 min + vortex + centrifugation + solid phase extraction (SPE), elution with MeOH + N2 evaporation to dryness + reconstitution to MeOH | 70 primary metabolites: carbohydrates (mono- and di-saccharides), phenolic acids, organic acids (and also amino acids), fatty acids, sterols, and nitrogenous compounds 83 compounds: flavonoids, fatty acids, phenolic acids, tannins, and carbohydrate derivatives | [20] |
| Bioactive properties | Carob seeds Tunisian locust bean seeds, pods | HPLC-FLD (fluorescence detector) and LC-DAD-ESI/MSn | 1.5 g dried powder extracted in 25 mL of metaphosphoric acid, and placed under magnetic stirring (150 rpm) for 20 min + filtration. Extraction in carob seeds were performed by maceration (ME) and ultrasound-assisted extraction (UAE). For both extraction methods, water and ethanol were chosen as solvents, with four different proportions used: (i) EtOH:H2O (25:75; v/v); (ii) EtOH:H2O (50:50; v/v); (iii) EtOH:H2O (75:25; v/v); and (iv) 100% H2O For ME, the dried powdered samples (1 g) were placed in a beaker with 30 mL of each of the four solvents, under magnetic stirring 150 rpm for 1 h at room temperature + filtration and the extraction procedure were repeated with an additional portion of the solvent. The obtained extracts were combined, the EtOH was removed, and the residual aqueous phase was frozen and lyophilized. The UAE was carried out in an ultrasonic device: 3 g dried powdered samples extracted with 100 mL of each of the four solvents by the ultrasonic device at 375 W for 10 min + filtration and, as for the ME, the EtOH was removed, and the residual aqueous phase was frozen and lyophilized. | Tocopherols, organic acids | [21] |
| Ripening | Carob fruits | Soluble carbohydrates: HPLC-RI Macro-minerals: ion chromatography coupled to conductivity detector (IC-ConD) Polyphenols: UHPLC-Q-Orbitrap-HRMS | Intact carob fruits were frozen at −40 °C. Lyophilization at 0 °C for 48 h. Blender lyophilization for about 24 h Cyclotech mill 0.3 g of freeze-dried carob pulp extracted with 10 mL mixture of EtOH:H2O (80:20, v/v) + vortex + sonication + centrifugation + filtration | Polyphenols, catechins, tannins | [22] |
| Flavonoid content in leaf (carob among other) | HPLC-MS | Extraction of oven-dried leaves with 70% EtOH + evaporation 0.5 g from each extract dissolved in 14 mL H2O:EtOH (20:80) | 22 flavonoids | [23] | |
| Antioxidant activities of two commercial carob flours | Commercial carob flours | NMR & HPLC | Enzymes of carob flours (1 g) were inactivated by boiling in H2O for 5 min. The slush was filtered through ten layers of gauze and the resultant liquid adjusted to pH 6.0 with NaOH, and then lyophilized. 1 g of dry mass extracted with 10 mL of boiling water for 5 min + centrifugation + filtration | Dietary fiber, total phenols, pinitol and antioxidant activity | [24] |
| Comparison of the sugar levels in wheat flour and wholemeal wheat flour plant-based high-protein ingredients, e.g., carob high-protein ingredients (HPIs) | Wheat flour and wholemeal wheat flour | HPLC-RID (refractive index detector) | Test of different extraction procedures: Six are based on aqueous extraction and three are based on ethanolic extraction. A: 2 g of samples diluted in 8 mL H2O + vortex mixed + 20 min shaking + centrifugation. Additional dilution of the supernatant with 10 mL of H2O + filtration. B: 2 g of samples diluted in 15 mL EtOH 80% + vortex + sonication + centrifugation. Two-step extraction with addition of 15 mL of EtOH 80% + vortex+ sonication. Evaporation of the pooled supernatants. reconstitution with water + filtration | Short-chain carbohydrates Ethanolic extraction was chosen | [25] |
| Phenolic content of extracts derived from Cypriot carob pods using different solvents | Whole fruit (pulp + seeds) and extracts given to cells | LC-MS | DE, EA, EtOH and H2O as solvents DE and EA were more effective | Polyphenols found in EA and DE ripe pulp and seeds carob extracts: apigenin, myricetin, rutin, naringenin, ferulic acid, kaempferol and gallic acid | [15] |
| Detection and formation of D-Amino acids in processed plant saps, syrups, and fruit juice | Saps and juices of trees (maple, palm, birch), fruits (grape, apple, pear, pomegranate, date), and various other plants (agave, beetroot, sugar cane, carob) | Enantioselective GC-MS | Samples of 1 g were diluted with 5 mL H2O and adjusted to pH 2.3 (0.01 M HCl) + SPE, elution with 4 M aqueous ammonia (5 mL) + evaporation to dryness + 0.1 M HCl (0.5 mL) + evaporation to dryness + 500 µL of acetyl chloride in 2-propanol + 1 h at 100 °C + evaporation + 500 μL DCM and 100 μL pentafluoropropionic anhydride + 20 min at 100 °C + evaporation to dryness + reconstitution with 500 μL DCM | Saccharides (glucose, fructose, or sucrose) and containing amino acids | [26] |
| Phenolic compounds in wood of Ceratonia siliqua | Wood of Ceratonia siliqua (carob) | GC-MS | Sample of 1 g extracted with MeOH:H2O + evaporation. The aqueous phase extracted with PE (2 × 25 mL), then with DE (2 × 25 mL), and finally with DE:MeOH (9:1; 2 × 25 mL). For hydrolysis, aqueous extract was mixed with 6 mL MeOH:H2O HCl (6 m; 1:1) + oven-heated at 100 °C for 8 h + extraction with DE:MeOH (9:1; 2 × 25 mL) and H2O (2 × 25 mL) + silyllation with trimethylchlorosilane and bis-(trimethylsilyl)- trifluoracetamide (1:3). | Tannin composition | [27] |
| Lipid profiling in Prosopis spp. and Ceratonia siliqua seed germ flour | Flour from seed germ of European carob (Ceratonia siliqua) | GC-FID/MALDI-TOF | Sample of 500 mg seed germ flour (SGF) extracted with 1 mL H2O + 3.75 mL Chl/MeOH (1:2, v/v) + 1.25 mL Chl + 1.25 mL H2O + vortex + centrifugation. Re-extraction of lower phase as previously. The organic layers were combined and evaporated to dryness. | Lipids profile, fatty acids, triacylglycerols and phospholipids | [28] |
Chl: Chloroform; DE: Diethyl ether; EA: ethyl acetate; EtOH: Ethanol; H2O: Water; HCl: Hydrochloric acid; MeOH: Methanol; PE: Petroleum ether.
2. Materials and Methods
2.1. Chemicals, Reagents and Equipment
LC-MS grade acetonitrile (ACN), methanol (MeOH), and 2-propanol (PropOH) were purchased from Sigma-Aldrich (St. Louis, MO, USA). Ammonium formate and formic acid (>99% LC-MS grade) were provided from Chem-Lab (Zedelgem, Belgium). Ammonia (28.0–30.0% NH3 basis) was obtained from Merck KGaA (Darmstadt, Germany). Pure water (18.2 MΩ cm−1) was purified in a Milli-Q device (Millipore Purification System, Merck Darmstadt, Germany).
Syringe Terumo 2.5 mL (Tokyo, Japan) was used, and PTFE filters 0.22 μm were obtained from Millex-Merk (Darmdtsdt, Germany). The Misonix XL Sonicator Ultrasonic Cell Processor (Farmingdale, NY, USA) equipment and the CyberScan 1000 (Eutech instruments PTE LTD, Singapore) pH meter were used. Vortex-mixing and centrifugation were performed on an IKA Ms1 Mini Shaker Laboratory Vortex (Staufen, Germany) and on a Micro Centaur Plus, MSE (London, UK) centrifuge, respectively. The samples included Cypriot carob powder (n = 4) and syrup (n = 6) commercial products purchased from a local market in Cyprus.
2.2. Sample Preparation
Pooled samples were prepared by mixing 5 g of the available carob products; four powder and six syrup, respectively. The pooled samples were vortex-mixed and divided into 40 portions of 250 mg for each matrix.
Sample weight to solvent volume ratio (Wc/Vs), extraction solvent or solvent mixture, and pH value were evaluated. For each of the 40 aliquots (syrup or powder), the addition of 1/2 Wc/Vs and 1/4 Wc/Vs of each tested solvent or solvent mixture (acetone, ACN, MeOH, PropOH, ACN:H2O, MeOH:H2O, and PropOH:H2O) was performed. Only in aqueous extracts 80:20 v/v (ACN:H2O, MeOH:H2O, and PropOH:H2O), adjustment of pH value (acidic, neutral, basic) was accessed by the addition of formic acid, ammonium formate, or ammonia, respectively. The measurement of pH value was performed for all aqueous solvent-mix extracts. Every mixture was vortex-mixed for 1 min followed by sonication for 15 min and centrifugation for 20 min at 4 °C (10,000× g). The obtained clear supernatants were filtered through PTFE 0.22 μm syringe filters and QC samples were prepared from filtrates to evaluate the system’s analytical performance. One hundred and fifty microliters were evaporated to dryness under nitrogen stream, resuspended with 150 μL of the mobile phase, and finally transferred into 2 mL autosampler glass vials equipped with 200 μL microinserts, before being subjected to targeted LC-MS/MS analysis. The illustration of the sample preparation process is presented in Figure 1.
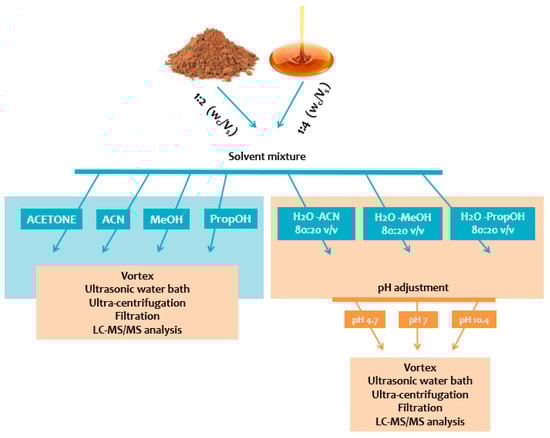
Figure 1.
Schematic illustration of sample preparation steps.
2.3. LC-MS/MS Analysis
As described in previous publications [29,30], carob extracts were analysed using a previously developed and validated targeted LC-MS/MS method performed in an ACQUITY UPLC H-Class chromatography system coupled to a Xevo TQD mass spectrometer (Waters Corporation, Milford, MA, USA), operating in both positive and negative mode [31]. The method includes 80 MRM channels for small polar metabolites. Briefly, the column was an Acquity BEH Amide (2.1 mm × 150 mm, 1.7 μm), equipped with an Acquity UPLC Van-Guard pre-column (Waters, UK). The mobile phase consisted of (a) ACN:H2O 95:5 v/v and (b) ACN:H2O 30:70 v/v, both containing 10 mM ammonium formate.
MS parameters were set as followed: capillary voltage: ±3500 V, desolvation temperature: 350 °C, desolvation flow: 650 L/h, and cone gas flow: 50 L/h. Cone voltage and collision energy were optimized for each analyte.
A Quality Control (QC) sample was used throughout the analytical batches. QC samples were prepared by mixing equal volumes of all tested samples, for the respective analysis, either syrup or powder.. QC samples were analyzed 5 times at the beginning of the analytical batch, for system equilibration. Also, a standard mixture containing all analytes of interest was injected in the beginning of the analytical run. Indicative chromatograms of a real samples (syrup and powder products) were illustrated in Figure S1 (supplementary information).
Regarding method validation, linearity of the method was determined using different calibration standards per analyte, ranging between 0.01–2 mg/L up to 5–95 mg/L, depending on the analyte. Intra-day precision ranged between 0.5–7% for syrup samples and between 0.4–4% for carob powder samples.
2.4. Data Handling–Statistics
LC-MS/MS data were collected and processed using MassLynx® (Waters, Milford, MA, USA), while peak integration was performed using TargetLynx® v4.1.
Analytes for further statistical evaluation were selected based on the criteria of either existing in the 60% of the samples analyzed or presenting a relative standard deviation (RSD) < 30% in QC samples.
The selection of the optimized sample preparation protocol for either powder or syrup carob samples was based on the number of extracted peaks, the total area of maxima, classification of metabolites, and standard deviation of replicates. Microsoft Excel tools were used for illustration of results, while SIMCA 13.0 (Umetrics, Umea, Sweden) was used for the constructed principal component analysis (PCA) score plot in Unit Variance (UV) scaling.
3. Results and Discussion
In total, two replicates of the 20 different prepared carob samples of each matrix were analysed and further assessed the worth of commonly used organic solvents and their respective aqueous mixtures in two extraction ratios (Wc/Vs), as well as in three pH values. The aim was to define the optimal protocol for the analysis of both matrices, in order to fully cover the extracted metabolites. Sample preparation, a fundamental process prior to the analysis, plays a crucial role in the quality of the obtained results and the robustness of the methodology [30]. Carob and carob products are considered challenging matrices due to the physicochemical characteristics of raw carob fruit and processed carob products.
The criteria of the optimal Wc/Vs ratio for both analysed matrices were the total area (sum of peak areas) and the number of maxima (higher peak areas) [30]. Based on both criteria, for both carob products, the 1:2 Wc/Vs ratio was selected as it provided higher intensities and peak areas, as expected. Neither deterioration of the analytical system nor saturation of the detector (as possible obstacles) were observed for the dense extracts; thus, the last was chosen.
For the solvent selection in the 1:2 Wc/Vs ratio resulting from the previous step, acetone, ACN, MeOH, PropOH, ACN:H2O, MeOH:H2O, and PropOH:H2O were tested. The aforementioned solvents and solvent mixtures are easy to use, commonly available in analytical laboratories, less toxic, easy to evaporate, and suitable for one-step global analysis and for the extraction of polar and semi-polar analytes providing reproducible results. The aqueous organic solvents were evaluated to achieve enhanced extraction recovery of the metabolites. As illustrated in the bar plots for carob syrup (Figure 2), aqueous ACN 1:2 Wc/Vs presented the highest total area, followed by aqueous MeOH and aqueous PropOH, by an infinitesimal difference. The highest total peak area was also attributed to the highest number of maxima for aqueous ACN 1:2 Wc/Vs. Interestingly, while aqueous MeOH showed a higher total peak area compared to aqueous PropOH 1:2 Wc/Vs, the number of maxima presented the opposite trend. For carob powder, in Figure 3 it is observed that aqueous ACN 1:2 Wc/Vs presented the highest total peak area, as expected, due to the very large number of maxima. Although neat and aqueous MeOH 1:2 Wc/Vs and aqueous PropOH 1:2 Wc/Vs showed similar total peak areas, the aqueous PropOH 1:2 Wc/Vs was, notably, the only extraction solvent mixture that presented maximum peak areas. In both carob products, neat organic solvents indicated lower peak area values and a minor number of maximum peaks, compared to their respective aqueous mixtures. As expected, polar and semi-polar compounds were favorably extracted in the presence of an aqueous amount in the solvent mixture.
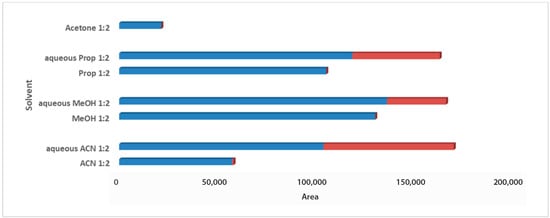
Figure 2.
Bars plot of tested solvents and solvent mixtures in 1:2 Wc/Vs in syrup carob samples, indicated differences in total peak area and number of maxima (red colored).
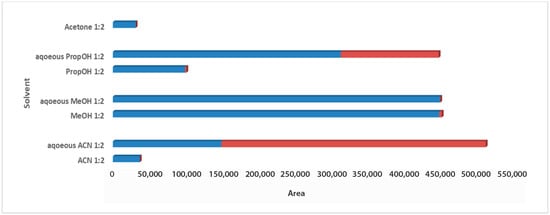
Figure 3.
Bars plot of tested solvents and solvent mixtures in 1:2 Wc/Vs in powder carob samples, indicated differences in total peak area and number of maxima (red colored).
The last step for the sample optimization protocol was the pH evaluation in aqueous solvent mixtures. Carob is considered an acidic product, with a pH value close to 6.5, while the pH value of both tested products also ranged between 4.4 and 5.5 [32,33]. Thus, it was an interesting point to investigate, whereas pH adjustment of solvent mixtures would affect metabolites extraction of the acidic matrices. For syrup samples, independent of the aqueous extraction solvent, basic pH demonstrated higher total peak areas, as it probably favors the measured metabolites. Basic aqueous PropOH 1:2 Wc/Vs was the first choice based on both total peak area and number of metabolomic maxima (n = 14), followed by basic aqueous ACN 1:2 Wc/Vs (n = 7) and basic aqueous MeOH 1:2 Wc/Vs (n = 6). Neutral pH conditions for all tested aqueous mixture solvents illustrated comparable results (Figure 4).
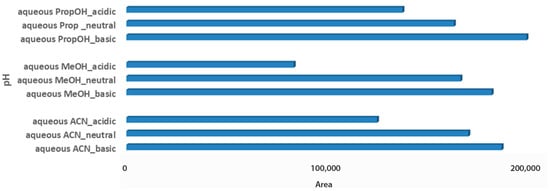
Figure 4.
Bars plot of tested aqueous solvent mixtures in 1:2 Wc/Vs in different pH values (acid, neutral, basic), in syrup carob samples.
In different pH conditions, aqueous ACN was the optimal extraction solvent mixture to extract carob powder metabolites for both assessed criteria (Figure 5). Infinitesimal differences were observed among different aqueous ACN pH conditions, with acidic having a slight predominance. A similar trend was also observed between aqueous PropOH and aqueous MeOH pH conditions, which showed satisfactory total peak areas. In the same manner, for aqueous MeOH, the number of maxima was not obtained. In the constructed PCA score plot a clear separation of the matrices was observed (Figure 6). Furthermore, the analysed samples were clustered by solvent mixture and propanol showed the lowest deviation in both matrices. Although a satisfying separation was observed, the effect of pH was milder compared to the solvent nature, as expected, since the solvent is determining factor in the sample preparation process. Validity of the constructed PCA scores plot model was based on the R2X and Q2 values. R2X was 0.731 and Q2 was 0.629, while CV-ANOVA was <0.05.
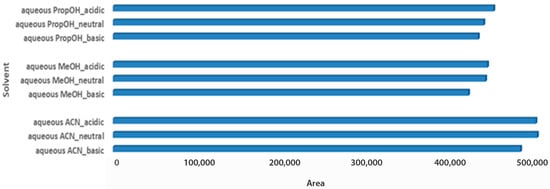
Figure 5.
Bars plot of tested aqueous solvent mixtures in 1:2 Wc/Vs in different pH values (acid, neutral, basic), in powder carob samples.
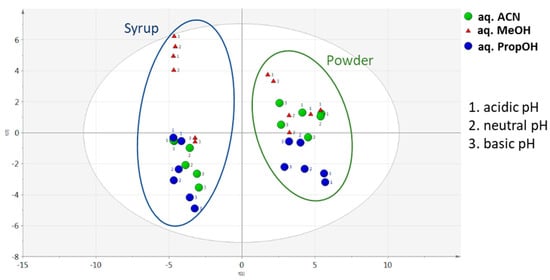
Figure 6.
PCA score plot of carob products according to aqueous solvent mixtures and pH conditions.
From the 80 metabolites included in the targeted metabolomics-based method, the detected metabolites in each carob product were categorized into eight classes, according to their chemical taxonomy (Table 2), based on Human Metabolome Database (HMDB) [34].
Table 2.
Chemical categorization for all detected analytes in carob syrup and carob powder.
In syrup, 32 compounds were not detected, while 16 metabolites namely adenine, creatine, creatinine, cytidine, kynurenate, maltose, nicotinic acid, putrescine, pyruvic acid, serine, taurine, theobromine, threonine, tyrosine, xanthine, and γ-aminobutyric acid, did not satisfy the aforementioned criteria. The highest number of compounds were met in 5 tested conditions, namely basic aqueous PropOH, PropOH, MeOH, neutral aqueous MeOH, and neutral aqueous ACN, while the lowest was met in ACN. The majority of the extracted analytes belonged to organooxygen compounds carbohydrates and carbohydrate conjugates, followed by carboxyl acids and derivatives, amino acids, peptides, and analogs, both classes of high biological significance. Notably, cytidine was only extracted in neutral aqueous ACN protocol, while nicotinic acid was favorably extracted in neutral aqueous PropOH. Caffeine was not detected since carob is a non-caffeine product [6]. To our surprise, glycine, isoleucine, arginine, tryptophan, aspartic acid, methionine, glutamic acid, lysine, and histidine were not detected or were under the limit of detection (LOD) for the applied method, although it was expected to be present in carob syrup. A possible explanation may be attributed to the thermal process of carob syrup production [35]. The total numbers of detected metabolites in syrup, based on the criteria described in Section 2.4, is summarized in Table 3.
Table 3.
Number and chemical categorization of compounds extracted upon the applied conditions in carob syrup.
A greater number of compounds were detected in carob powder samples compared to syrup. Forty-three out of 80 analytes were excluded according to the discussed criteria. Neutral aqueous ACN favored the extraction of most analytes, while neat ACN solvent extracted the least. Guanine was only extracted with aqueous PropOH but was further excluded from statistical evaluation. As illustrated in Table 4, most of the extracted analytes belonged to the same chemical categorization.
Table 4.
Number and chemical categorization of compounds extracted upon the applied conditions in carob powder.
This study attempted to provide an optimal sample preparation protocol for carob products. However, a single extraction sample preparation process for such diverse molecules with different physicochemical properties, is considered a challenging task. All criteria selected for the optimal conditions, number of extracted peaks, number of maxima, total area, and standard deviation of replicates, were chosen to provide a more global and, at the same time, selective approach limited for the specific carob analytes.
Solvent evaporation and reconstitution in the mobile phase in the sample preparation protocol were performed to secure comparable results among the studied methodologies. The optimal extraction sample weight to solvent volume ratio was selected upon the set criteria, although the high density of the obtained extract could affect the analytical system’s performance (detector saturation, analytical column, source contamination, peak overlap). In an analysis of a large number of samples this should be taken into consideration.
4. Conclusions
Carob syrup and carob powder sample preparation were studied for the optimal extraction of nutrient polar and semi-polar metabolites using HILIC-MS/MS. To our knowledge, this is the first attempt where various parameters, namely the number of metabolites, the effects of extraction, pH adjustment, solvent, and sample weight to solvent volume ratio (Wc/Vs) were examined with the aim of polar profiling the two different carob matrices. Aqueous acetonitrile at 1:2 Wc/Vs satisfied the established criteria for both carob syrup and powder samples. Nevertheless, when the pH was modified, a ratio of 1:2 Wc/Vs in basic pH using aqueous PropOH as the extraction solvent presented the optimal results for syrup analysis, while for carob powder analysis, acidic aqueous acetonitrile 1:2 Wc/Vs would be the best possible choice to obtain a satisfactory number of metabolites and extraction recovery.
The current study suggests an optimal sample preparation protocol focused on small polar and semi-polar metabolites appropriate for HILIC-MS/MS analysis. The optimal process should be adapted to the specific needs and intentions of each study; thus, the suggested protocol should not be considered a universal approach. The optimal parameters offered either a global approach or a more selective one, for the extraction of specific metabolites.
Supplementary Materials
The following supporting information can be downloaded at: https://www.mdpi.com/article/10.3390/metabo13050645/s1, Figure S1: Chromatograms of uridine, nicotinamide, trehalose, choline, betaine and benzoic acid of powder (A) and a syrup (B) products, after the extraction with the respective optimal conditions.
Author Contributions
Conceptualization, O.D., O.B., H.G., G.T. and A.A.; methodology, O.D., O.B. and A.A.; software, O.D. and O.B.; validation, O.D. and O.B.; formal analysis, O.D. and O.B.; investigation, O.D. and O.B.; resources, G.T. and A.A.; data curation, O.D. and O.B.; writing—original draft preparation, O.D., O.B. and A.A.; writing—review and editing, O.D., O.B., H.G., G.T. and A.A.; visualization, O.D., O.B. and A.A.; supervision, G.T. and A.A.; project administration, A.A.; funding acquisition, A.A. All authors have read and agreed to the published version of the manuscript.
Funding
This research was co-funded by the European Regional Development Fund and the Republic of Cyprus through the Cyprus Research and Innovation Foundation (Project: BlackGold INTEGRATED/0916/0019).
Institutional Review Board Statement
Not applicable.
Informed Consent Statement
Not applicable.
Data Availability Statement
The data presented in this study are available on request from the corresponding author. The data are not publicly available due to ongoing research.
Conflicts of Interest
The authors declare no conflict of interest.
References
- Brassesco, M.E.; Brandão, T.R.S.; Silva, C.L.M.; Pintado, M. Carob Bean (Ceratonia siliqua L.): A New Perspective for Functional Food. Trends Food Sci. Technol. 2021, 114, 310–322. [Google Scholar] [CrossRef]
- Palaiogianni, A.; Stylianou, M.; Sarris, D.; Agapiou, A. Carob-Agro-Industrial Waste and Potential Uses in the Circular Economy. In Mediterranean Fruits Bio-Wastes: Chemistry, Functionality and Technological Applications; Ramadan, M.F., Farag, M.A., Eds.; Springer International Publishing: Cham, Switzerland, 2022; pp. 765–797. ISBN 978-3-030-84436-3. [Google Scholar]
- Gioxari, A.; Amerikanou, C.; Nestoridi, I.; Gourgari, E.; Pratsinis, H.; Kalogeropoulos, N.; Andrikopoulos, N.K.; Kaliora, A.C. Carob: A Sustainable Opportunity for Metabolic Health. Foods 2022, 11, 2154. [Google Scholar] [CrossRef] [PubMed]
- Ayaz, F.A.; Torun, H.; Ayaz, S.; Correia, P.J.; Alaiz, M.; Sanz, C.; Grúz, J.; Strnad, M. Determination of Chemical Composition of Anatolian Carob Pod (Ceratonia siliqua L.): Sugars, Amino and Organic Acids, Minerals and Phenolic Compounds. J. Food Qual. 2007, 30, 1040–1055. [Google Scholar] [CrossRef]
- Goulas, V.; Stylos, E.; Chatziathanasiadou, M.V.; Mavromoustakos, T.; Tzakos, A.G. Functional Components of Carob Fruit: Linking the Chemical and Biological Space. Int. J. Mol. Sci. 2016, 17, 1875. [Google Scholar] [CrossRef] [PubMed]
- Papaefstathiou, E.; Agapiou, A.; Giannopoulos, S.; Kokkinofta, R. Nutritional Characterization of Carobs and Traditional Carob Products. Food Sci. Nutr. 2018, 6, 2151–2161. [Google Scholar] [CrossRef]
- Krokou, A.; Stylianou, M.; Agapiou, A. Assessing the Volatile Profile of Carob Tree (Ceratonia siliqua L.). Environ. Sci. Pollut. Res. Int. 2019, 26, 35365–35374. [Google Scholar] [CrossRef]
- Fella, P.; Kaikiti, K.; Stylianou, M.; Agapiou, A. HS-SPME-GC/MS Analysis for Revealing Carob’s Ripening. Metabolites 2022, 12, 656. [Google Scholar] [CrossRef]
- Krokou, A.; Kokkinofta, R.; Stylianou, M.; Agapiou, A. Decoding Carob Flavor Aroma Using HS–SPME–GC–MS and Chemometrics. Eur. Food Res. Technol. 2020, 246, 1419–1428. [Google Scholar] [CrossRef]
- Kokkinofta, R.; Yiannopoulos, S.; Stylianou, M.A.; Agapiou, A. Use of Chemometrics for Correlating Carobs Nutritional Compositional Values with Geographic Origin. Metabolites 2020, 10, 62. [Google Scholar] [CrossRef]
- Câmara, J.S.; Perestrelo, R.; Berenguer, C.V.; Andrade, C.F.P.; Gomes, T.M.; Olayanju, B.; Kabir, A.; Rocha, C.M.R.; Teixeira, J.A.; Pereira, J.A.M. Green Extraction Techniques as Advanced Sample Preparation Approaches in Biological, Food, and Environmental Matrices: A Review. Molecules 2022, 27, 2953. [Google Scholar] [CrossRef]
- Mansouri, F.E.; Silva, J.C.G.E.; Cacciola, F.; Asraoui, F.; Tayeq, H.; Ben Amar, Y.M.; Lovillo, M.P.; Chouaibi, N.; Brigui, J. Evaluation of Different Extraction Methods on the Phenolic Profile and the Antioxidant Potential of Ceratonia Siliqua L. Pods Extracts. Molecules 2022, 27, 6163. [Google Scholar] [CrossRef] [PubMed]
- Christou, A.; Stavrou, I.J.; Kapnissi-Christodoulou, C.P. Continuous and Pulsed Ultrasound-Assisted Extraction of Carob’s Antioxidants: Processing Parameters Optimization and Identification of Polyphenolic Composition. Ultrason. Sonochem. 2021, 76, 105630. [Google Scholar] [CrossRef] [PubMed]
- Huma, Z.-E.; Jayasena, V.; Nasar-Abbas, S.M.; Imran, M.; Khan, M.K. Process Optimization of Polyphenol Extraction from Carob (Ceratonia Siliqua) Kibbles Using Microwave-Assisted Technique. J. Food Process. Preserv. 2018, 42, e13450. [Google Scholar] [CrossRef]
- Gregoriou, G.; Neophytou, C.M.; Vasincu, A.; Gregoriou, Y.; Hadjipakkou, H.; Pinakoulaki, E.; Christodoulou, M.C.; Ioannou, G.D.; Stavrou, I.J.; Christou, A.; et al. Anti-Cancer Activity and Phenolic Content of Extracts Derived from Cypriot Carob (Ceratonia Siliqua L.) Pods Using Different Solvents. Molecules 2021, 26, 5017. [Google Scholar] [CrossRef]
- Christou, A.; Martinez-Piernas, A.B.; Stavrou, I.J.; Garcia-Reyes, J.F.; Kapnissi-Christodoulou, C.P. HPLC-ESI-HRMS and Chemometric Analysis of Carobs Polyphenols—Technological and Geographical Parameters Affecting Their Phenolic Composition. J. Food Compos. Anal. 2022, 114, 104744. [Google Scholar] [CrossRef]
- Begou, O.; Gika, H.G.; Wilson, I.D.; Theodoridis, G. Hyphenated MS-Based Targeted Approaches in Metabolomics. Analyst 2017, 142, 3079–3100. [Google Scholar] [CrossRef]
- Płotka-Wasylka, J.; Jatkowska, N.; Paszkiewicz, M.; Caban, M.; Fares, M.Y.; Dogan, A.; Garrigues, S.; Manousi, N.; Kalogiouri, N.; Nowak, P.M.; et al. Miniaturized Solid Phase Extraction Techniques for Different Kind of Pollutants Analysis: State of the Art and Future Perspectives—PART 1. TrAC Trends Anal. Chem. 2023, 162, 117034. [Google Scholar] [CrossRef]
- Farag, M.A.; El-Kersh, D.M. Volatiles Profiling in Ceratonia siliqua (Carob Bean) from Egypt and in Response to Roasting as Analyzed via Solid-Phase Microextraction Coupled to Chemometrics. J. Adv. Res. 2017, 8, 379–385. [Google Scholar] [CrossRef]
- Farag, M.A.; El-Kersh, D.M.; Ehrlich, A.; Choucry, M.A.; El-Seedi, H.; Frolov, A.; Wessjohann, L.A. Variation in Ceratonia Siliqua Pod Metabolome in Context of Its Different Geographical Origin, Ripening Stage and Roasting Process. Food Chem. 2019, 283, 675–687. [Google Scholar] [CrossRef]
- Ben Ayache, S.; Reis, F.S.; Inês Dias, M.; Pereira, C.; Glamočlija, J.; Soković, M.; Behija Saafi, E.; Ferreira, I.C.F.R.; Barros, L.; Achour, L. Chemical Characterization of Carob Seeds (Ceratonia siliqua L.) and Use of Different Extraction Techniques to Promote Its Bioactivity. Food Chem. 2021, 351, 129263. [Google Scholar] [CrossRef]
- Kyriacou, M.C.; Antoniou, C.; Rouphael, Y.; Graziani, G.; Kyratzis, A. Mapping the Primary and Secondary Metabolomes of Carob (Ceratonia siliqua L.) Fruit and Its Postharvest Antioxidant Potential at Critical Stages of Ripening. Antioxidants 2021, 10, 57. [Google Scholar] [CrossRef] [PubMed]
- Vaya, J.; Mahmood, S. Flavonoid Content in Leaf Extracts of the Fig (Ficus carica L.), Carob (Ceratonia siliqua L.) and Pistachio (Pistacia lentiscus L.). Biofactors 2006, 28, 169–175. [Google Scholar] [CrossRef]
- Carbas, B.; Salinas, M.V.; Serrano, C.; Passarinho, J.A.; Puppo, M.C.; Ricardo, C.P.; Brites, C. Chemical Composition and Antioxidant Activity of Commercial Flours from Ceratonia Siliqua and Prosopis Spp. Food Meas. 2019, 13, 305–311. [Google Scholar] [CrossRef]
- Hoehnel, A.; Salas García, J.; Coffey, C.; Zannini, E.; Arendt, E.K. Comparative Study of Sugar Extraction Procedures for HPLC Analysis and Proposal of an Ethanolic Extraction Method for Plant-Based High-Protein Ingredients. J. Sci. Food Agric. 2022, 102, 5055–5064. [Google Scholar] [CrossRef] [PubMed]
- Pätzold, R.; Brückner, H. Mass Spectrometric Detection and Formation of D-Amino Acids in Processed Plant Saps, Syrups, and Fruit Juice Concentrates. J. Agric. Food Chem. 2005, 53, 9722–9729. [Google Scholar] [CrossRef]
- Balaban, M. Identification of the Main Phenolic Compounds in Wood of Ceratonia Siliqua by GC-MS. Phytochem. Anal. 2004, 15, 385–388. [Google Scholar] [CrossRef]
- Siano, F.; Sciammaro, L.; Volpe, M.G.; Mamone, G.; Puppo, M.C.; Picariello, G. Integrated Analytical Methods to Characterize Lipids from Prosopis Spp. and Ceratonia siliqua Seed Germ Flour. Food Anal. Methods 2018, 11, 3471–3480. [Google Scholar] [CrossRef]
- Begou, O.; Deda, O.; Agapiou, A.; Taitzoglou, I.; Gika, H.; Theodoridis, G. Urine and Fecal Samples Targeted Metabolomics of Carobs Treated Rats. J. Chromatogr. B 2019, 1114–1115, 76–85. [Google Scholar] [CrossRef]
- Deda, O.; Chatziioannou, A.C.; Fasoula, S.; Palachanis, D.; Raikos, N.; Theodoridis, G.A.; Gika, H.G. Sample Preparation Optimization in Fecal Metabolic Profiling. J. Chromatogr. B Analyt. Technol. Biomed. Life Sci. 2017, 1047, 115–123. [Google Scholar] [CrossRef]
- Virgiliou, C.; Sampsonidis, I.; Gika, H.G.; Raikos, N.; Theodoridis, G.A. Development and Validation of a HILIC-MS/MS Multitargeted Method for Metabolomics Applications. Electrophoresis 2015, 36, 2215–2225. [Google Scholar] [CrossRef]
- Alsaed, A.; Alghzawi, H.M. Processing and Characterization of Carob Powder. Food Chem. 2000, 69, 283–287. [Google Scholar] [CrossRef]
- Toufeili, I.; Itani, M.; Zeidan, M.; Al Yamani, O.; Kharroubi, S. Nutritional and Functional Potential of Carob Syrup Versus Date and Maple Syrups. Food Technol. Biotechnol. 2022, 60, 266–278. [Google Scholar] [CrossRef] [PubMed]
- Wishart, D.S.; Guo, A.; Oler, E.; Wang, F.; Anjum, A.; Peters, H.; Dizon, R.; Sayeeda, Z.; Tian, S.; Lee, B.L.; et al. HMDB 5.0: The Human Metabolome Database for 2022. Nucleic Acids Res. 2022, 50, D622–D631. [Google Scholar] [CrossRef] [PubMed]
- Christou, C.; Poulli, E.; Yiannopoulos, S.; Agapiou, A. GC–MS Analysis of D-Pinitol in Carob: Syrup and Fruit (Flesh and Seed). J. Chromatogr. B 2019, 1116, 60–64. [Google Scholar] [CrossRef] [PubMed]


Disclaimer/Publisher’s Note: The statements, opinions and data contained in all publications are solely those of the individual author(s) and contributor(s) and not of MDPI and/or the editor(s). MDPI and/or the editor(s) disclaim responsibility for any injury to people or property resulting from any ideas, methods, instructions or products referred to in the content. |
© 2023 by the authors. Licensee MDPI, Basel, Switzerland. This article is an open access article distributed under the terms and conditions of the Creative Commons Attribution (CC BY) license (https://creativecommons.org/licenses/by/4.0/).