
Effect of Rumen-Protected Methionine on Metabolic Profile of Liver, Muscle and Blood Serum Samples of Growing German Simmental Bulls Fed Protein-Reduced Diets

 , , , ,
  and
and
Abstract
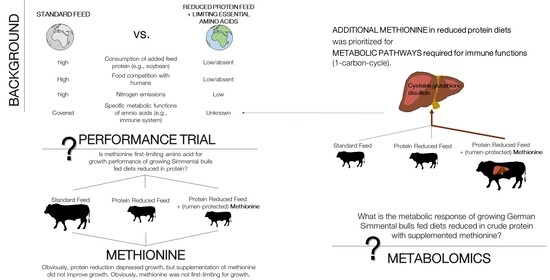
1. Introduction
2. Materials and Methods
2.1. Feeding Experiment
2.1.1. Animals and Dietary Treatments
2.1.2. Slaughter and Sample Collection
2.2. Sample Preparation and Metabolomics Analysis
2.3. Statistical Data Analysis and Bioinformatics
3. Results
3.1. Zootechnical Results
3.2. Relative Quantification and Identification of Compounds in Liver and Muscle Tissue and Blood Serum Samples
3.3. Univariate Analysis of Annotated Metabolites
4. Discussion
Author Contributions
Funding
Institutional Review Board Statement
Informed Consent Statement
Data Availability Statement
Acknowledgments
Conflicts of Interest
References
- Gerber, P.J.; Mottet, A.; Opio, C.I.; Falcucci, A.; Teillard, F. Environmental impacts of beef production: Review of challenges and perspectives for durability. Meat Sci. 2015, 109, 2–12. [Google Scholar] [PubMed]
- Thompson, L.; Rowntree, J.; Windisch, W.; Waters, S.M.; Shalloo, L.; Manzano, P. Ecosystem management using livestock: Embracing diversity and respecting ecological principles. Anim. Front. 2023, 13, 28–34. [Google Scholar] [PubMed]
- Leroy, F.; Smith, N.W.; Adesogan, A.T.; Beal, T.; Iannotti, L.; Moughan, P.J.; Mann, N. The role of meat in the human diet: Evolutionary aspects and nutritional value. Anim. Front. 2023, 13, 11–18. [Google Scholar] [PubMed]
- Van Milgen, J.; Dourmad, J.Y. Concept and application of ideal protein for pigs. J. Anim. Sci. Biotechnol. 2015, 6, 15. [Google Scholar] [CrossRef]
- Cappelaere, L.; Le Cour Grandmaison, J.; Martin, N.; Lambert, W. Amino Acid Supplementation to Reduce Environmental Impacts of Broiler and Pig Production: A Review. Front. Vet. Sci. 2021, 8, 689259. [Google Scholar]
- Inhuber, V.; Windisch, W.; Bächler, B.; Schuster, M.; Spiekers, H.; Ettle, T. Effects of supplementing a CP-reduced diet with rumen-protected methionine on Fleckvieh bull fattening. Animal 2021, 15, 100366. [Google Scholar]
- Greenwood, R.H.; Titgemeyer, E.C. Limiting amino acids for growing Holstein steers limit-fed soybean hull-based diets. J. Anim. Sci. 2000, 78, 1997. [Google Scholar]
- Brosnan, J.T.; Brosnan, M.E. The Sulfur-Containing Amino Acids: An Overview. J. Nutr. 2006, 136, 1636S–1640S. [Google Scholar]
- Martínez, Y.; Li, X.; Liu, G.; Bin, P.; Yan, W.; Más, D.; Valdivié, M.; Hu, C.-A.A.; Ren, W.; Yin, Y. The role of methionine on metabolism, oxidative stress, and diseases. Amino Acids 2017, 49, 2091–2098. [Google Scholar]
- Lopreiato, V.; Vailati-Riboni, M.; Bellingeri, A.; Khan, I.; Farina, G.; Parys, C.; Loor, J. Inflammation and oxidative stress transcription profiles due to in vitro supply of methionine with or without choline in unstimulated blood polymorphonuclear leukocytes from lactating Holstein cows. J. Dairy Sci. 2019, 102, 10395–10410. [Google Scholar]
- Graulet, B.; Richard, C.; Robert, J.C. Methionine Availability in Plasma of Dairy Cows Supplemented with Methionine Hydroxy Analog Isopropyl Ester. J. Dairy Sci. 2005, 88, 3640–3649. [Google Scholar] [PubMed]
- Gesellschaft für Ernährungsphysiologie, editor. Empfehlungen zur Energie- und Nährstoffversorgung der Mastrinder. Frankfurt (Main): DLG-Verl; Deutsche Landwirtschafts-Gesellschaft Verlag: Frankfurt a. M., Germany, 1995; 85p, (Energie-und Nährstoffbedarf landwirtschaftlicher Nutztiere). [Google Scholar]
- Kessner, D.; Chambers, M.; Burke, R.; Agus, D.; Mallick, P. ProteoWizard: Open source software for rapid proteomics tools development. Bioinformatics 2008, 24, 2534–2536. [Google Scholar] [CrossRef] [PubMed]
- Smith, C.A.; Want, E.J.; O’Maille, G.; Abagyan, R.; Siuzdak, G. XCMS: Processing Mass Spectrometry Data for Metabolite Profiling Using Nonlinear Peak Alignment, Matching, and Identification. Anal. Chem. 2006, 78, 779–787. [Google Scholar] [PubMed]
- Wishart, D.S.; Feunang, Y.D.; Marcu, A.; Guo, A.C.; Liang, K.; Vázquez-Fresno, R.; Sajed, T.; Johnson, D.; Li, C.; Karu, N.; et al. HMDB 4.0: The human metabolome database for 2018. Nucleic Acids Res. 2018, 46, D608–D617. [Google Scholar]
- Tsugawa, H.; Cajka, T.; Kind, T.; Ma, Y.; Higgins, B.; Ikeda, K.; Kanazawa, M.; Van der Gheynst, J.; Fiehn, O.; Arita, M. MS-DIAL: Data-independent MS/MS deconvolution for comprehensive metabolome analysis. Nat. Methods 2015, 12, 523–526. [Google Scholar]
- SAS Institute Inc. SAS/QC(R)15.1 User’s Guide; SAS Institute Inc.: Cary, NC, USA, 2018. [Google Scholar]
- Thrän, D.; Moesenfechtel, U. (Eds.) The Bioeconomy System [Internet]. Springer: Berlin/Heidelberg, Germany, 2022. Available online: https://link.springer.com/10.1007/978-3-662-64415-7 (accessed on 23 April 2023).
- Titgemeyer, E.C. Amino acid utilization by growing and finishing ruminants. In Amino Acids in Animal Nutrition [Internet], 2nd ed.; D’Mello, J.P.F., Ed.; CABI Publishing: Wallingford, UK, 2003; pp. 329–346. Available online: http://www.cabidigitallibrary.org/doi/10.1079/9780851996547.0329 (accessed on 15 June 2023).
- Niculescu, M.D.; Haggarty, P. (Eds.) Nutrition in Epigenetics; Wiley-Blackwell: Ames, IA, USA, 2011; p. 370. [Google Scholar]
- Coleman, D.N.; Vailati-Riboni, M.; Pate, R.T.; Aboragah, A.; Luchini, D.; Cardoso, F.C.; Loor, J.J. Increased supply of methionine during a heat-stress challenge in lactating holstein cows alters mammary tissue mTOR signaling and its response to lipopolysaccharide. J. Anim. Sci. 2022, 100, skac175. [Google Scholar]
- Goldansaz, S.A.; Guo, A.C.; Sajed, T.; Steele, M.A.; Plastow, G.S.; Wishart, D.S. Livestock metabolomics and the livestock metabolome: A systematic review. PLoS ONE 2017, 12, e0177675. [Google Scholar]
- Clemmons, B.A.; Mihelic, R.I.; Beckford, R.C.; Powers, J.B.; Melchior, E.A.; McFarlane, Z.D.; Cope, E.R.; Embree, M.M.; Mulliniks, J.T.; Campagna, S.R.; et al. Serum metabolites associated with feed efficiency in black angus steers. Metabolomics 2017, 13, 147. [Google Scholar]
- Clemmons, B.A.; Martino, C.; Powers, J.B.; Campagna, S.R.; Voy, B.H.; Donohoe, D.R.; Gaffney, J.; Embree, M.M.; Myer, P.R. Rumen Bacteria and Serum Metabolites Predictive of Feed Efficiency Phenotypes in Beef Cattle. Sci. Rep. 2019, 9, 19265. [Google Scholar]
- Connolly, S.; Dona, A.; Wilkinson-White, L.; Hamblin, D.; D’Occhio, M.; González, L.A. Relationship of the blood metabolome to subsequent carcass traits at slaughter in feedlot Wagyu crossbred steers. Sci. Rep. 2019, 9, 15139. [Google Scholar]
- Novais, F.J.; Pires, P.R.L.; Alexandre, P.A.; Dromms, R.A.; Iglesias, A.H.; Ferraz, J.B.S.; Styczynski, M.P.-W.; Fukumasu, H. Identification of a metabolomic signature associated with feed efficiency in beef cattle. BMC Genom. 2019, 20, 8. [Google Scholar]
- Clemmons, B.A.; Powers, J.B.; Campagna, S.R.; Seay, T.B.; Embree, M.M.; Myer, P.R. Rumen fluid metabolomics of beef steers differing in feed efficiency. Metabolomics 2020, 16, 23. [Google Scholar]
- Foroutan, A.; Fitzsimmons, C.; Mandal, R.; Piri-Moghadam, H.; Zheng, J.; Guo, A.; Li, C.; Guan, L.L.; Wishart, D.S. The Bovine Metabolome. Metabolites 2020, 10, 233. [Google Scholar] [CrossRef] [PubMed]
- Foroutan, A.; Fitzsimmons, C.; Mandal, R.; Berjanskii, M.V.; Wishart, D.S. Serum Metabolite Biomarkers for Predicting Residual Feed Intake (RFI) of Young Angus Bulls. Metabolites 2020, 10, 491. [Google Scholar]
- Artegoitia, V.M.; Newman, J.W.; Foote, A.P.; Shackelford, S.D.; King, D.A.; Wheeler, T.L.; Lewis, R.M.; Freetly, H.C. Non-invasive metabolomics biomarkers of production efficiency and beef carcass quality traits. Sci. Rep. 2022, 12, 231. [Google Scholar] [PubMed]
- Imaz, J.A.; García, S.; González, L.A. The metabolomics profile of growth rate in grazing beef cattle. Sci. Rep. 2022, 12, 2554. [Google Scholar]
- López Radcenco, A.; Adrien, M.D.L.; Ruprechter, G.; De Torres, E.; Meikle, A.; Moyna, G. Monitoring the Transition Period in Dairy Cows through 1H NMR-Based Untargeted Metabolomics. Dairy 2021, 2, 356–366. [Google Scholar]
- Lisuzzo, A.; Laghi, L.; Faillace, V.; Zhu, C.; Contiero, B.; Morgante, M.; Mazzotta, E.; Gianesella, M.; Fiore, E. Differences in the serum metabolome profile of dairy cows according to the BHB concentration revealed by proton nuclear magnetic resonance spectroscopy (1H-NMR). Sci. Rep. 2022, 12, 2525. [Google Scholar]
- Rocchetti, G.; Ghilardelli, F.; Carboni, E.; Atzori, A.S.; Masoero, F.; Gallo, A. Milk metabolome reveals pyrimidine and its degradation products as the discriminant markers of different corn silage-based nutritional strategies. J. Dairy Sci. 2022, 105, 8650–8663. [Google Scholar]
- Palombo, V.; Alharthi, A.; Batistel, F.; Parys, C.; Guyader, J.; Trevisi, E.; D’andrea, M.; Loor, J.J. Unique adaptations in neonatal hepatic transcriptome, nutrient signaling, and one-carbon metabolism in response to feeding ethyl cellulose rumen-protected methionine during late-gestation in Holstein cows. BMC Genom. 2021, 22, 280. [Google Scholar]
- Osorio, J.S.; Ji, P.; Drackley, J.K.; Luchini, D.; Loor, J.J. Smartamine M and MetaSmart supplementation during the peripartal period alter hepatic expression of gene networks in 1-carbon metabolism, inflammation, oxidative stress, and the growth hormone–insulin-like growth factor 1 axis pathways. J. Dairy Sci. 2014, 97, 7451–7464. [Google Scholar] [PubMed]
- Osorio, J.S.; Trevisi, E.; Ji, P.; Drackley, J.K.; Luchini, D.; Bertoni, G.; Loor, J. Biomarkers of inflammation, metabolism, and oxidative stress in blood, liver, and milk reveal a better immunometabolic status in peripartal cows supplemented with Smartamine M or MetaSmart. J. Dairy Sci. 2014, 97, 7437–7450. [Google Scholar]
- Alfaro, G.F.; Novak, T.E.; Rodning, S.P.; Moisá, S.J. Preconditioning beef cattle for long-duration transportation stress with rumen-protected methionine supplementation: A nutrigenetics study. Loor, J.J.; editor. PLoS ONE 2020, 15, e0235481. [Google Scholar]
- Johnson, C.H.; Gonzalez, F.J. Challenges and opportunities of metabolomics. J. Cell Physiol. 2012, 227, 2975–2981. [Google Scholar]
- Gómez, E.; Salvetti, P.; Gatien, J.; Muñoz, M.; Martín-González, D.; Carrocera, S.; Goyache, F. Metabolomic Profiling of Bos taurus Beef, Dairy, and Crossbred Cattle: A Between-Breeds Meta-Analysis. J. Agric. Food Chem. 2020, 68, 8732–8743. [Google Scholar] [PubMed]
- Liu, R.; Bao, Z.X.; Zhao, P.J.; Li, G.H. Advances in the Study of Metabolomics and Metabolites in Some Species Interactions. Molecules 2021, 26, 3311. [Google Scholar] [PubMed]
- Fontanesi, L. Metabolomics and livestock genomics: Insights into a phenotyping frontier and its applications in animal breeding. Anim. Front. 2016, 6, 73–79. [Google Scholar]
- Bauman, D.E.; Eisemann, J.H.; Currie, W.B. Hormonal effects on partitioning of nutrients for tissue growth: Role of growth hormone and prolactin. Fed. Proc. 1982, 41, 2538–2544. [Google Scholar]
- Baumgard, L.H.; Collier, R.J.; Bauman, D.E. A 100-Year Review: Regulation of nutrient partitioning to support lactation. J. Dairy Sci. 2017, 100, 10353–10366. [Google Scholar]
- Seidel, U.; Huebbe, P.; Rimbach, G. Taurine: A Regulator of Cellular Redox Homeostasis and Skeletal Muscle Function. Mol. Nutr. Food Res. 2019, 63, 1800569. [Google Scholar]
- Mosharov, E.; Cranford, M.R.; Banerjee, R. The Quantitatively Important Relationship between Homocysteine Metabolism and Glutathione Synthesis by the Transsulfuration Pathway and Its Regulation by Redox Changes. Biochemistry 2000, 39, 13005–13011. [Google Scholar] [PubMed]


| Sample Type | Detection Mode | Number of Features |
|---|---|---|
| Liver | P | 930 |
| N | 527 | |
| Muscle | P | 1122 |
| N | 747 | |
| Blood serum | P | 1835 |
| N | 1379 | |
| Total | 6540 |
| Dietary Treatment | p-Value | |||||||||||
|---|---|---|---|---|---|---|---|---|---|---|---|---|
| Mean | GLM 4 | Linear Contrast I 5 | Linear Contrast II 6 | |||||||||
| Tissue | Mode 1 | Annotation | Prec m/z2 | Retention Time | Quality 3 | CON | RED | RED+RPMET | SEM | CON vs. RED vs. RED+RPMET | CON vs. RED+RPMET | RED vs. RED+RPMET |
| Liver | P | Carnosine | 227.11 | 462.55 | 4 | 5.09 a | 4.79 b | 4.85 b | 0.11 | <0.01 | <0.01 | 0.31 |
| Liver | P | Cystine | 241.03 | 492 | 4 | 4.65 a | 4.18 b | 4.32 b | 0.20 | <0.01 | <0.01 | 0.21 |
| Liver | P | Taurocholic acid | 516.3 | 291.72 | 4 | 4.69 a | 4.31 b | 4.53 a | 0.15 | <0.01 | <0.01 | 0.01 |
| Liver | P | L-leucine/L-isoleucine/norleucine | 132.1 | 318.27 | 4 | 4.37 a | 4.13 b | 4.05 b | 0.15 | <0.01 | <0.01 | 0.32 |
| Liver | N | Cysteine glutathione disulfide | 425.08 | 512.25 | 4 | 4.79 b | 4.63 c | 4.96 a | 0.15 | <0.01 | 0.99 | <0.01 |
| Blood serum | N | Pyrrolidone-carboxylic acid | 128.04 | 119.04 | 4 | 4.61 a | 3.97 b | 4.11 b | 0.19 | <0.01 | <0.01 | 0.14 |
Disclaimer/Publisher’s Note: The statements, opinions and data contained in all publications are solely those of the individual author(s) and contributor(s) and not of MDPI and/or the editor(s). MDPI and/or the editor(s) disclaim responsibility for any injury to people or property resulting from any ideas, methods, instructions or products referred to in the content. |
© 2023 by the authors. Licensee MDPI, Basel, Switzerland. This article is an open access article distributed under the terms and conditions of the Creative Commons Attribution (CC BY) license (https://creativecommons.org/licenses/by/4.0/).
Share and Cite
Inhuber, V.; Windisch, W.; Kleigrewe, K.; Meng, C.; Bächler, B.; Gigl, M.; Steinhoff-Wagner, J.; Ettle, T. Effect of Rumen-Protected Methionine on Metabolic Profile of Liver, Muscle and Blood Serum Samples of Growing German Simmental Bulls Fed Protein-Reduced Diets. Metabolites 2023, 13, 946. https://doi.org/10.3390/metabo13080946
Inhuber V, Windisch W, Kleigrewe K, Meng C, Bächler B, Gigl M, Steinhoff-Wagner J, Ettle T. Effect of Rumen-Protected Methionine on Metabolic Profile of Liver, Muscle and Blood Serum Samples of Growing German Simmental Bulls Fed Protein-Reduced Diets. Metabolites. 2023; 13(8):946. https://doi.org/10.3390/metabo13080946
Chicago/Turabian StyleInhuber, Vivienne, Wilhelm Windisch, Karin Kleigrewe, Chen Meng, Benedikt Bächler, Michael Gigl, Julia Steinhoff-Wagner, and Thomas Ettle. 2023. "Effect of Rumen-Protected Methionine on Metabolic Profile of Liver, Muscle and Blood Serum Samples of Growing German Simmental Bulls Fed Protein-Reduced Diets" Metabolites 13, no. 8: 946. https://doi.org/10.3390/metabo13080946
APA StyleInhuber, V., Windisch, W., Kleigrewe, K., Meng, C., Bächler, B., Gigl, M., Steinhoff-Wagner, J., & Ettle, T. (2023). Effect of Rumen-Protected Methionine on Metabolic Profile of Liver, Muscle and Blood Serum Samples of Growing German Simmental Bulls Fed Protein-Reduced Diets. Metabolites, 13(8), 946. https://doi.org/10.3390/metabo13080946