Faba Bean (Vicia faba L. minor) Bitterness: An Untargeted Metabolomic Approach to Highlight the Impact of the Non-Volatile Fraction

 , ,
, , 
Abstract
: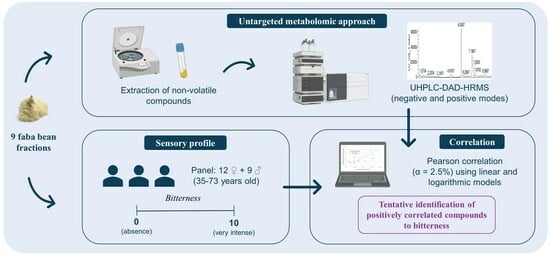
1. Introduction
2. Materials and Methods
2.1. Faba Bean Fractions
2.2. Sensory Analysis
2.3. Non-Volatile Compound Extraction
2.4. Non Volatile Compound Untargeted Analysis
2.5. Metabolomic Analysis
2.6. Statistical Analysis
3. Results and Discussion
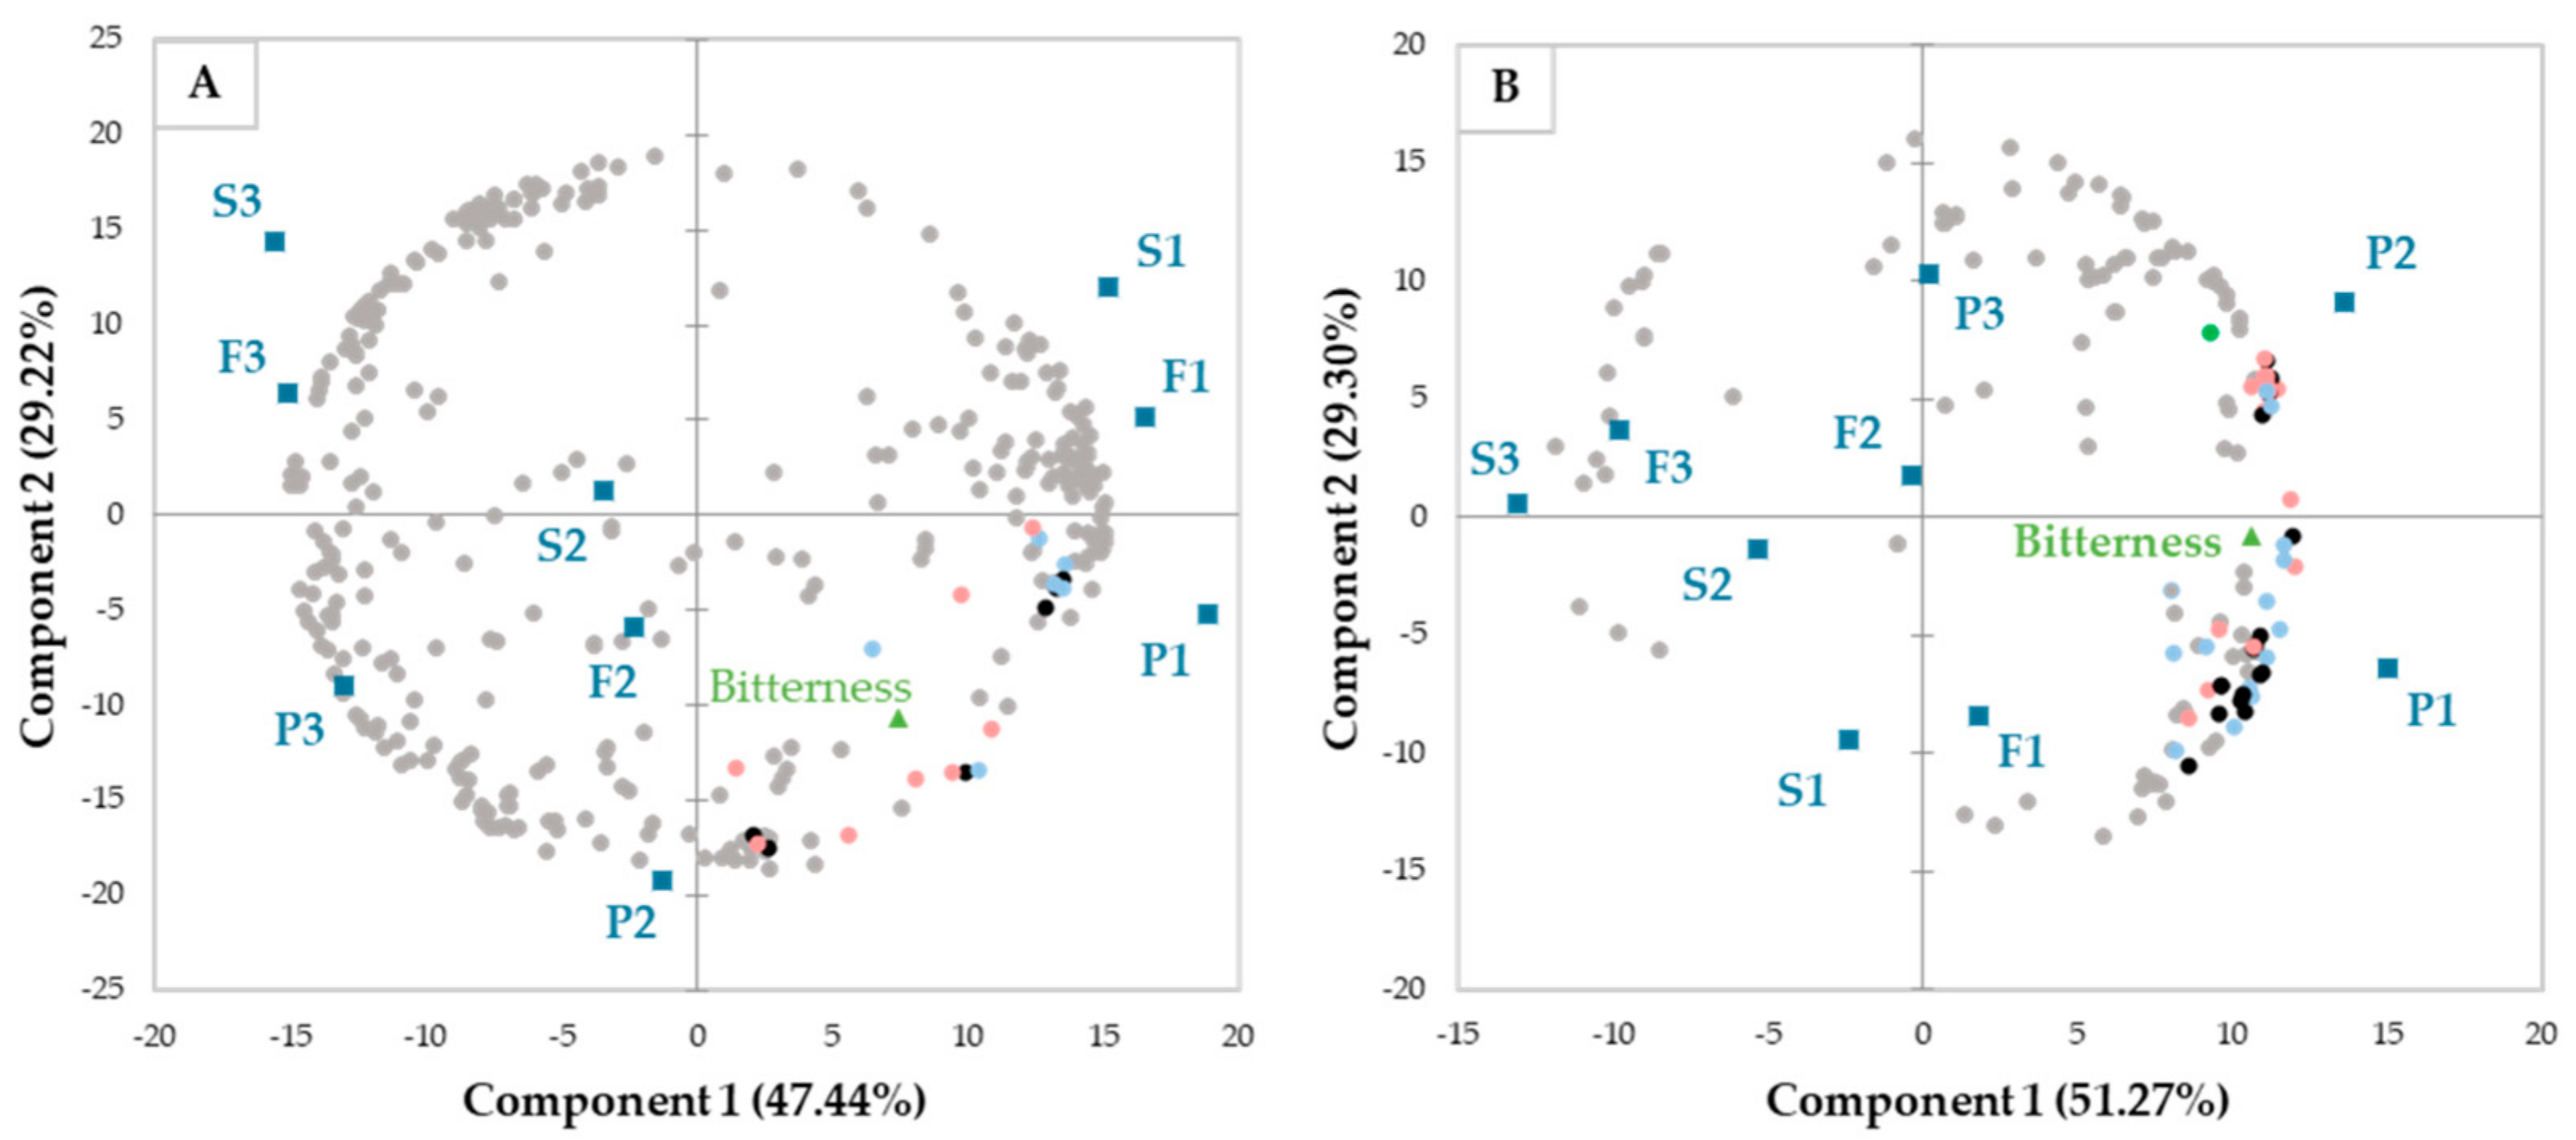
3.1. Bitterness of the Faba Bean Fractions
3.2. Tentative Identification of Non-Volatile Compounds Correlated with Faba Bean Bitterness
3.2.1. Alkaloids
3.2.2. Amino Acids
3.2.3. Phenolic Compounds
3.2.4. Organic Acids
3.2.5. Terpenoids
3.2.6. Other Non-Volatile Compounds
3.2.7. Unidentified Compounds

| No. | RT (min) | Linear Model | Logarithmic Model | UV (nm) | Mode | Experi- mental m/z | Formula (Neutral) | Expected m/z | Error (ppm) | Main MS/MS Fragment Ions | Compound | RI | Ref. | ||
|---|---|---|---|---|---|---|---|---|---|---|---|---|---|---|---|
| R | p-Value | R | p-Value | ||||||||||||
| ALKALOIDS | |||||||||||||||
| 1 | 0.86 | 0.737 | 0.024 | 0.549 | 0.126 | 274 | POS | 305.1093 | C10H14N4O7 | 305.1092 | 0.10 | 143.0564 (100) | Vicine | 1,2,3,4 | [23,28] |
| 2 | 1.27 | 0.796 | 0.010 | 0.598 | 0.089 | 274 | POS | 391.1097 | C13H18N4O10 | 391.1107 | 1.00 | 305.1099 (1); 143.0564 (100) | Vicine derivative | 1,2 | |
| 3 | 6.61 | 0.83 | 0.006 | 0.628 | 0.070 | 278 | POS | 613.1988 | C25H32N4O14 | 613.1988 | 0.00 | 305.1093 (1); 147.0442 (60); 143.0564 (100) | Vicine derivative | 1,2 | |
| 4 | 7.61 | 0.785 | 0.012 | 0.609 | 0.082 | 274 | NEG | 775.3110 (387.1512) | C15H24N4O8 | 387.1521 | 0.90 | 387.1512 (50); 303.0947 (5); 141.0418 (100) | Vicine derivative (ester with valeric/isovaleric acid) | 1,2,4 | [19,21] |
| 0.871 | 0.002 | 0.701 | 0.035 | 278 | POS | 389.1670 | 389.1667 | −0.30 | 305.1092 (5); 143.0564 (100) | ||||||
| 5 | 7.68 | 0.829 | 0.006 | 0.645 | 0.060 | 274 | NEG | 777.2793 (388.1352) | C15H23N3O9 | 388.1361 | 0.90 | 388.1352 (100); 304.0791 (5); 142.0264 (5) | Convicine derivative (ester with valeric/isovaleric acid) | 1,2,4 | [19,21] |
| 0.883 | 0.002 | 0.648 | 0.059 | 274 | POS | 390.1509 | 390.1507 | −0.20 | 229.1070 (20); 144.0405 (100); 127.0390 (20); 85.0648 (30); 57.0699 (20) | ||||||
| 6 | 11.56 | 0.755 | 0.019 | 0.579 | 0.102 | 274 | POS | 815.3052 | C32H46N8O17 | 815.3054 | 0.20 | 305.1093 (5); 143.0565 (100) | Vicine derivative | 1,2 | |
| AMINO ACIDS | |||||||||||||||
| 7 | 0.71 | 0.736 | 0.024 | 0.695 | 0.038 | POS | 213.0747 (175.1192) | C6H14N4O2 | 175.1201 | 0.90 | 175.1192 (100); 158.0925 (20); 130.0975 (10); 116.0707 (30); 112.0869 (5); 60.0557 (20) | L-arginine | 1,4 | [29,33] | |
| 8 | 0.74 | 0.885 | 0.002 | 0.792 | 0.011 | POS | 292.1979 | C11H25N5O4 | 292.1979 | 0.00 | 175.1190 (70); 158.0926 (10); 118.0863 (100); 116.0705 (1); 60.0556 (1) | L-arginine derivative | 1 | ||
| 9 | 0.85 | 0.846 | 0.004 | 0.811 | 0.008 | POS | 203.1138 | C7H15N4O3 | 203.1150 | 1.20 | 203.1143 (100); 186.0876 (10); 175.1191 (20); 158.0928 (10); 144.0657 (20); 130.0974 (1); 116.0707 (10); 112.0870 (5); 88.0870 (5); 70.0651 (1) | N-formyl-L- arginine | 1,6 | [30] | |
| 10 | 0.93 | 0.787 | 0.012 | 0.765 | 0.016 | POS | 178.0863 (386.1447) | C17H23NO9 | 386.1456 | 0.90 | 224.0917 (100); 178.0863 (40); 85.0284 (15) | N-acetyl-L-tyrosine hexoside (unknow isomer) | 1,4 | [16,18] | |
| 11 | 0.96 | 0.753 | 0.019 | 0.706 | 0.033 | POS | 568.1873 (730.2401) | C25H43NO21 | 730.2411 | 1.00 | 198.0761 (100); 181.0496 (40); 152.0707 (30) | L-DOPA hexoside derivative | 1 | ||
| 12 | 1.00 | 0.888 | 0.001 | 0.815 | 0.007 | POS | 198.0762 | C9H11NO4 | 198.9761 | −0.10 | 181.0496 (40); 152.0707 (100); 139.0390 (40); 135.0441 (20) | L-DOPA | 1,4 | [22] | |
| 13 | 1.02 | 0.797 | 0.010 | 0.658 | 0.054 | POS | 719.2506 (360.1286) | C15H21NO9 | 360.1289 | 0.30 | 360.1286 (5); 198.0760 (100); 181.0495 (10); 152.0704 (10); 139.0390 (20); 85.0284 (5) | L-DOPA hexoside (unknow isomer) | 1,4 | [16,18] | |
| 14 | 1.11 | 0.770 | 0.015 | 0.736 | 0.024 | POS | 386.1446 | C17H23NO9 | 386.1456 | 1.00 | 224.0918 (100); 178.0864 (40); 165.0547 (1); 85.0284 (10) | N-acetyl-L-tyrosine hexoside (unknow isomer) | 1 | ||
| 15 | 1.86 | 0.844 | 0.004 | 0.728 | 0.026 | POS | 323.0874 | C14H14N2O7 | 323.0874 | 0.00 | 146.0601 (100) | L-tryptophan derivative | 1 | ||
| 16 | 2.19 | 0.813 | 0.008 | 0.788 | 0.012 | POS | 166.0863 | C9H12NO2 | 166.0863 | 0.00 | 149.0597 (5); 120.0808 (100); 103.0542 (5) | L-phenylalanine | 1,4 | [29,33] | |
| 17 | 3.60 | 0.900 | 0.001 | 0.717 | 0.030 | POS | 259.1764 | C11H22N4O3 | 259.1765 | 0.10 | 259.1766 (100); 242.1499 (20); 200.1279 (10); 175.1191 (10); 158.0925 (20); 112.0871 (1). 116.0705 (1); 70.0651 (5) | L-arginine derivative | 1 | ||
| 18 | 5.30 | 0.838 | 0.005 | 0.794 | 0.011 | POS | 188.0706 (205.0969) | C11H12N2O2 | 205.0971 | 0.20 | 205.0969; 146.0602 (100); 118.0652 (10) | L-tryptophan | 1,4 | [29,33] | |
| 19 | 9.68 | 0.734 | 0.024 | 0.689 | 0.040 | POS | 222.0648 (443.1226) | ND | - | - | 281.0705 (30); 252.0441 (20); 237.0800 (80); 198.0761 (50); 181.0497 (80); 152.0708 (100); 139.0392 (30); 135.0442 (20); 85.0650 (30) | L-DOPA hexoside derivative | 1 | ||
| 20 | 11.28 | 0.734 | 0.024 | 0.652 | 0.057 | POS | 444.1867 | C20H29NO10 | 444.1864 | −0.30 | 229.1071 (20); 198.0761 (100); 181.0496 (70); 152.0706 (60); 139.0390 (10); 135.0440 (10); 85.0648 (30) | L-DOPA derivative | 1 | ||
| PHENOLIC COMPOUNDS | |||||||||||||||
| 21 | 1.57 | 0.851 | 0.004 | 0.781 | 0.013 | NEG | 299.0773 | C13H16O8 | 299.0772 | −0.10 | 137.0244 (100); 93.0345 (30) | p-Hydroxybenzoic hexoside | 1,4,5 | [10,42,47] | |
| 22 | 2.63 | 0.808 | 0.008 | 0.730 | 0.025 | 257; 293 | NEG | 315.0721 | C13H16O9 | 315.0722 | 0.10 | 153.0194 (50); 152.0114 (100); 109.0295 (30); 108.0217 (40) | Protocatechuic acid Hexoside | 1,2,4,5 | [16,34,42,47] |
| 23 | 4.94 | 0.860 | 0.003 | 0.842 | 0.004 | 282 | NEG | 285.0616 | C12H14O8 | 285.0616 | 0.00 | 223.0613 (20); 209.0456 (40); 195.0663 (100); 137.0608 (30) | 3′-O-Methylfukiic acid (3-O-methyl (3′,4′-dihydroxybenzyl tartaric acid)) | 1,2,3,4,5 | [16,35] |
| 24 | 12.80 | 0.824 | 0.006 | 0.742 | 0.022 | 270; 340 | POS | 595.1658 | C27H30O15 | 595.1657 | −0.10 | 287.0551 | Kaempferol derivative | 1,2,4,5 | [10,15,48] |
| ORGANIC ACIDS | |||||||||||||||
| 25 | 1.07 | 0.732 | 0.025 | 0.735 | 0.024 | POS | 241.1546 | C12H20N2O3 | 241.1547 | 0.10 | 241.1546 (100); 242.1585 (10); 196.0965 (1); 168.0365 (1); 128.1069 (5); 84.0444 (5) | Hydroxy aspergillic acid | 1,6 | ||
| 26 | 2.87 | 0.907 | 0.001 | 0.816 | 0.007 | POS | 305.0768 | C14H12N2O6 | 305.0779 | 1.10 | 215.0814 (20); 190.0499 (50); 172.0394 (100); 144.0444 (10) | Kynurenic acid derivative | 1 | [38,39] | |
| 27 | 4.35 | 0.902 | 0.001 | 0.843 | 0.004 | NEG | 380.1552 | C15H27O10N | 380.1562 | 1.00 | 362.1441 (10); 308.1351 (20); 218.1036 (10); 146.0822(90) | Pantothenic acid hexoside | 1,5,6 | [41,42] | |
| TERPENOIDS | |||||||||||||||
| 28 | 6.14 | 0.778 | 0.013 | 0.769 | 0.016 | NEG | 403.1602 | C18H28O10 | 403.1599 | −0.30 | 403.1602 (100); 223.0976 (5); 179.1077 (5); 161.0455 (10); 59.0138 (50) | 8-β-D-glucopyranosyloxy-2,7-dimethyl-2,4-decadiene-1,10-dioic acid | 1,4 | [16] | |
| 29 | 6.25 | 0.780 | 0.013 | 0.751 | 0.020 | NEG | 887.3914 (443.1916) | C21H32O10 | 443.1923 | 0.70 | 281.1314 (1); 237.1497 (5); 219.1391 (10); 161.0454 (10); 101.0244 (70) | Dihydrophaseic acid 4’-O-β-D-glucopyranoside | 1,4 | [16,19,21] | |
| 0.834 | 0.005 | 0.781 | 0.013 | POS | 467.1887 (445.2068) | 445.2079 | 1.10 | 284.0916 (50); 143.0563 (100) | |||||||
| OTHERS | |||||||||||||||
| 30 | 0.74 | 0.921 | 0.000 | 0.877 | 0.002 | POS | 221.1859 | C10H24N2O3 | 221.1860 | 0.10 | 104.1071 (100); 60.0808 (1); 58.0657 (1) | Choline derivative | 1 | ||
| 31 | 15.98 | 0.765 | 0.016 | 0.654 | 0.056 | NEG | 447.2228 | C21H36O10 | 447.2236 | 0.80 | 315.1812 (20); 191.0564 (10); 161.0456 (70); 149.0456 (5); 143.0347 (10); 131.0349 (5); 113.0244 (70); 101.0244 (100) | Geraniol pentoside hexoside (unknow isomer) | 1,6 | [45] | |
| UNIDENTIFIED COMPOUNDS | |||||||||||||||
| 32 | 0.87 | 0.788 | 0.012 | 0.683 | 0.042 | NEG | 545.1620 | ND | - | - | 201.0709 (20); 196.0614 (30); 142.0509 (100); 100.0404 (40) | Unknown | |||
| 33 | 1.56 | 0.877 | 0.002 | 0.636 | 0.066 | POS | 317.1092 | C11H16N4O7 | 317.1103 | 1.10 | 155.0564 (100) | Unknown | |||
| 34 | 2.16 | 0.902 | 0.001 | 0.747 | 0.021 | POS | 374,1446 | C16H23NO9 | 374.1457 | 1.10 | 212.0918 (90); 195.0652 (90); 153.0547 (20); 152.0707 (100); 85.0284 (40); 69.0335 (10) | Unknown | |||
| 35 | 6.46 | 0.792 | 0.011 | 0.738 | 0.023 | POS | 242.0803 (483.1538) | ND | - | - | 363.1116 (30); 339.1116 (30); 321.1010 (100); 303.0902 (40) | Unknown (+ hexoside) | |||
| 36 | 6.46 | 0.846 | 0.004 | 0.787 | 0.012 | POS | 490.2646 | C23H39NO10 | 490.2647 | 0.10 | 462.0538 (20); 320.0827 (90); 311.0769 (100); 265.1437 (40); 247.1310 (20) | Unknown | |||
| 37 | 6.46 | 0.854 | 0.003 | 0.779 | 0.013 | POS | 942.3170 | ND | - | - | 499.1261 (10); 378.0767 (80); 320.0706 (100) | Unknown | |||
| 38 | 6.46 | 0.863 | 0.003 | 0.772 | 0.015 | POS | 927.3515 | ND | - | - | 483.1540 (100); 363.1117 (40) | ||||
| 39 | 7.86 | 0.741 | 0.022 | 0.708 | 0.033 | NEG | 161.0819 | C7H14O4 | 161.0819 | 0.00 | 117.0557 (50); 99.0451 (50); 71.0502 (20) | Unknown | |||
| 40 | 11.82 | 0.748 | 0.021 | 0.683 | 0.043 | NEG | 561.2550 | C26H42O13 | 561.2553 | 0.30 | 519.2444 (80); 387.2013 (100); 207.1386 (40); 191.0561 (40); 161.0454 (40); 113.0244 (30); 101.0244 (50); 99.0087 (70); 89.0244 (50); 71.0138 (40) | Unknown | |||
| 41 | 12.38 | 0.824 | 0.006 | 0.777 | 0.014 | NEG | 529.2652 | C26H42O11 | 529.2654 | 0.20 | - | Unknown | |||
| 42 | 14.21 | 0.888 | 0.001 | 0.820 | 0.007 | NEG | 224.0120 | C10H8ClNO3 | 224.0120 | 0.00 | 180.0222 (70) | Unknown | |||
3.3. Non-Volatile Compounds Potentially Responsible for Faba Bean Bitterness
4. Conclusions
Supplementary Materials
Author Contributions
Funding
Institutional Review Board Statement
Informed Consent Statement
Data Availability Statement
Acknowledgments
Conflicts of Interest
References
- Willett, W.; Rockström, J.; Loken, B.; Springmann, M.; Lang, T.; Vermeulen, S.; Garnett, T.; Tilman, D.; DeClerck, F.; Wood, A.; et al. Food in the Anthropocene: The EAT–Lancet Commission on Healthy Diets from Sustainable Food Systems. Lancet 2019, 393, 447–492. [Google Scholar] [CrossRef]
- Sharan, S.; Zanghelini, G.; Zotzel, J.; Bonerz, D.; Aschoff, J.; Saint-Eve, A.; Maillard, M.-N. Fava Bean (Vicia faba L.) for Food Applications: From Seed to Ingredient Processing and Its Effect on Functional Properties, Antinutritional Factors, Flavor, and Color. Compr. Rev. Food Sci. Food Saf. 2021, 20, 401–428. [Google Scholar] [CrossRef] [PubMed]
- Mayer Labba, I.-C.; Frøkiær, H.; Sandberg, A.-S. Nutritional and Antinutritional Composition of Fava Bean (Vicia faba L., Var. Minor) Cultivars. Food Res. Int. 2021, 140, 110038. [Google Scholar] [CrossRef] [PubMed]
- Roland, W.S.U.; Pouvreau, L.; Curran, J.; van de Velde, F.; de Kok, P.M.T. Flavor Aspects of Pulse Ingredients. Cereal Chem. 2017, 94, 58–65. [Google Scholar] [CrossRef]
- Amarowicz, R.; Troszyńska, A.; Baryłko-Pikielna, N.; Shahidi, F. Polyphenolics Extracts from Legume Seeds: Correlations Between Total Antioxidant Activity, Total Phenolics Content, Tannins Content and Astringency. J. Food Lipids 2004, 11, 278–286. [Google Scholar] [CrossRef]
- Khrisanapant, P.; Kebede, B.; Leong, S.Y.; Oey, I. A Comprehensive Characterisation of Volatile and Fatty Acid Profiles of Legume Seeds. Foods 2019, 8, 651. [Google Scholar] [CrossRef] [PubMed]
- Karolkowski, A.; Gourrat, K.; Bouzidi, E.; Albouy, J.-F.; Levavasseur, L.; Briand, L.; Guichard, E.; Salles, C. Origins of Volatile Compounds and Identification of Odour-Active Compounds in Air-Classified Fractions of Faba Bean (Vicia faba L. Minor). Food Res. Int. 2023, 163, 112260. [Google Scholar] [CrossRef]
- Tuccillo, F.; Kantanen, K.; Wang, Y.; Martin Ramos Diaz, J.; Pulkkinen, M.; Edelmann, M.; Knaapila, A.; Jouppila, K.; Piironen, V.; Lampi, A.-M.; et al. The Flavor of Faba Bean Ingredients and Extrudates: Chemical and Sensory Properties. Food Res. Int. 2022, 162, 112036. [Google Scholar] [CrossRef]
- Karolkowski, A.; Belloir, C.; Briand, L.; Salles, C. Non-Volatile Compounds Involved in Bitterness and Astringency of Pulses: A Review. Molecules 2023, 28, 3298. [Google Scholar] [CrossRef]
- Cosson, A.; Meudec, E.; Ginies, C.; Danel, A.; Lieben, P.; Descamps, N.; Cheynier, V.; Saint-Eve, A.; Souchon, I. Identification and Quantification of Key Phytochemicals in Peas—Linking Compounds with Sensory Attributes. Food Chem. 2022, 385, 132615. [Google Scholar] [CrossRef]
- Cosson, A.; Oliveira Correia, L.; Descamps, N.; Saint-Eve, A.; Souchon, I. Identification and Characterization of the Main Peptides in Pea Protein Isolates Using Ultra High-Performance Liquid Chromatography Coupled with Mass Spectrometry and Bioinformatics Tools. Food Chem. 2022, 367, 130747. [Google Scholar] [CrossRef] [PubMed]
- Heng, L.; Vincken, J.-P.; van Koningsveld, G.; Legger, A.; Gruppen, H.; van Boekel, T.; Roozen, J.; Voragen, F. Bitterness of Saponins and Their Content in Dry Peas. J. Sci. Food Agric. 2006, 86, 1225–1231. [Google Scholar] [CrossRef]
- Gläser, P.; Mittermeier-Kleßinger, V.K.; Spaccasassi, A.; Hofmann, T.; Dawid, C. Quantification and Bitter Taste Contribution of Lipids and Their Oxidation Products in Pea-Protein Isolates (Pisum sativum L.). J. Agric. Food Chem. 2021, 69, 8768–8776. [Google Scholar] [CrossRef] [PubMed]
- Dupont, M.S.; Muzquiz, M.; Estrella, I.; Fenwick, G.R.; Price, K.R. Relationship between the Sensory Properties of Lupin Seed with Alkaloid and Tannin Content. J. Sci. Food Agric. 1994, 65, 95–100. [Google Scholar] [CrossRef]
- Neugart, S.; Rohn, S.; Schreiner, M. Identification of Complex, Naturally Occurring Flavonoid Glycosides in Vicia faba and Pisum sativum Leaves by HPLC-DAD-ESI-MSn and the Genotypic Effect on Their Flavonoid Profile. Food Res. Int. 2015, 76, 114–121. [Google Scholar] [CrossRef]
- Abu-Reidah, I.M.; Contreras, M.d.M.; Arráez-Román, D.; Fernández-Gutiérrez, A.; Segura Carretero, A. UHPLC-ESI-QTOF-MS Based Metabolic Profiling of Vicia faba L. (Fabaceae) Seeds as a Key Strategy for Characterization in Foodomics. Electrophoresis 2014, 35, 1571–1581. [Google Scholar] [CrossRef]
- Abu-Reidah, I.M.; Arráez-Román, D.; Warad, I.; Fernández-Gutiérrez, A.; Segura-Carretero, A. UHPLC/MS2-Based Approach for the Comprehensive Metabolite Profiling of Bean (Vicia faba L.) by-Products: A Promising Source of Bioactive Constituents. Food Res. Int. 2017, 93, 87–96. [Google Scholar] [CrossRef]
- Mekky, R.H.; Thabet, M.M.; Rodríguez-Pérez, C.; Elnaggar, D.M.Y.; Mahrous, E.A.; Segura-Carretero, A.; Abdel-Sattar, E. Comparative Metabolite Profiling and Antioxidant Potentials of Seeds and Sprouts of Three Egyptian Cultivars of Vicia faba L. Food Res. Int. 2020, 136, 109537. [Google Scholar] [CrossRef]
- Valente, I.M.; Cabrita, A.R.J.; Malushi, N.; Oliveira, H.M.; Papa, L.; Rodrigues, J.A.; Fonseca, A.J.M.; Maia, M.R.G. Unravelling the Phytonutrients and Antioxidant Properties of European Vicia faba L. Seeds. Food Res. Int. 2019, 116, 888–896. [Google Scholar] [CrossRef]
- Valente, I.M.; Maia, M.R.G.; Malushi, N.; Oliveira, H.M.; Papa, L.; Rodrigues, J.A.; Fonseca, A.J.M.; Cabrita, A.R.J. Profiling of Phenolic Compounds and Antioxidant Properties of European Varieties and Cultivars of Vicia faba L. Pods. Phytochemistry 2018, 152, 223–229. [Google Scholar] [CrossRef]
- Kowalczyk, M.; Rolnik, A.; Adach, W.; Kluska, M.; Juszczak, M.; Grabarczyk, Ł.; Wozniak, K.; Olas, B.; Stochmal, A. Multifunctional Compounds in the Extract from Mature Seeds of Vicia faba Var. Minor: Phytochemical Profiling, Antioxidant Activity and Cellular Safety in Human Selected Blood Cells in in Vitro Trials. Biomed. Pharmacother. 2021, 139, 111718. [Google Scholar] [CrossRef] [PubMed]
- Purves, R.W.; Zhang, H.; Khazaei, H.; Vandenberg, A. Rapid Analysis of Medically Relevant Compounds in Faba Bean Seeds Using FAIMS and Mass Spectrometry. Int. J. Ion Mobil. Spectrom. 2017, 20, 125–135. [Google Scholar] [CrossRef]
- Karolkowski, A.; Belloir, C.; Lucchi, G.; Martin, C.; Bouzidi, E.; Levavasseur, L.; Salles, C.; Briand, L. Activation of Bitter Taste Receptors by Saponins and Alkaloids Identified in Faba Beans (Vicia faba L. Minor). Food Chem. 2023, 426, 136548. [Google Scholar] [CrossRef]
- Aisala, H.; Manninen, H.; Laaksonen, T.; Linderborg, K.M.; Myoda, T.; Hopia, A.; Sandell, M. Linking Volatile and Non-Volatile Compounds to Sensory Profiles and Consumer Liking of Wild Edible Nordic Mushrooms. Food Chem. 2020, 304, 125403. [Google Scholar] [CrossRef] [PubMed]
- Karolkowski, A.; Martin, C.; Bouzidi, E.; Albouy, J.-F.; Levavasseur, L.; Briand, L.; Salles, C. Heat Treatment, Cultivar and Formulation Modify the Sensory Properties and Consumer Acceptability of Gels Containing Faba Bean (Vicia faba L. Minor) Protein Concentrates. Foods 2022, 11, 3018. [Google Scholar] [CrossRef]
- Mané, C.; Souquet, J.M.; Ollé, D.; Verriés, C.; Véran, F.; Mazerolles, G.; Cheynier, V.; Fulcrand, H. Optimization of Simultaneous Flavanol, Phenolic Acid, and Anthocyanin Extraction from Grapes Using an Experimental Design: Application to the Characterization of Champagne Grape Varieties. J. Agric. Food Chem. 2007, 55, 7224–7233. [Google Scholar] [CrossRef] [PubMed]
- Arapitsas, P.; Mattivi, F. LC-MS Untargeted Protocol for the Analysis of Wine. In Metabolic Profiling: Methods and Protocols; Theodoridis, G.A., Gika, H.G., Wilson, I.D., Eds.; Methods in Molecular Biology; Springer: New York, NY, USA, 2018; pp. 225–235. ISBN 978-1-4939-7643-0. [Google Scholar]
- Pulkkinen, M.; Gautam, M.; Lampi, A.-M.; Ollilainen, V.; Stoddard, F.; Sontag-Strohm, T.; Salovaara, H.; Piironen, V. Determination of Vicine and Convicine from Faba Bean with an Optimized High-Performance Liquid Chromatographic Method. Food Res. Int. 2015, 76, 168–177. [Google Scholar] [CrossRef]
- Piraud, M.; Vianey-Saban, C.; Petritis, K.; Elfakir, C.; Steghens, J.-P.; Morla, A.; Bouchu, D. ESI-MS/MS Analysis of Underivatised Amino Acids: A New Tool for the Diagnosis of Inherited Disorders of Amino Acid Metabolism. Fragmentation Study of 79 Molecules of Biological Interest in Positive and Negative Ionisation Mode. Rapid Commun. Mass Spectrom. 2003, 17, 1297–1311. [Google Scholar] [CrossRef]
- Nikolić, D.; Gödecke, T.; Chen, S.-N.; White, J.; Lankin, D.C.; Pauli, G.F.; van Breemen, R.B. Mass Spectrometric Dereplication of Nitrogen-Containing Constituents of Black Cohosh (Cimicifuga racemosa L.). Fitoterapia 2012, 83, 441–460. [Google Scholar] [CrossRef]
- Li, H.; Qin, Q.; Shi, X.; He, J.; Xu, G. Modified Metabolites Mapping by Liquid Chromatography-High Resolution Mass Spectrometry Using Full Scan/All Ion Fragmentation/Neutral Loss Acquisition. J. Chromatogr. A 2019, 1583, 80–87. [Google Scholar] [CrossRef]
- Chen, L.; Wu, Q.; He, T.; Lan, J.; Ding, L.; Liu, T.; Wu, Q.; Pan, Y.; Chen, T. Transcriptomic and Metabolomic Changes Triggered by Fusarium solani in Common Bean (Phaseolus vulgaris L.). Genes 2020, 11, 177. [Google Scholar] [CrossRef] [PubMed]
- Alghamdi, S.S. Chemical Composition of Faba Bean (Vicia faba L.) Genotypes under Various Water Regimes. Pak. J. Nutr. 2009, 8, 447–482. [Google Scholar]
- Abu-Reidah, I.M.; Arráez-Román, D.; Segura-Carretero, A.; Fernández-Gutiérrez, A. Extensive Characterisation of Bioactive Phenolic Constituents from Globe Artichoke (Cynara scolymus L.) by HPLC–DAD-ESI-QTOF-MS. Food Chem. 2013, 141, 2269–2277. [Google Scholar] [CrossRef]
- Heller, W.; Tamm, C. Fukiinsäure Und 3′-O-Methyl-Fukiinsäure, Zwei Phenolische Hydroxycarbonsäuren Aus Piscidia Erythrina. Helv. Chim. Acta 1975, 58, 974–979. [Google Scholar] [CrossRef]
- Mabry, T.; Markham, K.R.; Thomas, M.B. The Systematic Identification of Flavonoids; Springer Science & Business Media: New York, NY, USA, 1970; ISBN 978-3-642-88458-0. [Google Scholar]
- Carvalho, L.G.; McDougall, G.; Allwood, W.; Sungurtas, J.; Verrall, S.; Stewart, D.; Neilson, K.; O’Byrne, M. Tissues and Industrial Co-Products Formed during Alginate Extraction from Laminaria Hyperborea Provide Different Metabolite Profiles Depending on Harvest Season. J. Appl. Phycol. 2023, 35, 849–865. [Google Scholar] [CrossRef]
- Wang, Y.; Sun, W.; Zheng, J.; Xu, C.; Wang, X.; Li, T.; Tang, Y.; Li, Z. Urinary Metabonomic Study of Patients with Acute Coronary Syndrome Using UPLC-QTOF/MS. J. Chromatogr. B 2018, 1100–1101, 122–130. [Google Scholar] [CrossRef]
- Zhang, Z.-H.; Zhao, Y.-Y.; Cheng, X.-L.; Lin, R.-C.; Dai, Z.; Zhou, C. Metabonomic Study of Biochemical Changes in the Rat Urine Induced by Pinellia ternata (Thunb.) Berit. J. Pharm. Biomed. Anal. 2013, 85, 186–193. [Google Scholar] [CrossRef]
- Novelli, S.; Gismondi, A.; Di Marco, G.; Canuti, L.; Nanni, V.; Canini, A. Plant Defense Factors Involved in Olea Europaea Resistance against Xylella Fastidiosa Infection. J. Plant Res. 2019, 132, 439–455. [Google Scholar] [CrossRef] [PubMed]
- Mintz-Oron, S.; Mandel, T.; Rogachev, I.; Feldberg, L.; Lotan, O.; Yativ, M.; Wang, Z.; Jetter, R.; Venger, I.; Adato, A.; et al. Gene Expression and Metabolism in Tomato Fruit Surface Tissues. Plant Physiol. 2008, 147, 823–851. [Google Scholar] [CrossRef]
- Mekky, R.H.; Contreras, M.d.M.; El-Gindi, M.R.; Abdel-Monem, A.R.; Abdel-Sattar, E.; Segura-Carretero, A. Profiling of Phenolic and Other Compounds from Egyptian Cultivars of Chickpea (Cicer arietinum L.) and Antioxidant Activity: A Comparative Study. RSC Adv. 2015, 5, 17751–17767. [Google Scholar] [CrossRef]
- Min, M.-H.; Park, J.-H.; Hur, J.-H.; Shin, H.-C.; Cho, Y.; Kim, D.-D. Formulation and Bioequivalence Studies of Choline Alfoscerate Tablet Comparing with Soft Gelatin Capsule in Healthy Male Volunteers. Drug Des. Dev. Ther. 2019, 13, 1049–1058. [Google Scholar] [CrossRef] [PubMed]
- Hefni, M.; McEntyre, C.; Lever, M.; Slow, S. A Simple HPLC Method with Fluorescence Detection for Choline Quantification in Foods. Food Anal. Methods 2015, 8, 2401–2408. [Google Scholar] [CrossRef]
- Dong, L.; Miettinen, K.; Goedbloed, M.; Verstappen, F.W.A.; Voster, A.; Jongsma, M.A.; Memelink, J.; van der Krol, S.; Bouwmeester, H.J. Characterization of Two Geraniol Synthases from Valeriana officinalis and Lippia dulcis: Similar Activity but Difference in Subcellular Localization. Metab. Eng. 2013, 20, 198–211. [Google Scholar] [CrossRef]
- Jayeoye, T.J.; Eze, F.N.; Olatunji, O.J.; Tyopine, A.A. Synthesis of Biocompatible Konjac Glucomannan Stabilized Silver Nanoparticles, with Asystasia Gangetica Phenolic Extract for Colorimetric Detection of Mercury (II) Ion. Sci. Rep. 2022, 12, 9176. [Google Scholar] [CrossRef] [PubMed]
- Saied, D.B.; Farag, M.A. How Does Maturity Stage Affect Seeds Metabolome via UPLC/MS Based Molecular Networking and Chemometrics and in Relation to Antioxidant Effect? A Case Study in 4 Major Cereals and Legumes. Food Chem. 2023, 426, 136491. [Google Scholar] [CrossRef]
- García-Cayuela, T.; Gómez-Maqueo, A.; Guajardo-Flores, D.; Welti-Chanes, J.; Cano, M.P. Characterization and Quantification of Individual Betalain and Phenolic Compounds in Mexican and Spanish Prickly Pear (Opuntia ficus-Indica L. Mill) Tissues: A Comparative Study. J. Food Compos. Anal. 2019, 76, 1–13. [Google Scholar] [CrossRef]
- Chambers, E.; Koppel, K. Associations of Volatile Compounds with Sensory Aroma and Flavor: The Complex Nature of Flavor. Molecules 2013, 18, 4887–4905. [Google Scholar] [CrossRef]
- Bufe, B.; Hofmann, T.; Krautwurst, D.; Raguse, J.-D.; Meyerhof, W. The Human TAS2R16 Receptor Mediates Bitter Taste in Response to β-Glucopyranosides. Nat. Genet. 2002, 32, 397–401. [Google Scholar] [CrossRef]
- Bassoli, A.; Borgonovo, G.; Caremoli, F.; Mancuso, G. The Taste of D- and L-Amino Acids: In Vitro Binding Assays with Cloned Human Bitter (TAS2Rs) and Sweet (TAS1R2/TAS1R3) Receptors. Food Chem. 2014, 150, 27–33. [Google Scholar] [CrossRef]
- Kohl, S.; Behrens, M.; Dunkel, A.; Hofmann, T.; Meyerhof, W. Amino Acids and Peptides Activate at Least Five Members of the Human Bitter Taste Receptor Family. J. Agric. Food Chem. 2013, 61, 53–60. [Google Scholar] [CrossRef]
- Ishibashi, N.; Sadamori, K.; Yamamoto, O.; Kanehisa, H.; Kouge, K.; Kikuchi, E.; Okai, H.; Fukui, S. Bitterness of Phenylalanine- and Tyrosine-Containing Peptides. Agric. Biol. Chem. 1987, 51, 3309–3313. [Google Scholar] [CrossRef]
- Melis, M.; Arca, M.; Aragoni, M.C.; Cabras, T.; Caltagirone, C.; Castagnola, M.; Crnjar, R.; Messana, I.; Tepper, B.J.; Barbarossa, I.T. Dose-Dependent Effects of L-Arginine on PROP Bitterness Intensity and Latency and Characteristics of the Chemical Interaction between PROP and L-Arginine. PLoS ONE 2015, 10, e0131104. [Google Scholar] [CrossRef] [PubMed]
- Ferrer-Gallego, R.; Hernández-Hierro, J.M.; Rivas-Gonzalo, J.C.; Escribano-Bailón, M.T. Sensory Evaluation of Bitterness and Astringency Sub-Qualities of Wine Phenolic Compounds: Synergistic Effect and Modulation by Aromas. Food Res. Int. 2014, 62, 1100–1107. [Google Scholar] [CrossRef]
- Roland, W.S.U.; van Buren, L.; Gruppen, H.; Driesse, M.; Gouka, R.J.; Smit, G.; Vincken, J.-P. Bitter Taste Receptor Activation by Flavonoids and Isoflavonoids: Modeled Structural Requirements for Activation of HTAS2R14 and HTAS2R39. J. Agric. Food Chem. 2013, 61, 10454–10466. [Google Scholar] [CrossRef]
- Takahashi, K.; Tadenuma, M.; Kitamoto, K.; Sato, S. L-Prolyl-l-Leucine Anhydride A Bitter Compound Formed in Aged Sake. Agric. Biol. Chem. 1974, 38, 927–932. [Google Scholar] [CrossRef]
- Wink, M. Chemical Defense of Lupins. Mollusc-Repellent Properties of Quinolizidine Alkaloids. Z. Für Naturforschung C 1984, 39, 553–558. [Google Scholar] [CrossRef]
- Ulyanych, O.; Poltoretskyi, S.; Liubych, V.; Yatsenko, A.; Yatsenko, V.; Lazariev, O.; Kravchenko, V. Effect of Surface Drip Irrigation and Cultivars on Physiological State and Productivity of Faba Bean Crop. J. Agric. Sci. 2021, 32, 139–149. [Google Scholar] [CrossRef]
- Rimando, A.M.; Duke, S.O. Natural Products for Pest Management. In Natural Products for Pest Management; ACS Symposium Series; American Chemical Society: Washington, DC, USA, 2006; Volume 927, pp. 2–21. ISBN 978-0-8412-3933-3. [Google Scholar]
- Huang, T.; Jander, G.; de Vos, M. Non-Protein Amino Acids in Plant Defense against Insect Herbivores: Representative Cases and Opportunities for Further Functional Analysis. Phytochemistry 2011, 72, 1531–1537. [Google Scholar] [CrossRef] [PubMed]
- Cheynier, V. Phenolic Compounds: From Plants to Foods. Phytochem. Rev. 2012, 11, 153–177. [Google Scholar] [CrossRef]
- Amaral, J.; Correia, B.; Escandón, M.; Jesus, C.; Serôdio, J.; Valledor, L.; Hancock, R.D.; Dinis, L.-T.; Gomez-Cadenas, A.; Alves, A.; et al. Temporal Physiological Response of Pine to Fusarium circinatum Infection Is Dependent on Host Susceptibility Level: The Role of ABA Catabolism. Tree Physiol. 2021, 41, 801–816. [Google Scholar] [CrossRef]
- Meyerhof, W.; Batram, C.; Kuhn, C.; Brockhoff, A.; Chudoba, E.; Bufe, B.; Appendino, G.; Behrens, M. The Molecular Receptive Ranges of Human TAS2R Bitter Taste Receptors. Chem. Senses 2010, 35, 157–170. [Google Scholar] [CrossRef] [PubMed]
- Yannai, S.; Marquardt, R.R. Induction of Favism-like Symptoms in the Rat: Effects of Vicine and Divicine in Normal and Buthionine Sulphoximine-Treated Rats. J. Sci. Food Agric. 1985, 36, 1161–1168. [Google Scholar] [CrossRef]

Disclaimer/Publisher’s Note: The statements, opinions and data contained in all publications are solely those of the individual author(s) and contributor(s) and not of MDPI and/or the editor(s). MDPI and/or the editor(s) disclaim responsibility for any injury to people or property resulting from any ideas, methods, instructions or products referred to in the content. |
© 2023 by the authors. Licensee MDPI, Basel, Switzerland. This article is an open access article distributed under the terms and conditions of the Creative Commons Attribution (CC BY) license (https://creativecommons.org/licenses/by/4.0/).
Share and Cite
Karolkowski, A.; Meudec, E.; Bruguière, A.; Mitaine-Offer, A.-C.; Bouzidi, E.; Levavasseur, L.; Sommerer, N.; Briand, L.; Salles, C. Faba Bean (Vicia faba L. minor) Bitterness: An Untargeted Metabolomic Approach to Highlight the Impact of the Non-Volatile Fraction. Metabolites 2023, 13, 964. https://doi.org/10.3390/metabo13080964
Karolkowski A, Meudec E, Bruguière A, Mitaine-Offer A-C, Bouzidi E, Levavasseur L, Sommerer N, Briand L, Salles C. Faba Bean (Vicia faba L. minor) Bitterness: An Untargeted Metabolomic Approach to Highlight the Impact of the Non-Volatile Fraction. Metabolites. 2023; 13(8):964. https://doi.org/10.3390/metabo13080964
Chicago/Turabian StyleKarolkowski, Adeline, Emmanuelle Meudec, Antoine Bruguière, Anne-Claire Mitaine-Offer, Emilie Bouzidi, Loïc Levavasseur, Nicolas Sommerer, Loïc Briand, and Christian Salles. 2023. "Faba Bean (Vicia faba L. minor) Bitterness: An Untargeted Metabolomic Approach to Highlight the Impact of the Non-Volatile Fraction" Metabolites 13, no. 8: 964. https://doi.org/10.3390/metabo13080964
APA StyleKarolkowski, A., Meudec, E., Bruguière, A., Mitaine-Offer, A.-C., Bouzidi, E., Levavasseur, L., Sommerer, N., Briand, L., & Salles, C. (2023). Faba Bean (Vicia faba L. minor) Bitterness: An Untargeted Metabolomic Approach to Highlight the Impact of the Non-Volatile Fraction. Metabolites, 13(8), 964. https://doi.org/10.3390/metabo13080964