


Effects of Heated Drinking Water during the Cold Season on Serum Biochemistry, Ruminal Fermentation, Bacterial Community, and Metabolome of Beef Cattle

 ,
,
Abstract
:1. Introduction
2. Materials and Methods
2.1. Animals, Design, and Management
2.2. Sample Collecion
2.3. Chemical Analysis
2.3.1. Serum Index
2.3.2. Rumen Fermentation Parameters
2.4. Rumen Microbiota Analysis
2.5. Non-Targeted Metabolomics Analysis
2.6. Statistical Analysis
3. Results
3.1. Serum Parameters
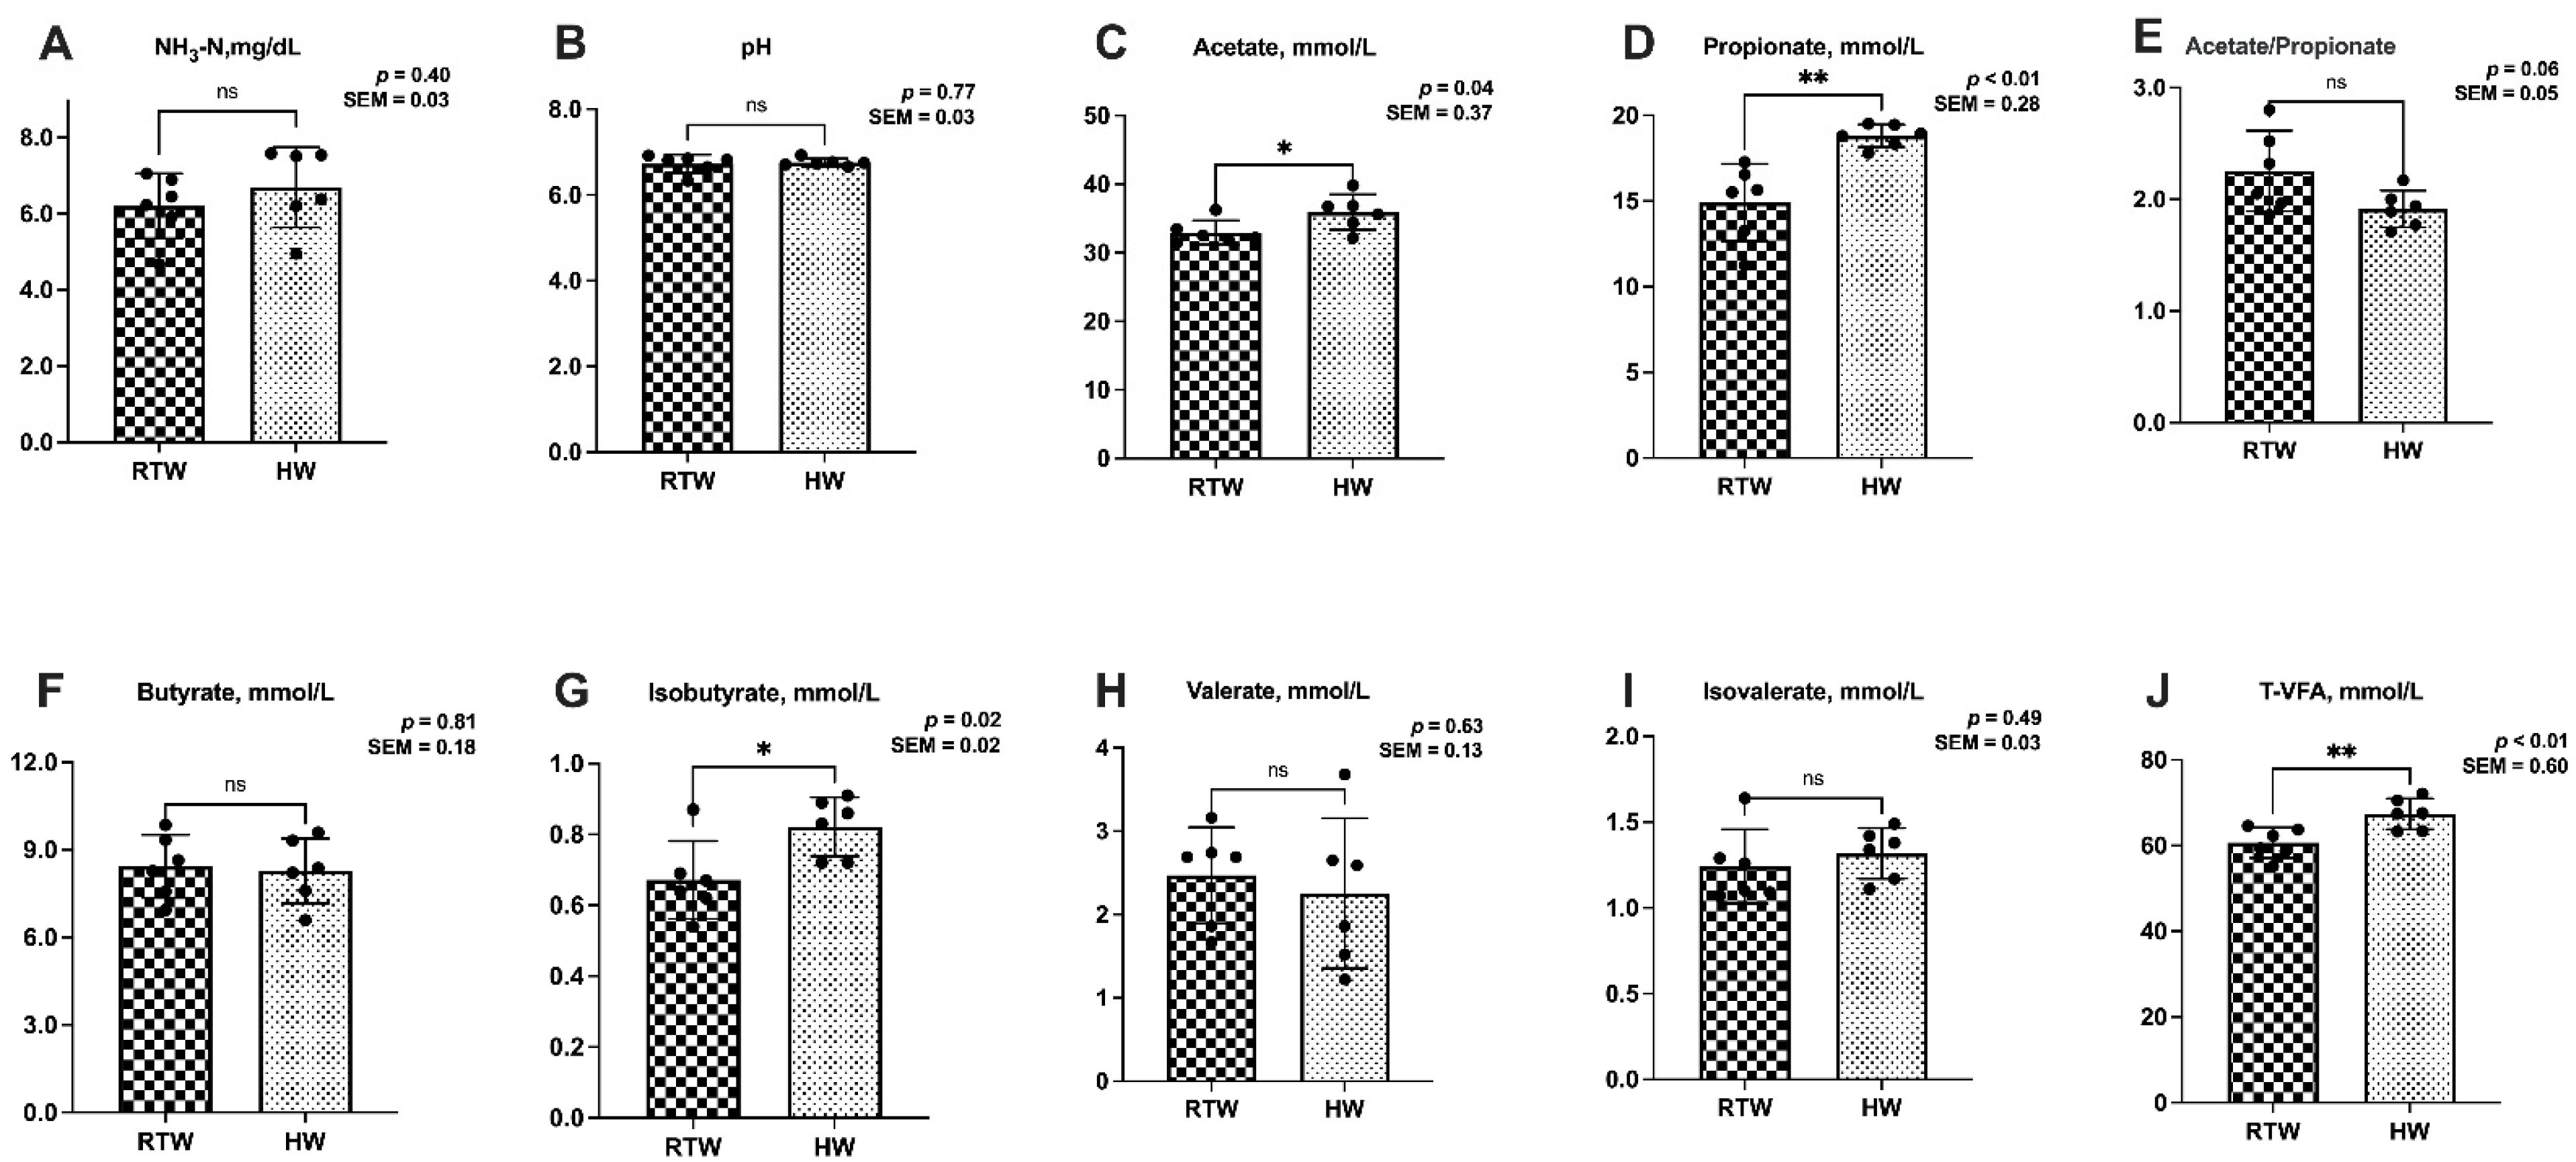
3.2. Rumen Fermentation Parameters
3.3. Bacterial Sequencing
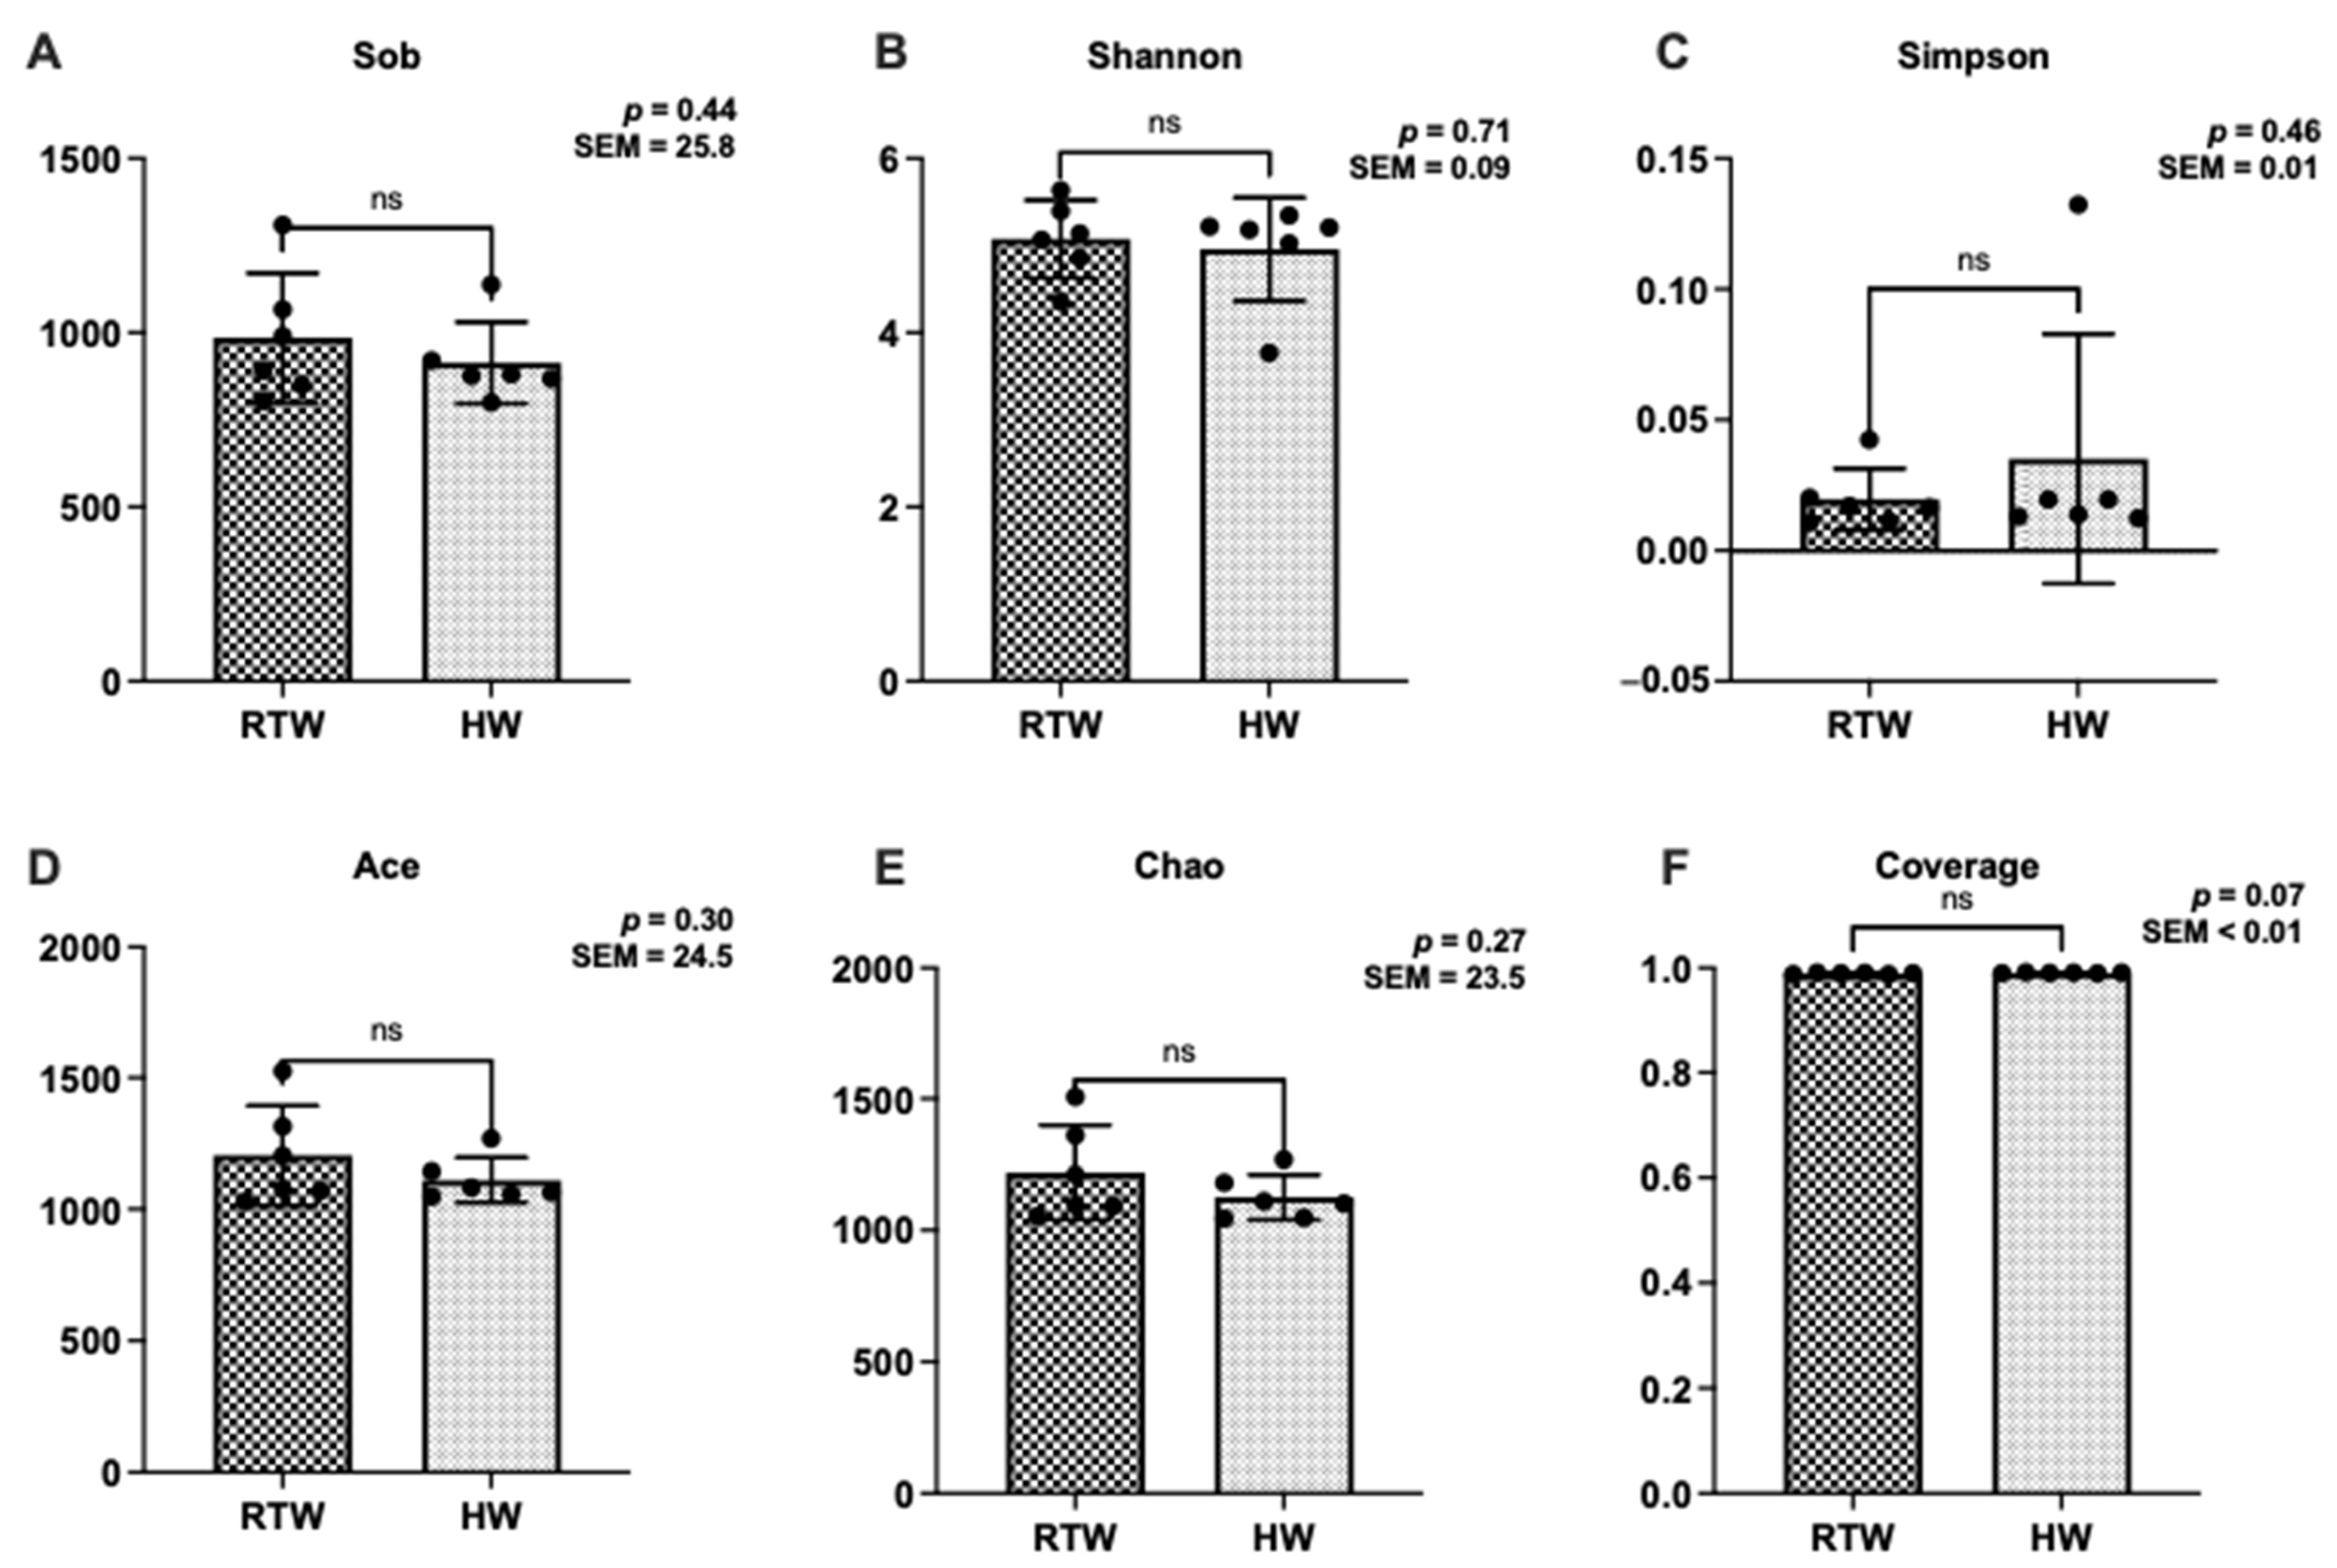
3.4. Bacterial α-Diversity
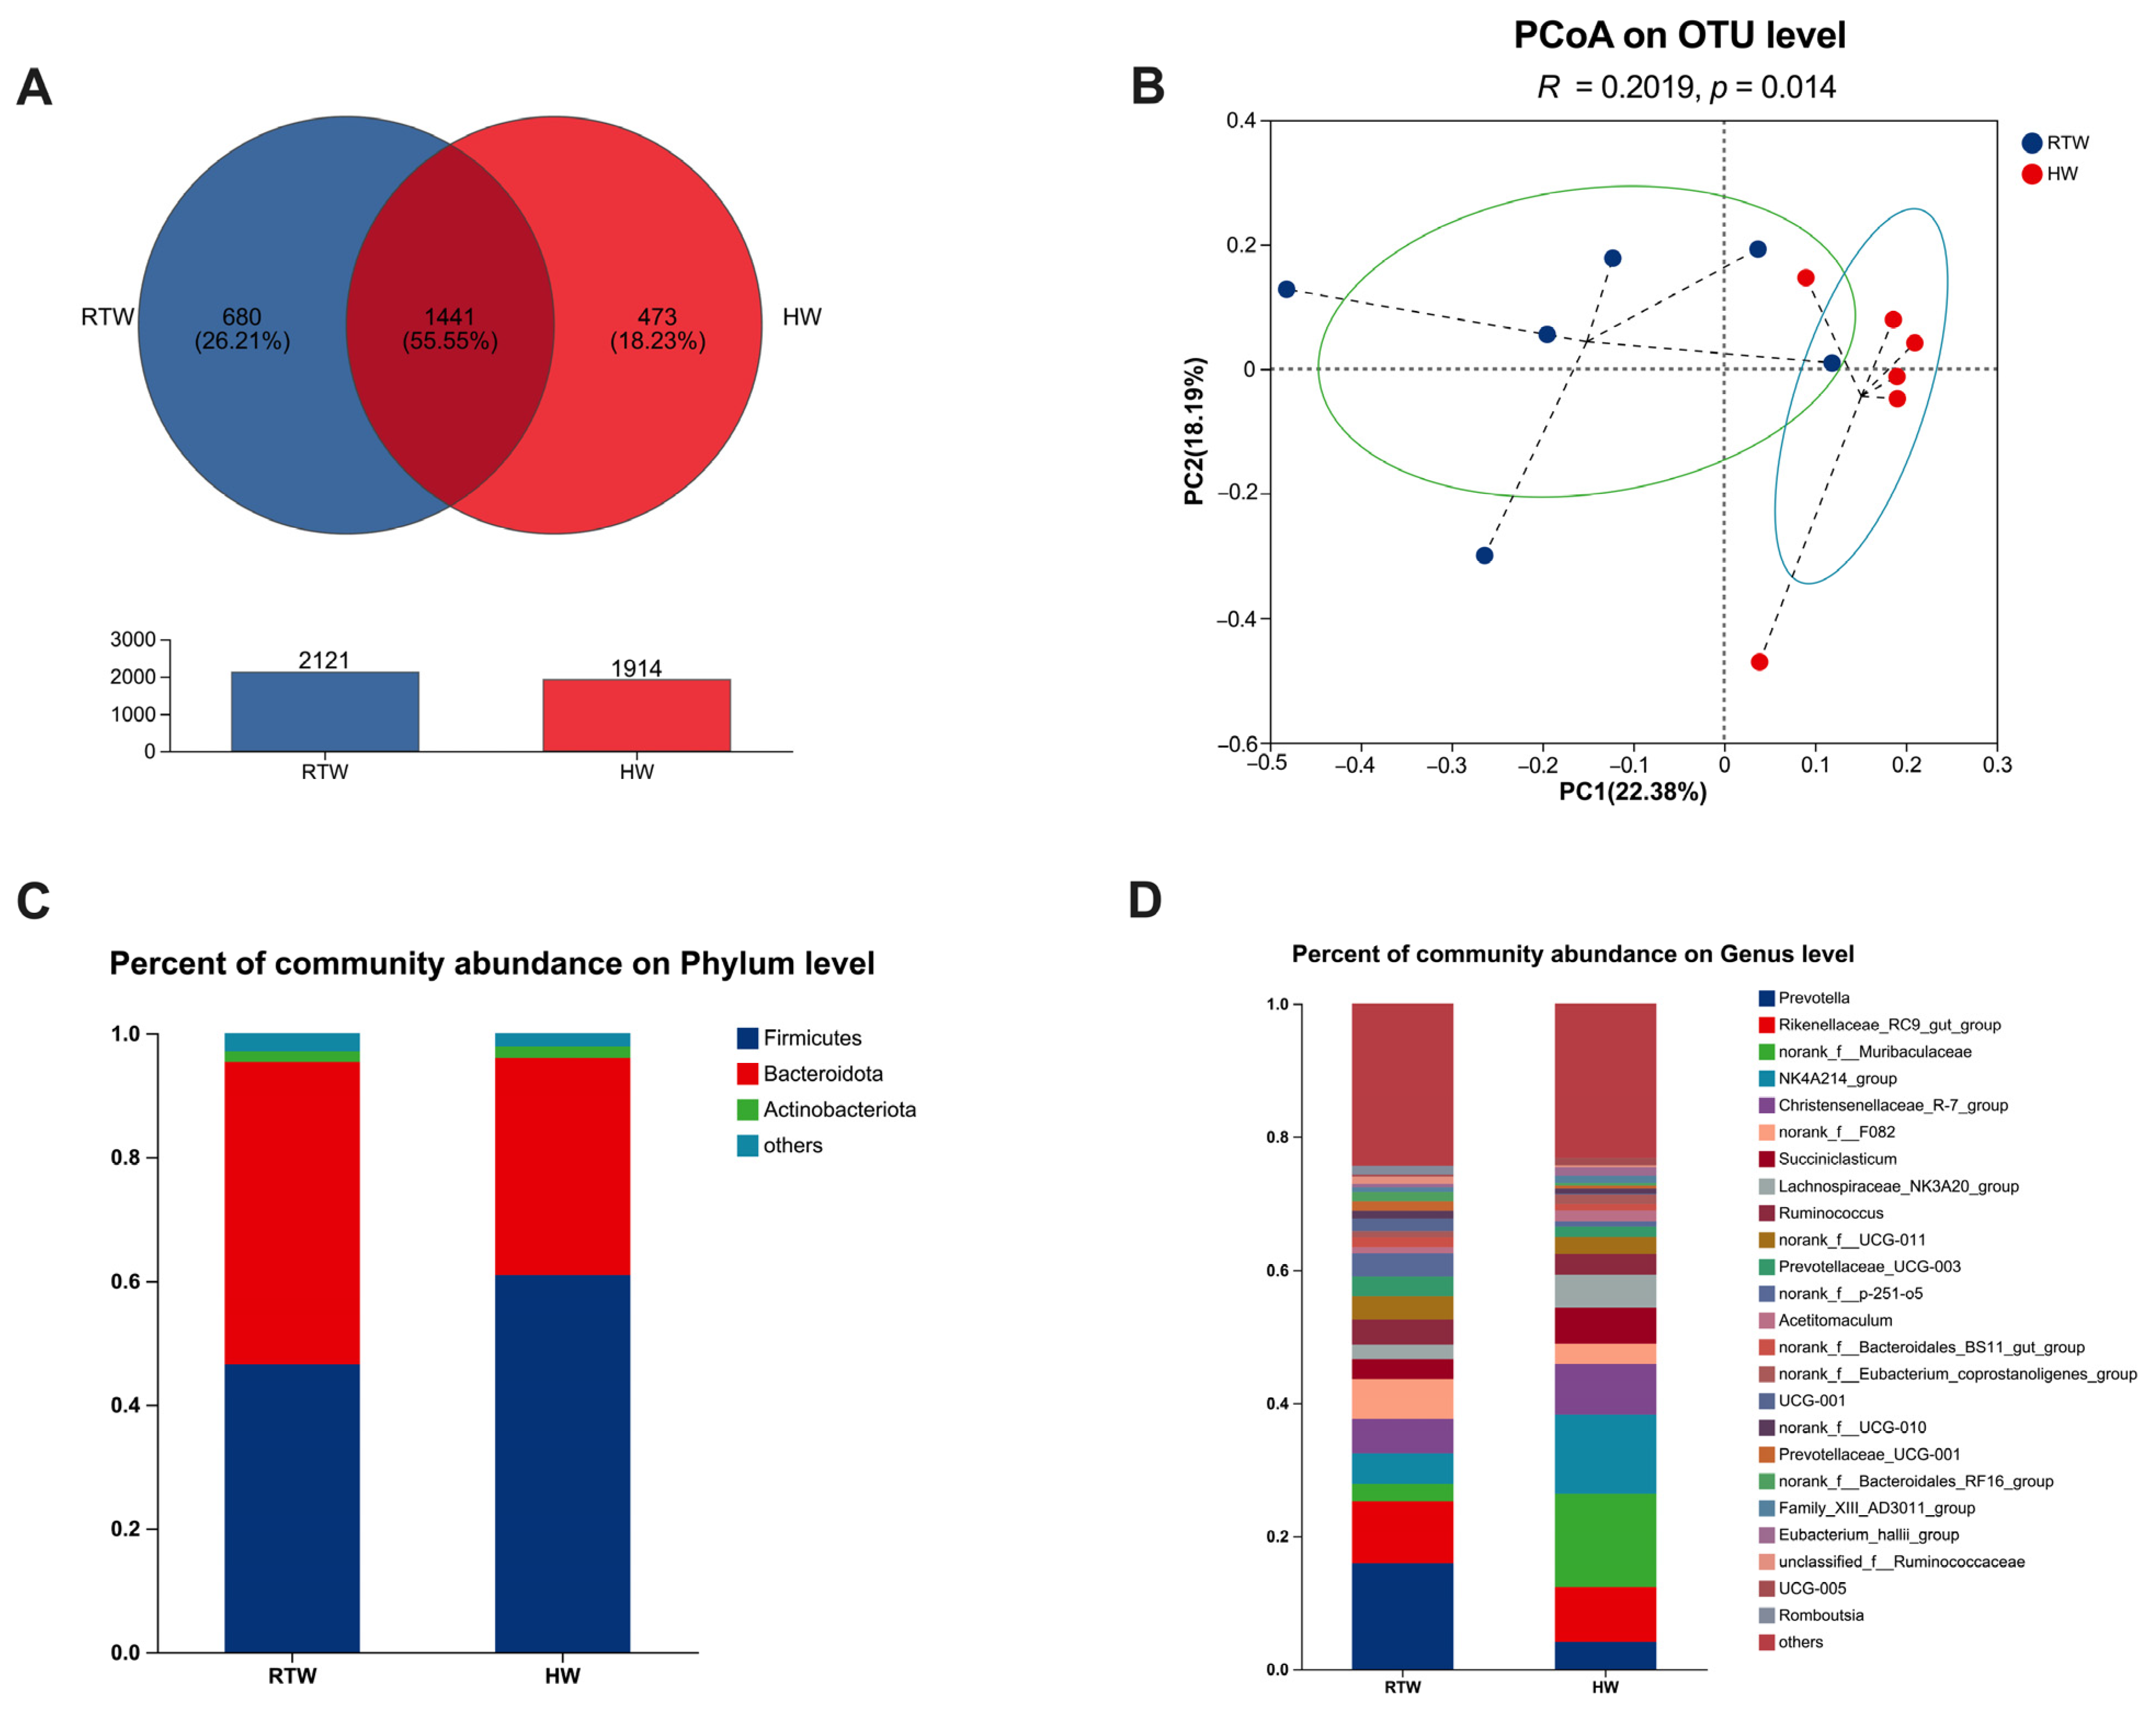
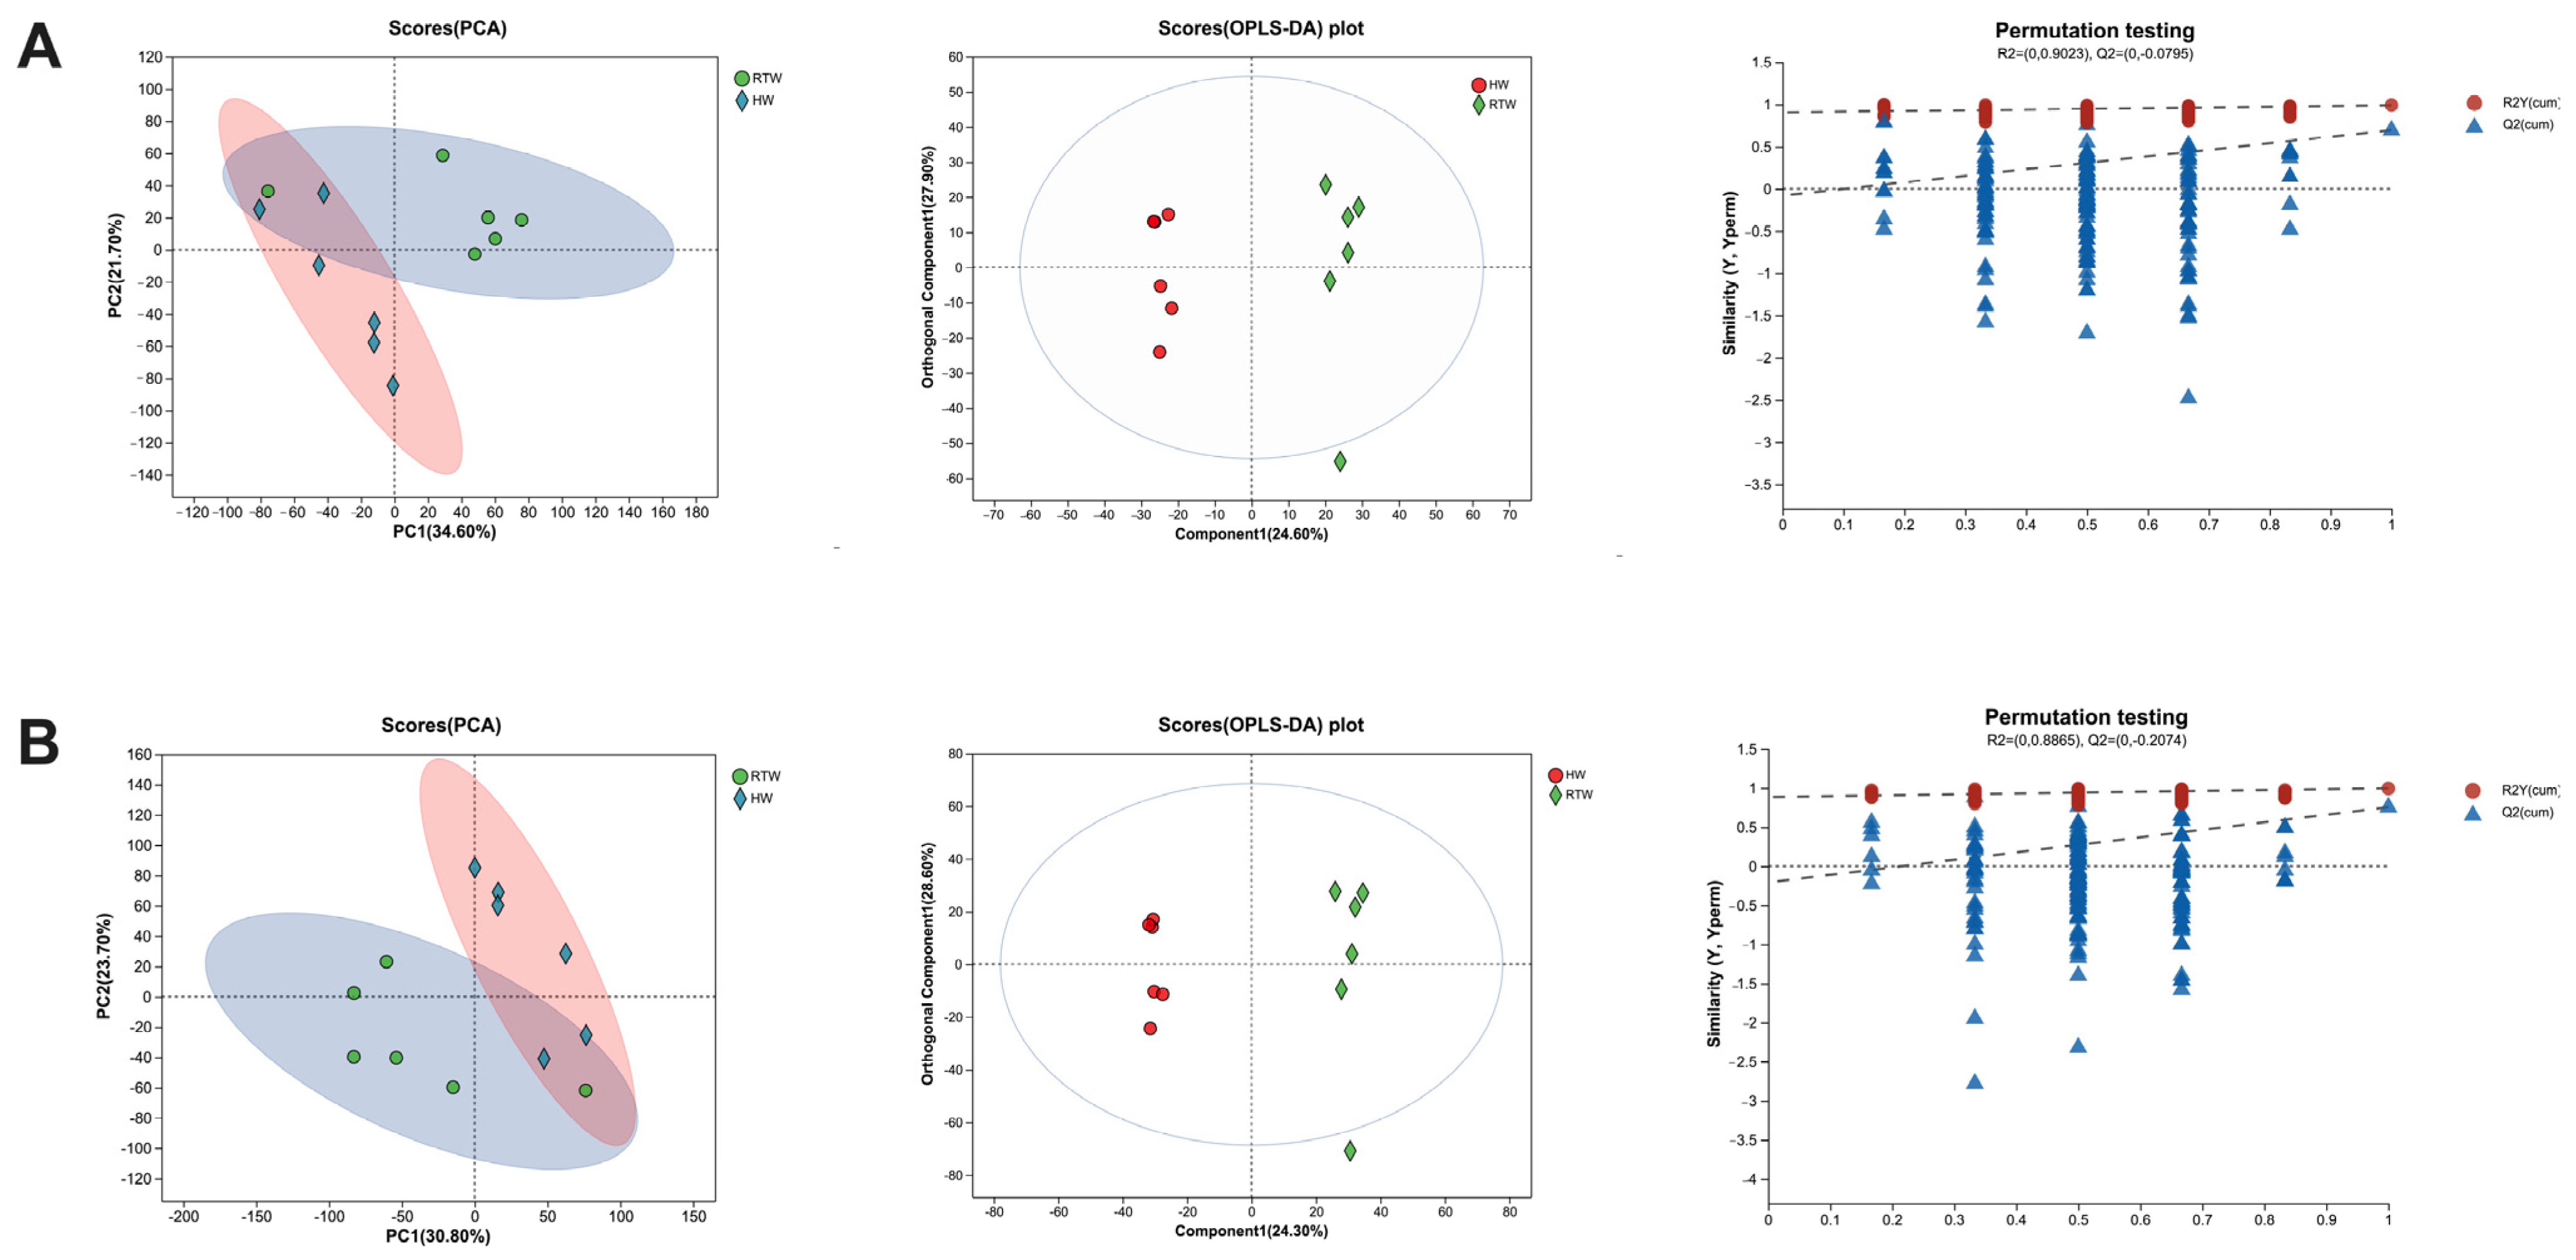
3.5. Bacterial Composition and β-Diversity Analysis
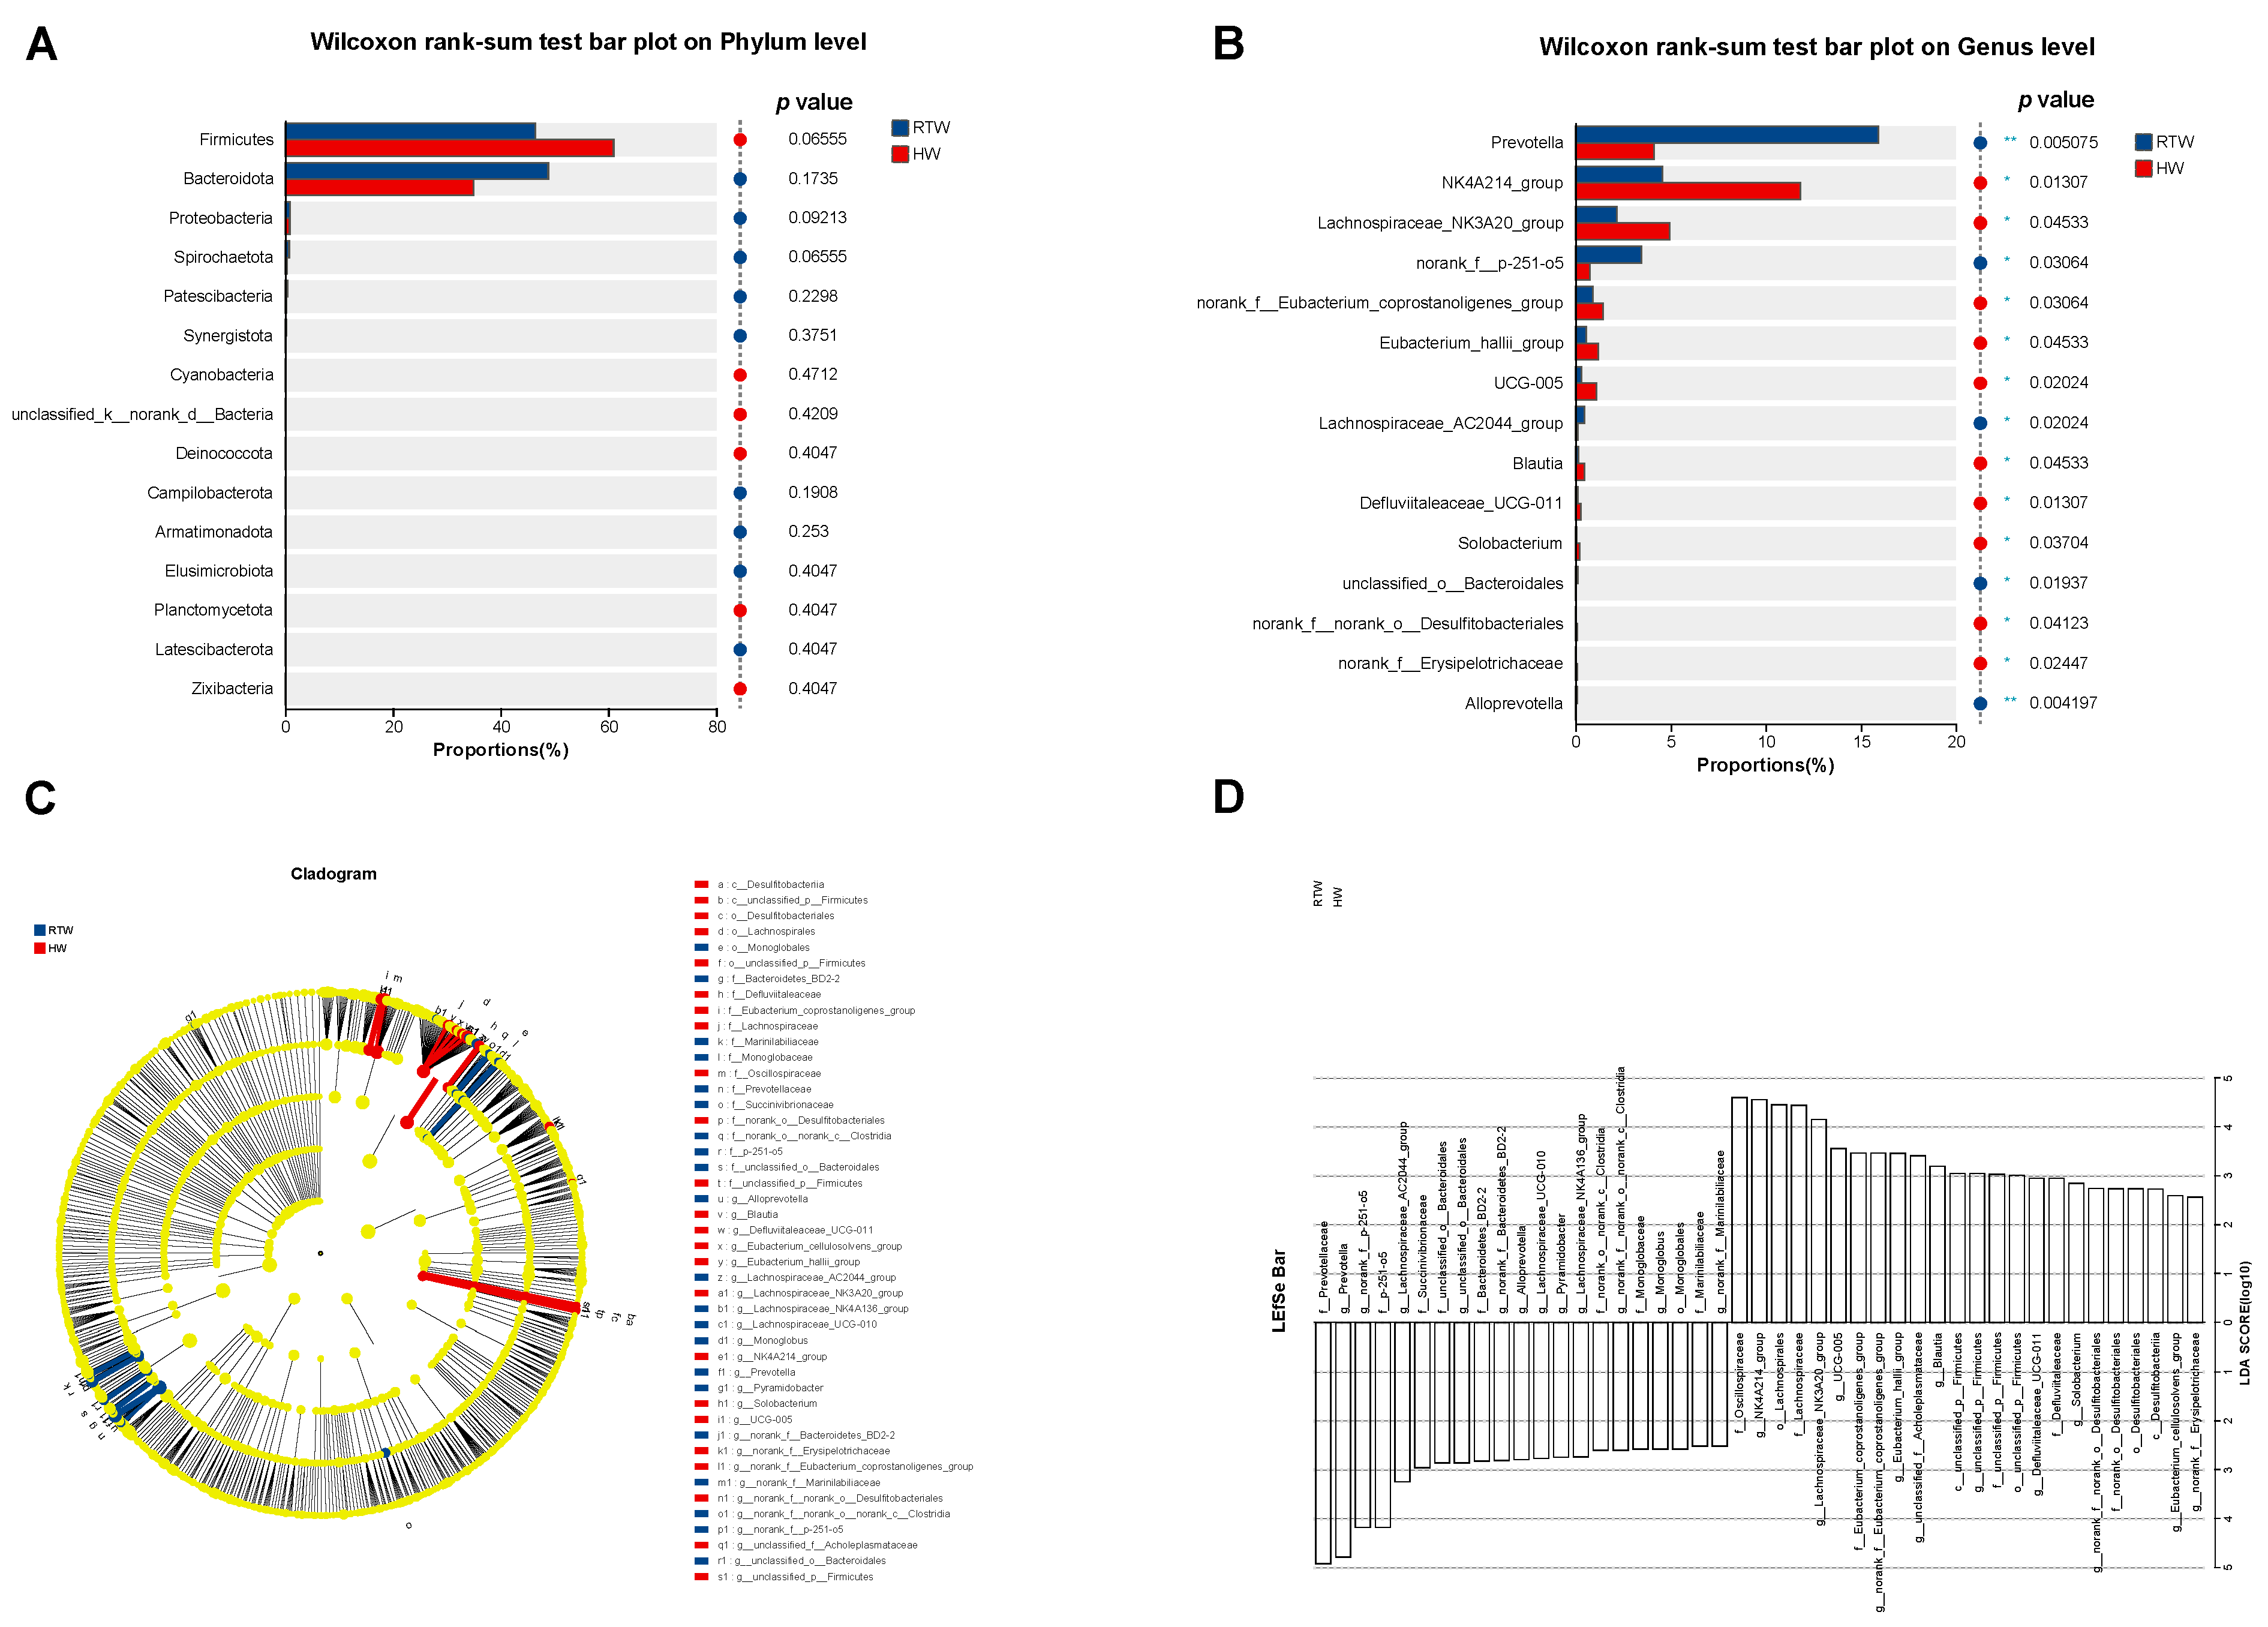
3.6. Bacterial Components Differences Analysis
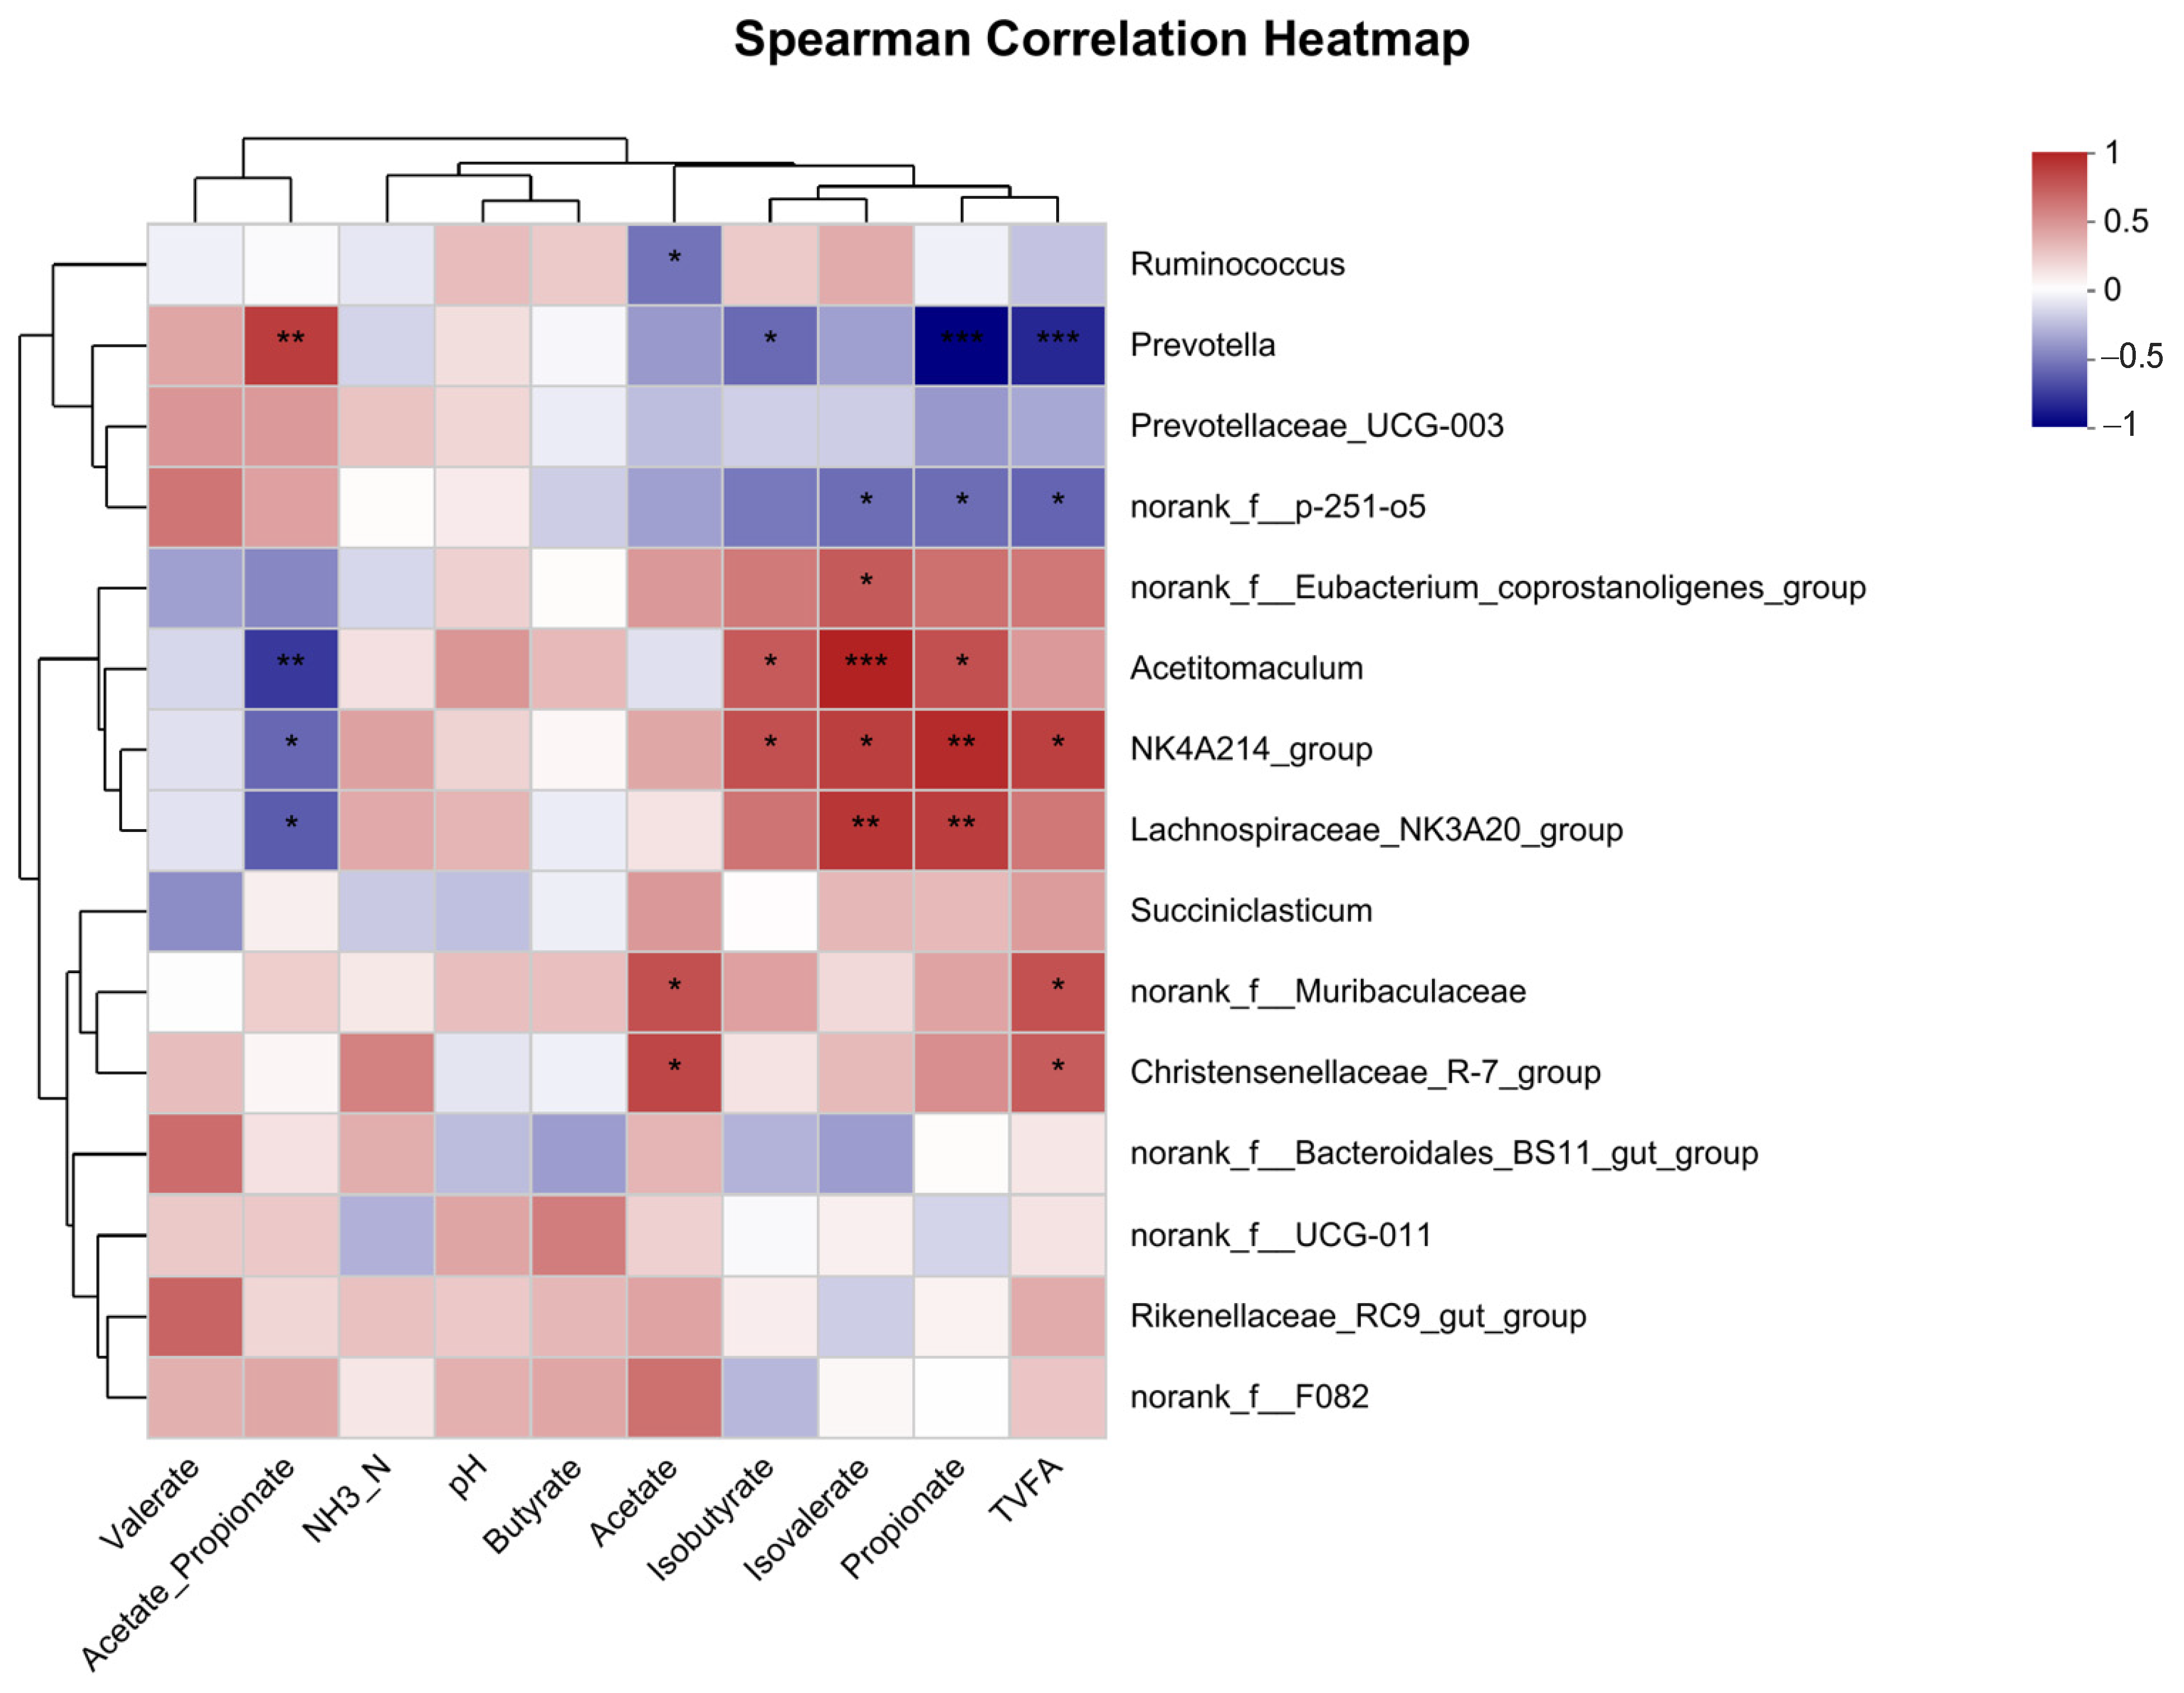
3.7. Examination of Correlation among Dominant 15 Bacterial Genera and Fermentation Parameters
3.8. Comparative Analysis of Rumen Metabolites
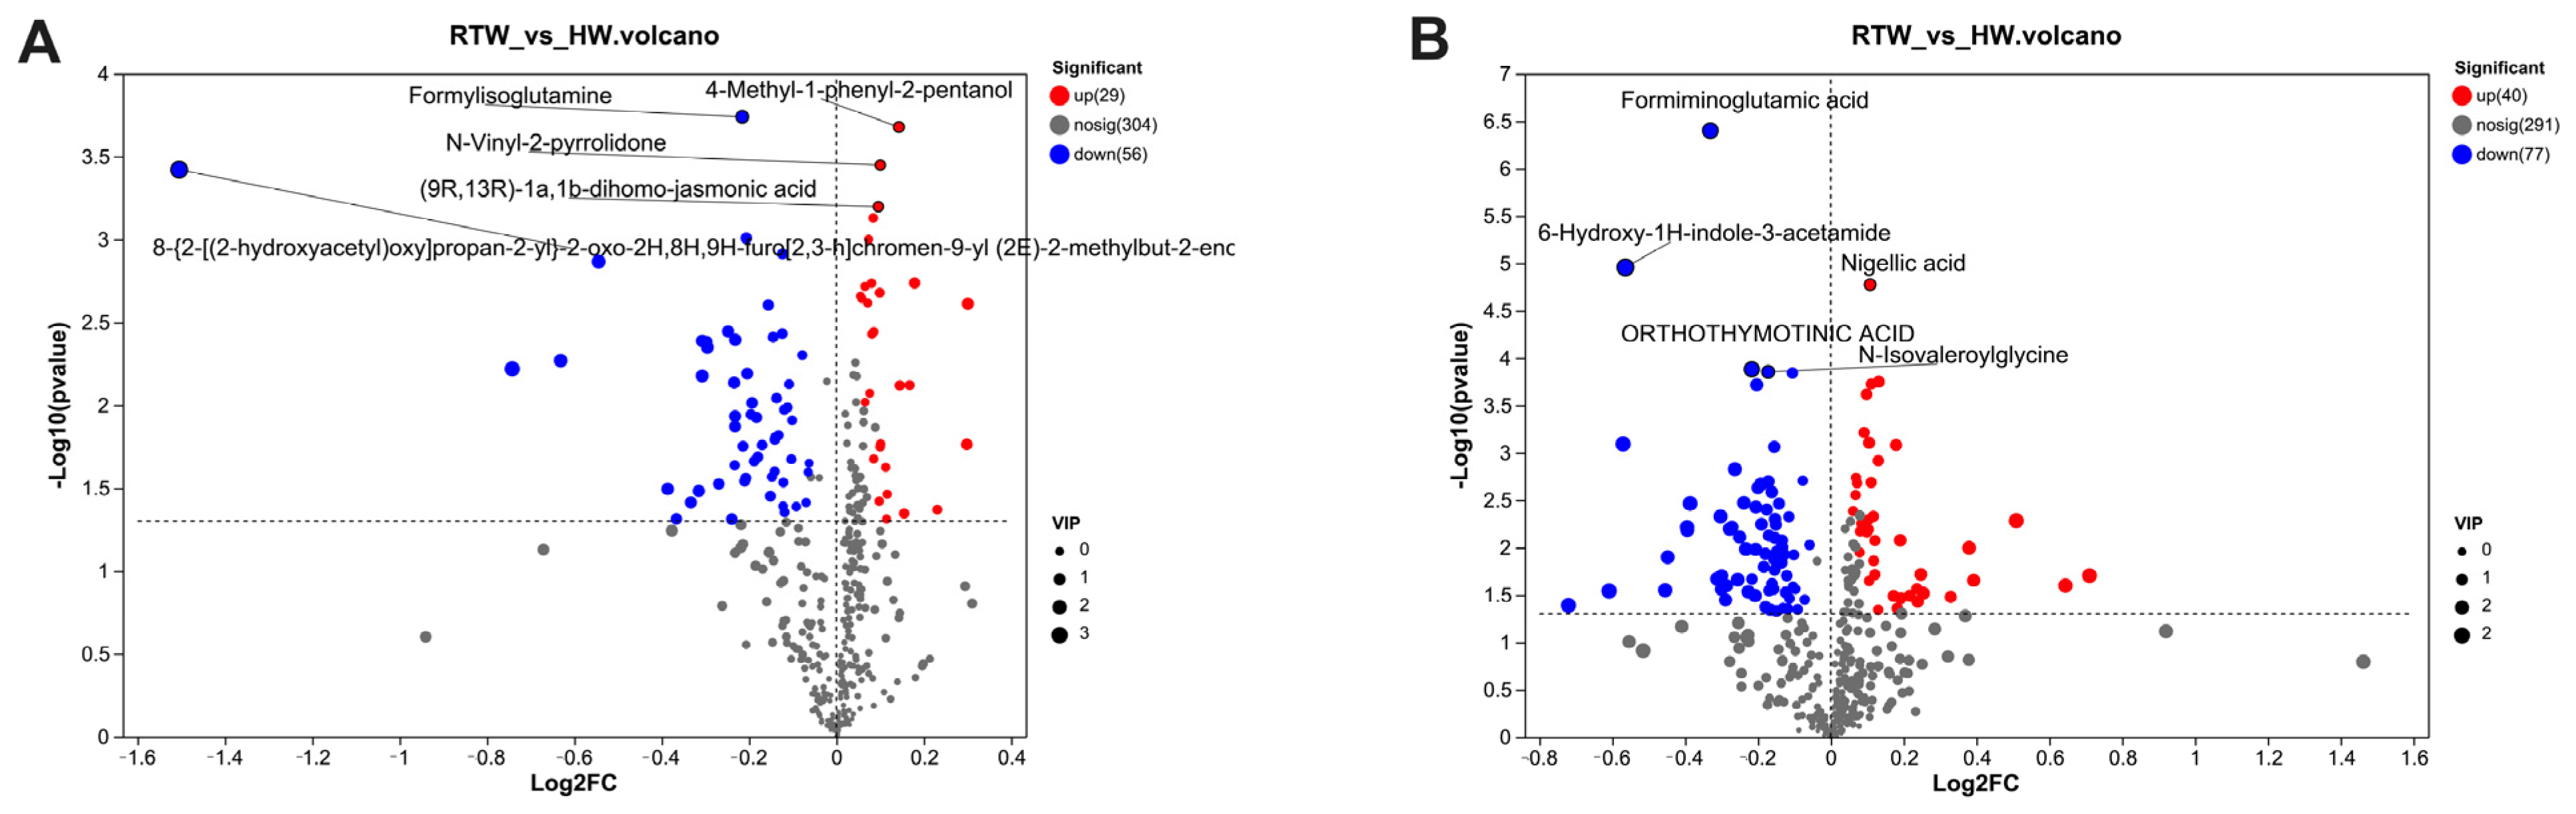
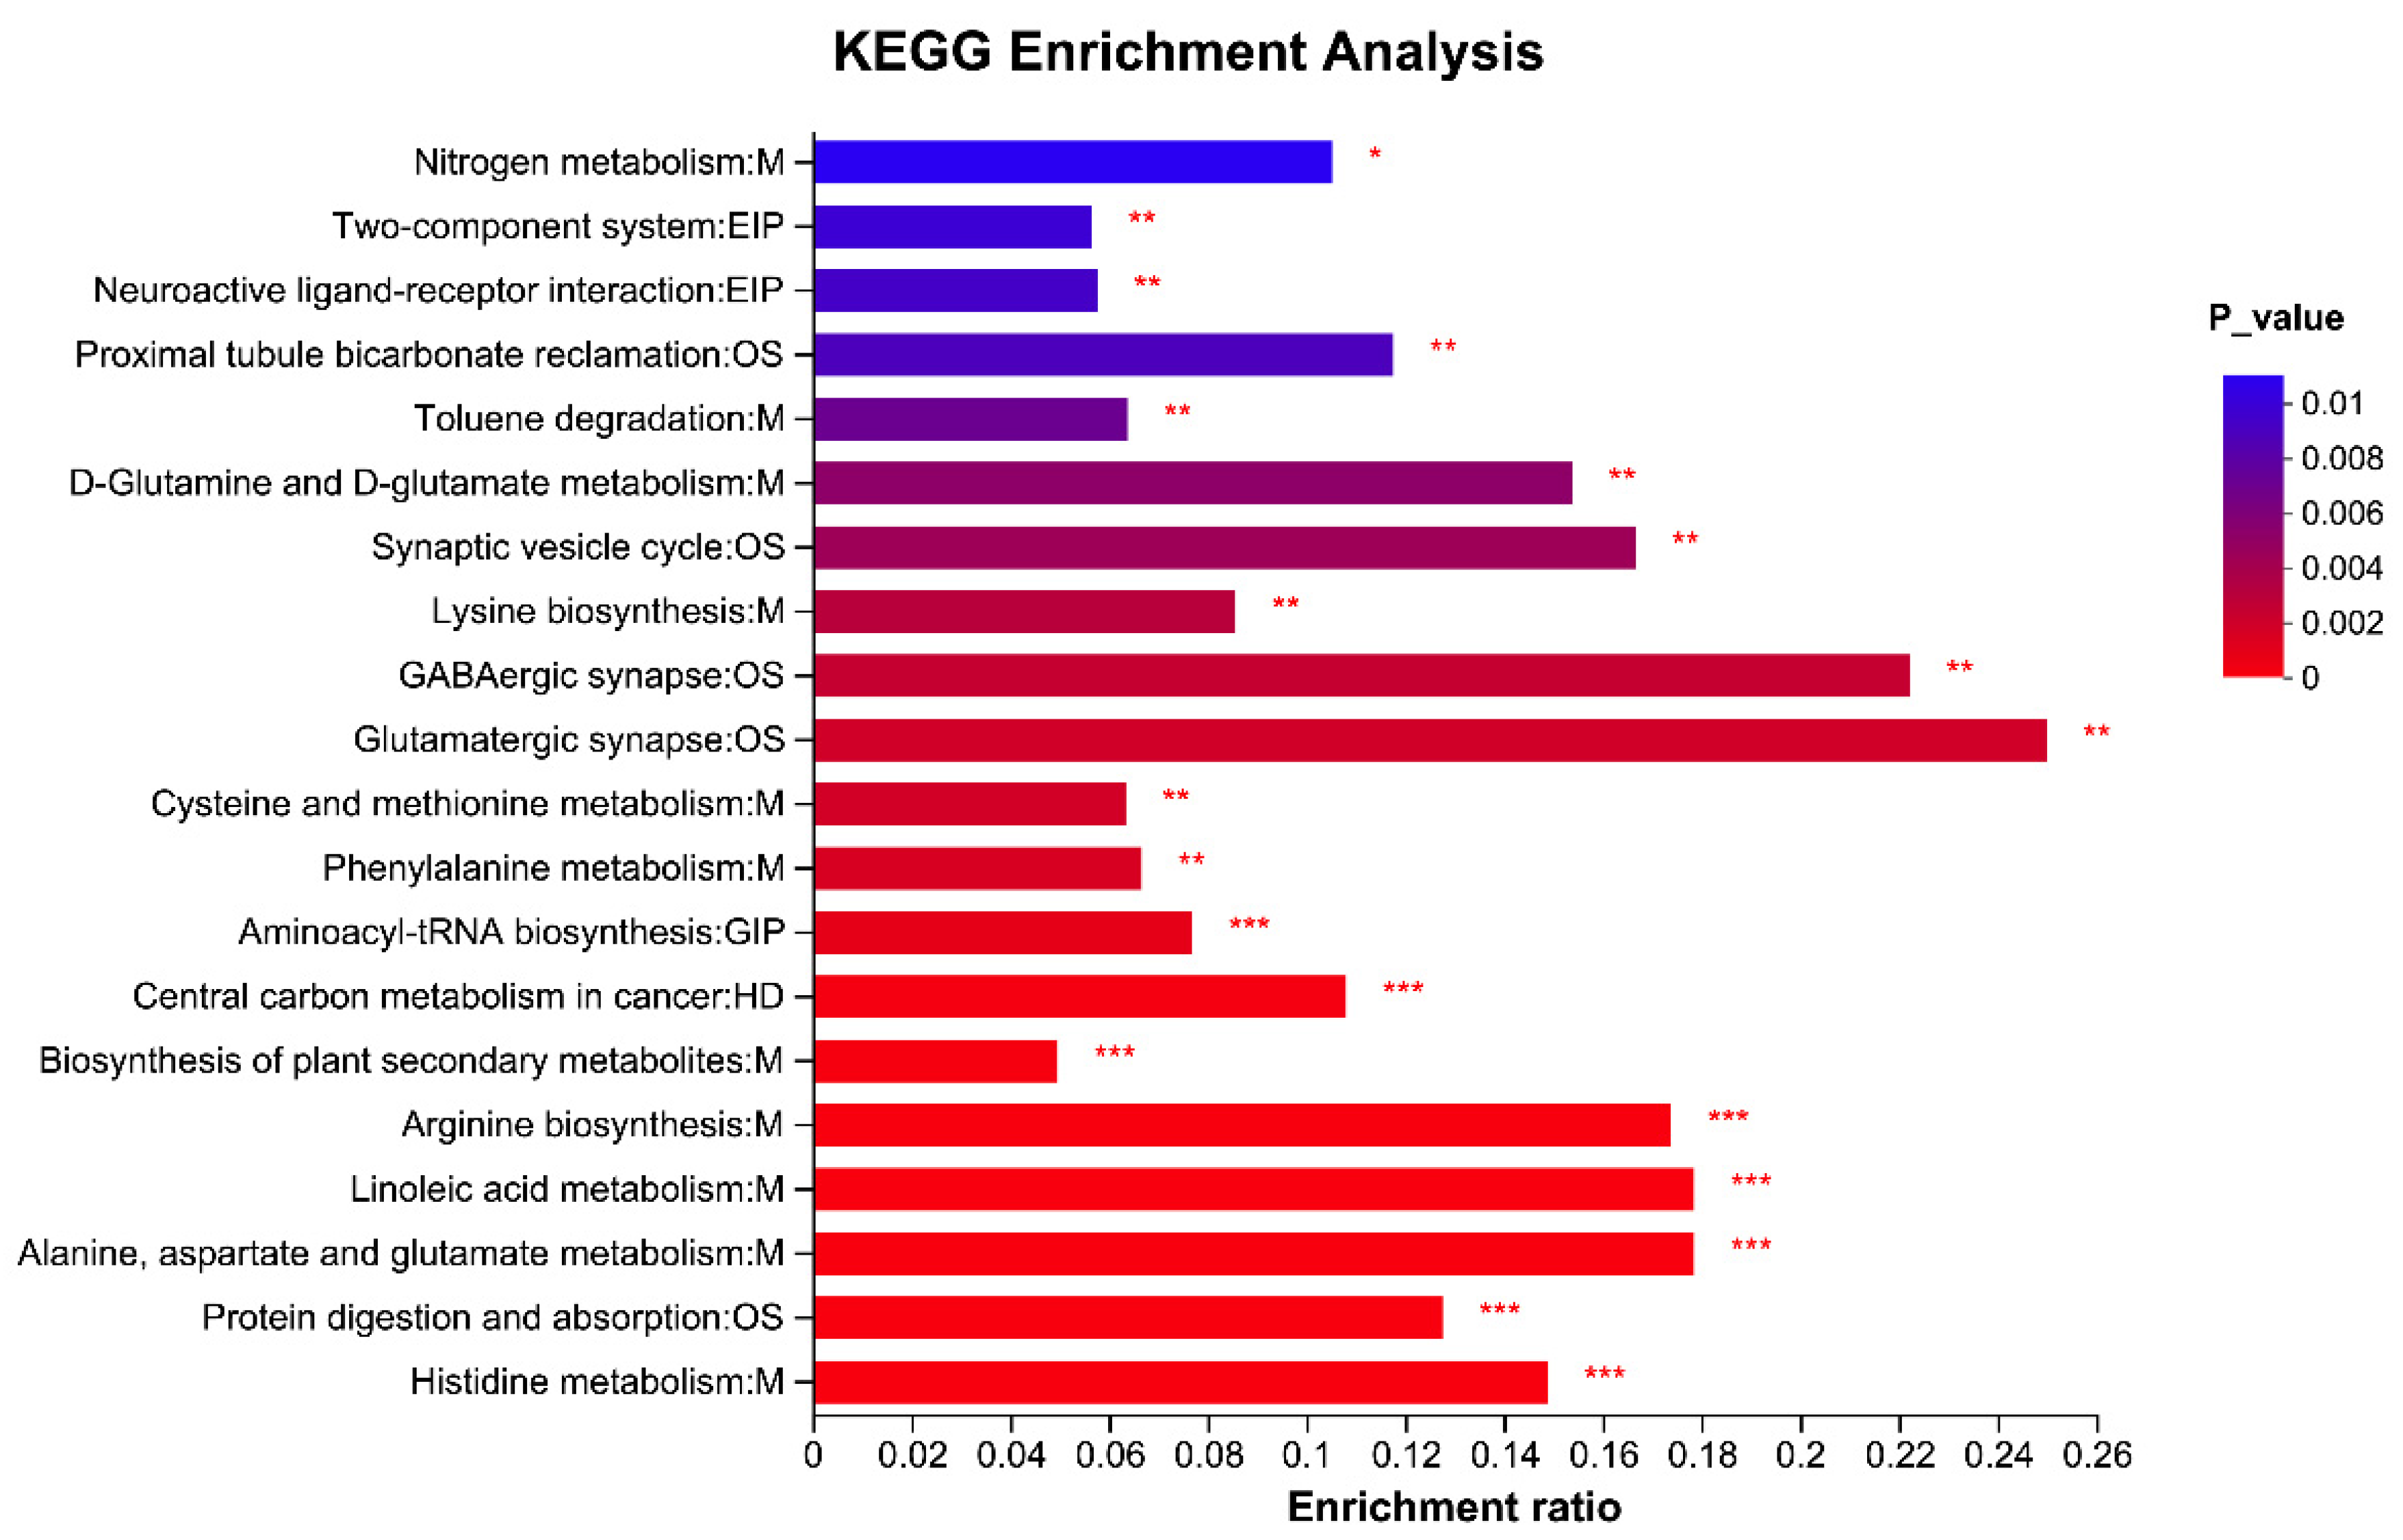
3.9. Rumen Metabolites Components Differences Analysis
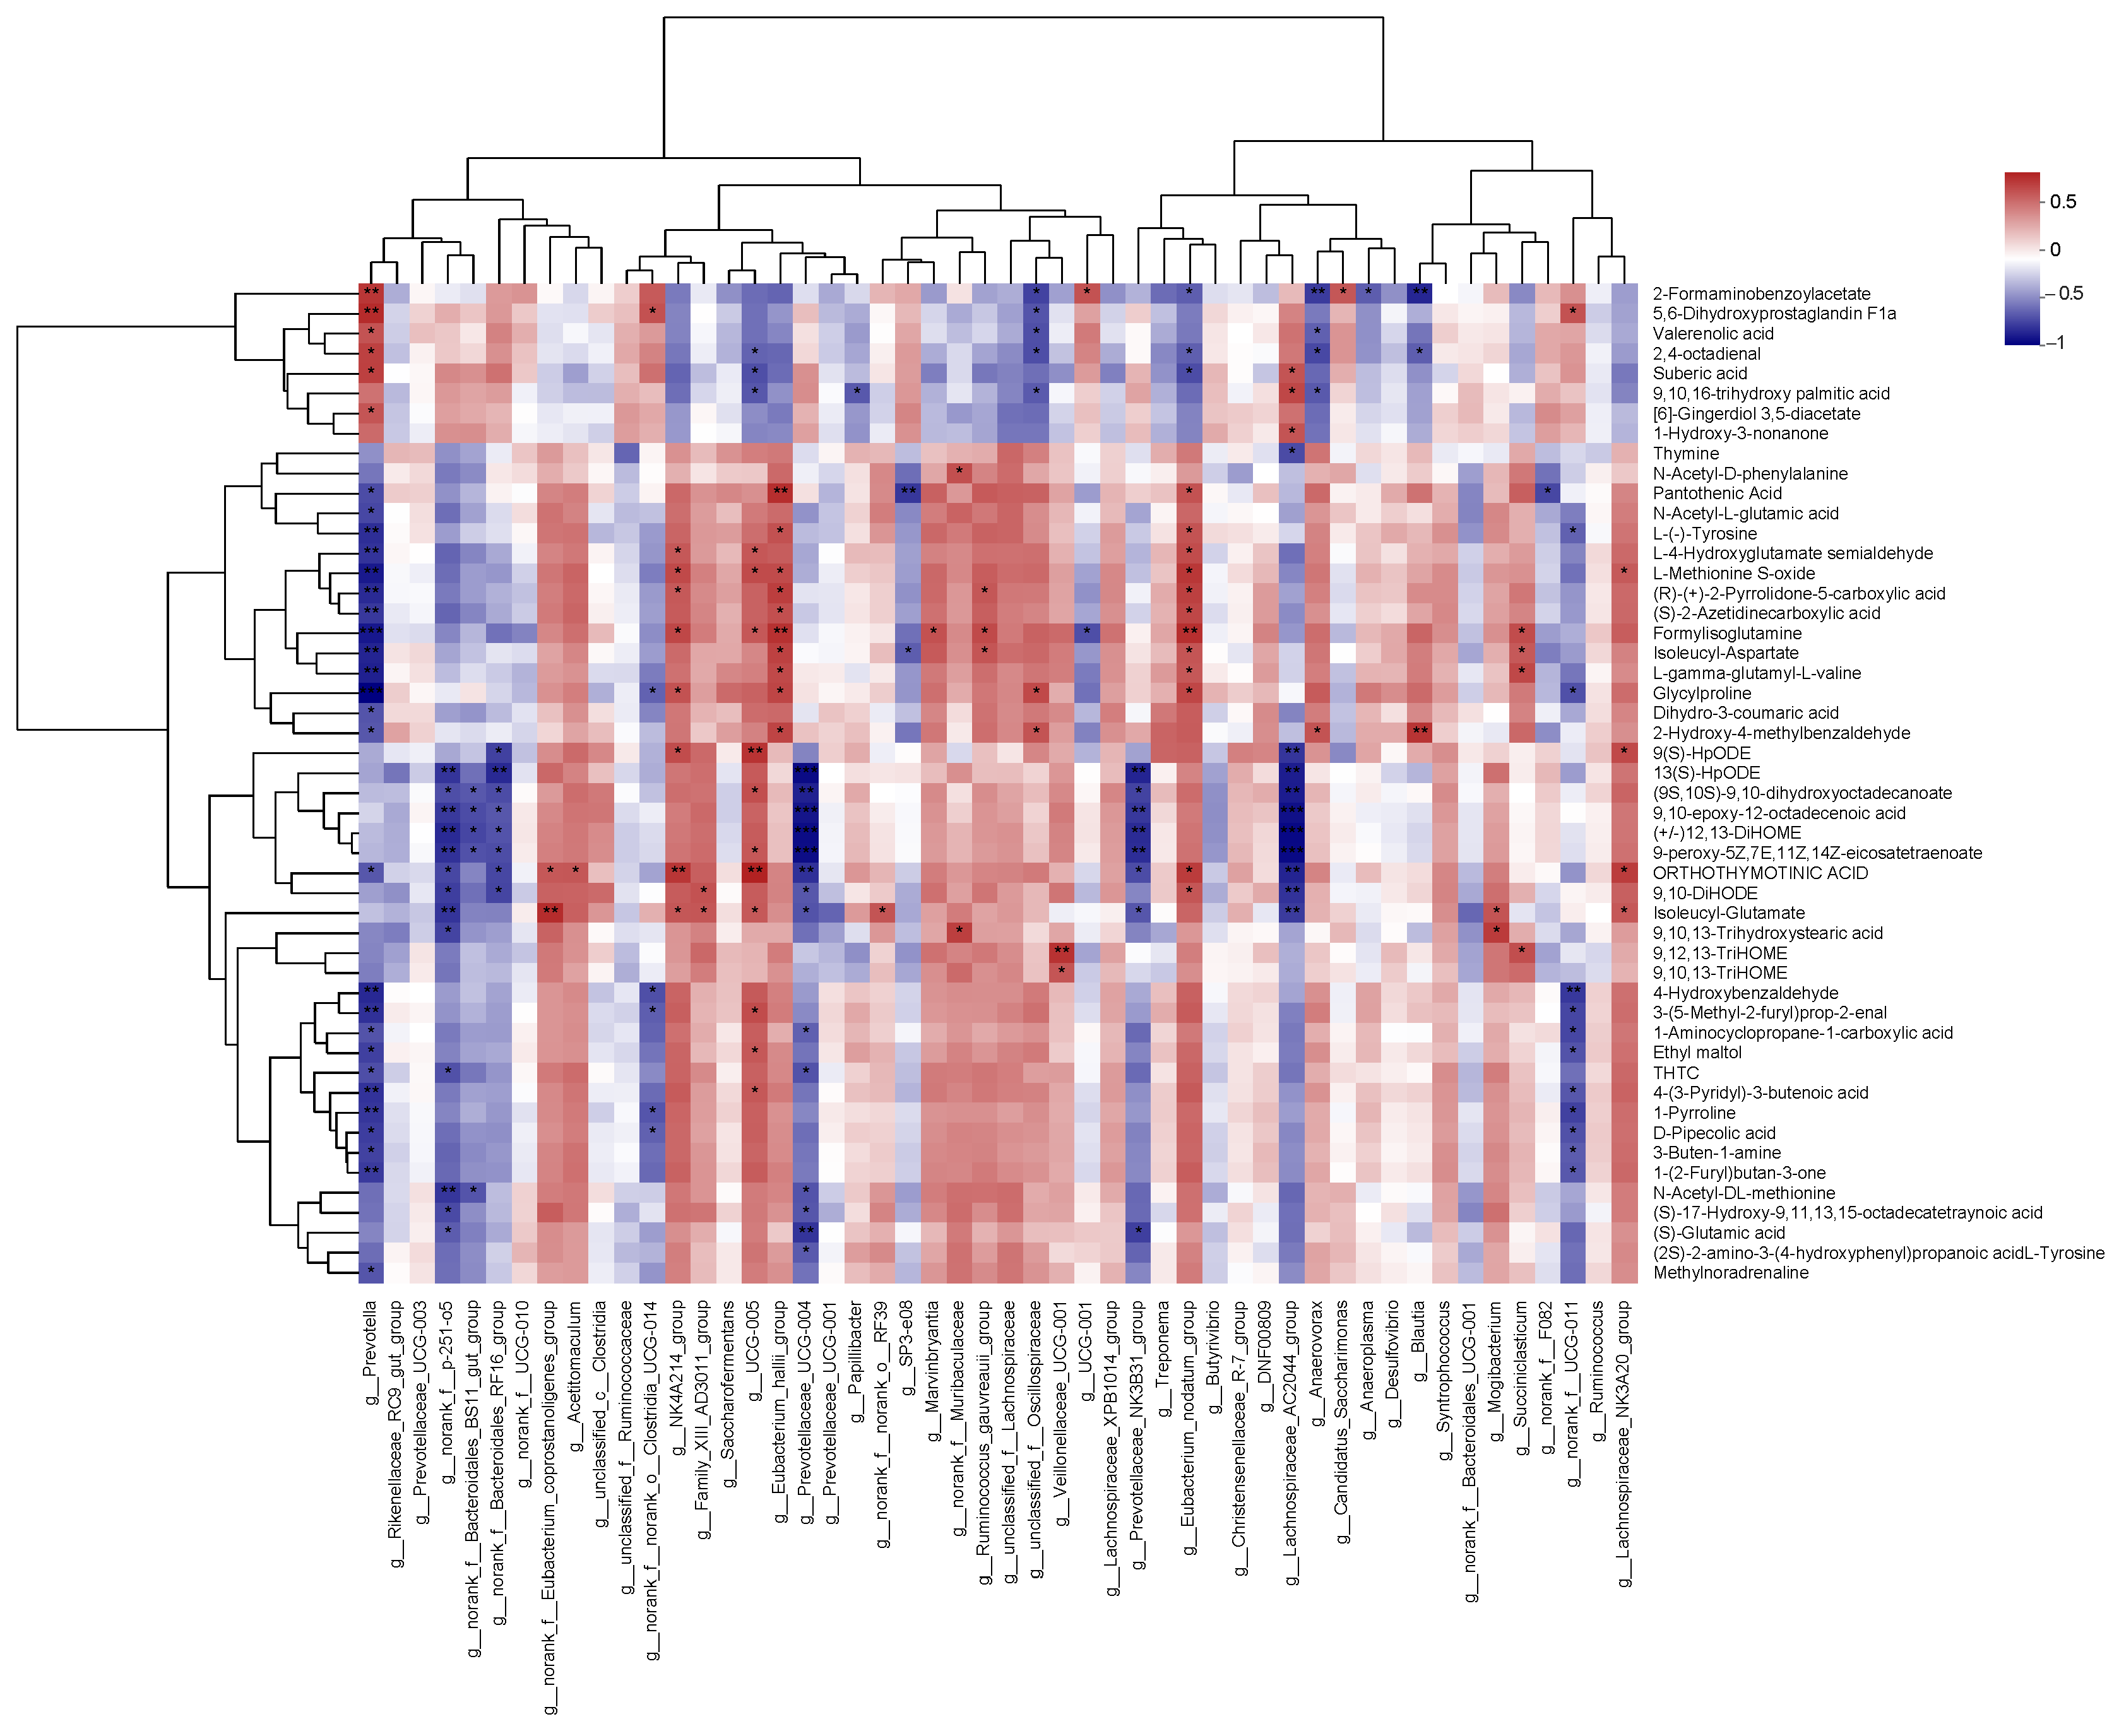
3.10. Spearman Correlation Analysis of the Top 50 Bacteria Genus with Metabolites in Rumen
4. Discussion
5. Conclusions
Author Contributions
Funding
Institutional Review Board Statement
Informed Consent Statement
Data Availability Statement
Conflicts of Interest
References
- Lam, S.; Munro, J.C.; Zhou, M.; Guan, L.L.; Schenkel, F.S.; Steele, M.A.; Miller, S.P.; Montanholi, Y.R. Associations of rumen parameters with feed efficiency and sampling routine in beef cattle. Animal 2018, 12, 1442–1450. [Google Scholar] [CrossRef]
- Ramos, S.C.; Jeong, C.D.; Mamuad, L.L.; Kim, S.H.; Kang, S.H.; Kim, E.T.; Cho, Y.I.; Lee, S.S.; Lee, S.S. Diet Transition from High-Forage to High-Concentrate Alters Rumen Bacterial Community Composition, Epithelial Transcriptomes and Ruminal Fermentation Parameters in Dairy Cows. Animals 2021, 11, 838. [Google Scholar] [CrossRef]
- Paz, H.A.; Hales, K.E.; Wells, J.E.; Kuehn, L.A.; Freetly, H.C.; Berry, E.D.; Flythe, M.D.; Spangler, M.L.; Fernando, S.C. Rumen bacterial community structure impacts feed efficiency in beef cattle. J. Anim. Sci. 2018, 96, 1045–1058. [Google Scholar] [CrossRef]
- Linville, K.; Casper, D.P.; Osorio, J.S. In vitro analysis of rumen microbial fermentation at different temperatures. J. Anim. Sci. 2017, 95, 182–183. [Google Scholar] [CrossRef]
- Wahrmund, J.L.; Ronchesel, J.R.; Krehbiel, C.R.; Goad, C.L.; Trost, S.M.; Richards, C.J. Ruminal acidosis challenge impact on ruminal temperature in feedlot cattle. J. Anim. Sci. 2012, 90, 2794–2801. [Google Scholar] [CrossRef]
- Rutherford, N.H.; Gordon, A.W.; Lively, F.O.; Arnott, G. The Effect of Behaviour and Diet on the Rumen Temperature of Holstein Bulls. Animals 2019, 9, 1000. [Google Scholar] [CrossRef]
- Ipema, A.H.; Goense, D.; Hogewerf, P.H.; Houwers, H.W.J.; van Roest, H. Pilot study to monitor body temperature of dairy cows with a rumen bolus. Comput. Electron. Agr. 2008, 64, 49–52. [Google Scholar] [CrossRef]
- Collier, R.J.; Gebremedhin, K.G. Thermal Biology of Domestic Animals. Annu. Rev. Anim. Biosci. 2015, 3, 513–532. [Google Scholar] [CrossRef]
- Wang, S.Y.; Li, Q.; Peng, J.H.; Niu, H.X. Effects of Long-Term Cold Stress on Growth Performance, Behavior, Physiological Parameters, and Energy Metabolism in Growing Beef Cattle. Animals 2023, 13, 1619. [Google Scholar] [CrossRef]
- Liu, T.X.; Gao, C.X.; Long, S.F.; Wang, Q.Q.; He, T.F.; Wu, Z.L.; Chen, Z.H. Drinking Heated Water Improves Performance via Increasing Nutrient Digestibility and Ruminal Fermentation Function in Yak Calves. Animals 2023, 13, 2073. [Google Scholar] [CrossRef]
- Petersen, M.K.; Muscha, J.M.; Mulliniks, J.T.; Roberts, A.J. Water temperature impacts water consumption by range cattle in winter. J. Anim. Sci. 2016, 94, 4297–4306. [Google Scholar] [CrossRef] [PubMed]
- Hungate, R.E. Ruminations on the Rumen—A Citation Classic Commentary on the Rumen and Its Microbes by Hungate, R.E. Curr. Contents Agric. Biol. Environ. Sci. 1990, 24, 24. Available online: https://books.google.ch/books?id=lOwGAAAAMAAJ&hl=de&source=gbs_book_other_version-s (accessed on 7 May 2023).
- Roger, V.; Fonty, G.; Komisarczukbony, S.; Gouet, P. Effects of Physicochemical Factors on the Adhesion to Cellulose Avicel of the Ruminal Bacteria Ruminococcus-Flavefaciens and Fibrobacter-Succinogenes Subsp Succinogenes. Appl. Environ. Microb. 1990, 56, 3081–3087. [Google Scholar] [CrossRef]
- Bewley, J.M.; Grott, M.W.; Einstein, M.E.; Schutz, M.M. Impact of intake water temperatures on reticular temperatures of lactating dairy cows. J. Dairy Sci. 2008, 91, 3880–3887. [Google Scholar] [CrossRef]
- Hu, L.R.; Brito, L.F.; Zhang, H.L.; Zhao, M.; Liu, H.Z.; Chai, H.; Wang, D.S.; Wu, H.J.; Cui, J.H.; Liu, A.R.; et al. Metabolome profiling of plasma reveals different metabolic responses to acute cold challenge between Inner-Mongolia Sanhe and Holstein cattle. J. Dairy Sci. 2022, 105, 9162–9178. [Google Scholar] [CrossRef]
- Huan, T.; Palermo, A.; Ivanisevic, J.; Rinehart, D.; Edler, D.; Phommavongsay, T.; Benton, H.P.; Guijas, C.; Domingo-Almenara, X.; Warth, B.; et al. Autonomous Multimodal Metabolomics Data Integration for Comprehensive Pathway Analysis and Systems Biology. Anal. Chem. 2018, 90, 8396–8403. [Google Scholar] [CrossRef]
- He, T.F.; Wang, X.L.; Long, S.F.; Li, J.G.; Wu, Z.L.; Guo, Y.; Sun, F.; Chen, Z.H. Calcium Propionate Supplementation Mitigated Adverse Effects of Incubation Temperature Shift on In Vitro Fermentation by Modulating Microbial Composition. Fermentation 2023, 9, 544. [Google Scholar] [CrossRef]
- National Academies of Sciences. Medicine. In Nutrient Requirements of Beef Cattle: Eighth Revised Edition; The National Academies Press: Washington, DC, USA, 2016; p. 494. [Google Scholar]
- Chen, S.F.; Zhou, Y.Q.; Chen, Y.R.; Gu, J. fastp: An ultra-fast all-in-one FASTQ preprocessor. Bioinformatics 2018, 34, 884–890. [Google Scholar] [CrossRef] [PubMed]
- Magoc, T.; Salzberg, S.L. FLASH: Fast length adjustment of short reads to improve genome assemblies. Bioinformatics 2011, 27, 2957–2963. [Google Scholar] [CrossRef] [PubMed]
- Edgar, R.C. UPARSE: Highly accurate OTU sequences from microbial amplicon reads. Nat. Methods 2013, 10, 996–998. [Google Scholar] [CrossRef] [PubMed]
- Stackebrandt, E.; Goebel, B.M. A Place for DNA-DNA Reassociation and 16s Ribosomal-Rna Sequence-Analysis in the Present Species Definition in Bacteriology. Int. J. Syst. Bacteriol. 1994, 44, 846–849. [Google Scholar] [CrossRef]
- Wang, Q.; Garrity, G.M.; Tiedje, J.M.; Cole, J.R. Naive Bayesian classifier for rapid assignment of rRNA sequences into the new bacterial taxonomy. Appl. Environ. Microb. 2007, 73, 5261–5267. [Google Scholar] [CrossRef] [PubMed]
- Ogunade, I.; Schweickart, H.; Andries, K.; Lay, J.; Adeyemi, J. Monensin Alters the Functional and Metabolomic Profile of Rumen Microbiota in Beef Cattle. Animals 2018, 8, 211. [Google Scholar] [CrossRef] [PubMed]
- Tsugawa, H.; Cajka, T.; Kind, T.; Ma, Y.; Higgins, B.; Ikeda, K.; Kanazawa, M.; VanderGheynst, J.; Fiehn, O.; Arita, M. MS-DIAL: Data-independent MS/MS deconvolution for comprehensive metabolome analysis. Nat. Methods 2015, 12, 523–526. [Google Scholar] [CrossRef] [PubMed]
- Xia, J.; Wishart, D.S. Using MetaboAnalyst 3.0 for Comprehensive Metabolomics Data Analysis. Curr. Protoc. Bioinform. 2016, 55, 14.10.11–14.10.91. [Google Scholar] [CrossRef]
- Broucek, J.; Kovalcik, K.; Gajdosik, D.; Sottnik, J.; Brestensky, V. The Effect of Extreme Ambient-Temperatures on the Hematological and Biochemical Parameters of Heifers. Vet. Med. 1987, 32, 259–268. [Google Scholar]
- Kang, H.J.; Lee, I.K.; Piao, M.Y.; Gu, M.J.; Yun, C.H.; Kim, H.J.; Kim, K.H.; Baik, M. Effects of Ambient Temperature on Growth Performance, Blood Metabolites, and Immune Cell Populations in Korean Cattle Steers. Asian Austral. J. Anim. 2016, 29, 436–443. [Google Scholar] [CrossRef]
- Deng, Q.H.; Du, L.Y.; Zhang, Y.M.; Liu, G.W. NEFAs Influence the Inflammatory and Insulin Signaling Pathways Through TLR4 in Primary Calf Hepatocytes in vitro. Front. Vet. Sci. 2021, 8, 755505. [Google Scholar] [CrossRef]
- Kang, H.J.; Piao, M.Y.; Park, S.J.; Na, S.W.; Kim, H.J.; Baik, M. Effects of ambient temperature and rumen-protected fat supplementation on growth performance, rumen fermentation and blood parameters during cold season in Korean cattle steers. Asian Austral. J. Anim. 2019, 32, 657–664. [Google Scholar] [CrossRef]
- Helman, A.; Gilbert, M.; Pfisterlemaire, N.; Reach, G.; Assan, R. Glucagon and Insulin-Secretion and Their Biological-Activities in Hypothermic Rats. Endocrinology 1984, 115, 1722–1728. [Google Scholar] [CrossRef] [PubMed]
- He, T.F.; Long, S.F.; Yi, G.; Wang, X.L.; Li, J.G.; Wu, Z.L.; Guo, Y.; Sun, F.; Liu, J.J.; Chen, Z.H. Heating Drinking Water in Cold Season Improves Growth Performance via Enhancing Antioxidant Capacity and Rumen Fermentation Function of Beef Cattle. Antioxidants 2023, 12, 1492. [Google Scholar] [CrossRef] [PubMed]
- Zhao, Y.; Chen, F.D.; Wu, W.; Sun, M.M.; Bilotta, A.J.; Yao, S.X.; Xiao, Y.; Huang, X.S.; Eaves-Pyles, T.D.; Golovko, G.; et al. GPR43 mediates microbiota metabolite SCFA regulation of antimicrobial peptide expression in intestinal epithelial cells via activation of mTOR and STAT3. Mucosal Immunol. 2018, 11, 752–762. [Google Scholar] [CrossRef] [PubMed]
- Grossi, S.; Rossi, L.; Dell’Anno, M.; Biffani, S.; Rossi, C.A.S. Effects of Heated Drinking Water on the Growth Performance and Rumen Functionality of Fattening Charolaise Beef Cattle in Winter. Animals 2021, 11, 2218. [Google Scholar] [CrossRef]
- Duarte, A.C.; Holman, D.B.; Alexander, T.W.; Kiri, K.; Breves, G.; Chaves, A.V. Incubation Temperature, But Not Pequi Oil Supplementation, Affects Methane Production, and the Ruminal Microbiota in a Rumen Simulation Technique (Rusitec) System. Front. Microbiol. 2017, 8, 1076. [Google Scholar] [CrossRef] [PubMed]
- Li, A.Y.; Wang, Y.P.; Li, Z.X.; Qamar, H.; Mehmood, K.; Zhang, L.H.; Liu, J.J.; Zhang, H.; Li, J.K. Probiotics isolated from yaks improves the growth performance, antioxidant activity, and cytokines related to immunity and inflammation in mice. Microb. Cell Fact. 2019, 18, 112. [Google Scholar] [CrossRef]
- Garneau, J.E.; Tremblay, D.M.; Moineau, S. Characterization of 1706, a virulent phage from Lactococcus lactis with similarities to prophages from other Firmicutes. Virology 2008, 373, 298–309. [Google Scholar] [CrossRef]
- Cui, X.X.; Wang, Z.F.; Guo, P.H.; Li, F.H.; Chang, S.H.; Yan, T.H.; Zheng, H.R.; Hou, F.J. Shift of Feeding Strategies from Grazing to Different Forage Feeds Reshapes the Rumen Microbiota To Improve the Ability of Tibetan Sheep (Ovis aries) To Adapt to the Cold Season. Microbiol. Spectr. 2023, 11, e02816-22. [Google Scholar] [CrossRef]
- Liu, X.; Sha, Y.Z.; Lv, W.B.; Cao, G.Z.; Guo, X.Y.; Pu, X.N.; Wang, J.Q.; Li, S.B.; Hu, J.; Luo, Y.Z. Multi-Omics Reveals That the Rumen Transcriptome, Microbiome, and Its Metabolome Co-regulate Cold Season Adaptability of Tibetan Sheep. Front. Microbiol. 2022, 13, 859601. [Google Scholar] [CrossRef]
- Liu, C.; Wu, H.; Liu, S.J.; Chai, S.T.; Meng, Q.X.; Zhou, Z.M. Dynamic Alterations in Yak Rumen Bacteria Community and Metabolome Characteristics in Response to Feed Type. Front. Microbiol. 2019, 10, 1116. [Google Scholar] [CrossRef]
- Wang, B.; Ma, M.P.; Diao, Q.Y.; Tu, Y. Saponin-Induced Shifts in the Rumen Microbiome and Metabolome of Young Cattle. Front. Microbiol. 2019, 10, 356. [Google Scholar] [CrossRef]
- Yi, S.M.; Dai, D.W.; Wu, H.; Chai, S.T.; Liu, S.J.; Meng, Q.X.; Zhou, Z.M. Dietary Concentrate-to-Forage Ratio Affects Rumen Bacterial Community Composition and Metabolome of Yaks. Front. Nutr. 2022, 9, 927206. [Google Scholar] [CrossRef]
- Kool, D.M.; Hoffland, E.; Hummelink, E.W.J.; van Groenigen, J.W. Increased hippuric acid content of urine can reduce soil N2O fluxes. Soil Biol. Biochem. 2006, 38, 1021–1027. [Google Scholar] [CrossRef]
- Xue, Y.F.; Lin, L.M.; Hu, F.; Zhu, W.Y.; Mao, S.Y. Disruption of ruminal homeostasis by malnutrition involved in systemic ruminal microbiota-host interactions in a pregnant sheep model. Microbiome 2020, 8, 10. [Google Scholar] [CrossRef]
- Lyu, J.Y.; Yang, Z.T.; Wang, E.D.; Liu, G.K.; Wang, Y.J.; Wang, W.; Li, S.L. Possibility of Using By-Products with High NDF Content to Alter the Fecal Short Chain Fatty Acid Profiles, Bacterial Community, and Digestibility of Lactating Dairy Cows. Microorganisms 2022, 10, 1731. [Google Scholar] [CrossRef]
- McCann, J.C.; Wiley, L.M.; Forbes, T.D.; Rouquette, F.M.; Tedeschi, L.O. Relationship between the Rumen Microbiome and Residual Feed Intake-Efficiency of Brahman Bulls Stocked on Bermudagrass Pastures. PLoS ONE 2014, 9, e91864. [Google Scholar] [CrossRef]
- Guo, X.Y.; Sha, Y.Z.; Pu, X.N.; Xu, Y.; Yao, L.W.; Liu, X.; He, Y.Y.; Hu, J.; Wang, J.Q.; Li, S.B.; et al. Coevolution of Rumen Epithelial circRNAs with Their Microbiota and Metabolites in Response to Cold-Season Nutritional Stress in Tibetan Sheep. Int. J. Mol. Sci. 2022, 23, 10488. [Google Scholar] [CrossRef]
- Lake, B.G.; Longland, R.C.; Harris, R.A.; Gangolli, S.D.; Rundle, A. The Excretion of Metabolites of the D-Glucuronic Acid Pathway in Human-Urine—Effect of Phenobarbitone Administration. Xenobiotica 1982, 12, 241–247. [Google Scholar] [CrossRef]
- Alrob, O.A.; Lopaschuk, G.D. Role of CoA and acetyl-CoA in regulating cardiac fatty acid and glucose oxidation. Biochem. Soc. Trans. 2014, 42, 1043–1051. [Google Scholar] [CrossRef]
- Foster, D.W. Malonyl-CoA: The regulator of fatty acid synthesis and oxidation. J. Clin. Investig. 2012, 122, 1958–1959. [Google Scholar] [CrossRef]
- Park, J.Y.; Kang, B.R.; Ryu, C.M.; Anderson, A.J.; Kim, Y.C. Polyamine is a critical determinant of Pseudomonas chlororaphis O6 for GacS-dependent bacterial cell growth and biocontrol capacity. Mol. Plant Pathol. 2018, 19, 1257–1266. [Google Scholar] [CrossRef]
- Kajikawa, H.; Mitsumori, M.; Ohmomo, S. Stimulatory and inhibitory effects of protein amino acids on growth rate and efficiency of mixed ruminal bacteria. J. Dairy Sci. 2002, 85, 2015–2022. [Google Scholar] [CrossRef] [PubMed]
- Sauer, F.D.; Erfle, J.D.; Mahadevan, S. Amino-Acid Biosynthesis in Mixed Rumen Cultures. Biochem. J. 1975, 150, 357–372. [Google Scholar] [CrossRef] [PubMed]


| Ingredient Composition | Content |
|---|---|
| Corn | 35.0 |
| Dried distillers grains with solubles | 5.00 |
| Corn germ meal | 15.0 |
| Cotton seed | 4.00 |
| Whole corn silage | 34.0 |
| Wheat straw | 5.50 |
| Premix | 0.50 |
| NaHCO3 | 0.50 |
| NaCl | 0.50 |
| Analyzed nutritional composition | |
| DM | 51.2 |
| CP | 11.3 |
| ADF | 17.4 |
| NDF | 32.8 |
| EE | 4.07 |
| Calculated nutritional composition | |
| NEg; Mcal/kg | 1.56 |
| Sample | Sequence Number | Base Number | Mean Length | Min Length | Max Length |
|---|---|---|---|---|---|
| RTW_1 | 54,197 | 22,604,988 | 417 | 215 | 441 |
| RTW_2 | 56,093 | 23,516,338 | 419 | 232 | 504 |
| RTW_3 | 67,667 | 28,288,223 | 418 | 233 | 494 |
| RTW_4 | 63,282 | 26,418,679 | 417 | 201 | 464 |
| RTW_5 | 52,643 | 21,776,008 | 414 | 210 | 512 |
| RTW_6 | 87,241 | 36,239,015 | 415 | 336 | 439 |
| HW_1 | 52,705 | 21,896,598 | 415 | 214 | 501 |
| HW_2 | 62,729 | 25,970,252 | 414 | 233 | 471 |
| HW_3 | 55,324 | 23,083,306 | 417 | 214 | 522 |
| HW_4 | 56,106 | 23,247,328 | 414 | 226 | 491 |
| HW_5 | 42,575 | 17,504,053 | 411 | 200 | 535 |
| HW_6 | 49,661 | 20,678,505 | 416 | 202 | 497 |
| Mean | 58,352 | 24,268,608 | 416 | 226 | 489 |
| Metabolite | VIP | Fold Change | p Value | RTW vs. HW |
|---|---|---|---|---|
| 1-Aminocyclopropane-1-carboxylic acid | 1.51 | 0.91 | 0.02 | Down |
| 2-Formaminobenzoylacetate | 1.15 | 1.06 | 0.02 | Up |
| 3-Methyloxindole | 1.60 | 0.87 | 0.03 | Down |
| 4-Methyl-1-phenyl-2-pentanol | 1.55 | 1.10 | <0.01 | Up |
| 5,6-Dihydroxyprostaglandin F1a | 1.04 | 1.05 | <0.01 | Up |
| 6-Amino-9H-purine-9-propanoic acid | 1.36 | 1.08 | 0.03 | Up |
| 6-Hydroxy-1H-indole-3-acetamide | 2.69 | 0.68 | <0.01 | Down |
| 7-ketodeoxycholic acid | 1.64 | 1.19 | 0.02 | Up |
| Carboxyibuprofen | 1.04 | 1.05 | 0.01 | Up |
| Cynaroside A | 1.96 | 0.84 | <0.01 | Down |
| D-Glucurone | 1.18 | 0.92 | <0.01 | Down |
| D-Glucuronic acid | 1.39 | 0.90 | 0.02 | Down |
| D-Pipecolic acid | 2.28 | 0.81 | 0.01 | Down |
| Formiminoglutamic acid | 2.36 | 0.80 | <0.01 | Down |
| Formylisoglutamine | 2.06 | 0.86 | <0.01 | Down |
| Glutamic acid | 1.74 | 0.87 | 0.03 | Up |
| Hydantoin-5-propionic acid | 1.78 | 0.82 | 0.03 | Down |
| Indole-3-propionic acid | 1.43 | 0.89 | <0.01 | Down |
| Linoelaidic Acid | 1.24 | 0.92 | 0.04 | Down |
| Melibiitol | 1.89 | 0.81 | <0.01 | Down |
| N-Acetyl-L-glutamic acid | 1.45 | 0.91 | <0.01 | Down |
| N-Vinyl-2-pyrrolidone | 1.27 | 1.07 | <0.01 | Up |
| N-acetyl-L-glutamate-5-semialdehyde | 1.04 | 0.93 | 0.02 | Down |
| Nigellic acid | 1.26 | 1.08 | <0.01 | Up |
| Orthothymotinic acid | 2.15 | 0.86 | <0.01 | Down |
| Pantothenic Acid | 0.97 | 0.96 | 0.02 | Down |
| Tyrosine | 1.91 | 0.84 | 0.02 | Up |
Disclaimer/Publisher’s Note: The statements, opinions and data contained in all publications are solely those of the individual author(s) and contributor(s) and not of MDPI and/or the editor(s). MDPI and/or the editor(s) disclaim responsibility for any injury to people or property resulting from any ideas, methods, instructions or products referred to in the content. |
© 2023 by the authors. Licensee MDPI, Basel, Switzerland. This article is an open access article distributed under the terms and conditions of the Creative Commons Attribution (CC BY) license (https://creativecommons.org/licenses/by/4.0/).
Share and Cite
He, T.; Yi, G.; Wang, X.; Sun, Y.; Li, J.; Wu, Z.; Guo, Y.; Sun, F.; Chen, Z. Effects of Heated Drinking Water during the Cold Season on Serum Biochemistry, Ruminal Fermentation, Bacterial Community, and Metabolome of Beef Cattle. Metabolites 2023, 13, 995. https://doi.org/10.3390/metabo13090995
He T, Yi G, Wang X, Sun Y, Li J, Wu Z, Guo Y, Sun F, Chen Z. Effects of Heated Drinking Water during the Cold Season on Serum Biochemistry, Ruminal Fermentation, Bacterial Community, and Metabolome of Beef Cattle. Metabolites. 2023; 13(9):995. https://doi.org/10.3390/metabo13090995
Chicago/Turabian StyleHe, Tengfei, Guang Yi, Xilin Wang, Yan Sun, Jiangong Li, Zhenlong Wu, Yao Guo, Fang Sun, and Zhaohui Chen. 2023. "Effects of Heated Drinking Water during the Cold Season on Serum Biochemistry, Ruminal Fermentation, Bacterial Community, and Metabolome of Beef Cattle" Metabolites 13, no. 9: 995. https://doi.org/10.3390/metabo13090995
APA StyleHe, T., Yi, G., Wang, X., Sun, Y., Li, J., Wu, Z., Guo, Y., Sun, F., & Chen, Z. (2023). Effects of Heated Drinking Water during the Cold Season on Serum Biochemistry, Ruminal Fermentation, Bacterial Community, and Metabolome of Beef Cattle. Metabolites, 13(9), 995. https://doi.org/10.3390/metabo13090995