
Stable Isotope Tracing Analysis in Cancer Research: Advancements and Challenges in Identifying Dysregulated Cancer Metabolism and Treatment Strategies


Abstract
:1. Introduction to Stable Isotope Tracing
1.1. Overview of Experimental Design of Stable Isotope Tracing Experiments
1.2. Analysis of Isotope Labeling with Nuclear Magnetic Resonance (NMR)
1.3. Analysis of Stable Isotope Labeling Using Mass Spectrometry (MS)
1.4. Data Analysis
2. The Applications of Stable Isotope Tracing in Cancer Research
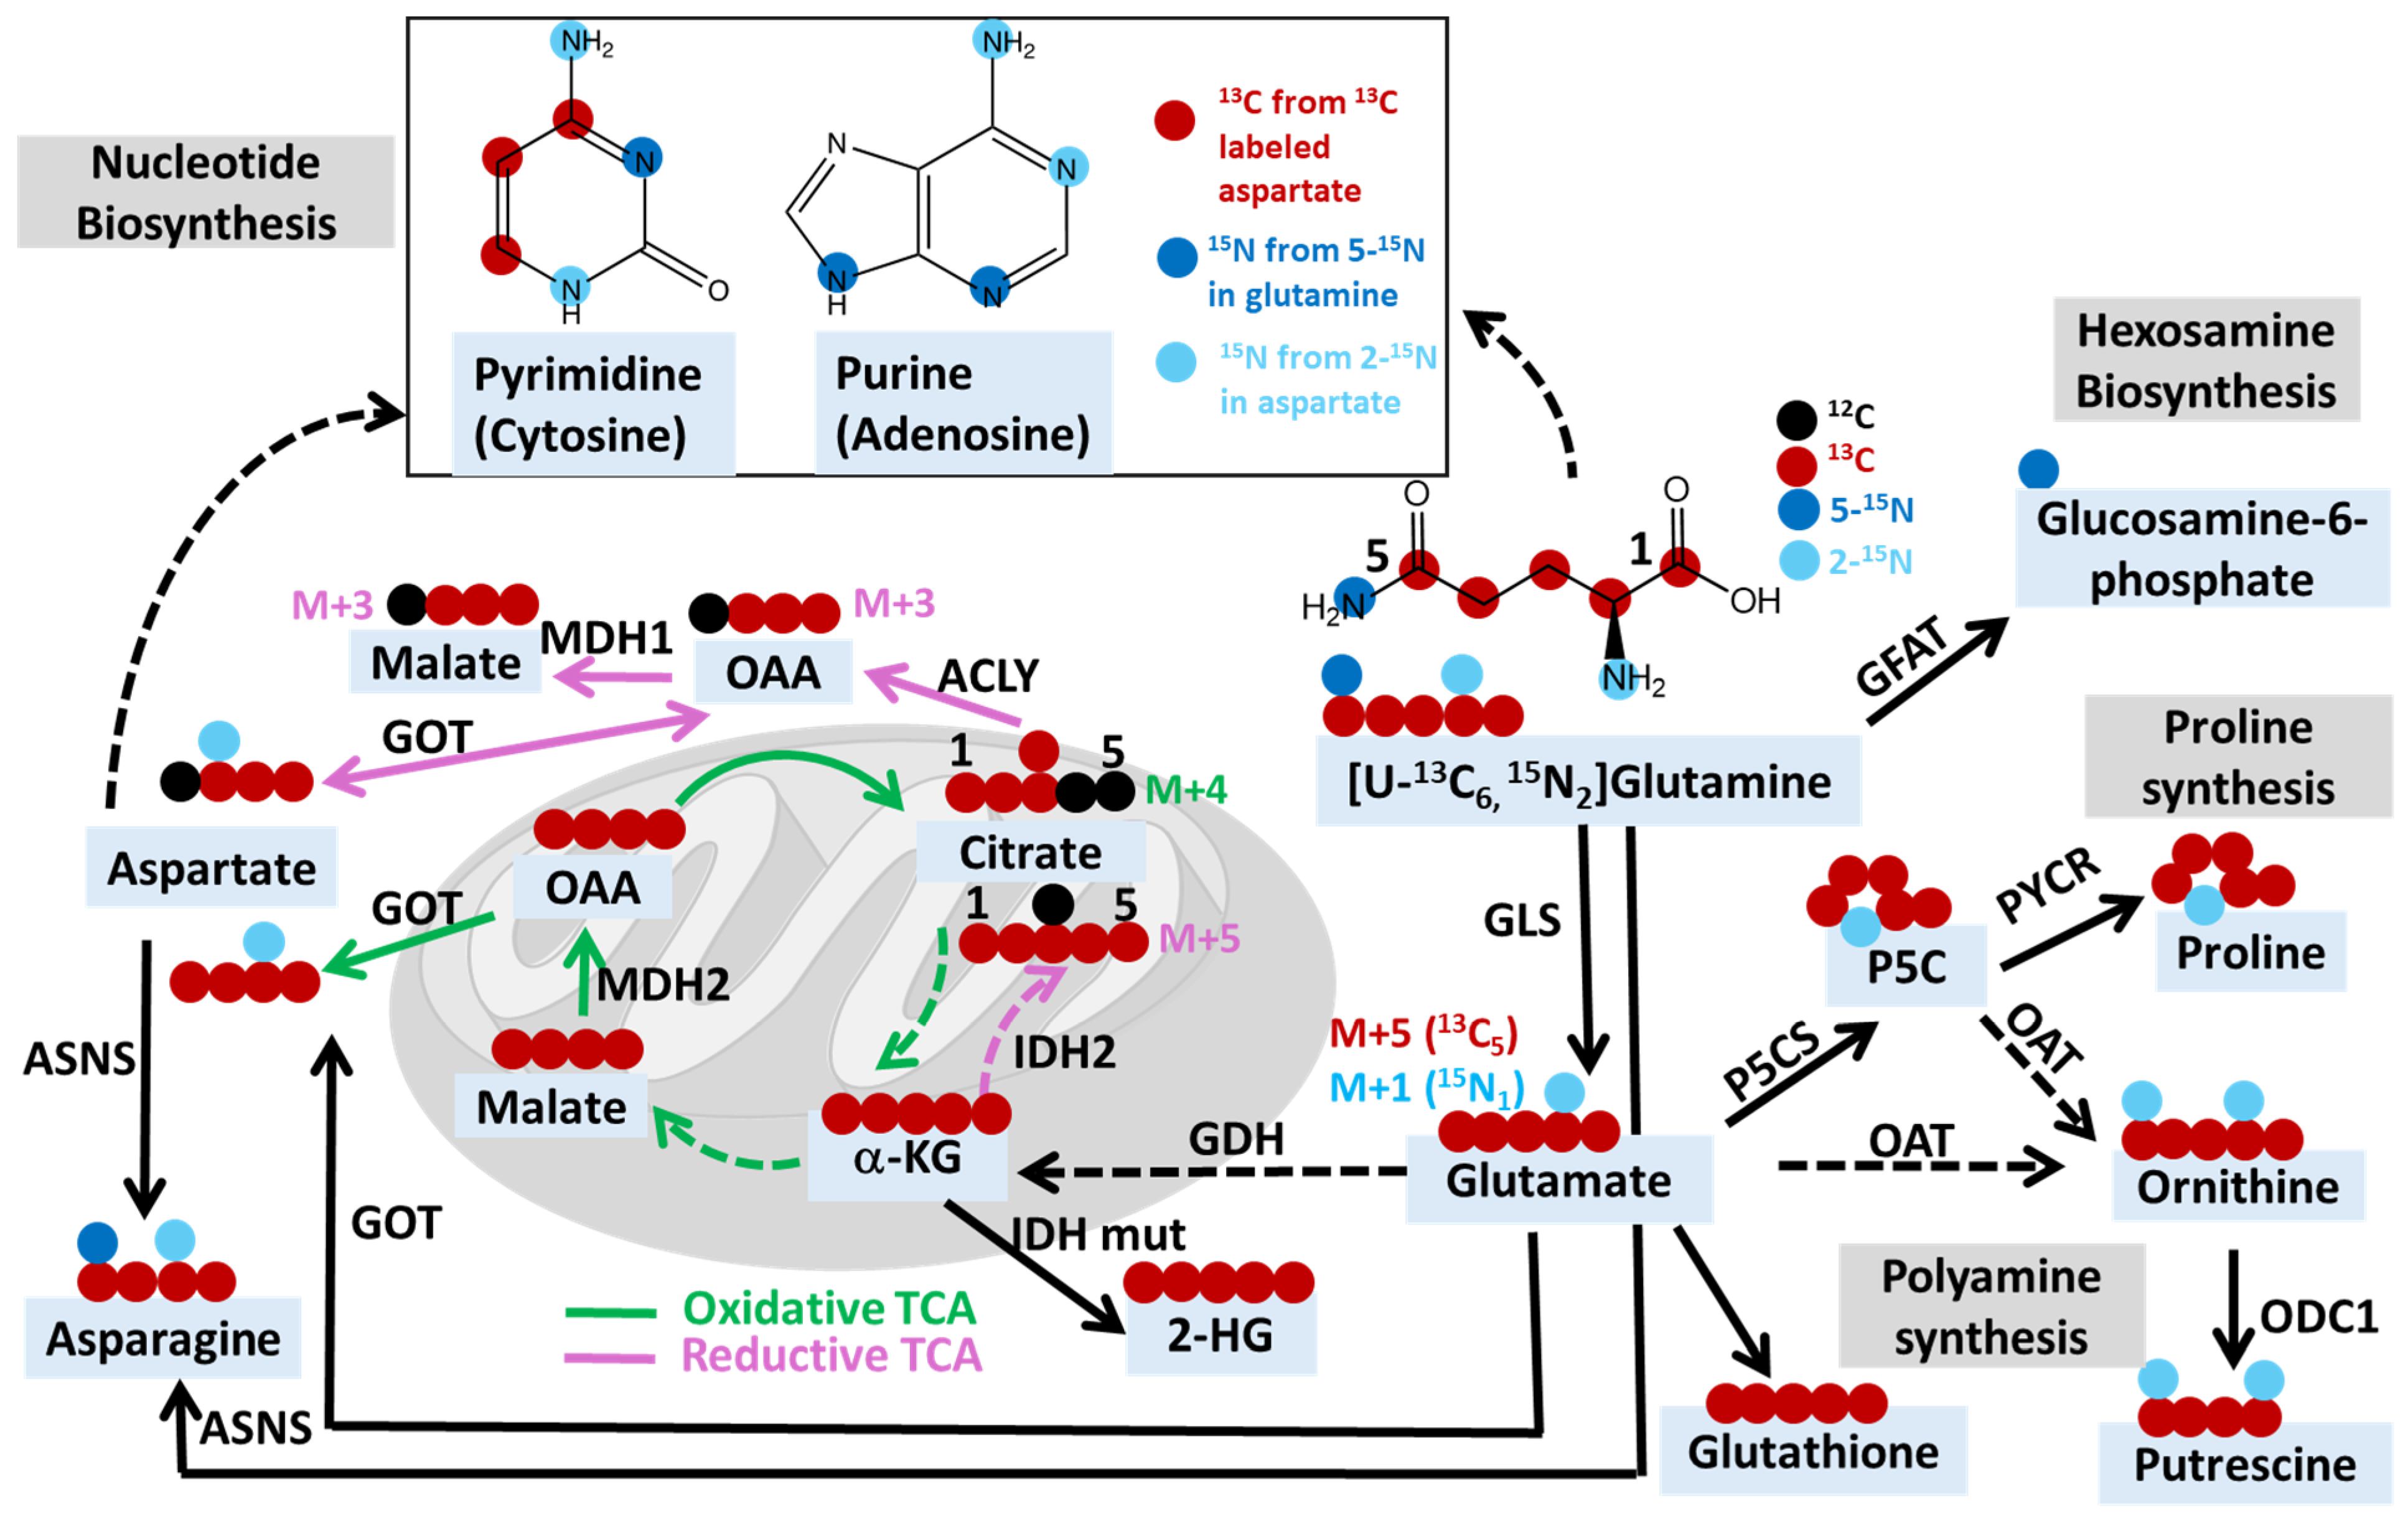
2.1. Exploring Cancer Metabolism through Glutamine Isotope Tracing

| Drug Target | Isotope Tracer | Pathway | Key Metabolite(s) | Cancer/Cell Type | Reference |
|---|---|---|---|---|---|
| Glutaminase (GLS) | [U-13C5]glutamine [U-13C5, 15N2]glutamine | Oxidative TCA Cycle | alpha-ketoglutarate (M+5), other TCA metabolites (M+4) | Renal cell carcinoma tumorgrafts | [118] |
| Reductive TCA Cycle | alpha-ketoglutarate (M+5), citrate (M+5), other TCA metabolites (M+3) | ||||
| [5-15N]glutamine | Amidotransferase | Asparagine (M+1) | |||
| Glutamine-using enzymes | [U-13C5]glutamine | Glutamine contribution to TCA cycle | alpha-ketoglutarate (M+5), other TCA metabolites (M+4) | Lymphoma xenograft | [143] |
| Ornithine aminotransferase | [2-15N]glutamine | Ornithine and polyamine synthesis | Ornithine and putrescine (M+1 and M+2) | Xenografts of pancreatic ductal adenocarcinoma | [147] |
| Glutamine-fructose-6-phosphate transaminase 2 | [5-15N]glutamine | Hexosamine biosynthesis | GlcNAc-6-P, UDP-HexNAc and ManNAc | KRAS/LKB1 co-mutant lung cancer cells | [8] |
| PYCR1, P5CS | [U-13C5]glutamine | Proline biosynthesis | Proline (M+5) | Cancer-associated fibroblasts, gastric cancer cell | [124,133] |
| IDH1 Mutations | HP [1-13C]glutamine | 2-Hydroxyglutarate (2-HG) formation | Ratio of [1-13C] 2-HG to 13C urea | Chondrosarcoma xenograft with IDH1 mutation | [38] |
| Dihydroorotate dehydrogenase | [5-15N]glutamine | De novo pyrimidine synthesis | Uridine monophosphate (M+1) | IDH mutant gliomas | [146] |
| Alanine transaminase | [U-13C6]isoleucine, [U-13C6]leucine, [U-13C5]valine | BCAA contribution to TCA cycle | TCA metabolites (M+2 and M+3) | Melanoma-bearing zebrafish | [148] |
| ETC Complex 1 | [U-13C5]glutamine | Reductive TCA cycle | alpha-ketoglutarate (M+5), citrate (M+5), other TCA metabolites (M+3) | Neuroblastoma xenograft | [149] |
| Oxidative TCA cycle | alpha-ketoglutarate (M+5), other TCA metabolites (M+4) | ||||
| Autophagy Related 5 (ATG5) | [U-13C3]lactate | Gluconeogenesis | Glycolytic intermediates (M+3 or M+6) | KP lung tumor bearing mice | [150] |
| Serine biosynthesis | Serine (M+3) | ||||
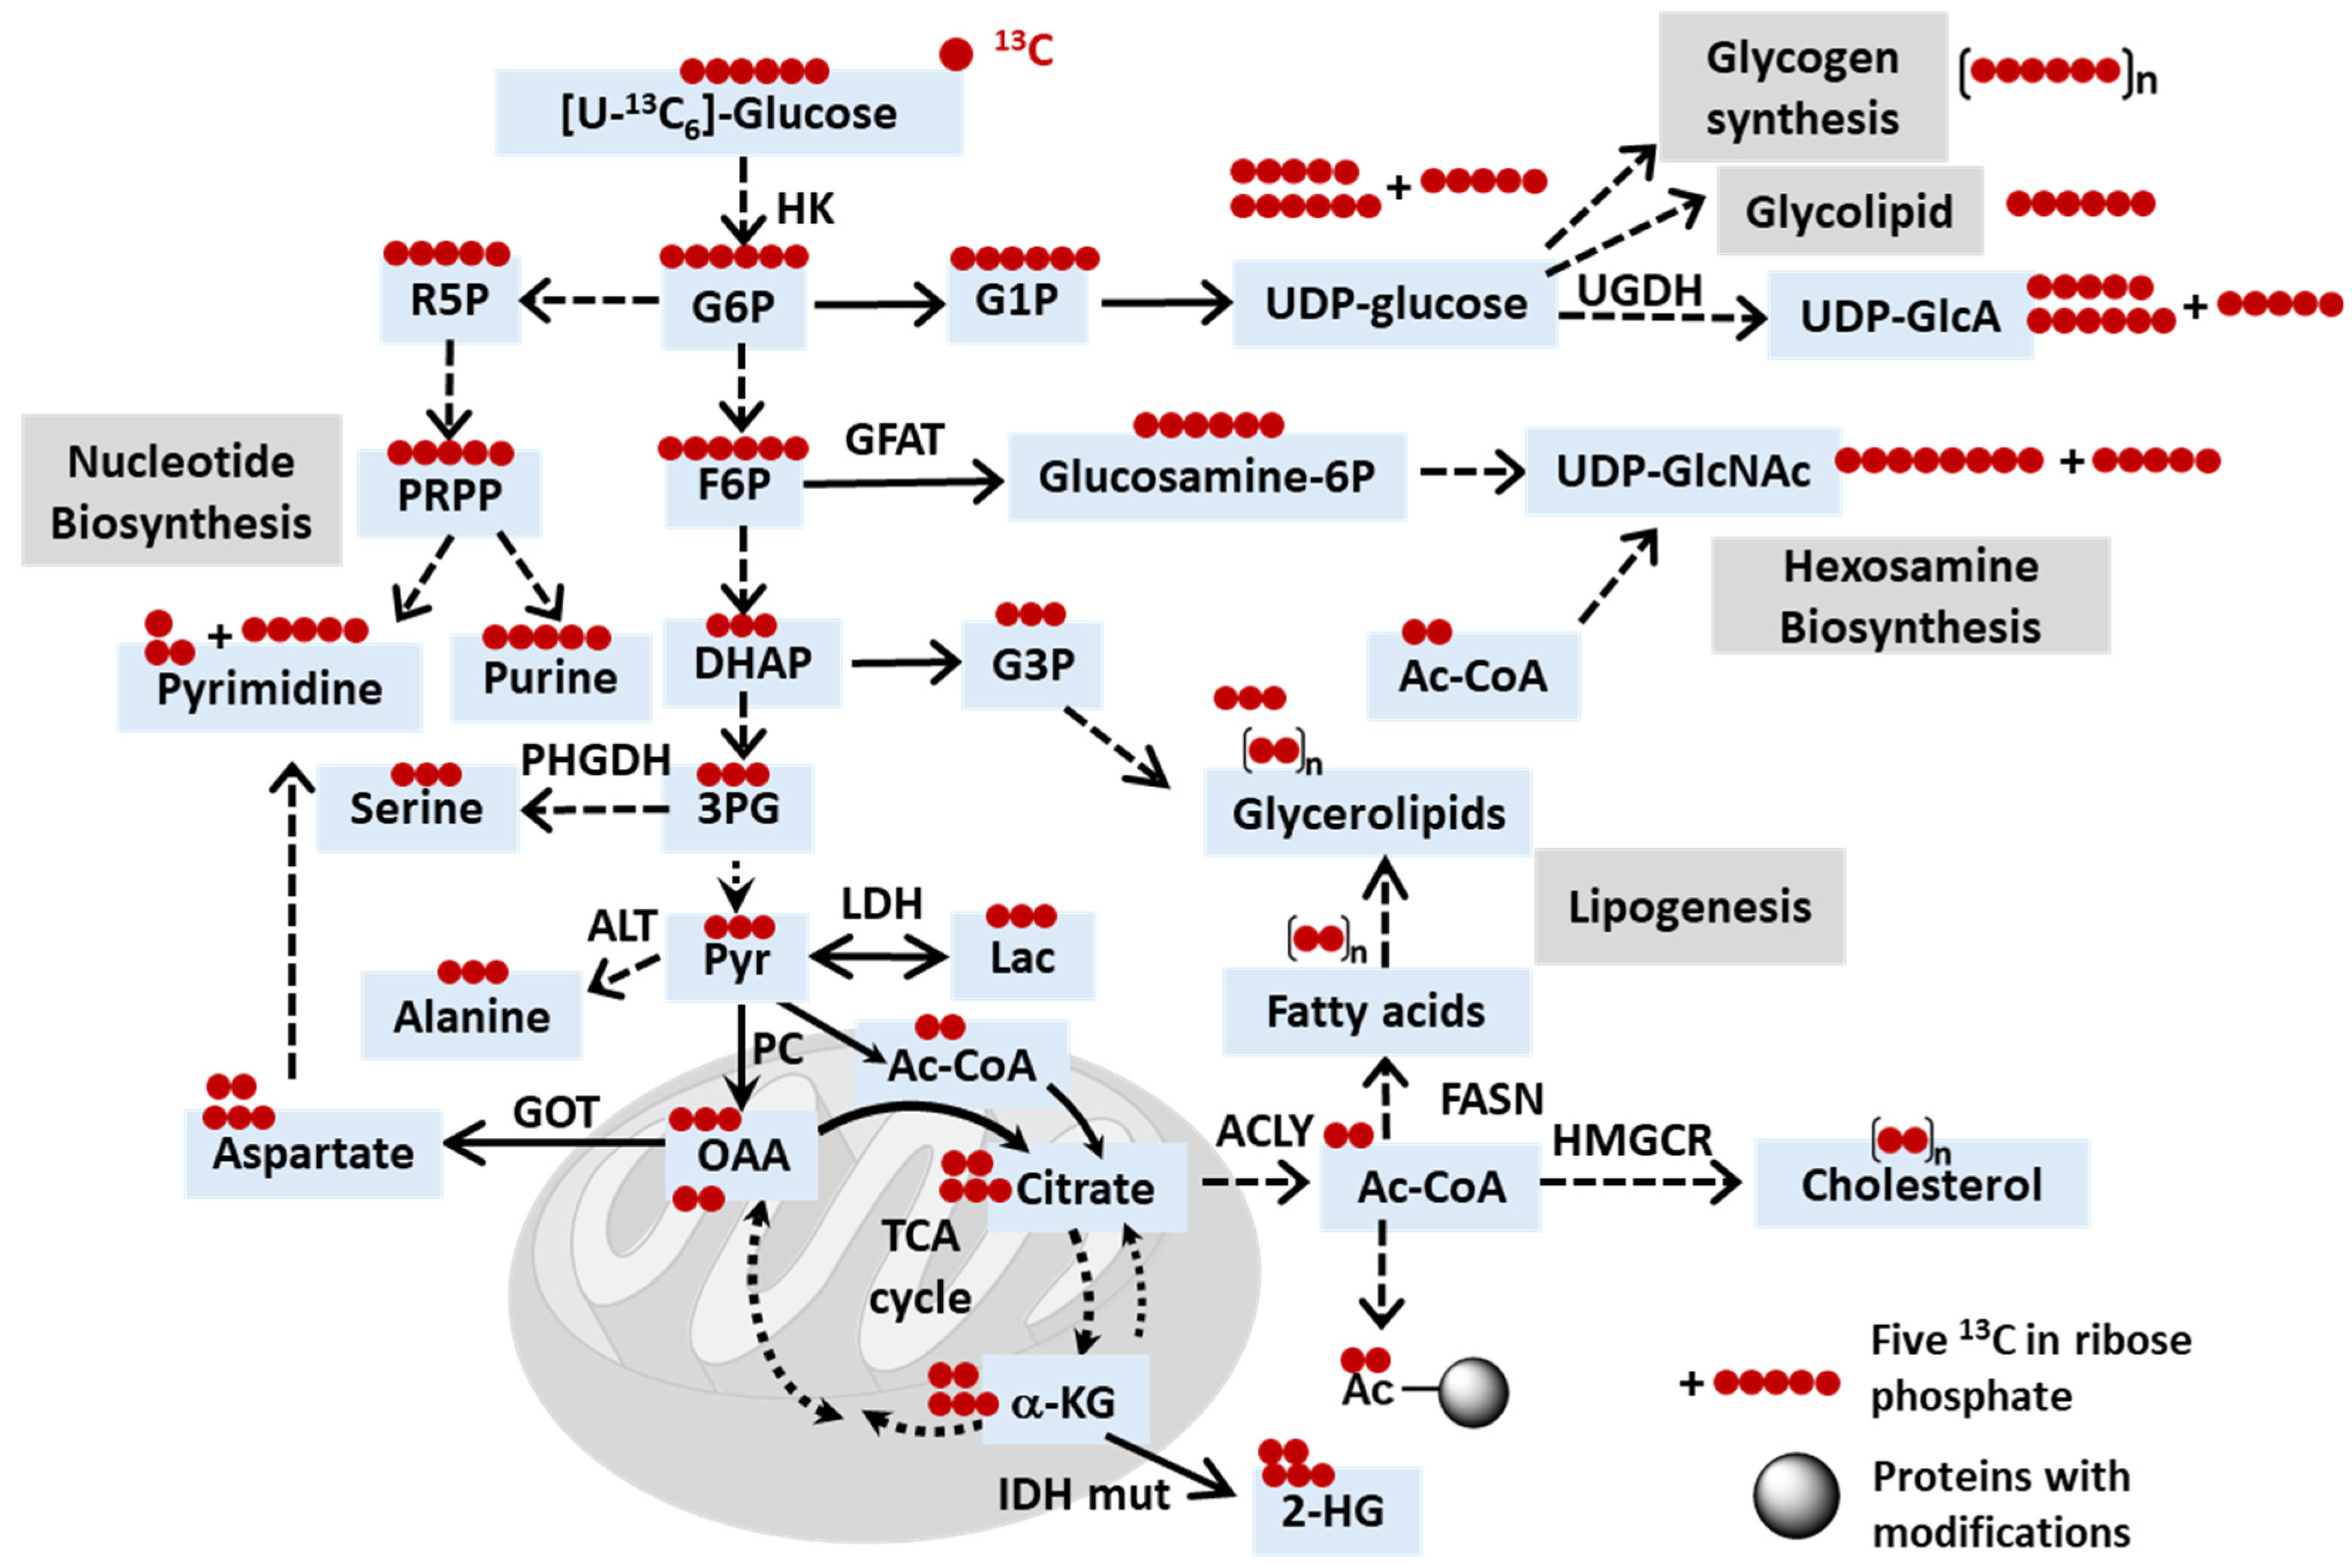
| Fatty acid synthase (FASN) | [U-13C6]glucose | De novo lipogenesis | Palmitate (M+n) n = 2, 4, 6, etc. | Mice carrying breast cancer with brain metastases | [7] |
2.2. The Use of Other Isotope Tracers for Investigating Cancer Metabolism
2.3. Uncovering Mechanisms of Resistance to Cancer Treatments through Stable Isotope Tracing Analysis
2.4. Current Clinical Trials Employing Stable Isotope Tracing Techniques
3. Limitations and Future Directions
4. Conclusions
Author Contributions
Funding
Institutional Review Board Statement
Informed Consent Statement
Data Availability Statement
Conflicts of Interest
References
- Bartman, C.R.; Faubert, B.; Rabinowitz, J.D.; DeBerardinis, R.J. Metabolic pathway analysis using stable isotopes in patients with cancer. Nat. Rev. Cancer 2023, 23, 863–878. [Google Scholar] [CrossRef] [PubMed]
- Yuan, M.; Kremer, D.M.; Huang, H.; Breitkopf, S.B.; Ben-Sahra, I.; Manning, B.D.; Lyssiotis, C.A.; Asara, J.M. Ex vivo and in vivo stable isotope labelling of central carbon metabolism and related pathways with analysis by LC-MS/MS. Nat. Protoc. 2019, 14, 313–330. [Google Scholar] [CrossRef] [PubMed]
- Faubert, B.; Tasdogan, A.; Morrison, S.J.; Mathews, T.P.; DeBerardinis, R.J. Stable isotope tracing to assess tumor metabolism in vivo. Nat. Protoc. 2021, 16, 5123–5145. [Google Scholar] [CrossRef] [PubMed]
- Llufrio, E.M.; Cho, K.; Patti, G.J. Systems-level analysis of isotopic labeling in untargeted metabolomic data by X(13)CMS. Nat. Protoc. 2019, 14, 1970–1990. [Google Scholar] [CrossRef]
- Lane, A.N.; Higashi, R.M.; Fan, T.W. NMR and MS-based Stable Isotope-Resolved Metabolomics and Applications in Cancer Metabolism. Trends Anal. Chem. 2019, 120, 115322. [Google Scholar] [CrossRef] [PubMed]
- Fan, T.W.; Higashi, R.M.; Chernayavskaya, Y.; Lane, A.N. Resolving Metabolic Heterogeneity in Experimental Models of the Tumor Microenvironment from a Stable Isotope Resolved Metabolomics Perspective. Metabolites 2020, 10, 249. [Google Scholar] [CrossRef] [PubMed]
- Ferraro, G.B.; Ali, A.; Luengo, A.; Kodack, D.P.; Deik, A.; Abbott, K.L.; Bezwada, D.; Blanc, L.; Prideaux, B.; Jin, X.; et al. Fatty Acid Synthesis Is Required for Breast Cancer Brain Metastasis. Nat. Cancer 2021, 2, 414–428. [Google Scholar] [CrossRef] [PubMed]
- Kim, J.; Lee, H.M.; Cai, F.; Ko, B.; Yang, C.; Lieu, E.L.; Muhammad, N.; Rhyne, S.; Li, K.; Haloul, M.; et al. The hexosamine biosynthesis pathway is a targetable liability in KRAS/LKB1 mutant lung cancer. Nat. Metab. 2020, 2, 1401–1412. [Google Scholar] [CrossRef] [PubMed]
- Stine, Z.E.; Schug, Z.T.; Salvino, J.M.; Dang, C.V. Targeting cancer metabolism in the era of precision oncology. Nat. Rev. Drug Discov. 2022, 21, 141–162. [Google Scholar] [CrossRef]
- Fendt, S.M.; Frezza, C.; Erez, A. Targeting Metabolic Plasticity and Flexibility Dynamics for Cancer Therapy. Cancer Discov. 2020, 10, 1797–1807. [Google Scholar] [CrossRef]
- Merritt, M.E.; Harrison, C.; Storey, C.; Jeffrey, F.M.; Sherry, A.D.; Malloy, C.R. Hyperpolarized 13C allows a direct measure of flux through a single enzyme-catalyzed step by NMR. Proc. Natl. Acad. Sci. USA 2007, 104, 19773–19777. [Google Scholar] [CrossRef] [PubMed]
- Yang, L.; Garcia Canaveras, J.C.; Chen, Z.; Wang, L.; Liang, L.; Jang, C.; Mayr, J.A.; Zhang, Z.; Ghergurovich, J.M.; Zhan, L.; et al. Serine Catabolism Feeds NADH when Respiration Is Impaired. Cell Metab. 2020, 31, 809–821.e6. [Google Scholar] [CrossRef] [PubMed]
- Lewis, C.A.; Parker, S.J.; Fiske, B.P.; McCloskey, D.; Gui, D.Y.; Green, C.R.; Vokes, N.I.; Feist, A.M.; Vander Heiden, M.G.; Metallo, C.M. Tracing compartmentalized NADPH metabolism in the cytosol and mitochondria of mammalian cells. Mol. Cell 2014, 55, 253–263. [Google Scholar] [CrossRef] [PubMed]
- Kelleher, J.K. Flux estimation using isotopic tracers: Common ground for metabolic physiology and metabolic engineering. Metab. Eng. 2001, 3, 100–110. [Google Scholar] [CrossRef] [PubMed]
- Kera, K.; Fine, D.D.; Wherritt, D.J.; Nagashima, Y.; Shimada, N.; Ara, T.; Ogata, Y.; Sumner, L.W.; Suzuki, H. Pathway-specific metabolome analysis with (18)O(2)-labeled Medicago truncatula via a mass spectrometry-based approach. Metabolomics 2018, 14, 71. [Google Scholar] [CrossRef] [PubMed]
- Liu, X.; Cooper, D.E.; Cluntun, A.A.; Warmoes, M.O.; Zhao, S.; Reid, M.A.; Liu, J.; Lund, P.J.; Lopes, M.; Garcia, B.A.; et al. Acetate Production from Glucose and Coupling to Mitochondrial Metabolism in Mammals. Cell 2018, 175, 502–513.e13. [Google Scholar] [CrossRef]
- Eylem, C.C.; Baysal, I.; Erikci, A.; Yabanoglu-Ciftci, S.; Zhang, S.; Kir, S.; Terzic, A.; Dzeja, P.; Nemutlu, E. Gas chromatography-mass spectrometry based (18)O stable isotope labeling of Krebs cycle intermediates. Anal. Chim. Acta 2021, 1154, 338325. [Google Scholar] [CrossRef]
- Jang, C.; Chen, L.; Rabinowitz, J.D. Metabolomics and Isotope Tracing. Cell 2018, 173, 822–837. [Google Scholar] [CrossRef]
- Fan, T.W.; Lane, A.N.; Higashi, R.M. Stable Isotope Resolved Metabolomics Studies in Ex Vivo TIssue Slices. Bio Protocl 2016, 6, e1730. [Google Scholar] [CrossRef]
- Sano, Y.; Ito, S.; Yoneda, M.; Nagasawa, K.; Matsuura, N.; Yamada, Y.; Uchinaka, A.; Bando, Y.K.; Murohara, T.; Nagata, K. Effects of various types of anesthesia on hemodynamics, cardiac function, and glucose and lipid metabolism in rats. Am. J. Physiol. Heart Circ. Physiol. 2016, 311, H1360–H1366. [Google Scholar] [CrossRef]
- Hasenour, C.M.; Wall, M.L.; Ridley, D.E.; Hughey, C.C.; James, F.D.; Wasserman, D.H.; Young, J.D. Mass spectrometry-based microassay of (2)H and (13)C plasma glucose labeling to quantify liver metabolic fluxes in vivo. Am. J. Physiol. Endocrinol. Metab. 2015, 309, E191–E203. [Google Scholar] [CrossRef] [PubMed]
- Sun, R.C.; Fan, T.W.; Deng, P.; Higashi, R.M.; Lane, A.N.; Le, A.T.; Scott, T.L.; Sun, Q.; Warmoes, M.O.; Yang, Y. Noninvasive liquid diet delivery of stable isotopes into mouse models for deep metabolic network tracing. Nat. Commun. 2017, 8, 1646. [Google Scholar] [CrossRef] [PubMed]
- Gonzalez-Dominguez, R.; Gonzalez-Dominguez, A.; Sayago, A.; Fernandez-Recamales, A. Recommendations and Best Practices for Standardizing the Pre-Analytical Processing of Blood and Urine Samples in Metabolomics. Metabolites 2020, 10, 229. [Google Scholar] [CrossRef] [PubMed]
- Lin, P.; Fan, T.W.-M.; Lane, A.N. NMR-based isotope editing, chemoselection and isotopomer distribution analysis in stable isotope resolved metabolomics. Methods 2022, 206, 8–17. [Google Scholar] [CrossRef] [PubMed]
- Matwiyoff, N.A.; Ott, D.G. Stable isotope tracers in the life sciences and medicine. Science 1973, 181, 1125–1133. [Google Scholar] [CrossRef] [PubMed]
- Radda, G.K.; Seeley, P.J. Recent studies on cellular metabolism by nuclear magnetic resonance. Annu. Rev. Physiol. 1979, 41, 749–769. [Google Scholar] [CrossRef] [PubMed]
- Shulman, R.G.; Brown, T.R.; Ugurbil, K.; Ogawa, S.; Cohen, S.M.; den Hollander, J.A. Cellular applications of 31P and 13C nuclear magnetic resonance. Science 1979, 205, 160–166. [Google Scholar] [CrossRef] [PubMed]
- Hesketh, R.L.; Brindle, K.M. Magnetic resonance imaging of cancer metabolism with hyperpolarized (13)C-labeled cell metabolites. Curr. Opin. Chem. Biol. 2018, 45, 187–194. [Google Scholar] [CrossRef] [PubMed]
- Pantel, A.R.; Ackerman, D.; Lee, S.C.; Mankoff, D.A.; Gade, T.P. Imaging Cancer Metabolism: Underlying Biology and Emerging Strategies. J. Nucl. Med. 2018, 59, 1340–1349. [Google Scholar] [CrossRef]
- Woitek, R.; Gallagher, F.A. The use of hyperpolarised (13)C-MRI in clinical body imaging to probe cancer metabolism. Br. J. Cancer 2021, 124, 1187–1198. [Google Scholar] [CrossRef]
- Wang, Z.J.; Ohliger, M.A.; Larson, P.E.Z.; Gordon, J.W.; Bok, R.A.; Slater, J.; Villanueva-Meyer, J.E.; Hess, C.P.; Kurhanewicz, J.; Vigneron, D.B. Hyperpolarized (13)C MRI: State of the Art and Future Directions. Radiology 2019, 291, 273–284. [Google Scholar] [CrossRef]
- McKinstry, C.S. Nuclear magnetic resonance imaging in medicine. Ulster Med. J. 1986, 55, 97–111. [Google Scholar]
- Reeder, S.B.; Sirlin, C.B. Quantification of liver fat with magnetic resonance imaging. Magn. Reson. Imaging. Clin. N. Am. 2010, 18, 337–357. [Google Scholar] [CrossRef]
- Hensley, C.T.; Faubert, B.; Yuan, Q.; Lev-Cohain, N.; Jin, E.; Kim, J.; Jiang, L.; Ko, B.; Skelton, R.; Loudat, L.; et al. Metabolic Heterogeneity in Human Lung Tumors. Cell 2016, 164, 681–694. [Google Scholar] [CrossRef]
- Ardenkjaer-Larsen, J.H.; Fridlund, B.; Gram, A.; Hansson, G.; Hansson, L.; Lerche, M.H.; Servin, R.; Thaning, M.; Golman, K. Increase in signal-to-noise ratio of >10,000 times in liquid-state NMR. Proc. Natl. Acad. Sci. USA 2003, 100, 10158–10163. [Google Scholar] [CrossRef] [PubMed]
- Golman, K.; in ‘t Zandt, R.; Thaning, M. Real-time metabolic imaging. Proc. Natl. Acad. Sci. USA 2006, 103, 11270–11275. [Google Scholar] [CrossRef] [PubMed]
- Eskandari, R.; Kim, N.; Mamakhanyan, A.; Saoi, M.; Zhang, G.; Berisaj, M.; Granlund, K.L.; Poot, A.J.; Cross, J.; Thompson, C.B.; et al. Hyperpolarized [5-(13)C,4,4-(2)H(2),5-(15)N]-L-glutamine provides a means of annotating in vivo metabolic utilization of glutamine. Proc. Natl. Acad. Sci. USA 2022, 119, e2120595119. [Google Scholar] [CrossRef]
- Salamanca-Cardona, L.; Shah, H.; Poot, A.J.; Correa, F.M.; Di Gialleonardo, V.; Lui, H.; Miloushev, V.Z.; Granlund, K.L.; Tee, S.S.; Cross, J.R.; et al. In Vivo Imaging of Glutamine Metabolism to the Oncometabolite 2-Hydroxyglutarate in IDH1/2 Mutant Tumors. Cell Metab. 2017, 26, 830–841.e3. [Google Scholar] [CrossRef] [PubMed]
- Gallagher, F.A.; Woitek, R.; McLean, M.A.; Gill, A.B.; Manzano Garcia, R.; Provenzano, E.; Riemer, F.; Kaggie, J.; Chhabra, A.; Ursprung, S.; et al. Imaging breast cancer using hyperpolarized carbon-13 MRI. Proc. Natl. Acad. Sci. USA 2020, 117, 2092–2098. [Google Scholar] [CrossRef]
- Nelson, S.J.; Kurhanewicz, J.; Vigneron, D.B.; Larson, P.E.; Harzstark, A.L.; Ferrone, M.; van Criekinge, M.; Chang, J.W.; Bok, R.; Park, I.; et al. Metabolic imaging of patients with prostate cancer using hyperpolarized [1-(1)(3)C]pyruvate. Sci. Transl. Med. 2013, 5, 198ra108. [Google Scholar] [CrossRef]
- Aggarwal, R.; Vigneron, D.B.; Kurhanewicz, J. Hyperpolarized 1-[(13)C]-Pyruvate Magnetic Resonance Imaging Detects an Early Metabolic Response to Androgen Ablation Therapy in Prostate Cancer. Eur. Urol. 2017, 72, 1028–1029. [Google Scholar] [CrossRef]
- Edison, A.S.; Colonna, M.; Gouveia, G.J.; Holderman, N.R.; Judge, M.T.; Shen, X.; Zhang, S. NMR: Unique Strengths That Enhance Modern Metabolomics Research. Anal. Chem. 2021, 93, 478–499. [Google Scholar] [CrossRef]
- Simmler, C.; Napolitano, J.G.; McAlpine, J.B.; Chen, S.N.; Pauli, G.F. Universal quantitative NMR analysis of complex natural samples. Curr. Opin. Biotechnol. 2014, 25, 51–59. [Google Scholar] [CrossRef]
- Nagana Gowda, G.A.; Raftery, D. NMR-Based Metabolomics. Adv. Exp. Med. Biol. 2021, 1280, 19–37. [Google Scholar]
- Deja, S.; Fu, X.; Fletcher, J.A.; Kucejova, B.; Browning, J.D.; Young, J.D.; Burgess, S.C. Simultaneous tracers and a unified model of positional and mass isotopomers for quantification of metabolic flux in liver. Metab. Eng. 2020, 59, 1–14. [Google Scholar] [CrossRef]
- Stavarache, C.; Nicolescu, A.; Duduianu, C.; Ailiesei, G.L.; Balan-Porcarasu, M.; Cristea, M.; Macsim, A.M.; Popa, O.; Stavarache, C.; Hirtopeanu, A.; et al. A Real-Life Reproducibility Assessment for NMR Metabolomics. Diagnostics 2022, 12, 559. [Google Scholar] [CrossRef]
- Moco, S. Studying Metabolism by NMR-Based Metabolomics. Front. Mol. Biosci. 2022, 9, 882487. [Google Scholar] [CrossRef]
- Nagana Gowda, G.A.; Raftery, D. NMR Metabolomics Methods for Investigating Disease. Anal. Chem. 2023, 95, 83–99. [Google Scholar] [CrossRef]
- Gathungu, R.M.; Kautz, R.; Kristal, B.S.; Bird, S.S.; Vouros, P. The integration of LC-MS and NMR for the analysis of low molecular weight trace analytes in complex matrices. Mass Spectrom. Rev. 2020, 39, 35–54. [Google Scholar] [CrossRef]
- Misra, B.B. New software tools, databases, and resources in metabolomics: Updates from 2020. Metabolomics 2021, 17, 49. [Google Scholar] [CrossRef]
- Zhang, Y.; Gao, B.; Valdiviez, L.; Zhu, C.; Gallagher, T.; Whiteson, K.; Fiehn, O. Comparing Stable Isotope Enrichment by Gas Chromatography with Time-of-Flight, Quadrupole Time-of-Flight, and Quadrupole Mass Spectrometry. Anal. Chem. 2021, 93, 2174–2182. [Google Scholar] [CrossRef]
- Flasch, M.; Bueschl, C.; Del Favero, G.; Adam, G.; Schuhmacher, R.; Marko, D.; Warth, B. Elucidation of xenoestrogen metabolism by non-targeted, stable isotope-assisted mass spectrometry in breast cancer cells. Environ. Int. 2022, 158, 106940. [Google Scholar] [CrossRef]
- Evers, B.; Gerding, A.; Boer, T.; Heiner-Fokkema, M.R.; Jalving, M.; Wahl, S.A.; Reijngoud, D.J.; Bakker, B.M. Simultaneous Quantification of the Concentration and Carbon Isotopologue Distribution of Polar Metabolites in a Single Analysis by Gas Chromatography and Mass Spectrometry. Anal. Chem. 2021, 93, 8248–8256. [Google Scholar] [CrossRef]
- Scott, D.A. Analysis of Melanoma Cell Glutamine Metabolism by Stable Isotope Tracing and Gas Chromatography-Mass Spectrometry. Methods Mol. Biol. 2021, 2265, 91–110. [Google Scholar]
- Cai, F.; Bezwada, D.; Cai, L.; Mahar, R.; Wu, Z.; Chang, M.C.; Pachnis, P.; Yang, C.; Kelekar, S.; Gu, W.; et al. Comprehensive isotopomer analysis of glutamate and aspartate in small tissue samples. Cell Metab. 2023, 35, 1830–1843.e5. [Google Scholar] [CrossRef]
- Harrieder, E.M.; Kretschmer, F.; Bocker, S.; Witting, M. Current state-of-the-art of separation methods used in LC-MS based metabolomics and lipidomics. J. Chromatogr. B Anal. Technol. Biomed. Life Sci. 2022, 1188, 123069. [Google Scholar] [CrossRef]
- Chaleckis, R.; Meister, I.; Zhang, P.; Wheelock, C.E. Challenges, progress and promises of metabolite annotation for LC-MS-based metabolomics. Curr. Opin. Biotechnol. 2019, 55, 44–50. [Google Scholar] [CrossRef]
- Perez de Souza, L.; Alseekh, S.; Scossa, F.; Fernie, A.R. Ultra-high-performance liquid chromatography high-resolution mass spectrometry variants for metabolomics research. Nat. Methods 2021, 18, 733–746. [Google Scholar] [CrossRef]
- Ma, X.; Fernandez, F.M. Advances in mass spectrometry imaging for spatial cancer metabolomics. Mass Spectrom. Rev. 2024, 43, 235–268. [Google Scholar] [CrossRef]
- Caprioli, R.M.; Farmer, T.B.; Gile, J. Molecular imaging of biological samples: Localization of peptides and proteins using MALDI-TOF MS. Anal. Chem. 1997, 69, 4751–4760. [Google Scholar] [CrossRef]
- Wiseman, J.M.; Ifa, D.R.; Song, Q.; Cooks, R.G. Tissue imaging at atmospheric pressure using desorption electrospray ionization (DESI) mass spectrometry. Angew. Chem. Int. Ed. Engl. 2006, 45, 7188–7192. [Google Scholar] [CrossRef]
- Wang, L.; Xing, X.; Zeng, X.; Jackson, S.R.; TeSlaa, T.; Al-Dalahmah, O.; Samarah, L.Z.; Goodwin, K.; Yang, L.; McReynolds, M.R.; et al. Spatially resolved isotope tracing reveals tissue metabolic activity. Nat. Methods 2022, 19, 223–230. [Google Scholar] [CrossRef]
- Schwaiger-Haber, M.; Stancliffe, E.; Anbukumar, D.S.; Sells, B.; Yi, J.; Cho, K.; Adkins-Travis, K.; Chheda, M.G.; Shriver, L.P.; Patti, G.J. Using mass spectrometry imaging to map fluxes quantitatively in the tumor ecosystem. Nat. Commun. 2023, 14, 2876. [Google Scholar] [CrossRef]
- Ogrinc, N.; Kruszewski, A.; Chaillou, P.; Saudemont, P.; Lagadec, C.; Salzet, M.; Duriez, C.; Fournier, I. Robot-Assisted SpiderMass for In Vivo Real-Time Topography Mass Spectrometry Imaging. Anal. Chem. 2021, 93, 14383–14391. [Google Scholar] [CrossRef]
- Manoli, E.; Mason, S.; Ford, L.; Adebesin, A.; Bodai, Z.; Darzi, A.; Kinross, J.; Takats, Z. Validation of Ultrasonic Harmonic Scalpel for Real-Time Tissue Identification Using Rapid Evaporative Ionization Mass Spectrometry. Anal. Chem. 2021, 93, 5906–5916. [Google Scholar] [CrossRef]
- Zhang, J.; Rector, J.; Lin, J.Q.; Young, J.H.; Sans, M.; Katta, N.; Giese, N.; Yu, W.; Nagi, C.; Suliburk, J.; et al. Nondestructive tissue analysis for ex vivo and in vivo cancer diagnosis using a handheld mass spectrometry system. Sci. Transl. Med. 2017, 9, eaan3968. [Google Scholar] [CrossRef]
- Alseekh, S.; Aharoni, A.; Brotman, Y.; Contrepois, K.; D’Auria, J.; Ewald, J.; Ewald, J.C.; Fraser, P.D.; Giavalisco, P.; Hall, R.D.; et al. Mass spectrometry-based metabolomics: A guide for annotation, quantification and best reporting practices. Nat. Methods 2021, 18, 747–756. [Google Scholar] [CrossRef]
- Martens, A.; Holle, J.; Mollenhauer, B.; Wegner, A.; Kirwan, J.; Hiller, K. Instrumental Drift in Untargeted Metabolomics: Optimizing Data Quality with Intrastudy QC Samples. Metabolites 2023, 13, 665. [Google Scholar] [CrossRef]
- Clark, T.N.; Houriet, J.; Vidar, W.S.; Kellogg, J.J.; Todd, D.A.; Cech, N.B.; Linington, R.G. Interlaboratory Comparison of Untargeted Mass Spectrometry Data Uncovers Underlying Causes for Variability. J. Nat. Prod. 2021, 84, 824–835. [Google Scholar] [CrossRef]
- Lin, Y.; Caldwell, G.W.; Li, Y.; Lang, W.; Masucci, J. Inter-laboratory reproducibility of an untargeted metabolomics GC-MS assay for analysis of human plasma. Sci. Rep. 2020, 10, 10918. [Google Scholar] [CrossRef]
- Ghosh, R.; Bu, G.; Nannenga, B.L.; Sumner, L.W. Recent Developments toward Integrated Metabolomics Technologies (UHPLC-MS-SPE-NMR and MicroED) for Higher-Throughput Confident Metabolite Identifications. Front. Mol. Biosci. 2021, 8, 720955. [Google Scholar] [CrossRef]
- Rahim, M.; Ragavan, M.; Deja, S.; Merritt, M.E.; Burgess, S.C.; Young, J.D. INCA 2.0: A tool for integrated, dynamic modeling of NMR- and MS-based isotopomer measurements and rigorous metabolic flux analysis. Metab. Eng. 2022, 69, 275–285. [Google Scholar] [CrossRef]
- Domingo-Almenara, X.; Siuzdak, G. Metabolomics Data Processing Using XCMS. Methods Mol. Biol. 2020, 2104, 11–24. [Google Scholar]
- Li, Y.; Kind, T.; Folz, J.; Vaniya, A.; Mehta, S.S.; Fiehn, O. Spectral entropy outperforms MS/MS dot product similarity for small-molecule compound identification. Nat. Methods 2021, 18, 1524–1531. [Google Scholar] [CrossRef]
- Canueto, D.; Gomez, J.; Salek, R.M.; Correig, X.; Canellas, N. rDolphin: A GUI R package for proficient automatic profiling of 1D (1)H-NMR spectra of study datasets. Metabolomics 2018, 14, 24. [Google Scholar] [CrossRef]
- Rohnisch, H.E.; Eriksson, J.; Mullner, E.; Agback, P.; Sandstrom, C.; Moazzami, A.A. AQuA: An Automated Quantification Algorithm for High-Throughput NMR-Based Metabolomics and Its Application in Human Plasma. Anal. Chem. 2018, 90, 2095–2102. [Google Scholar] [CrossRef]
- Madrid-Gambin, F.; Oller-Moreno, S.; Fernandez, L.; Bartova, S.; Giner, M.P.; Joyce, C.; Ferraro, F.; Montoliu, I.; Moco, S.; Marco, S. AlpsNMR: An R package for signal processing of fully untargeted NMR-based metabolomics. Bioinformatics 2020, 36, 2943–2945. [Google Scholar] [CrossRef]
- Khakimov, B.; Mobaraki, N.; Trimigno, A.; Aru, V.; Engelsen, S.B. Signature Mapping (SigMa): An efficient approach for processing complex human urine (1)H NMR metabolomics data. Anal. Chim. Acta 2020, 1108, 142–151. [Google Scholar] [CrossRef]
- Clasquin, M.F.; Melamud, E.; Rabinowitz, J.D. LC-MS data processing with MAVEN: A metabolomic analysis and visualization engine. Curr. Protoc. Bioinform. 2012, 37, 14.11.1–14.11.23. [Google Scholar] [CrossRef]
- Adams, K.J.; Pratt, B.; Bose, N.; Dubois, L.G.; St John-Williams, L.; Perrott, K.M.; Ky, K.; Kapahi, P.; Sharma, V.; MacCoss, M.J.; et al. Skyline for Small Molecules: A Unifying Software Package for Quantitative Metabolomics. J. Proteome Res. 2020, 19, 1447–1458. [Google Scholar] [CrossRef]
- Gomez, J.D.; Wall, M.L.; Rahim, M.; Kambhampati, S.; Evans, B.S.; Allen, D.K.; Antoniewicz, M.R.; Young, J.D. Program for Integration and Rapid Analysis of Mass Isotopomer Distributions (PIRAMID). Bioinformatics 2023, 39, btad661. [Google Scholar] [CrossRef]
- Pang, Z.; Lu, Y.; Zhou, G.; Hui, F.; Xu, L.; Viau, C.; Spigelman, A.F.; MacDonald, P.E.; Wishart, D.S.; Li, S.; et al. MetaboAnalyst 6.0: Towards a unified platform for metabolomics data processing, analysis and interpretation. Nucleic Acids Res. 2024, gkae253. [Google Scholar] [CrossRef]
- Tsugawa, H.; Cajka, T.; Kind, T.; Ma, Y.; Higgins, B.; Ikeda, K.; Kanazawa, M.; VanderGheynst, J.; Fiehn, O.; Arita, M. MS-DIAL: Data-independent MS/MS deconvolution for comprehensive metabolome analysis. Nat. Methods 2015, 12, 523–526. [Google Scholar] [CrossRef]
- Schmid, R.; Heuckeroth, S.; Korf, A.; Smirnov, A.; Myers, O.; Dyrlund, T.S.; Bushuiev, R.; Murray, K.J.; Hoffmann, N.; Lu, M.; et al. Integrative analysis of multimodal mass spectrometry data in MZmine 3. Nat. Biotechnol. 2023, 41, 447–449. [Google Scholar] [CrossRef]
- Huang, X.; Chen, Y.J.; Cho, K.; Nikolskiy, I.; Crawford, P.A.; Patti, G.J. X13CMS: Global tracking of isotopic labels in untargeted metabolomics. Anal. Chem. 2014, 86, 1632–1639. [Google Scholar] [CrossRef]
- Kiefer, P.; Schmitt, U.; Muller, J.E.; Hartl, J.; Meyer, F.; Ryffel, F.; Vorholt, J.A. DynaMet: A fully automated pipeline for dynamic LC-MS data. Anal. Chem. 2015, 87, 9679–9686. [Google Scholar] [CrossRef]
- Capellades, J.; Navarro, M.; Samino, S.; Garcia-Ramirez, M.; Hernandez, C.; Simo, R.; Vinaixa, M.; Yanes, O. geoRge: A Computational Tool To Detect the Presence of Stable Isotope Labeling in LC/MS-Based Untargeted Metabolomics. Anal. Chem. 2016, 88, 621–628. [Google Scholar] [CrossRef]
- Hoffmann, F.; Jaeger, C.; Bhattacharya, A.; Schmitt, C.A.; Lisec, J. Nontargeted Identification of Tracer Incorporation in High-Resolution Mass Spectrometry. Anal. Chem. 2018, 90, 7253–7260. [Google Scholar] [CrossRef]
- Wang, R.; Yin, Y.; Li, J.; Wang, H.; Lv, W.; Gao, Y.; Wang, T.; Zhong, Y.; Zhou, Z.; Cai, Y.; et al. Global stable-isotope tracing metabolomics reveals system-wide metabolic alternations in aging Drosophila. Nat. Commun. 2022, 13, 3518. [Google Scholar] [CrossRef]
- Midani, F.S.; Wynn, M.L.; Schnell, S. The importance of accurately correcting for the natural abundance of stable isotopes. Anal. Biochem. 2017, 520, 27–43. [Google Scholar] [CrossRef]
- Millard, P.; Delepine, B.; Guionnet, M.; Heuillet, M.; Bellvert, F.; Letisse, F. IsoCor: Isotope correction for high-resolution MS labeling experiments. Bioinformatics 2019, 35, 4484–4487. [Google Scholar] [CrossRef]
- Wang, Y.; Parsons, L.R.; Su, X. AccuCor2: Isotope natural abundance correction for dual-isotope tracer experiments. Lab. Investig. 2021, 101, 1403–1410. [Google Scholar] [CrossRef]
- Heinrich, P.; Kohler, C.; Ellmann, L.; Kuerner, P.; Spang, R.; Oefner, P.J.; Dettmer, K. Correcting for natural isotope abundance and tracer impurity in MS-, MS/MS- and high-resolution-multiple-tracer-data from stable isotope labeling experiments with IsoCorrectoR. Sci. Rep. 2018, 8, 17910. [Google Scholar] [CrossRef]
- Nilsson, R. Validity of natural isotope abundance correction for metabolic flux analysis. Math. Biosci. 2020, 330, 108481. [Google Scholar] [CrossRef]
- Kumar, A.; Mitchener, J.; King, Z.A.; Metallo, C.M. Escher-Trace: A web application for pathway-based visualization of stable isotope tracing data. BMC Bioinform. 2020, 21, 297. [Google Scholar] [CrossRef]
- Hui, S.; Ghergurovich, J.M.; Morscher, R.J.; Jang, C.; Teng, X.; Lu, W.; Esparza, L.A.; Reya, T.; Le, Z.; Yanxiang Guo, J.; et al. Glucose feeds the TCA cycle via circulating lactate. Nature 2017, 551, 115–118. [Google Scholar] [CrossRef]
- Zamboni, N.; Fendt, S.M.; Ruhl, M.; Sauer, U. (13)C-based metabolic flux analysis. Nat. Protoc. 2009, 4, 878–892. [Google Scholar] [CrossRef]
- Antoniewicz, M.R. A guide to (13)C metabolic flux analysis for the cancer biologist. Exp. Mol. Med. 2018, 50, 1–13. [Google Scholar] [CrossRef]
- Liu, S.; Dai, Z.; Cooper, D.E.; Kirsch, D.G.; Locasale, J.W. Quantitative Analysis of the Physiological Contributions of Glucose to the TCA Cycle. Cell Metab. 2020, 32, 619–628.e21. [Google Scholar] [CrossRef]
- Cheah, Y.E.; Young, J.D. Isotopically nonstationary metabolic flux analysis (INST-MFA): Putting theory into practice. Curr. Opin. Biotechnol. 2018, 54, 80–87. [Google Scholar] [CrossRef]
- Orth, J.D.; Thiele, I.; Palsson, B.O. What is flux balance analysis? Nat. Biotechnol. 2010, 28, 245–248. [Google Scholar] [CrossRef]
- Weitzel, M.; Noh, K.; Dalman, T.; Niedenfuhr, S.; Stute, B.; Wiechert, W. 13CFLUX2—high-performance software suite for (13)C-metabolic flux analysis. Bioinformatics 2013, 29, 143–145. [Google Scholar] [CrossRef]
- Young, J.D. INCA: A computational platform for isotopically non-stationary metabolic flux analysis. Bioinformatics 2014, 30, 1333–1335. [Google Scholar] [CrossRef]
- Zamboni, N.; Fischer, E.; Sauer, U. FiatFlux--a software for metabolic flux analysis from 13C-glucose experiments. BMC Bioinform. 2005, 6, 209. [Google Scholar] [CrossRef]
- Matsuda, F.; Maeda, K.; Taniguchi, T.; Kondo, Y.; Yatabe, F.; Okahashi, N.; Shimizu, H. mfapy: An open-source Python package for (13)C-based metabolic flux analysis. Metab. Eng. Commun. 2021, 13, e00177. [Google Scholar] [CrossRef]
- He, L.; Wu, S.G.; Zhang, M.; Chen, Y.; Tang, Y.J. WUFlux: An open-source platform for (13)C metabolic flux analysis of bacterial metabolism. BMC Bioinform. 2016, 17, 444. [Google Scholar] [CrossRef]
- Wu, C.; Guarnieri, M.; Xiong, W. FreeFlux: A Python Package for Time-Efficient Isotopically Nonstationary Metabolic Flux Analysis. ACS Synth. Biol. 2023, 12, 2707–2714. [Google Scholar] [CrossRef]
- Long, C.P.; Antoniewicz, M.R. High-resolution (13)C metabolic flux analysis. Nat. Protoc. 2019, 14, 2856–2877. [Google Scholar] [CrossRef]
- Yoo, H.; Antoniewicz, M.R.; Stephanopoulos, G.; Kelleher, J.K. Quantifying reductive carboxylation flux of glutamine to lipid in a brown adipocyte cell line. J. Biol. Chem. 2008, 283, 20621–20627. [Google Scholar] [CrossRef]
- Wang, Y.; Wondisford, F.E.; Song, C.; Zhang, T.; Su, X. Metabolic Flux Analysis-Linking Isotope Labeling and Metabolic Fluxes. Metabolites 2020, 10, 447. [Google Scholar] [CrossRef]
- Moiz, B.; Sriram, G.; Clyne, A.M. Interpreting metabolic complexity via isotope-assisted metabolic flux analysis. Trends Biochem. Sci. 2023, 48, 553–567. [Google Scholar] [CrossRef]
- Crooks, D.R.; Fan, T.W.; Linehan, W.M. Metabolic Labeling of Cultured Mammalian Cells for Stable Isotope-Resolved Metabolomics: Practical Aspects of Tissue Culture and Sample Extraction. Methods Mol. Biol. 2019, 1928, 1–27. [Google Scholar]
- Fernandez-Garcia, J.; Altea-Manzano, P.; Pranzini, E.; Fendt, S.M. Stable Isotopes for Tracing Mammalian-Cell Metabolism In Vivo. Trends Biochem. Sci. 2020, 45, 185–201. [Google Scholar] [CrossRef]
- van Gastel, N.; Spinelli, J.B.; Haigis, M.C.; Scadden, D.T. Analysis of Leukemia Cell Metabolism through Stable Isotope Tracing in Mice. Bio Protocl 2021, 11, e4171. [Google Scholar] [CrossRef]
- Jin, J.; Byun, J.K.; Choi, Y.K.; Park, K.G. Targeting glutamine metabolism as a therapeutic strategy for cancer. Exp. Mol. Med. 2023, 55, 706–715. [Google Scholar] [CrossRef]
- Kodama, M.; Oshikawa, K.; Shimizu, H.; Yoshioka, S.; Takahashi, M.; Izumi, Y.; Bamba, T.; Tateishi, C.; Tomonaga, T.; Matsumoto, M.; et al. A shift in glutamine nitrogen metabolism contributes to the malignant progression of cancer. Nat. Commun. 2020, 11, 1320. [Google Scholar] [CrossRef]
- Bott, A.J.; Shen, J.; Tonelli, C.; Zhan, L.; Sivaram, N.; Jiang, Y.P.; Yu, X.; Bhatt, V.; Chiles, E.; Zhong, H.; et al. Glutamine Anabolism Plays a Critical Role in Pancreatic Cancer by Coupling Carbon and Nitrogen Metabolism. Cell Rep. 2019, 29, 1287–1298.e6. [Google Scholar] [CrossRef]
- Kaushik, A.K.; Tarangelo, A.; Boroughs, L.K.; Ragavan, M.; Zhang, Y.; Wu, C.Y.; Li, X.; Ahumada, K.; Chiang, J.C.; Tcheuyap, V.T.; et al. In vivo characterization of glutamine metabolism identifies therapeutic targets in clear cell renal cell carcinoma. Sci. Adv. 2022, 8, eabp8293. [Google Scholar] [CrossRef]
- Fan, J.; Kamphorst, J.J.; Rabinowitz, J.D.; Shlomi, T. Fatty acid labeling from glutamine in hypoxia can be explained by isotope exchange without net reductive isocitrate dehydrogenase (IDH) flux. J. Biol. Chem. 2013, 288, 31363–31369. [Google Scholar] [CrossRef]
- Wang, Y.; Bai, C.; Ruan, Y.; Liu, M.; Chu, Q.; Qiu, L.; Yang, C.; Li, B. Coordinative metabolism of glutamine carbon and nitrogen in proliferating cancer cells under hypoxia. Nat. Commun. 2019, 10, 201. [Google Scholar] [CrossRef]
- Mendez-Lucas, A.; Lin, W.; Driscoll, P.C.; Legrave, N.; Novellasdemunt, L.; Xie, C.; Charles, M.; Wilson, Z.; Jones, N.P.; Rayport, S.; et al. Identifying strategies to target the metabolic flexibility of tumours. Nat. Metab. 2020, 2, 335–350. [Google Scholar] [CrossRef]
- Hart, M.L.; Quon, E.; Vigil, A.B.G.; Engstrom, I.A.; Newsom, O.J.; Davidsen, K.; Hoellerbauer, P.; Carlisle, S.M.; Sullivan, L.B. Mitochondrial redox adaptations enable alternative aspartate synthesis in SDH-deficient cells. eLife 2023, 12, e78654. [Google Scholar] [CrossRef] [PubMed]
- Ricci, L.; Stanley, F.U.; Eberhart, T.; Mainini, F.; Sumpton, D.; Cardaci, S. Pyruvate transamination and NAD biosynthesis enable proliferation of succinate dehydrogenase-deficient cells by supporting aerobic glycolysis. Cell Death Dis. 2023, 14, 403. [Google Scholar] [CrossRef] [PubMed]
- Linder, S.J.; Bernasocchi, T.; Martinez-Pastor, B.; Sullivan, K.D.; Galbraith, M.D.; Lewis, C.A.; Ferrer, C.M.; Boon, R.; Silveira, G.G.; Cho, H.M.; et al. Inhibition of the proline metabolism rate-limiting enzyme P5CS allows proliferation of glutamine-restricted cancer cells. Nat. Metab. 2023, 5, 2131–2147. [Google Scholar] [CrossRef]
- Kim, J.; DeBerardinis, R.J. Mechanisms and Implications of Metabolic Heterogeneity in Cancer. Cell Metab. 2019, 30, 434–446. [Google Scholar] [CrossRef]
- Vitale, I.; Shema, E.; Loi, S.; Galluzzi, L. Intratumoral heterogeneity in cancer progression and response to immunotherapy. Nat. Med. 2021, 27, 212–224. [Google Scholar] [CrossRef]
- Haffner, M.C.; Zwart, W.; Roudier, M.P.; True, L.D.; Nelson, W.G.; Epstein, J.I.; De Marzo, A.M.; Nelson, P.S.; Yegnasubramanian, S. Genomic and phenotypic heterogeneity in prostate cancer. Nat. Rev. Urol. 2021, 18, 79–92. [Google Scholar] [CrossRef]
- Fidelito, G.; De Souza, D.P.; Niranjan, B.; De Nardo, W.; Keerthikumar, S.; Brown, K.; Taylor, R.A.; Watt, M.J. Multi-substrate Metabolic Tracing Reveals Marked Heterogeneity and Dependency on Fatty Acid Metabolism in Human Prostate Cancer. Mol. Cancer Res. 2023, 21, 359–373. [Google Scholar] [CrossRef]
- Zhang, Y.; Guillermier, C.; De Raedt, T.; Cox, A.G.; Maertens, O.; Yimlamai, D.; Lun, M.; Whitney, A.; Maas, R.L.; Goessling, W.; et al. Imaging Mass Spectrometry Reveals Tumor Metabolic Heterogeneity. iScience 2020, 23, 101355. [Google Scholar] [CrossRef]
- Gross, M.I.; Demo, S.D.; Dennison, J.B.; Chen, L.; Chernov-Rogan, T.; Goyal, B.; Janes, J.R.; Laidig, G.J.; Lewis, E.R.; Li, J.; et al. Antitumor activity of the glutaminase inhibitor CB-839 in triple-negative breast cancer. Mol. Cancer Ther. 2014, 13, 890–901. [Google Scholar] [CrossRef]
- Ren, L.; Ruiz-Rodado, V.; Dowdy, T.; Huang, S.; Issaq, S.H.; Beck, J.; Wang, H.; Tran Hoang, C.; Lita, A.; Larion, M.; et al. Glutaminase-1 (GLS1) inhibition limits metastatic progression in osteosarcoma. Cancer Metab. 2020, 8, 4. [Google Scholar] [CrossRef] [PubMed]
- Zhang, X.; Halberstam, A.A.; Zhu, W.; Leitner, B.P.; Thakral, D.; Bosenberg, M.W.; Perry, R.J. Isotope tracing reveals distinct substrate preference in murine melanoma subtypes with differing anti-tumor immunity. Cancer Metab. 2022, 10, 21. [Google Scholar] [CrossRef] [PubMed]
- Kay, E.J.; Paterson, K.; Riera-Domingo, C.; Sumpton, D.; Dabritz, J.H.M.; Tardito, S.; Boldrini, C.; Hernandez-Fernaud, J.R.; Athineos, D.; Dhayade, S.; et al. Cancer-associated fibroblasts require proline synthesis by PYCR1 for the deposition of pro-tumorigenic extracellular matrix. Nat. Metab. 2022, 4, 693–710. [Google Scholar] [CrossRef] [PubMed]
- Yang, W.H.; Qiu, Y.; Stamatatos, O.; Janowitz, T.; Lukey, M.J. Enhancing the Efficacy of Glutamine Metabolism Inhibitors in Cancer Therapy. Trends Cancer 2021, 7, 790–804. [Google Scholar] [CrossRef] [PubMed]
- Zhang, J.; Ahn, W.S.; Gameiro, P.A.; Keibler, M.A.; Zhang, Z.; Stephanopoulos, G. 13C isotope-assisted methods for quantifying glutamine metabolism in cancer cells. Methods Enzymol. 2014, 542, 369–389. [Google Scholar] [PubMed]
- De Los Santos-Jimenez, J.; Rosales, T.; Ko, B.; Campos-Sandoval, J.A.; Alonso, F.J.; Marquez, J.; DeBerardinis, R.J.; Mates, J.M. Metabolic Adjustments following Glutaminase Inhibition by CB-839 in Glioblastoma Cell Lines. Cancers 2023, 15, 531. [Google Scholar] [CrossRef] [PubMed]
- Encarnacion-Rosado, J.; Sohn, A.S.W.; Biancur, D.E.; Lin, E.Y.; Osorio-Vasquez, V.; Rodrick, T.; Gonzalez-Baerga, D.; Zhao, E.; Yokoyama, Y.; Simeone, D.M.; et al. Targeting pancreatic cancer metabolic dependencies through glutamine antagonism. Nat. Cancer 2024, 5, 85–99. [Google Scholar] [CrossRef] [PubMed]
- Lee, P.; Malik, D.; Perkons, N.; Huangyang, P.; Khare, S.; Rhoades, S.; Gong, Y.Y.; Burrows, M.; Finan, J.M.; Nissim, I.; et al. Targeting glutamine metabolism slows soft tissue sarcoma growth. Nat. Commun. 2020, 11, 498. [Google Scholar] [CrossRef] [PubMed]
- Wu, S.; Fukumoto, T.; Lin, J.; Nacarelli, T.; Wang, Y.; Ong, D.; Liu, H.; Fatkhutdinov, N.; Zundell, J.A.; Karakashev, S.; et al. Targeting glutamine dependence through GLS1 inhibition suppresses ARID1A-inactivated clear cell ovarian carcinoma. Nat. Cancer 2021, 2, 189–200. [Google Scholar] [CrossRef]
- Xu, L.; Yin, Y.; Li, Y.; Chen, X.; Chang, Y.; Zhang, H.; Liu, J.; Beasley, J.; McCaw, P.; Zhang, H.; et al. A glutaminase isoform switch drives therapeutic resistance and disease progression of prostate cancer. Proc. Natl. Acad. Sci. USA 2021, 118, e2012748118. [Google Scholar] [CrossRef]
- Maxwell, R.E.; Nickel, V.S. 6-Diazo-5-oxo-L-norleucine, a new tumor-inhibitory substance. V. Microbiologic studies of mode of action. Antibiot. Chemother. 1957, 7, 81–89. [Google Scholar]
- Coffey, G.L.; Ehrlich, J.; Fisher, M.W.; Hillegas, A.B.; Kohberger, D.L.; Machamer, H.E.; Rightsel, W.A.; Roegner, F.R. 6-Diazo-5-oxo-L-norleucine, a new tumor-inhibitory substance. I. Biologic studies. Antibiot. Chemother. 1956, 6, 487–497. [Google Scholar]
- Rais, R.; Lemberg, K.M.; Tenora, L.; Arwood, M.L.; Pal, A.; Alt, J.; Wu, Y.; Lam, J.; Aguilar, J.M.H.; Zhao, L.; et al. Discovery of DRP-104, a tumor-targeted metabolic inhibitor prodrug. Sci. Adv. 2022, 8, eabq5925. [Google Scholar] [CrossRef] [PubMed]
- Yokoyama, Y.; Estok, T.M.; Wild, R. Sirpiglenastat (DRP-104) Induces Antitumor Efficacy through Direct, Broad Antagonism of Glutamine Metabolism and Stimulation of the Innate and Adaptive Immune Systems. Mol. Cancer Ther. 2022, 21, 1561–1572. [Google Scholar] [CrossRef] [PubMed]
- Pillai, R.; LeBoeuf, S.E.; Hao, Y.; New, C.; Blum, J.L.E.; Rashidfarrokhi, A.; Huang, S.M.; Bahamon, C.; Wu, W.L.; Karadal-Ferrena, B.; et al. Glutamine antagonist DRP-104 suppresses tumor growth and enhances response to checkpoint blockade in KEAP1 mutant lung cancer. Sci. Adv. 2024, 10, eadm9859. [Google Scholar] [CrossRef] [PubMed]
- Shi, D.D.; Savani, M.R.; Levitt, M.M.; Wang, A.C.; Endress, J.E.; Bird, C.E.; Buehler, J.; Stopka, S.A.; Regan, M.S.; Lin, Y.F.; et al. De novo pyrimidine synthesis is a targetable vulnerability in IDH mutant glioma. Cancer Cell 2022, 40, 939–956.e16. [Google Scholar] [CrossRef] [PubMed]
- Lee, M.S.; Dennis, C.; Naqvi, I.; Dailey, L.; Lorzadeh, A.; Ye, G.; Zaytouni, T.; Adler, A.; Hitchcock, D.S.; Lin, L.; et al. Ornithine aminotransferase supports polyamine synthesis in pancreatic cancer. Nature 2023, 616, 339–347. [Google Scholar] [CrossRef] [PubMed]
- Naser, F.J.; Jackstadt, M.M.; Fowle-Grider, R.; Spalding, J.L.; Cho, K.; Stancliffe, E.; Doonan, S.R.; Kramer, E.T.; Yao, L.; Krasnick, B.; et al. Isotope tracing in adult zebrafish reveals alanine cycling between melanoma and liver. Cell Metab. 2021, 33, 1493–1504.e5. [Google Scholar] [CrossRef] [PubMed]
- Pachnis, P.; Wu, Z.; Faubert, B.; Tasdogan, A.; Gu, W.; Shelton, S.; Solmonson, A.; Rao, A.D.; Kaushik, A.K.; Rogers, T.J.; et al. In vivo isotope tracing reveals a requirement for the electron transport chain in glucose and glutamine metabolism by tumors. Sci. Adv. 2022, 8, eabn9550. [Google Scholar] [CrossRef]
- Khayati, K.; Bhatt, V.; Lan, T.; Alogaili, F.; Wang, W.; Lopez, E.; Hu, Z.S.; Gokhale, S.; Cassidy, L.; Narita, M.; et al. Transient Systemic Autophagy Inhibition Is Selectively and Irreversibly Deleterious to Lung Cancer. Cancer Res. 2022, 82, 4429–4443. [Google Scholar] [CrossRef]
- Vander Heiden, M.G.; Cantley, L.C.; Thompson, C.B. Understanding the Warburg effect: The metabolic requirements of cell proliferation. Science 2009, 324, 1029–1033. [Google Scholar] [CrossRef] [PubMed]
- Notarangelo, G.; Spinelli, J.B.; Perez, E.M.; Baker, G.J.; Kurmi, K.; Elia, I.; Stopka, S.A.; Baquer, G.; Lin, J.R.; Golby, A.J.; et al. Oncometabolite d-2HG alters T cell metabolism to impair CD8(+) T cell function. Science 2022, 377, 1519–1529. [Google Scholar] [CrossRef] [PubMed]
- Campbell, S.; Mesaros, C.; Izzo, L.; Affronti, H.; Noji, M.; Schaffer, B.E.; Tsang, T.; Sun, K.; Trefely, S.; Kruijning, S.; et al. Glutamine deprivation triggers NAGK-dependent hexosamine salvage. eLife 2021, 10, e62644. [Google Scholar] [CrossRef] [PubMed]
- Tan, Y.; Li, J.; Zhao, G.; Huang, K.C.; Cardenas, H.; Wang, Y.; Matei, D.; Cheng, J.X. Metabolic reprogramming from glycolysis to fatty acid uptake and beta-oxidation in platinum-resistant cancer cells. Nat. Commun. 2022, 13, 4554. [Google Scholar] [CrossRef] [PubMed]
- Wood, L.D.; Canto, M.I.; Jaffee, E.M.; Simeone, D.M. Pancreatic Cancer: Pathogenesis, Screening, Diagnosis, and Treatment. Gastroenterology 2022, 163, 386–402.e1. [Google Scholar] [CrossRef] [PubMed]
- Nwosu, Z.C.; Ward, M.H.; Sajjakulnukit, P.; Poudel, P.; Ragulan, C.; Kasperek, S.; Radyk, M.; Sutton, D.; Menjivar, R.E.; Andren, A.; et al. Uridine-derived ribose fuels glucose-restricted pancreatic cancer. Nature 2023, 618, 151–158. [Google Scholar] [CrossRef]
- McGuirk, S.; Audet-Delage, Y.; St-Pierre, J. Metabolic Fitness and Plasticity in Cancer Progression. Trends Cancer 2020, 6, 49–61. [Google Scholar] [CrossRef]
- Boumahdi, S.; de Sauvage, F.J. The great escape: Tumour cell plasticity in resistance to targeted therapy. Nat. Rev. Drug Discov. 2020, 19, 39–56. [Google Scholar] [CrossRef]
- Thankamony, A.P.; Saxena, K.; Murali, R.; Jolly, M.K.; Nair, R. Cancer Stem Cell Plasticity—A Deadly Deal. Front. Mol. Biosci. 2020, 7, 79. [Google Scholar] [CrossRef]
- Arner, E.N.; Rathmell, J.C. Metabolic programming and immune suppression in the tumor microenvironment. Cancer Cell 2023, 41, 421–433. [Google Scholar] [CrossRef]
- Perez-Gonzalez, A.; Bevant, K.; Blanpain, C. Cancer cell plasticity during tumor progression, metastasis and response to therapy. Nat. Cancer 2023, 4, 1063–1082. [Google Scholar] [CrossRef] [PubMed]
- Vasan, K.; Chandel, N.S. Molecular and cellular mechanisms underlying the failure of mitochondrial metabolism drugs in cancer clinical trials. J. Clin. Investig. 2024, 134, e176736. [Google Scholar] [CrossRef] [PubMed]
- Yap, T.A.; Daver, N.; Mahendra, M.; Zhang, J.; Kamiya-Matsuoka, C.; Meric-Bernstam, F.; Kantarjian, H.M.; Ravandi, F.; Collins, M.E.; Francesco, M.E.D.; et al. Complex I inhibitor of oxidative phosphorylation in advanced solid tumors and acute myeloid leukemia: Phase I trials. Nat. Med. 2023, 29, 115–126. [Google Scholar] [CrossRef] [PubMed]
- Molina, J.R.; Sun, Y.; Protopopova, M.; Gera, S.; Bandi, M.; Bristow, C.; McAfoos, T.; Morlacchi, P.; Ackroyd, J.; Agip, A.A.; et al. An inhibitor of oxidative phosphorylation exploits cancer vulnerability. Nat. Med. 2018, 24, 1036–1046. [Google Scholar] [CrossRef] [PubMed]
- Cazzoli, R.; Romeo, F.; Pallavicini, I.; Peri, S.; Romanenghi, M.; Perez-Valencia, J.A.; Hagag, E.; Ferrucci, F.; Elgendy, M.; Vittorio, O.; et al. Endogenous PP2A inhibitor CIP2A degradation by chaperone-mediated autophagy contributes to the antitumor effect of mitochondrial complex I inhibition. Cell Rep. 2023, 42, 112616. [Google Scholar] [CrossRef] [PubMed]
- Schmucker, R.; Farina, G.; Faeder, J.; Frohlich, F.; Saglam, A.S.; Sandholm, T. Combination treatment optimization using a pan-cancer pathway model. PLoS Comput. Biol. 2021, 17, e1009689. [Google Scholar] [CrossRef] [PubMed]
- Harding, J.J.; Telli, M.; Munster, P.; Voss, M.H.; Infante, J.R.; DeMichele, A.; Dunphy, M.; Le, M.H.; Molineaux, C.; Orford, K.; et al. A Phase I Dose-Escalation and Expansion Study of Telaglenastat in Patients with Advanced or Metastatic Solid Tumors. Clin. Cancer Res. 2021, 27, 4994–5003. [Google Scholar] [CrossRef] [PubMed]
- Tannir, N.M.; Agarwal, N.; Porta, C.; Lawrence, N.J.; Motzer, R.; McGregor, B.; Lee, R.J.; Jain, R.K.; Davis, N.; Appleman, L.J.; et al. Efficacy and Safety of Telaglenastat Plus Cabozantinib vs Placebo Plus Cabozantinib in Patients With Advanced Renal Cell Carcinoma: The CANTATA Randomized Clinical Trial. JAMA Oncol. 2022, 8, 1411–1418. [Google Scholar] [CrossRef] [PubMed]
- van Gastel, N.; Spinelli, J.B.; Sharda, A.; Schajnovitz, A.; Baryawno, N.; Rhee, C.; Oki, T.; Grace, E.; Soled, H.J.; Milosevic, J.; et al. Induction of a Timed Metabolic Collapse to Overcome Cancer Chemoresistance. Cell Metab. 2020, 32, 391–403.e6. [Google Scholar] [CrossRef]
- Guo, J.; Satoh, K.; Tabata, S.; Mori, M.; Tomita, M.; Soga, T. Reprogramming of glutamine metabolism via glutamine synthetase silencing induces cisplatin resistance in A2780 ovarian cancer cells. BMC Cancer 2021, 21, 174. [Google Scholar] [CrossRef]
- Mukha, A.; Kahya, U.; Linge, A.; Chen, O.; Lock, S.; Lukiyanchuk, V.; Richter, S.; Alves, T.C.; Peitzsch, M.; Telychko, V.; et al. GLS-driven glutamine catabolism contributes to prostate cancer radiosensitivity by regulating the redox state, stemness and ATG5-mediated autophagy. Theranostics 2021, 11, 7844–7868. [Google Scholar] [CrossRef]
- DePeaux, K.; Delgoffe, G.M. Metabolic barriers to cancer immunotherapy. Nat. Rev. Immunol. 2021, 21, 785–797. [Google Scholar] [CrossRef] [PubMed]
- Guo, C.; You, Z.; Shi, H.; Sun, Y.; Du, X.; Palacios, G.; Guy, C.; Yuan, S.; Chapman, N.M.; Lim, S.A.; et al. SLC38A2 and glutamine signalling in cDC1s dictate anti-tumour immunity. Nature 2023, 620, 200–208. [Google Scholar] [CrossRef]
- Byun, J.K.; Park, M.; Lee, S.; Yun, J.W.; Lee, J.; Kim, J.S.; Cho, S.J.; Jeon, H.J.; Lee, I.K.; Choi, Y.K.; et al. Inhibition of Glutamine Utilization Synergizes with Immune Checkpoint Inhibitor to Promote Antitumor Immunity. Mol. Cell 2020, 80, 592–606.e8. [Google Scholar] [CrossRef]
- Diaz-Serrano, A.; Gella, P.; Jimenez, E.; Zugazagoitia, J.; Paz-Ares Rodriguez, L. Targeting EGFR in Lung Cancer: Current Standards and Developments. Drugs 2018, 78, 893–911. [Google Scholar] [CrossRef]
- Mok, T.S.; Wu, Y.L.; Ahn, M.J.; Garassino, M.C.; Kim, H.R.; Ramalingam, S.S.; Shepherd, F.A.; He, Y.; Akamatsu, H.; Theelen, W.S.; et al. Osimertinib or Platinum-Pemetrexed in EGFR T790M-Positive Lung Cancer. N. Engl. J. Med. 2017, 376, 629–640. [Google Scholar] [CrossRef] [PubMed]
- Planchard, D.; Janne, P.A.; Cheng, Y.; Yang, J.C.; Yanagitani, N.; Kim, S.W.; Sugawara, S.; Yu, Y.; Fan, Y.; Geater, S.L.; et al. Osimertinib with or without Chemotherapy in EGFR-Mutated Advanced NSCLC. N. Engl. J. Med. 2023, 389, 1935–1948. [Google Scholar] [CrossRef]
- Recondo, G.; Facchinetti, F.; Olaussen, K.A.; Besse, B.; Friboulet, L. Making the first move in EGFR-driven or ALK-driven NSCLC: First-generation or next-generation TKI? Nat. Rev. Clin. Oncol. 2018, 15, 694–708. [Google Scholar] [CrossRef] [PubMed]
- Kim, S.; Jeon, J.S.; Choi, Y.J.; Baek, G.H.; Kim, S.K.; Kang, K.W. Heterogeneity of glutamine metabolism in acquired-EGFR-TKI-resistant lung cancer. Life Sci. 2022, 291, 120274. [Google Scholar] [CrossRef]
- DeBerardinis, R.J.; Keshari, K.R. Metabolic analysis as a driver for discovery, diagnosis, and therapy. Cell 2022, 185, 2678–2689. [Google Scholar] [CrossRef]
- Gonsalves, W.I.; Jang, J.S.; Jessen, E.; Hitosugi, T.; Evans, L.A.; Jevremovic, D.; Pettersson, X.M.; Bush, A.G.; Gransee, J.; Anderson, E.I.; et al. In vivo assessment of glutamine anaplerosis into the TCA cycle in human pre-malignant and malignant clonal plasma cells. Cancer Metab. 2020, 8, 29. [Google Scholar] [CrossRef]
- Chen, W.W.; Freinkman, E.; Sabatini, D.M. Rapid immunopurification of mitochondria for metabolite profiling and absolute quantification of matrix metabolites. Nat. Protoc. 2017, 12, 2215–2231. [Google Scholar] [CrossRef]
- Trefely, S.; Huber, K.; Liu, J.; Noji, M.; Stransky, S.; Singh, J.; Doan, M.T.; Lovell, C.D.; von Krusenstiern, E.; Jiang, H.; et al. Quantitative subcellular acyl-CoA analysis reveals distinct nuclear metabolism and isoleucine-dependent histone propionylation. Mol. Cell 2022, 82, 447–462.e6. [Google Scholar] [CrossRef]
- Hu, T.; Allam, M.; Cai, S.; Henderson, W.; Yueh, B.; Garipcan, A.; Ievlev, A.V.; Afkarian, M.; Beyaz, S.; Coskun, A.F. Single-cell spatial metabolomics with cell-type specific protein profiling for tissue systems biology. Nat. Commun. 2023, 14, 8260. [Google Scholar] [CrossRef]
- Liu, R.; Li, J.; Lan, Y.; Nguyen, T.D.; Chen, Y.A.; Yang, Z. Quantifying Cell Heterogeneity and Subpopulations Using Single Cell Metabolomics. Anal. Chem. 2023, 95, 7127–7133. [Google Scholar] [CrossRef]
- Zhu, G.; Zhang, W.; Zhao, Y.; Chen, T.; Yuan, H.; Liu, Y.; Guo, G.; Liu, Z.; Wang, X. Single-Cell Metabolomics-Based Strategy for Studying the Mechanisms of Drug Action. Anal. Chem. 2023, 95, 4712–4720. [Google Scholar] [CrossRef]
- Cao, J.; Yao, Q.J.; Wu, J.; Chen, X.; Huang, L.; Liu, W.; Qian, K.; Wan, J.J.; Zhou, B.O. Deciphering the metabolic heterogeneity of hematopoietic stem cells with single-cell resolution. Cell Metab. 2024, 36, 209–221.e6. [Google Scholar] [CrossRef]
- Grima-Reyes, M.; Martinez-Turtos, A.; Abramovich, I.; Gottlieb, E.; Chiche, J.; Ricci, J.E. Physiological impact of in vivo stable isotope tracing on cancer metabolism. Mol. Metab. 2021, 53, 101294. [Google Scholar] [CrossRef]
- Hasenour, C.M.; Rahim, M.; Young, J.D. In Vivo Estimates of Liver Metabolic Flux Assessed by (13)C-Propionate and (13)C-Lactate Are Impacted by Tracer Recycling and Equilibrium Assumptions. Cell Rep. 2020, 32, 107986. [Google Scholar] [CrossRef] [PubMed]
- Duan, L.; Cooper, D.E.; Scheidemantle, G.; Locasale, J.W.; Kirsch, D.G.; Liu, X. (13)C tracer analysis suggests extensive recycling of endogenous CO(2) in vivo. Cancer Metab. 2022, 10, 11. [Google Scholar] [CrossRef] [PubMed]
- Hui, S.; Cowan, A.J.; Zeng, X.; Yang, L.; TeSlaa, T.; Li, X.; Bartman, C.; Zhang, Z.; Jang, C.; Wang, L.; et al. Quantitative Fluxomics of Circulating Metabolites. Cell Metab. 2020, 32, 676–688.e4. [Google Scholar] [CrossRef]
- Kim, I.Y.; Park, S.; Kim, Y.; Kim, H.J.; Wolfe, R.R. Tracing metabolic flux in vivo: Basic model structures of tracer methodology. Exp. Mol. Med. 2022, 54, 1311–1322. [Google Scholar] [CrossRef]
- Antoniewicz, M.R. A guide to metabolic flux analysis in metabolic engineering: Methods, tools and applications. Metab. Eng. 2021, 63, 2–12. [Google Scholar] [CrossRef]
| Cancer Type | Isotope Tracer | Analytical Technique | ClinicalTrials.gov Identifier |
|---|---|---|---|
| Pancreatic Ductal Adenocarcinoma | [U-13C6]glucose | LC-MS | NCT05296421 |
| Multiple Myeloma | [U-13C5]glutamine | LC-MS | NCT03119883 [181] |
| Hormone Receptor Positive (HR+)/Her 2 Negative (Her2-) Breast Cancer | [U-13C6]glucose | LC-MS | NCT05736367 |
| Kidney or Urothelial Cancer | [U-13C6]glucose, [U-13C2]acetate, [U-13C3]lactate, [U-13C5]glutamine, [U-13C6]fructose | Unspecified | NCT04623502 |
| Brain Cancer | [U-13C6]glucose, [1,2-13C2]glucose | 13C NMR | NCT01668082 |
Disclaimer/Publisher’s Note: The statements, opinions and data contained in all publications are solely those of the individual author(s) and contributor(s) and not of MDPI and/or the editor(s). MDPI and/or the editor(s) disclaim responsibility for any injury to people or property resulting from any ideas, methods, instructions or products referred to in the content. |
© 2024 by the authors. Licensee MDPI, Basel, Switzerland. This article is an open access article distributed under the terms and conditions of the Creative Commons Attribution (CC BY) license (https://creativecommons.org/licenses/by/4.0/).
Share and Cite
Hilovsky, D.; Hartsell, J.; Young, J.D.; Liu, X. Stable Isotope Tracing Analysis in Cancer Research: Advancements and Challenges in Identifying Dysregulated Cancer Metabolism and Treatment Strategies. Metabolites 2024, 14, 318. https://doi.org/10.3390/metabo14060318
Hilovsky D, Hartsell J, Young JD, Liu X. Stable Isotope Tracing Analysis in Cancer Research: Advancements and Challenges in Identifying Dysregulated Cancer Metabolism and Treatment Strategies. Metabolites. 2024; 14(6):318. https://doi.org/10.3390/metabo14060318
Chicago/Turabian StyleHilovsky, Dalton, Joshua Hartsell, Jamey D. Young, and Xiaojing Liu. 2024. "Stable Isotope Tracing Analysis in Cancer Research: Advancements and Challenges in Identifying Dysregulated Cancer Metabolism and Treatment Strategies" Metabolites 14, no. 6: 318. https://doi.org/10.3390/metabo14060318