Abstract
In recent years, afforestation has been conducted in China’s hot and dry valleys. However, there is still a paucity of knowledge regarding the performance of tree species in these semi-arid regions, particularly with regard to interspecies differences. The present study compares the growth and metabolome characteristics of two widely used cypress species, namely Cupressus chengiana and Platycladus orientalis, grown at two sites with distinct climate conditions in the hot and dry Minjiang Valley in southwestern China. The findings indicate that C. chengiana trees exhibit superior growth rates compared to P. orientalis trees at both study sites. In comparison to P. orientalis trees, C. chengiana trees demonstrated a greater tendency to close their stomata in order to prevent water loss at the hotter and drier site, Llianghekou (LHK). Additionally, C. chengiana trees exhibited significantly lower hydrogen peroxide levels than P. orientalis trees, either due to lower production and/or higher scavenging of reactive oxygen species. C. chengiana trees accumulated soluble sugars as well as sugar derivatives, particularly those involved in sucrose and galactose metabolisms under stressful conditions. The species-specific differences were also reflected in metabolites involved in the tricarboxylic acid cycle, nitrogen, and secondary metabolisms. The metabolome profiles of the two species appeared to be influenced by the prevailing climatic conditions. It appeared that the trees at the drier and hotter site, LHK, were capable of efficient nitrogen uptake from the soil despite the low soil nitrogen concentration. This study is the first to compare the growth performance and metabolic profiles of two widely used tree species with high resistance to adverse conditions. In addition to the species-specific differences and adaptations to different sites, the present study also provides insights into potential management strategies to alleviate abiotic stress, particularly with regard to nitrogen nutrients, in the context of climate change.
Keywords:
dryland; carbohydrate; nitrogen; secondary metabolism; metabolome; soil; growth; afforestation; sugar; amino acid 1. Introduction
Drylands constitute about 45% of the world’s land surface [1,2]. Current projections indicate that this region will continue to expand by approximately 5.8 × 10⁶ km2 by the end of this century [3]. Forestation of the drylands has been considered a promising strategy to enhance carbon sequestration and benefits to the human environment. However, afforestation in these water-limited areas is a global challenge, particularly with increasing climate change [4]. In China, the large area of dry valleys along the upper streams of several rivers—for instance, the Yangtz, Lanchang, and Nu rivers, which surround the south and east Tibetan Plateau and are characterized by complex mountainous topography and typical hot and dry climate—is ecologically vulnerable and often affected by monsoon and foehn winds [5,6]. Since the 1990s, a series of ecological protection and restoration programs have been implemented by the Chinese government to improve the vegetation along the dry valleys. In the last decades, afforestation in these vulnerable areas has attracted a significant amount of local and international investment as an effective strategy for increasing carbon sequestration and mitigating the consequences of climate change [7,8,9,10].
The Minjiang River is a first-order branch of the Yangtze River; its upper-reach valley between the Tibetan Plateau and Sichuan Basin is a typical dry and hot belt with a length of 340 km and an area of about 23,000 km2 [11]. A drying trend with increasing numbers of heavy rainfall events is projected between 2030 and 2059 in the dry valley area [12]. Therefore, information on plants’ performance and resistance to projected dry and hot conditions is of particular importance for vegetation restoration and management. Previous studies were mainly focused on the responses of shrubs and grassland [13,14]; little is known about the tree species planted in this area in response to a dryer and hotter climate. The ability of tree species to cope with the dry and hot climate in these areas with shallow and poor soil is crucial to growth, development, and successful afforestation [8,9,10,15,16]. Cupressus chengiana and Platycladus orientalis are both long-lived, slow-growing evergreen tree species [17,18]. C. chengiana is listed as a “Second-Class Endangered Plant of China” and classified as “Vulnerable” by the IUCN. This species is naturally endemic to the northern Heng-duan mountain region [19]. P. orientalis is a widespread species native to China, and it is one of the most important afforesting tree species in northern China, especially in barren montane areas [18]. They have been widely planted in the last decades for afforestation in the dry valleys due to their high resistance to harsh environmental conditions such as drought, high temperature, and poor soil nutrients [17,18], and now have become the dominant tree species in the hot and dry Minjiang valley [20]. However, there is still little information on the differences in performance between the two species and their physiological responses to the hassle conditions.
In the present study, we investigate the growth pattern and their underlying biochemical mechanism of Cupressus chengiana and Platycladus orientalis from two sites with distinct water and temperature conditions. Specifically, we aimed to evaluate the growth performance, determine the metabolic similarity and difference of the two species in response to dry and hot climates, and provide information on afforestation in drylands in a projected warmer and drier climate.
2. Materials and Methods
2.1. Field Sites
The two field sites are located in the dry and hot valley (between 31°26′−33°16′ N and 102°59′−104°14′ E) of the upper Minjiang River, which is one of the four principal tributaries of the Yangtze River. The total area of the dry valley is about 23,000 km2 with a length of 340 km across Songpan, Heishui, Mao, Li, and Wenchuan counties on the eastern edge of Qinghai–Tibet Plain [11]. This region has a typical semi-arid continental monsoon climate. We selected two field sites with distinct climate conditions, i.e., the drier and hotter site Lianghekou (LHK, 31°50′ N,103°42′ E) located in the core area of the hot and dry Minjiang Valley, and one cool and wet site Cuojishan (CJS, 31°41′ N,103°51′ E) located in the edge of the hot and dry Minjiang valley. The elevation of LHK and CJS is 1820 m and 1655 m above sea level, respectively. Mean annual precipitation and air temperature were 369 mm and 13.3 °C at LHK and 574 mm and 10.6 °C at CJS, respectively [21]. The trees of Cupressus chengiana and Platycladus orientalis at CJS were planted in 2006, while they were planted in 2017 at LHK, both with 2-year-old seedlings of each species. Besides C. chengiana and P. orientalis, no other tree species were observed. The dominant shrub and grass species at LHK were Sophora viciifolia, Bauhinia faberi var. microphylla, and Ajania fruticulose. The dominant shrub and grass species at CJS were Sophora viciifolia, Jasminum humile, and Ajania fruticulose.
2.2. Tree Selection, Growth Measurement, and Leaf and Soil Sampling
Plant and soil sampling took place in October 2021. Leaf samples were harvested from six individual trees of each species at each site. For this purpose, a south-side twig at the middle crown was cut down, and leaves were immediately harvested and frozen in liquid nitrogen. The leaf samples were transferred to the lab under frozen and homogenized with mortar and pestle in liquid nitrogen and then stored at −80 °C until biochemical analysis. Soil samples were collected in two layers, 0–20 cm, and 20–40 cm, using a hand auger at the LHK and CJS sites. The litter was manually removed before sampling. Soil samples were stored in plastic bags at 4 °C before being passed through a 2-mm-mesh-width sieve for further analyses. Part of the soil and plant samples were dried in a 60 °C oven until reaching constant weight for water content determination. The water content of plants and soil was calculated using the following equation:
where FW and DW represent the fresh weight and dry weight of plant (hydration) or soil (water content), respectively.
water content (g H2O g−1 DW) = (FW − DW)/DW,
Tree height and basal diameter were determined in June 2024. For this purpose, 68 individual trees of C. chengiana and P. orientalis (34 of each) were selected at CJS, while 38 P. orientalis and 31 C. chengiana individual trees were selected at LHK. Trees were selected at the same study sites where leaf and soil samples were taken. The basal diameter was determined at 5 cm above the ground using a vernier caliper instead of the diameter at breast height, where the presence of numerous branches made direct measurement difficult. Tree height was measured using a tower ruler.
2.3. Biochemical Analyses
2.3.1. Biochemical Analyses of Soil Samples
Soil organic matter was quantified using the potassium dichromate volumetric method with external heating [22]. Total nitrogen (N) and organic carbon (C) concentrations were determined by the macro-Kjeldahl method with a Kjeldahl nitrogen analyzer [23] and the dichromate oxidation–sulfate–ferrous titration method [24], respectively. Soil total phosphorus (P) was measured using the acid dissolution-molybdenum antimony colorimetric method after digestion in a mixture of sulfuric acid and perchloric acid [23]. The contents of C, N, and P are calculated and presented on a dry-weight basis.
2.3.2. Biochemical Analyses of Leaf Samples
Hydrogen peroxide (H2O2) of leaf samples was extracted in 0.1% (w/v) trichloroacetic acid, and the absorbance was determined at 390 nm after reaction with 1 mol KI [25]. MDA was extracted in trichloroacetic acid, and the MDA content in the aqueous phase was calculated according to the absorbance recorded at 532 and 450 nm [26]. Total P contents were determined using the same method for soil P. Total C, N contents, as well as C and N isotopes, were measured with EA-IRMS (PYROCUBE coupled to an ISOPRIME IRMS, Elementar, Hanau, Germany) as previously described [27]. Soluble protein was extracted in Tris-HCl buffer and quantified using the colorimetric Bradford method as previously described [26]. Bovine serum albumin was used as a reference for quantification.
Low molecular weight metabolites were extracted and measured using an Agilent GC/MSD system consisting of an Agilent GC 7890A gas chromatograph (Agilent Technologies, Palo Alto, CA, USA) connected to a 5975C Inert XL EI/CI MSD quadrupole MS detector (Agilent Technologies) as described in Du et al. [25]. Peak detection and alignment were performed with the Quantitative Analysis Module of the Masshunter software (Agilent Technologies, Version B.07.00). Metabolites were normalized using the peak area of the internal standard, ribitol, and the dry weight of samples and presented as relative abundances. Signals corresponding to artefacts were omitted according to the analysis of ‘blank’ samples prepared in the same manner as biological samples. Total soluble sugar and amino acid contents in the extract for metabolome analysis were calorimetrically determined using the anthrone–sulfuric acid method and ninhydrin method, respectively [25,28].
2.4. Statistical Analysis
Statistical analyses were performed using SigmaPlot 12.0 (Systat Software GmbH, Erkrath, Germany). For leaf samples, differences between the two species within the same site and differences between the two sites of the same species were determined by Student’s t-test. For soil samples, the same method was performed to examine differences between the two layers (0–20 and 20–40 cm) within the same site and differences between the two sites of the same layer. Data were transformed by denary logarithm to match normal distribution when necessary. Data shown in the figures represent means ± SD of 6 plants (n = 6) on a dry weight basis. To have an overview of the species-specific and site-related effects, PLS-DA (partial least square discriminant analysis) was conducted using a public web tool (MetaboAnalyst 6.0, https://www.metaboanalyst.ca/MetaboAnalyst/ (accessed on 17 July 2024) [29] after log10 transformation and mean-centering. Missing values were replaced by 1/5 of the minimum abundance of respective compounds, assuming that their concentrations were below the detection limit.
3. Results
3.1. Soil Properties at the Two Field Sites
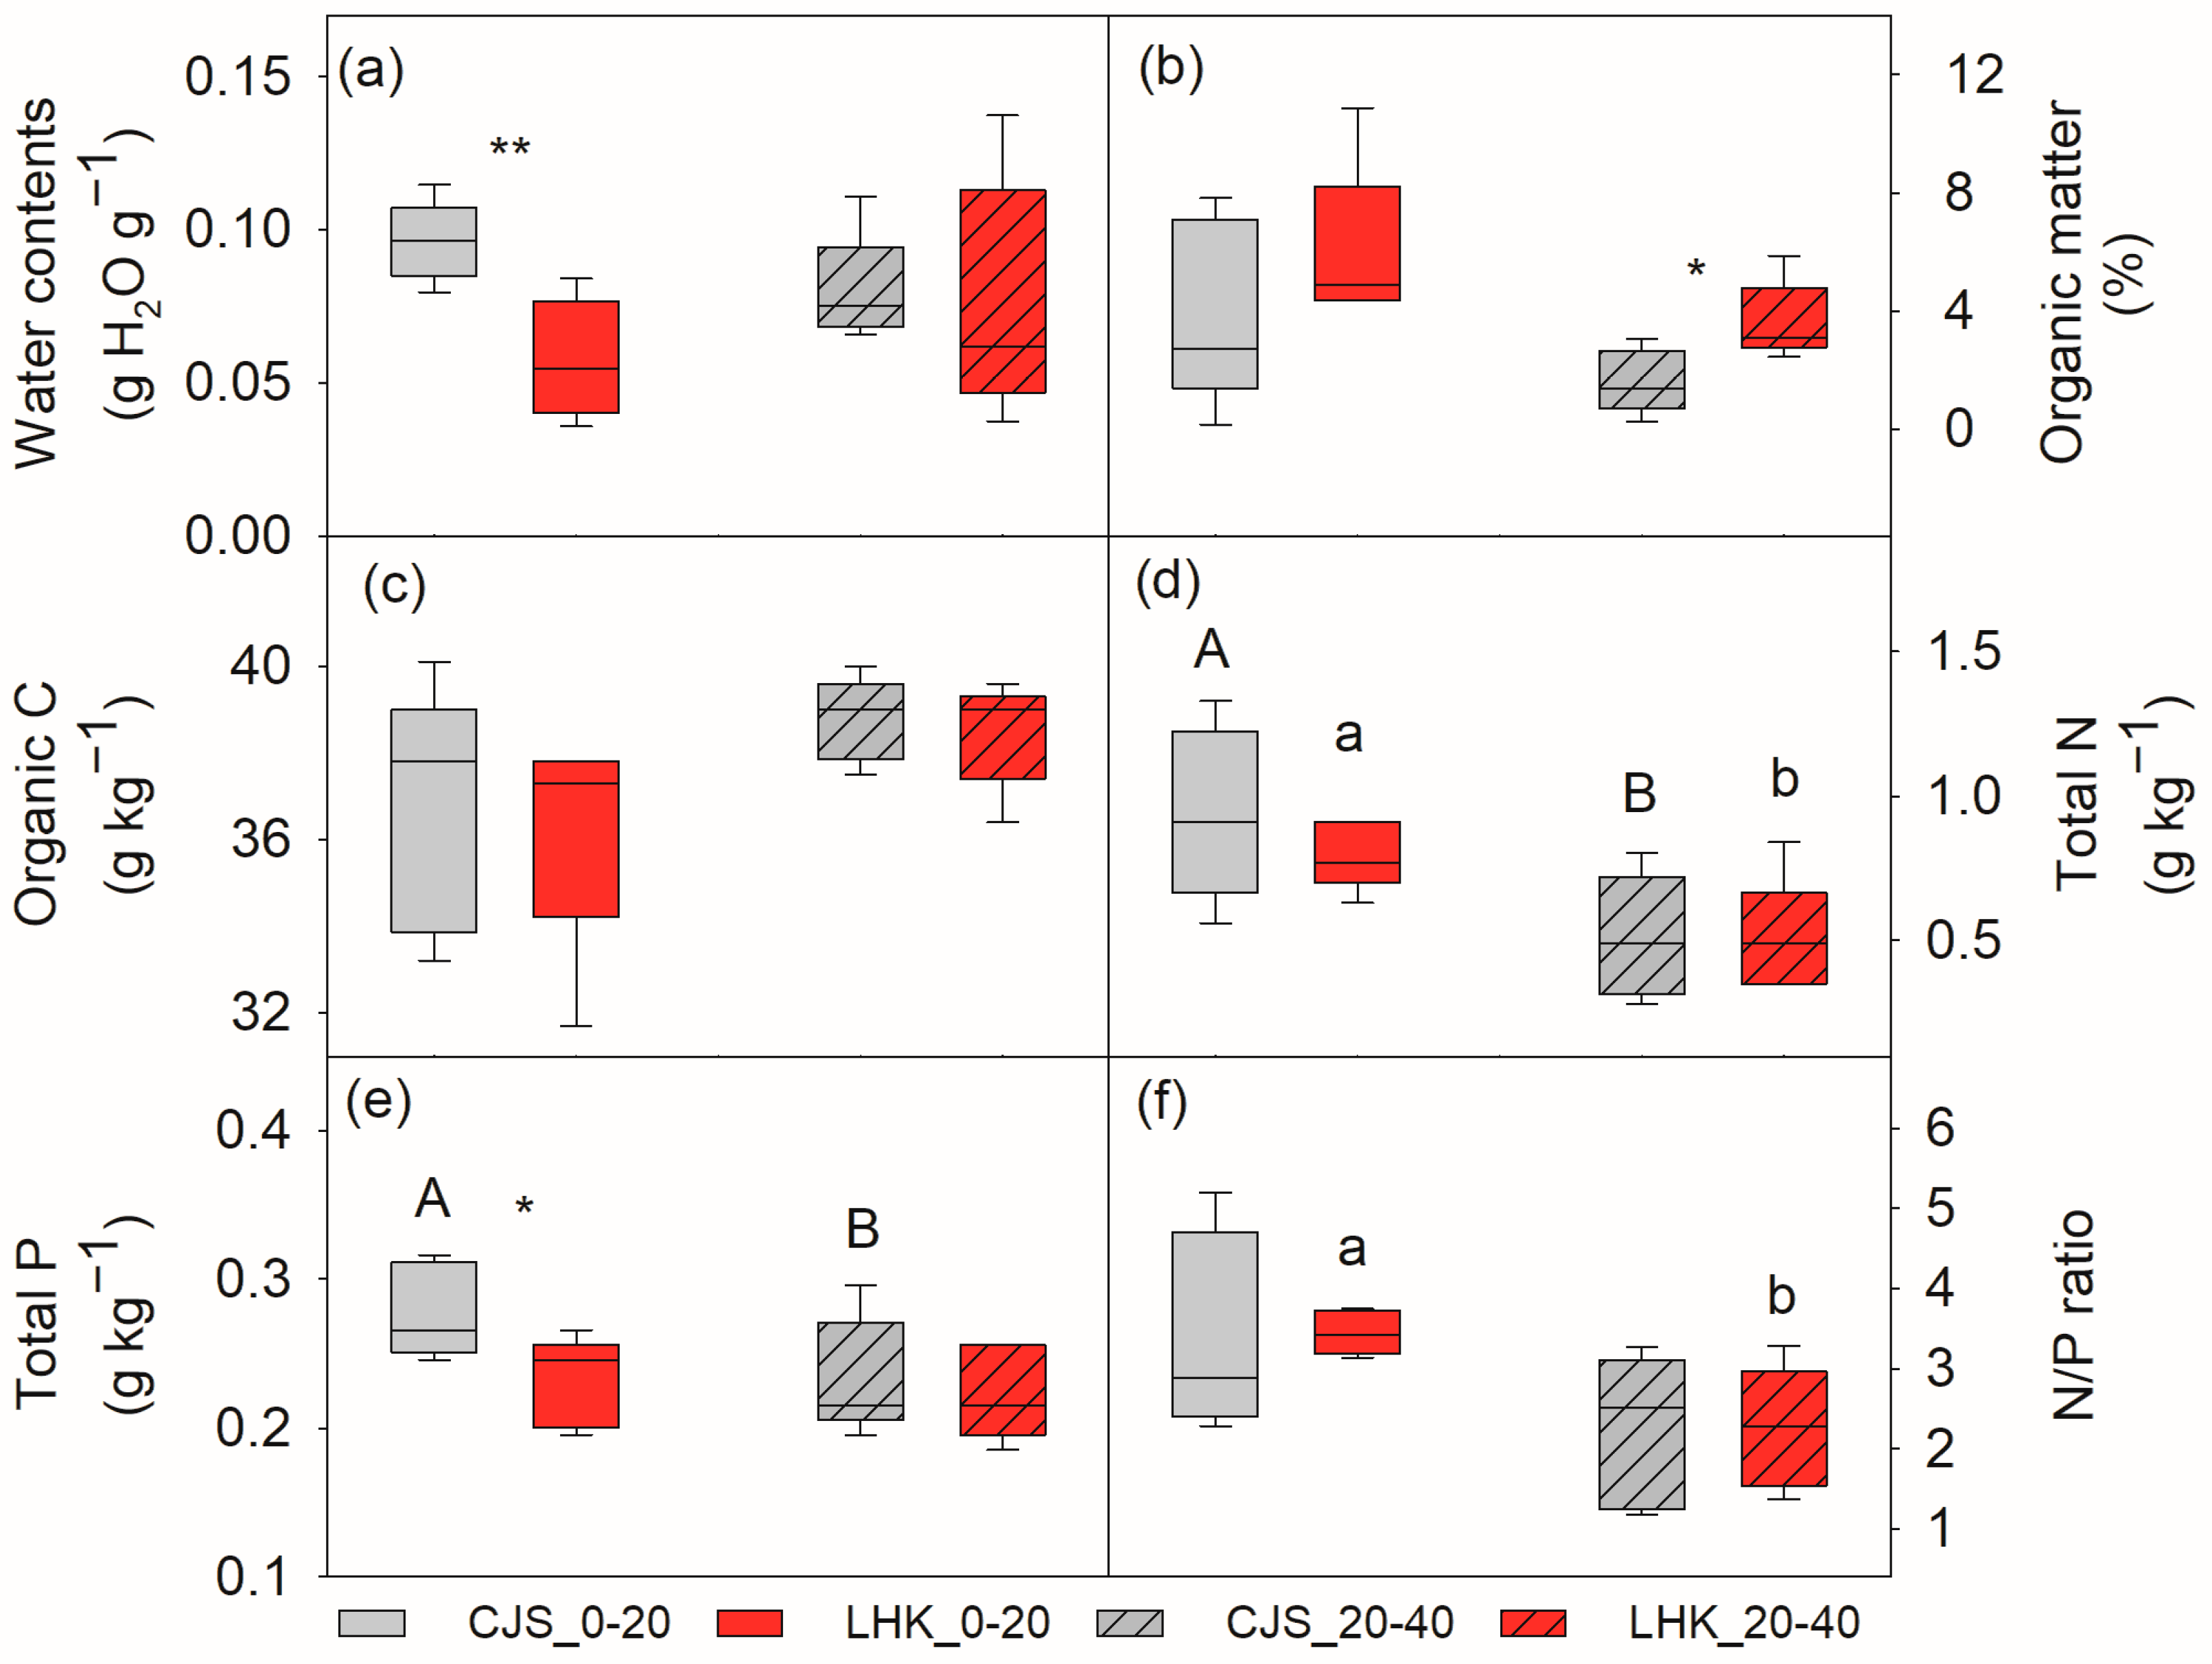
Water and total P was significantly lower in the top layer soil (0–20 cm) at LHK compared to CJS, i.e., 5.7 ± 1.0 compared to 9.6 ± 0.6 g H2O g−1 soil (p = 0.009), and 0.23 ± 0.01 compared to 0.28 ± 0.01 g kg−1 soil (p = 0.022), respectively (Figure 1a,e). Soil organic matter, organic C, and total N contents were similar at both sites (Figure 1b–d). In the deeper layer soil (20–40 cm), no significant difference in water, organic C, and total N and P contents were found between the two filed sites, except for organic matter, which was significantly higher at LHK (3.6 ± 0.5%) compared to CJS (1.6 ± 0.4%) (p = 0.014) (Figure 1b).
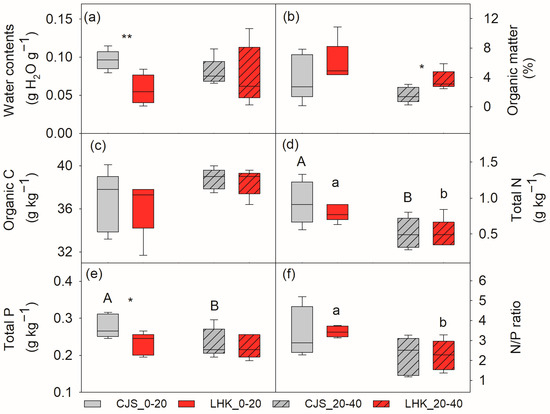
Figure 1.
Soil water content (a), organic matter (b), organic carbon (c), total nitrogen (d), total phosphorus (e), and nitrogen to phosphorus (N/P) ratio (f) at the field sites of Cuojishan (CJS) and Lianghekou (LHK). Soil parameters were determined at two depths of 0–20 cm (without hatching) and 20–40 cm (hatched bar). Asterisks indicate significant differences between the two sites within the same depth (*, p < 0.05; **, p < 0.01). Different upper-case and lower-case letters indicate significant differences between the two soil depths at CJS and LHK, respectively. Data shown means ± SE (n = 6) on a dry weight basis.
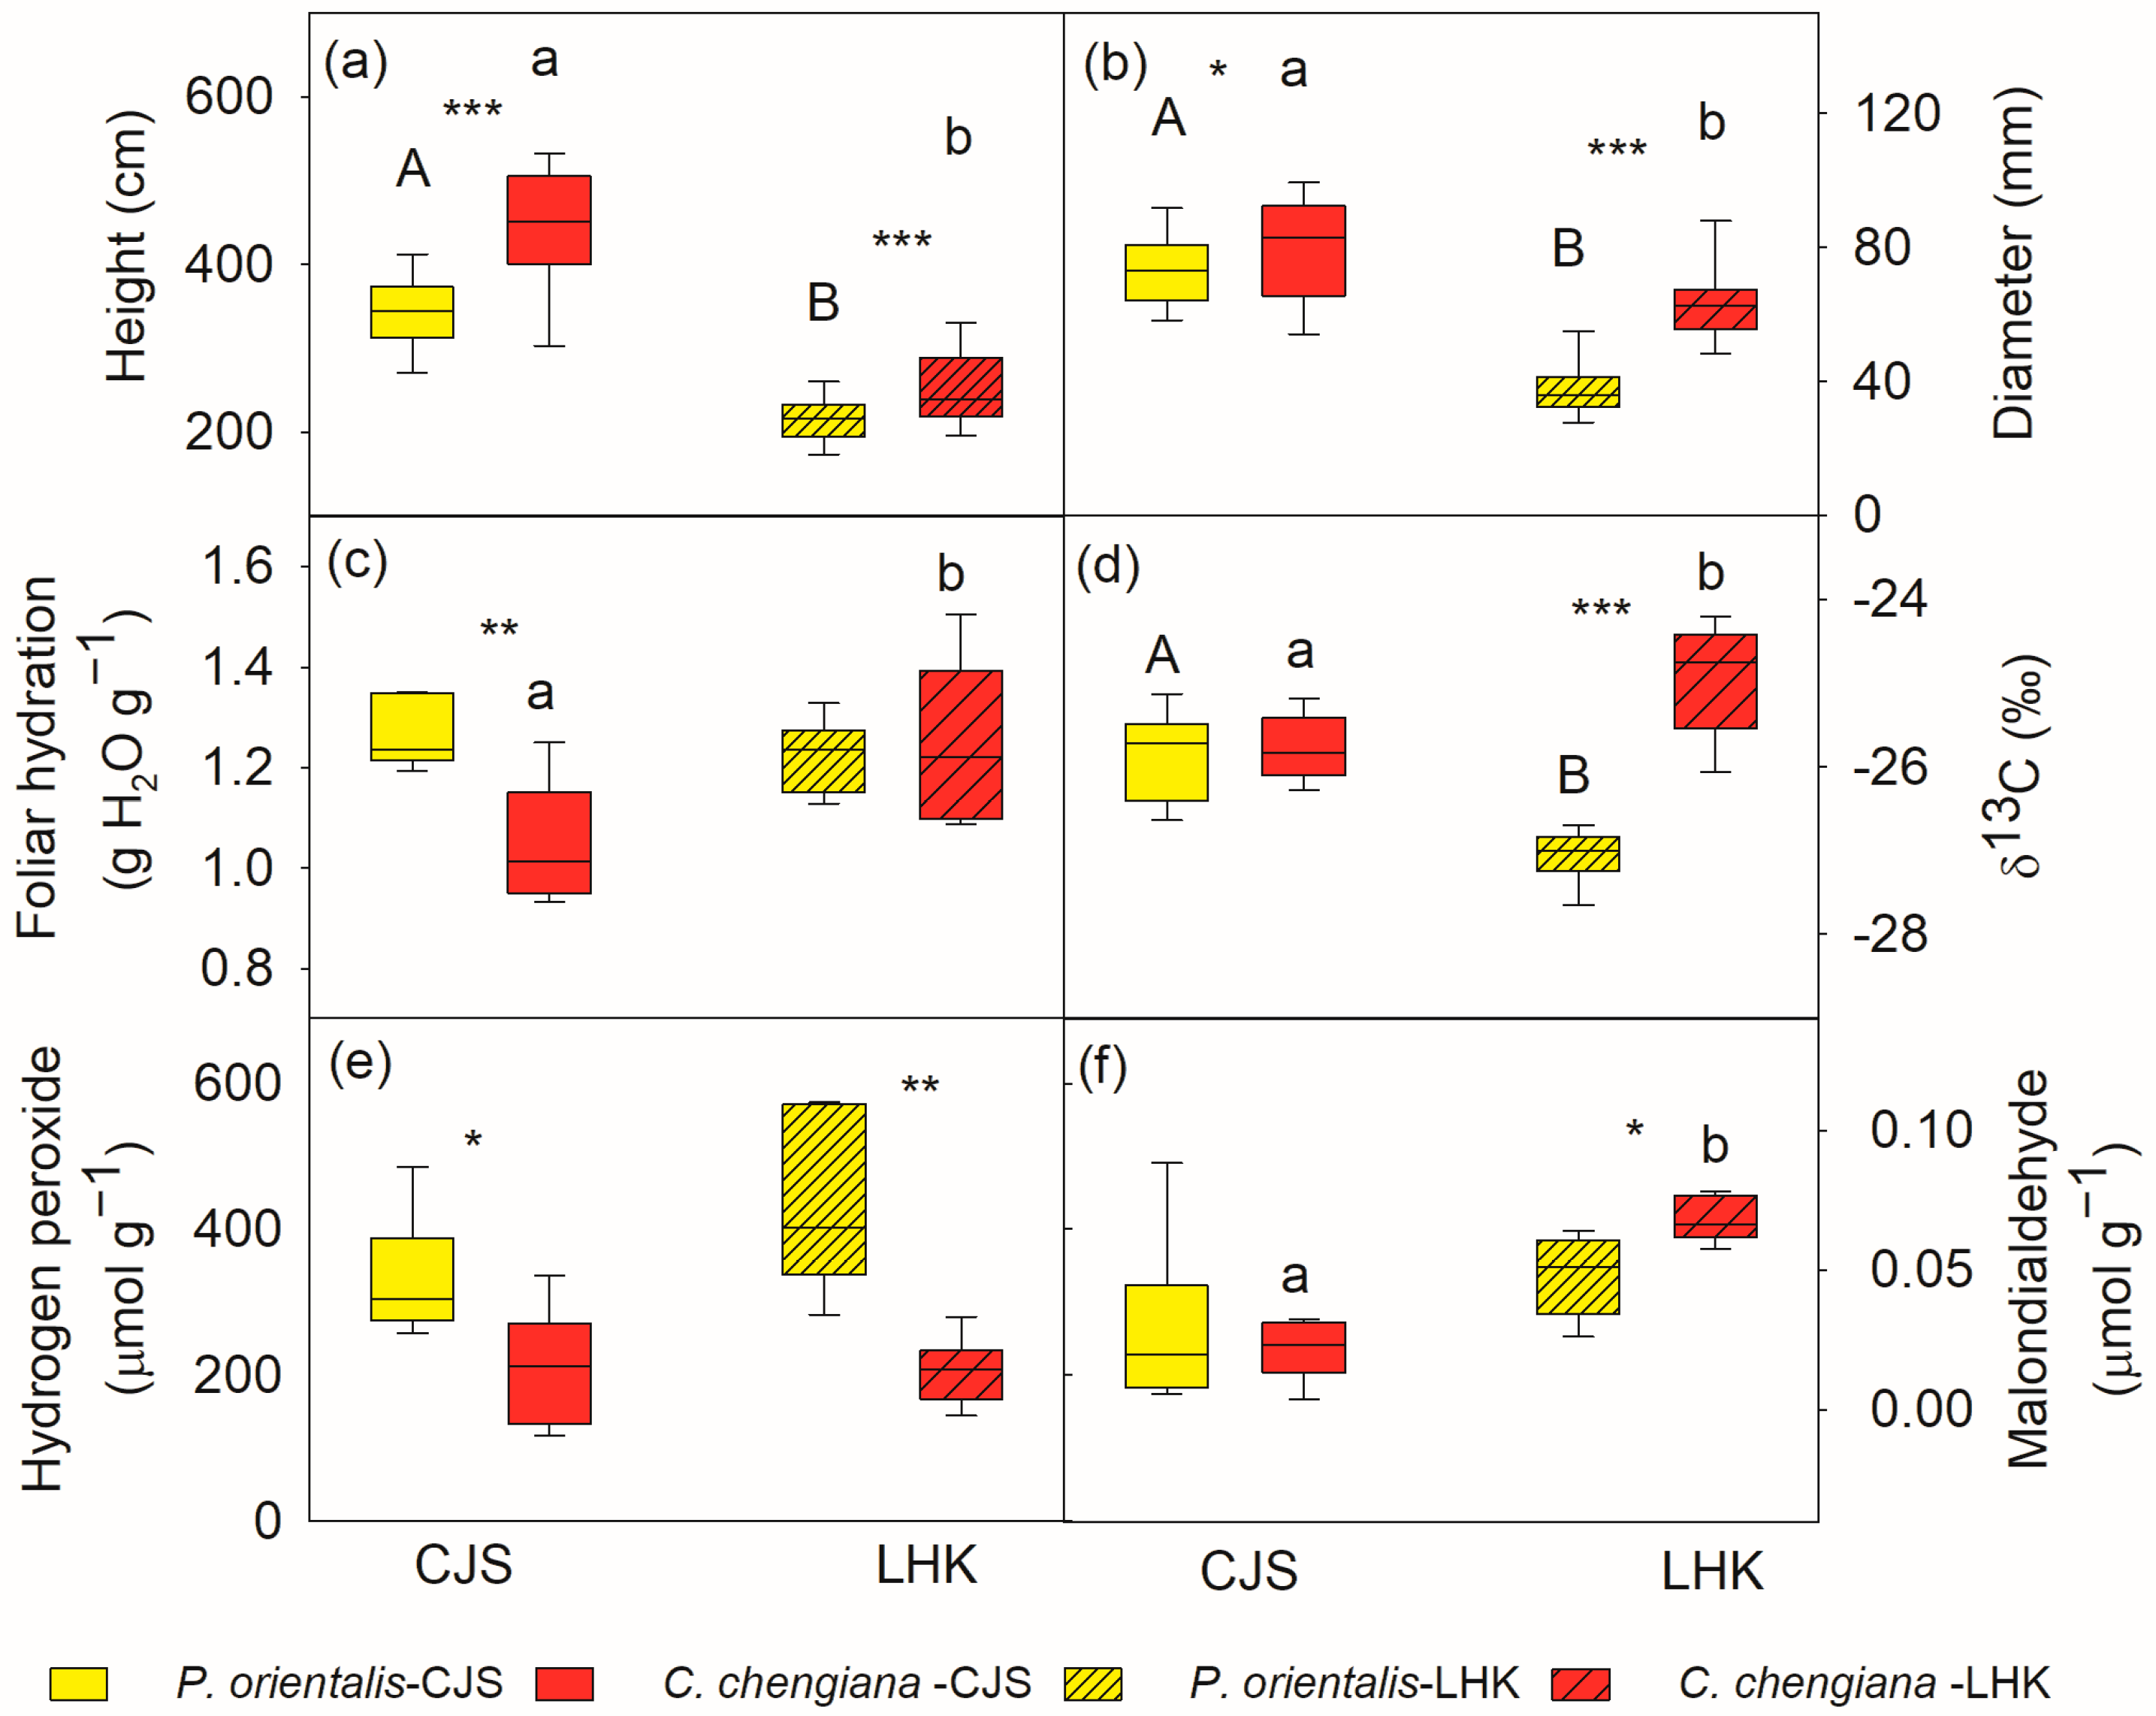
3.2. Tree Growth
The results indicated that C. chengiana trees grew faster than P. orientalis trees (Figure 2). C. chengiana trees were 30% and 20% higher (p < 0.001) than P. orientalis trees at CJS and LHK, respectively (Figure 2a). The diameter at 5 cm above ground of C. chengiana trees was also significantly higher than that of P. orientalis trees, i.e., 8% (p = 0.028) at CJS and 67% higher (p < 0.001) at LHK (Figure 2b).
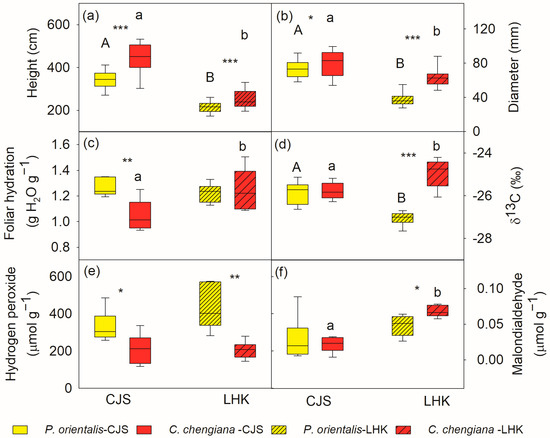
Figure 2.
Tree height (a), diameter at 5 cm above ground (b), leaf hydration (c), δ13C (d), hydrogen peroxide (e) and malondialdehyde contents (f) of Platycladus orientalis (yellow) and Cupressus chengiana (red) at Cuojishan (CJS, right panel, without hatching) and Lianghekou (LHK, left panel, hatched bars). Asterisks indicate significant differences between the two species within the same site (*, p < 0.05; **, p < 0.01; ***, p < 0.001). Different upper-case and lower-case letters indicate significant differences between the two sites within the same species, respectively. Data shown means ± SE (n = 6 for c–f, n = 31–38 for a,b) on a dry weight basis.
3.3. Species-Specific Differences at Two Sites
In addition to different growth rates, differences between the two species were also demonstrated in plant water relations, reactive oxygen species (ROS) levels, and metabolome profiles. Foliar hydration of P. orientalis trees was 21% higher (p = 0.002) than C. chengiana trees at CJS, while this was similar at LHK (Figure 2c). Foliar δ13C signatures in both species were similar at CJS, but they were significantly enriched in C. chengiana trees and depleted in P. orientalis trees at LHK (Figure 2d). Leaf H2O2 contents of P. orientalis trees were significantly higher than C. chengiana trees at both sites, i.e., 57% and 91% higher at CJS and LHK, respectively (Figure 2e). MDA contents were 20% higher in C. chengiana trees than in P. orientalis trees at LHK (Figure 2f).
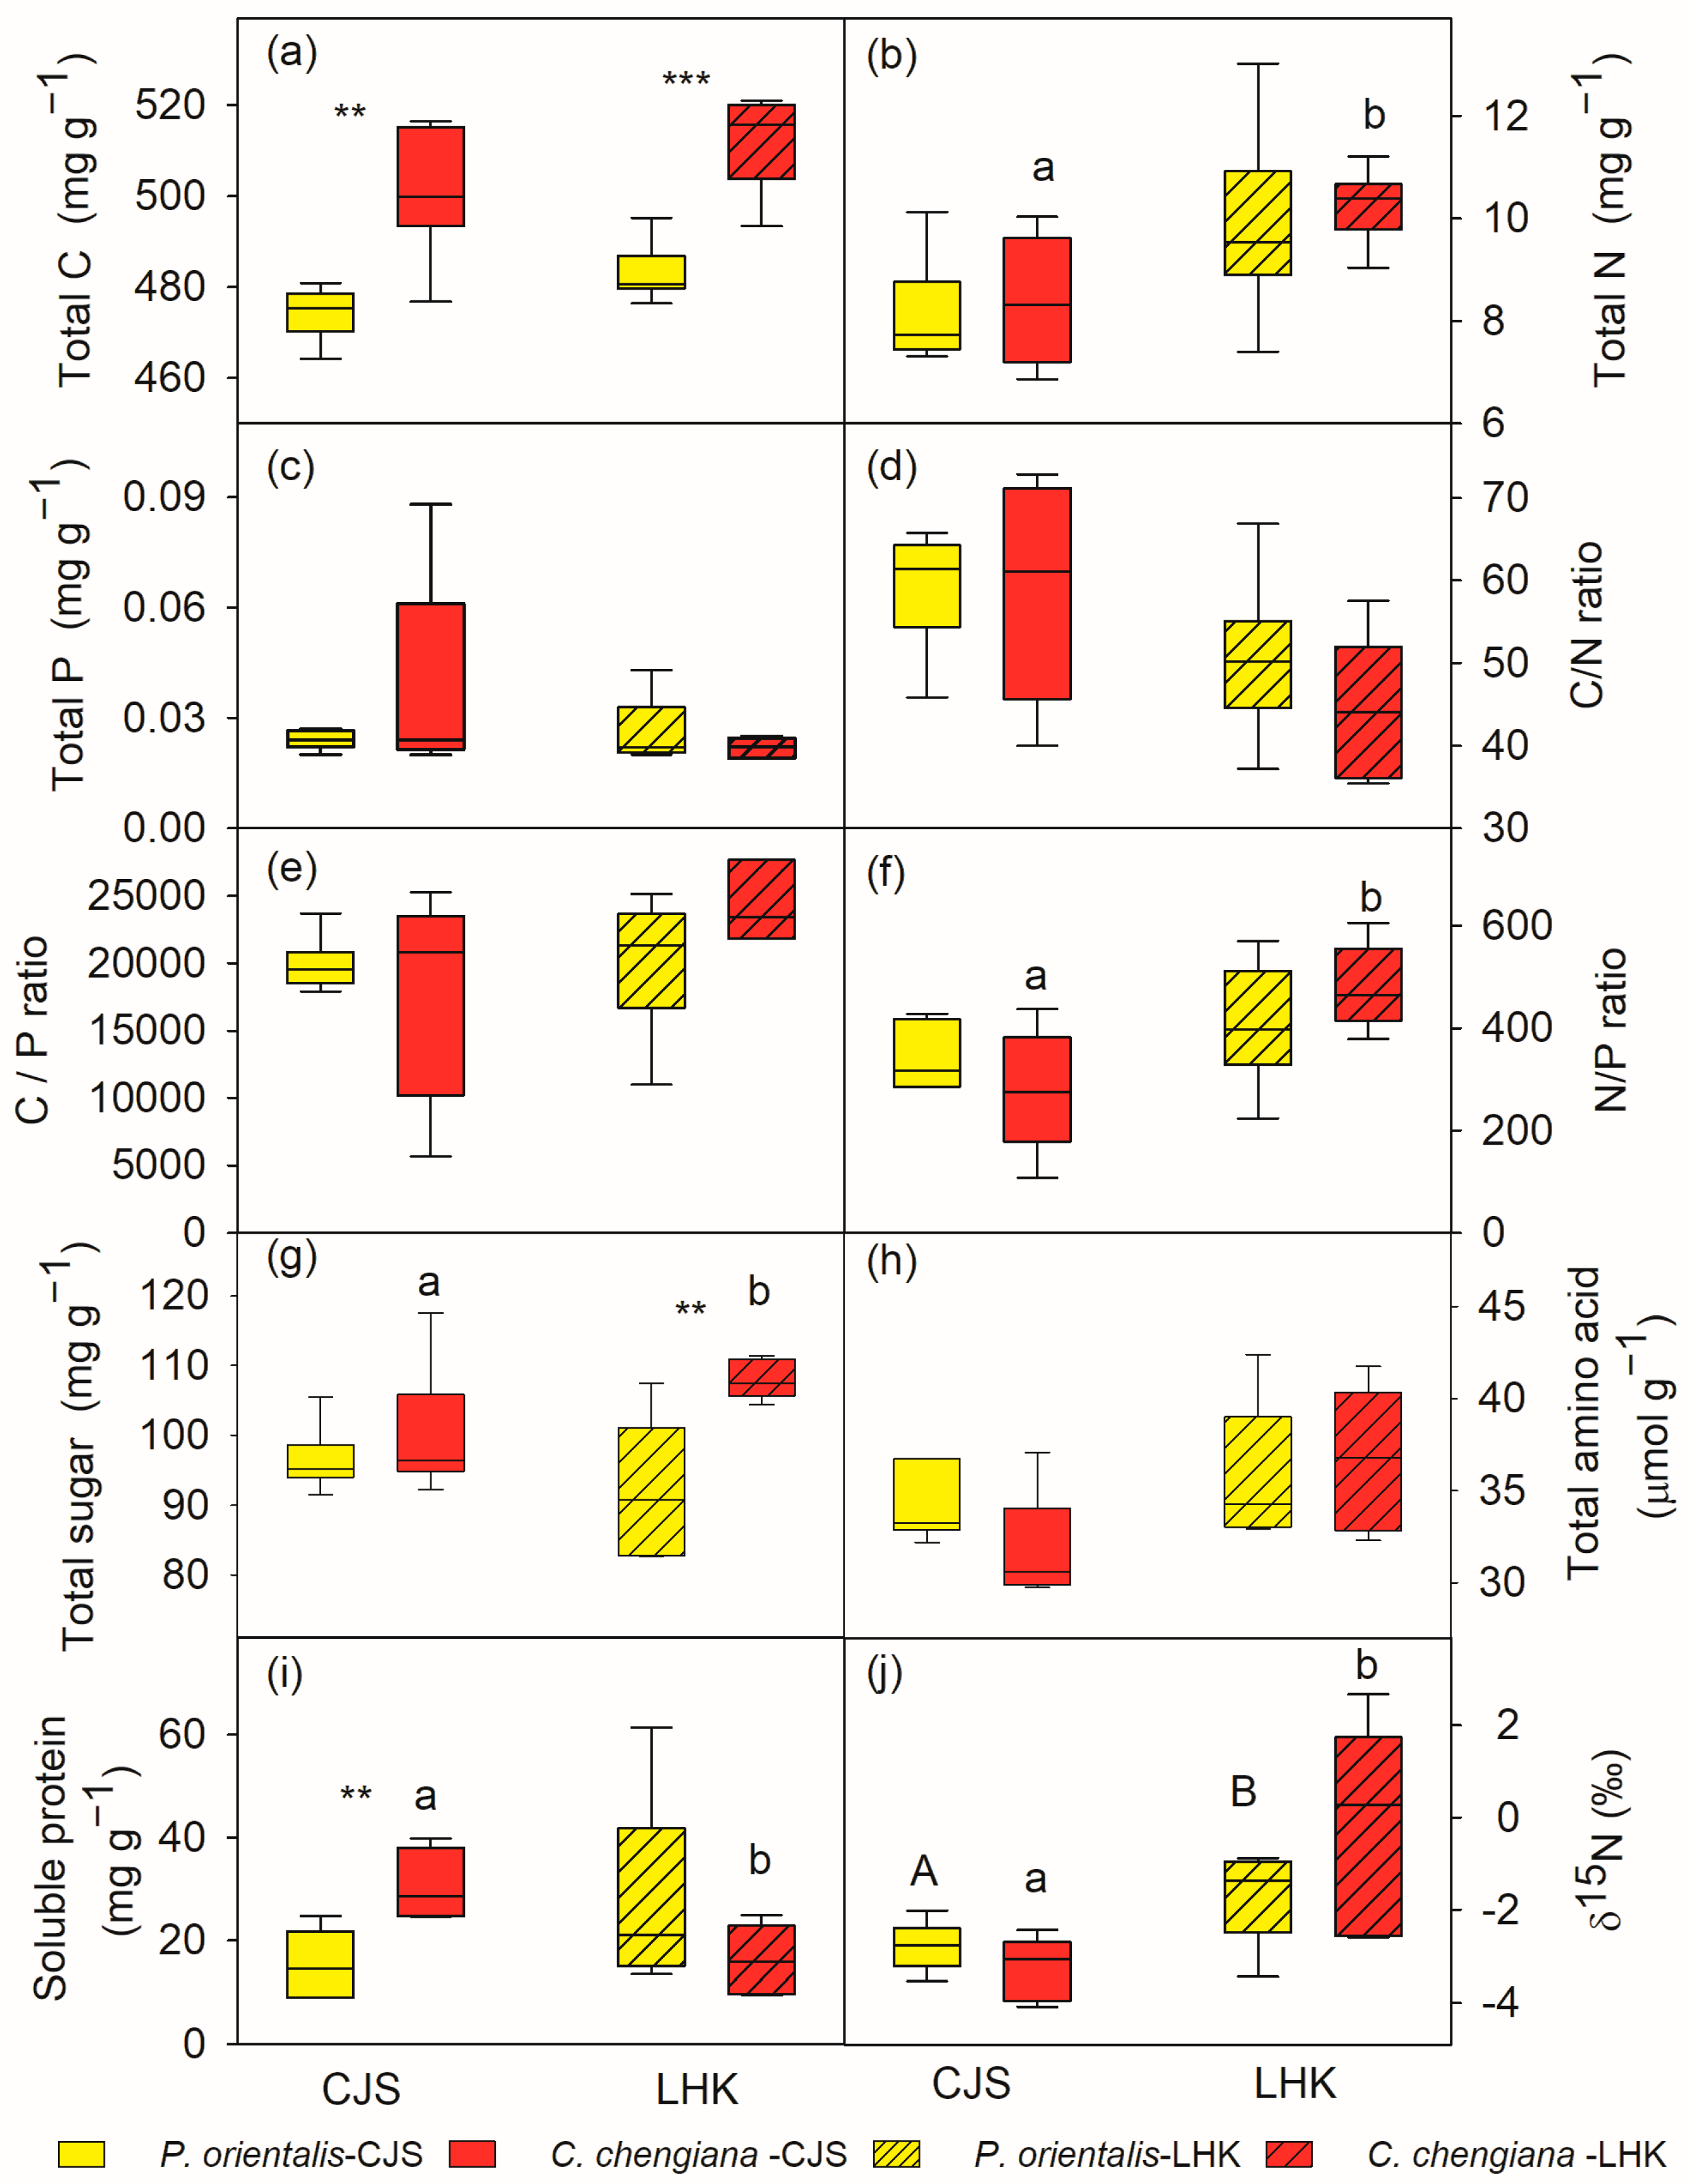
Total C contents in C. chengiana leaves were significantly (p < 0.001) lower than P. orientalis leaves at both sites (9% and 8% at CJS and LHK, respectively) (Figure 3a). No significant differences in leaf total N, P, as well as C/N, C/P, and N/P ratios, total amino acids, and δ15N values, were found between the two species at both sites (Figure 3b–f,h,j). While the foliar total sugar content of C. chengiana trees was 28% higher than that of P. orientalis trees at LHK (p = 0.002), it was similar at CJS (Figure 3g). Soluble protein content in C. chengiana leaves was 256% higher than in P. orientalis leaves at CJS (p = 0.001) (Figure 3i).
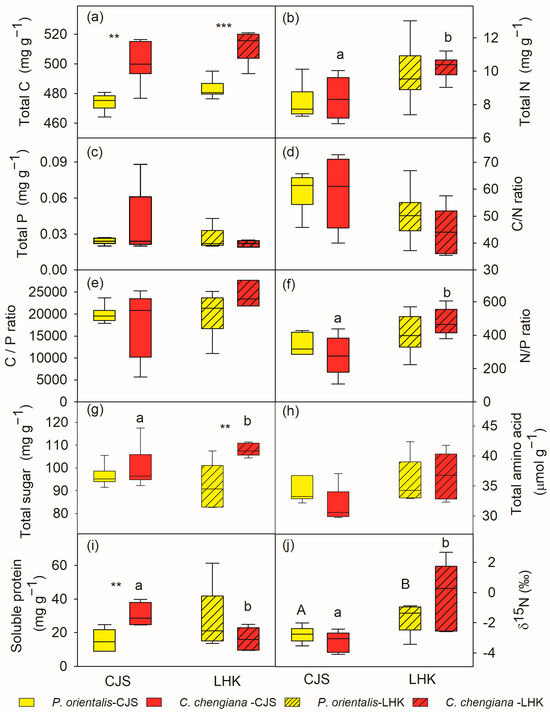
Figure 3.
Total carbon (C), nitrogen (N), phosphorus (P) contents and their ratios (a–f), soluble sugar (g), amino acid (h), soluble protein (i), and δ15N (j) in leaves of Platycladus orientalis (yellow) and Cupressus chengiana (red) at Cuojishan (CJS, right panel, without hatching) and Lianghekou (LHK, left panel, hatched bars). Asterisks indicate significant differences between the two species within the same site (**, p < 0.01; ***, p < 0.001). Different upper-case and lower-case letters indicate significant differences between the two sites within the same species, respectively. Data shown means ± SE (n = 6) on a dry weight basis.
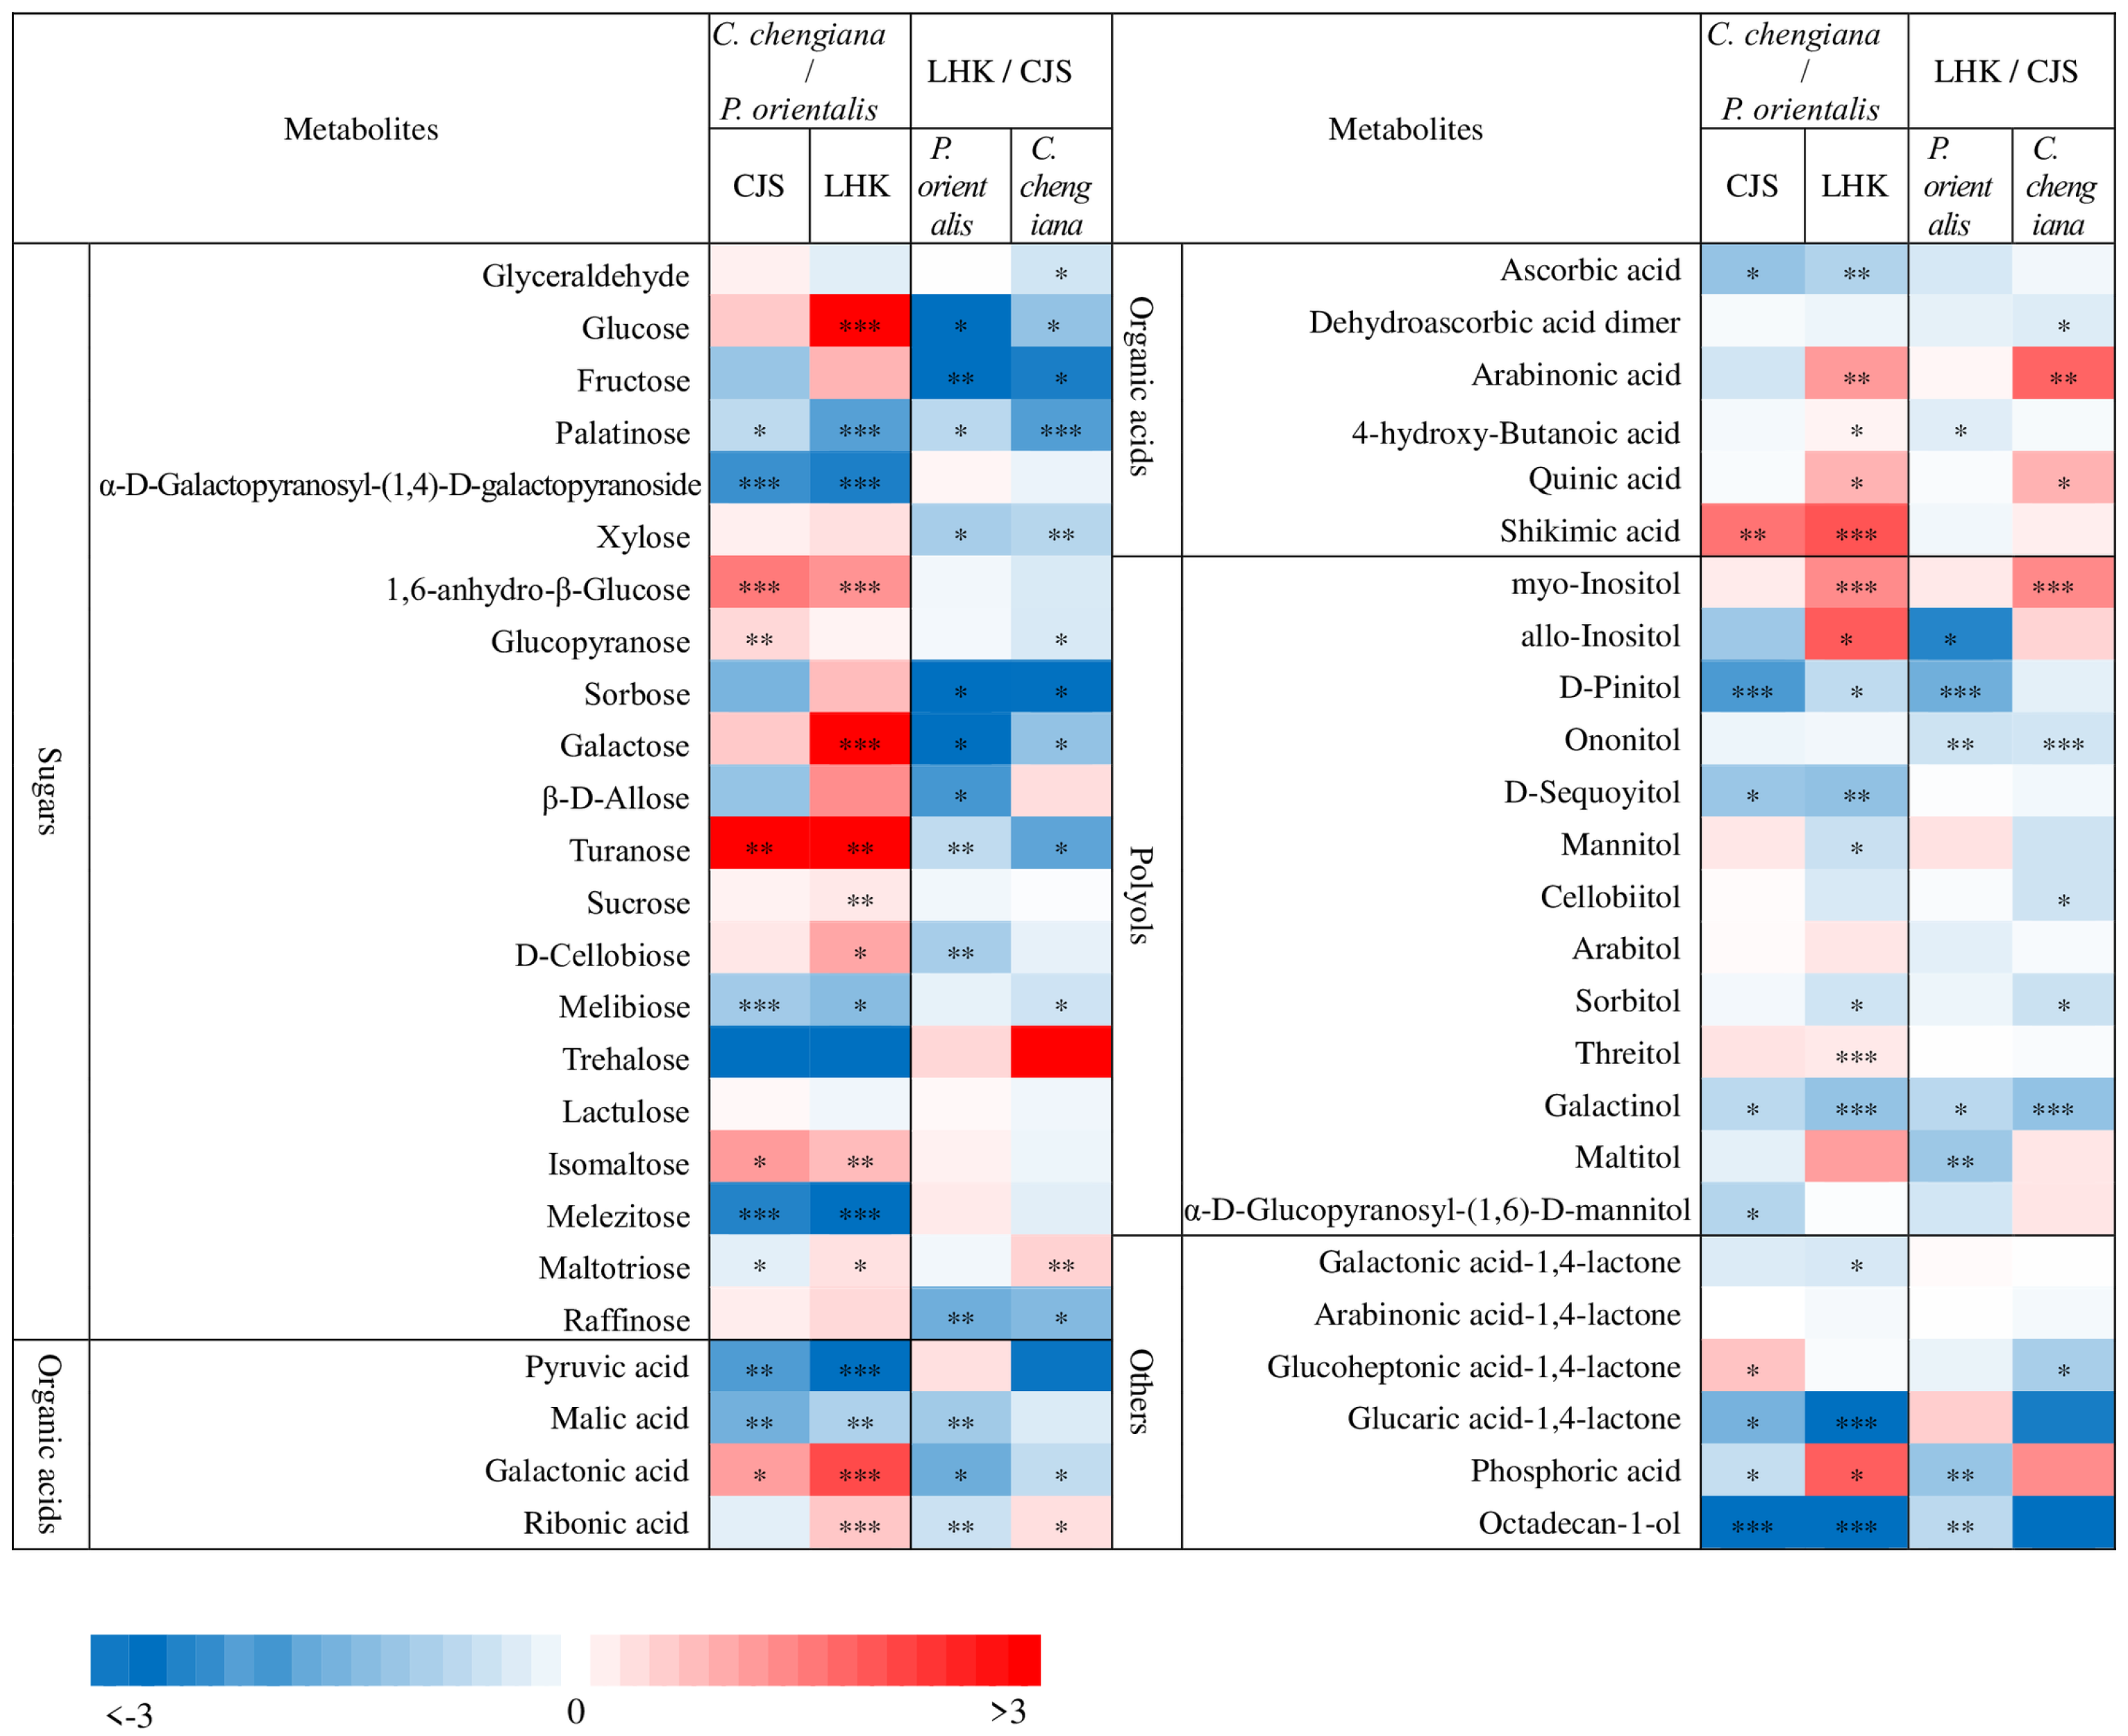
Abundances of low molecular weight compounds differed between the two species (Figure 4 and Figure 5). Compared to P. orientalis, C. chengiana had significantly lower abundances of palatinose, α-D-galactopyranosyl-(1,4)-D-galactopyranoside, melibiose, trehalose, and melezitose, but higher 1,6-anhydro-β-glucose, turanose and isomaltose abundances at both sites (Figure 4). No significant differences in glucose, galactose, sucrose, and D-cellobiose abundances were observed at CJS, but they were significantly higher in C. chengiana leaves at LHK. Pyruvic acid, malic acid, and ascorbic acid were less abundant, while galactonic acid and shikimic acid were more abundant in C. chengiana than in P. orientalis at both sites. Abundances of ribonic acid, arabinonic acid, 4-hydroxy-butanoic acid, and quinic acid were significantly higher in C. chengiana than in P. orientalis at LHK. In contrast to mannitol and sorbitol, the abundances of myo-inositol, allo-inositol, and threitol were higher in C. chengiana leaves but only at LHK. D-Pinitol, D-sequoyitol, galactinol, glucaric acid-1,4-lactone, and octadecan-1-ol were less abundant in C. chengiana than in P. orientalis at both sites. Phosphoric acid was more abundant in C. chengiana leaves at CJS but less abundant at LHK (Figure 4). Generally, amino acids and several other N compounds were less abundant in C. chengiana leaves than in P. orientalis leaves, except for proline, tryptophan, β-alanine, and DL-norvaline, which showed generally higher abundances in C. chengiana leaves (Figure 5). In contrast to trans-3-caffeoyl-quinic acid, benzaldehyde, taxifolin, and catechin, the abundance of other aromatic compounds was also lower in C. chengiana leaves at both sites (Figure 5).
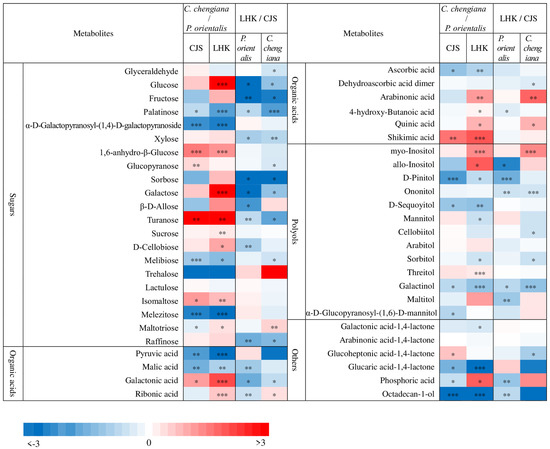
Figure 4.
Fold change (log2) of sugars, organic acids, polyols, and other compounds in leaves of Platycladus orientalis and Cupressus chengiana between Lianghekou (LHK) and Cuojishan (CJS) (left panels) and between C. chengiana and P. orientalis at CJS and LHK (right panels). Asterisks indicate significant differences between CJS and LHK within the same species and between the two species within the same site (*, p < 0.05; **, p < 0.01; ***, p < 0.001). Data shown means ± SE (n = 6) on a dry weight basis.
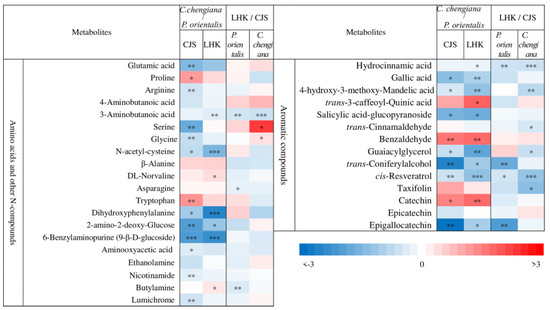
Figure 5.
Fold change (log2) of amino acids and other N-compounds and aromatic compounds in leaves of Platycladus orientalis and Cupressus chengiana between Lianghekou (LHK) and Cuojishan (CJS) (left panels) and between C. chengiana and P. orientalis at CJS and LHK (right panels). Asterisks indicate significant differences between CJS and LHK within the same species and between the two species within the same site (*, p < 0.05; **, p < 0.01; ***, p < 0.001). Data shown means ± SE (n = 6) on a dry weight basis.
3.4. Differences between the Two Sites
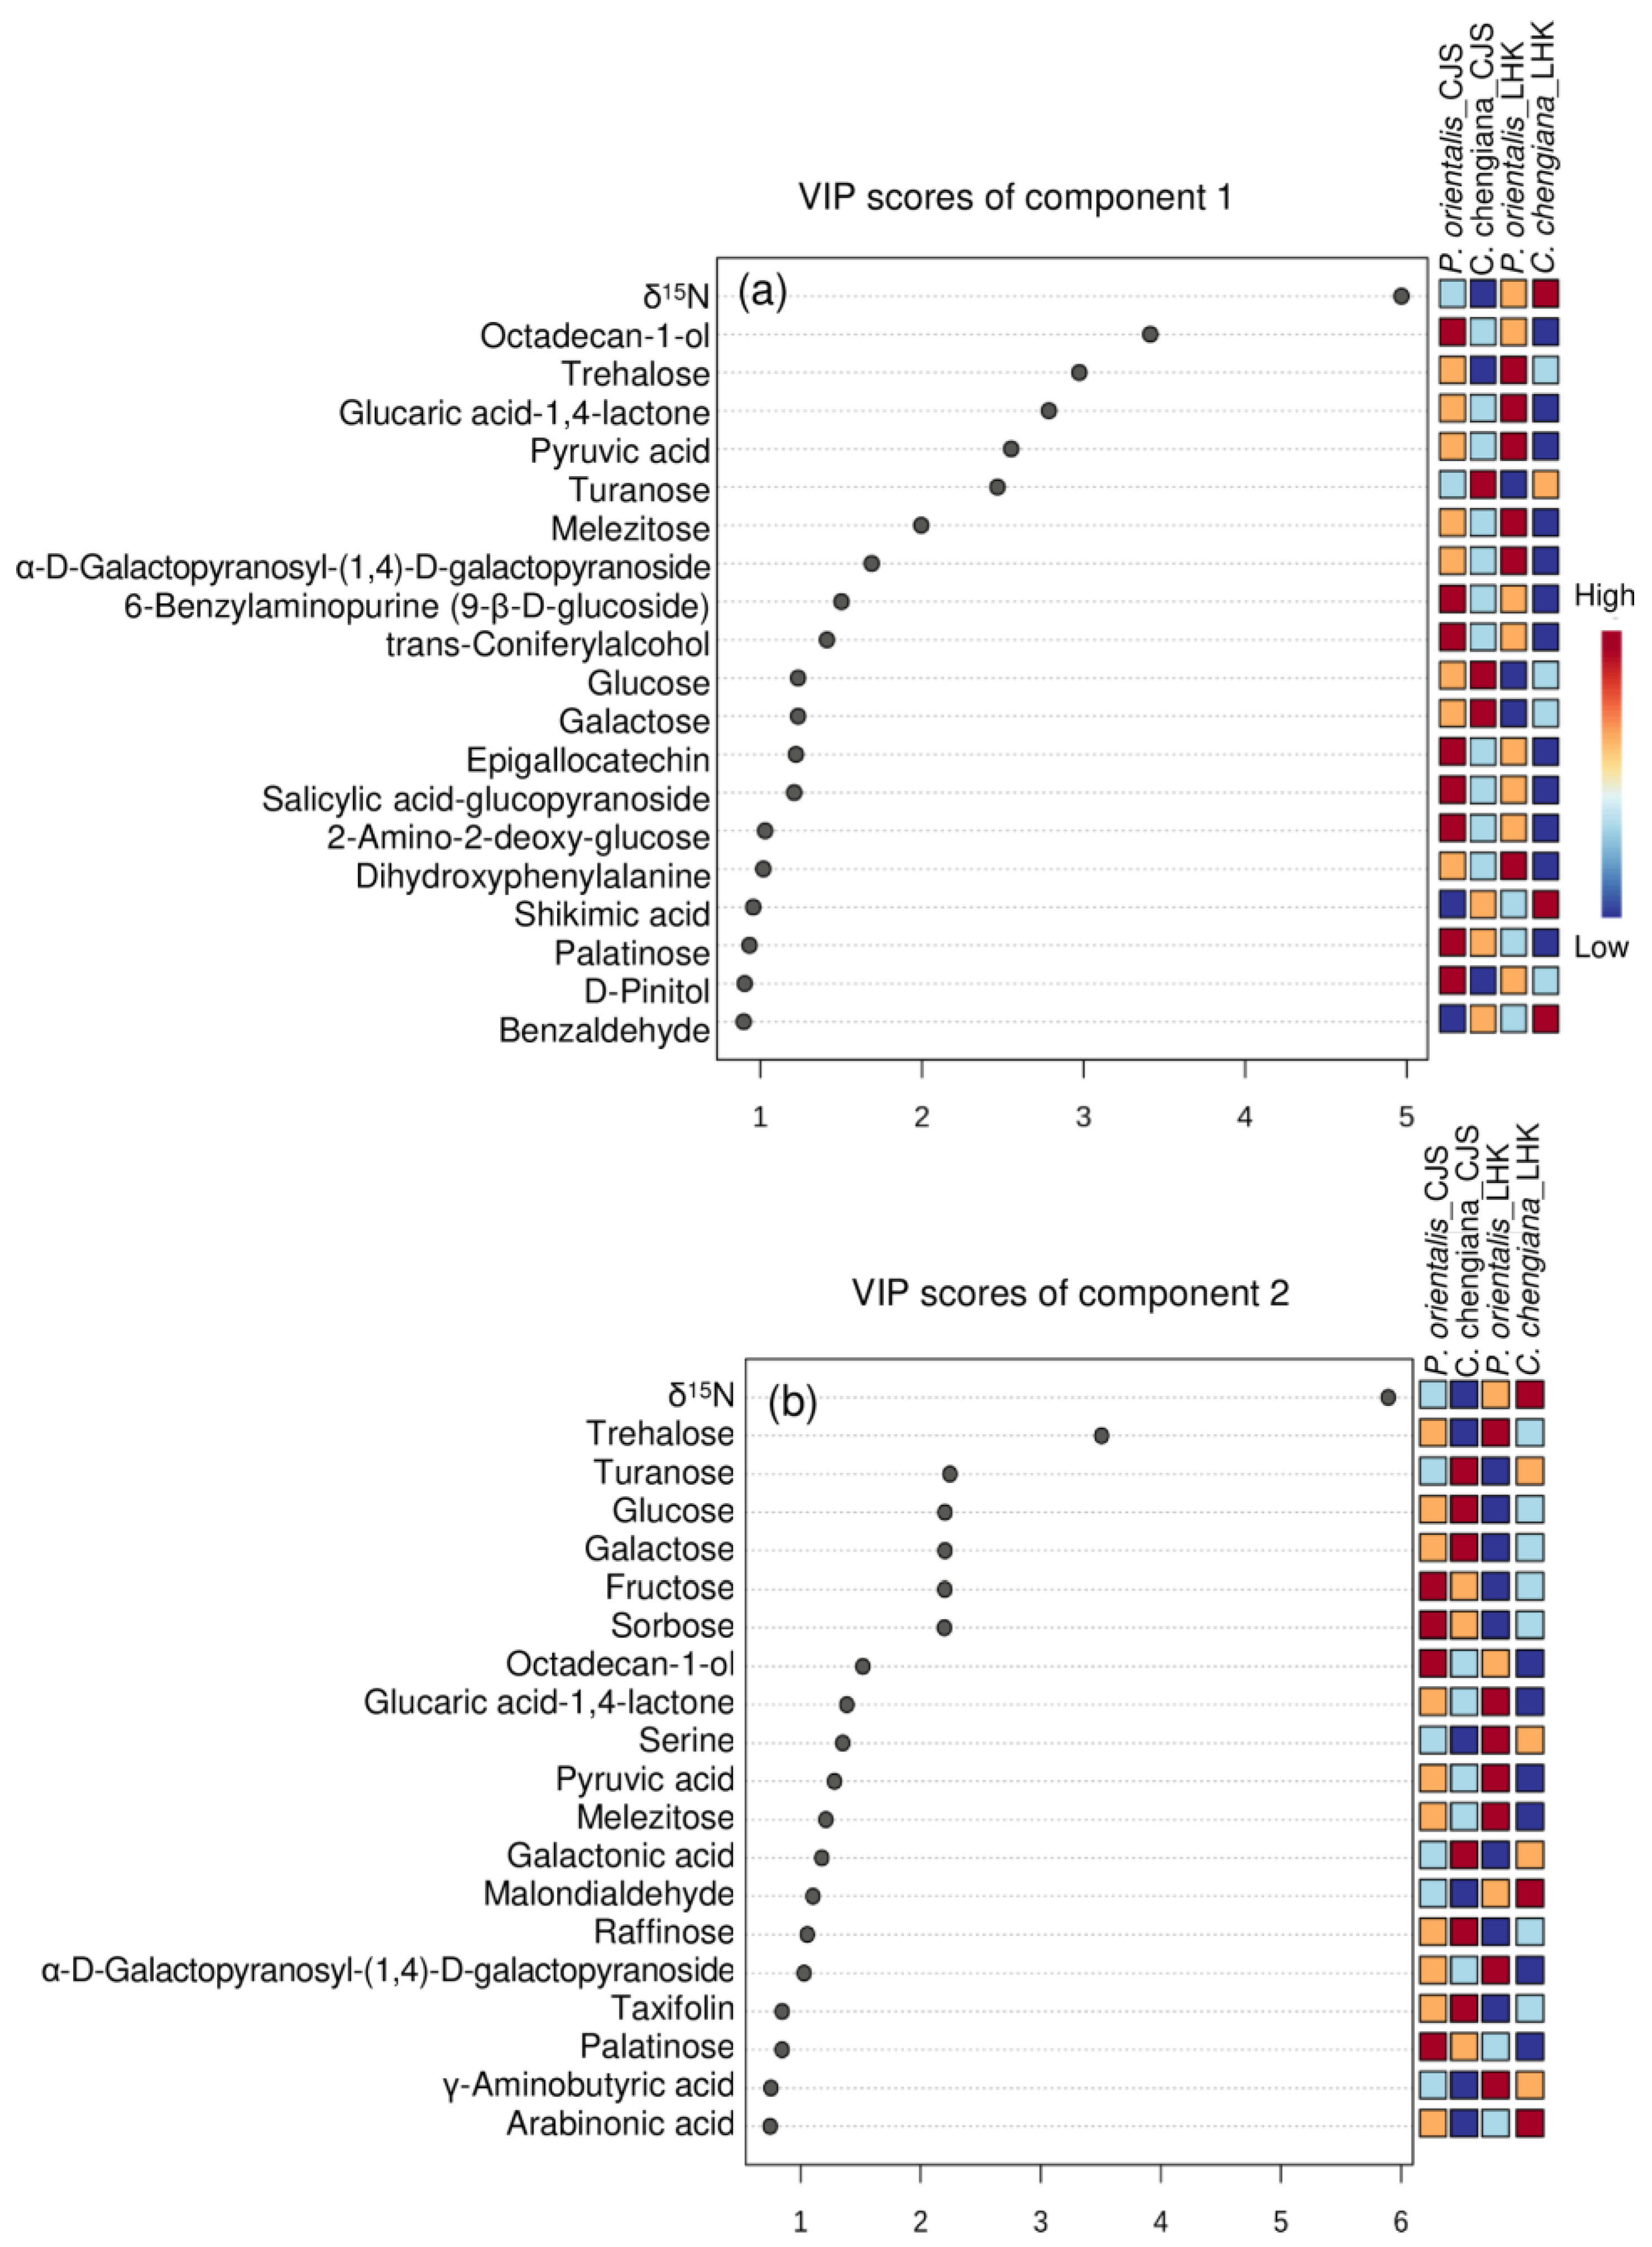
The site also had notable effects on the foliar physiological traits of both species (Figure 2, Figure 3, Figure 4 and Figure 5). In P. orientalis trees, except δ15N, concentrations of most of the other compounds were lower at LHK in comparison to trees at CJS (Figure 2, Figure 3, Figure 4 and Figure 5). In contrast, in C. chengiana trees, foliar hydration, contents of MDA, total N, total sugar, trehalose, maltotriose, serine, glycine, arabinonic acid, quinic acid, myo-inositol, as well as δ13C, δ15N signatures and N/P ratio were higher at LHK than trees at CJS. Whereas contents of soluble protein, most sugars, polyols, and aromatic compounds were less abundant in leaves of C. chengiana trees at LHK. Less site effects on amino acid abundances, except for higher serine and glycine and lower 3-aminobutanoic acid concentrations, were observed at LHK in comparison to CJS (Figure 2, Figure 3, Figure 4 and Figure 5). PLS-DA analysis based on all the biochemical parameters of the two species showed apparent species- and site-determined clusters (R2 = 0.93, Q2 = 0.63) (Figure 6). The species-specific effect was separated along component 1, while the site-specific effect was mainly separated along component 2. The two components explained 72.4% of the total variance, and nitrogen and sugars largely determined the two components (Figure 7).
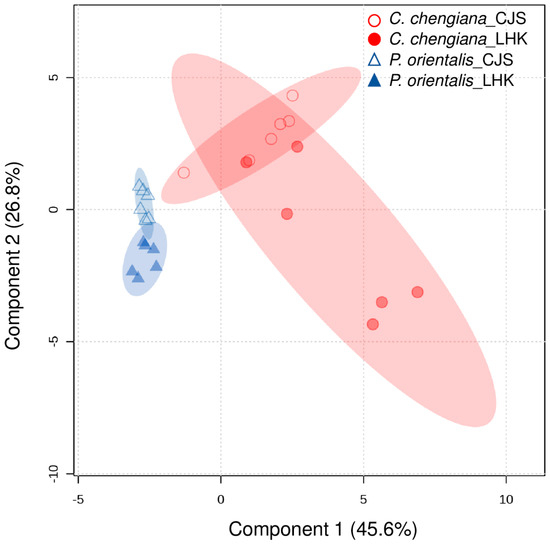
Figure 6.
Clustering of all physiological and metabolic parameters in leaves of Platycladus orientalis (triangle) and Cupressus chengiana (circle) at Cuojishan (CJS) and Lianghekou (LHK). Semi-transparent shadings indicate 95% confidence regions.
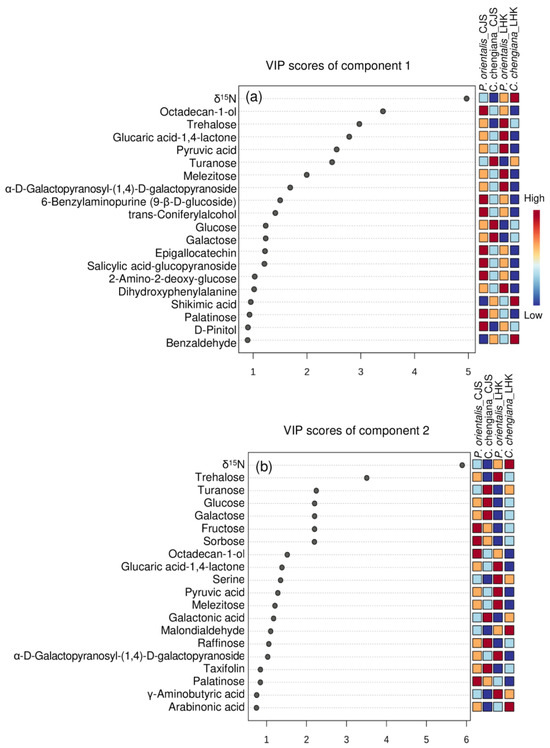
Figure 7.
Top 20 parameters of component 1 (upper panel, a) and component 2 (lower panel, b) according to the VIP scores of PLS-DA analysis.
4. Discussion
The growth potential of trees and their related physiological mechanisms are of particular importance for afforestation in drylands. In the present study, we found there were complex physiological and metabolic regulations behind the higher growth rate of C. chengiana trees in comparison to P. orientalis trees in a typical dryland in the hot and dry Minjiang Valley, China.
4.1. Different Growth Rates of the Two Species
Both C. chengiana and P. orientalis are widely used tree species for afforestation in Minjiang Valley [17,30,31]. Previous studies have shown both species were highly resistant to adverse environmental conditions, such as poor soil nutrients, limited water availability, and temperature extremes [18,32]; however, knowledge of species growth and metabolomics is scarce. In line with other studies, soil water and nutrient contents were much lower at LHK than at CJS (Figure 1), especially the top soil layer [13,14]. Our results show that C. chengiana trees grew faster than P. orientalis trees at both sites (Figure 2). In accordance with the higher growth of C. chengiana trees, total C and soluble sugar contents in C. chengiana leaves were higher than in P. orientalis trees, particularly at the hotter and dryer site of LHK (Figure 3), which may indicate a greater assimilation rate and/or lower resources consumption due to well-tuned resistance to dry and hot conditions in the hostile habitat [33,34]. This is further supported by the significantly lower H2O2 contents at both sites (Figure 2e), which may also support the higher growth rate due to less energy and assimilated input for ROS formation and scavenging [35]. However, little is known about the enzymatic and non-enzymatic ROS scavenge systems, as well as the difference between the two species [36,37,38], and therefore, they deserve further studies. It is apparent that the protection from increased antioxidants of polyols (i.e., myo- and allo-inositol, threitol), amino acids (i.e., proline and tryptophan), and aromatics (e.g., catechin and benzaldehyde) cannot be excluded [39,40,41,42,43]. The ascorbic acid concentration was lower in C. chengiana leaves at both sites, probably at least partly due to limited biosynthesis from the D-mannose/L-galactose pathway as seen from the lower abundance of its precursor of galactonic acid-1,4-lactone (Figure 4) [44]. Although we did not determine the contents of the antioxidant glutathione [45], a lower glutathione content in C. chengiana tree leaves was also proposed from the low abundance of its precursor N-acetyl-cysteine (Figure 5). Compared to P. orientalis trees, lower foliar hydration observed in older C. chengiana trees at CJS was not found in younger trees at the drier and hotter site where the δ13C signature was less negative (p < 0.001) (Figure 2c,d). Similarly, less negative foliar δ13C signatures were also documented in other evergreen species under drought conditions, for instance, Douglas fir (Pseudotsuga menziesii) [46] and silver fir (Abies alba Mill.) [47]. It seems that C. chengiana trees tended to increase stomatal closure to prevent water loss [48] as observed by other studies [36,38], which was not observed in P. orientalis trees as indicated by the more negative foliar δ13C values at LHK compared to CJS.
4.2. Climate Conditions Mediated Species-Specific Differences of Metabolome
Foliar metabolome profiles depend highly on species and are strongly affected by various biotic and abiotic conditions [49,50]. The apparent site-related species-specific ROS homeostasis [37], as well as C and N fractions, are reflected in individual metabolites, e.g., soluble sugars, organic acids, amino acids, and other N compounds (Figure 4, Figure 5 and Figure 7). Soluble sugars, especially glucose, fructose, and sucrose, act as nutrients and signaling molecules. They play an apparent central role in plant structure and metabolism and are involved in the responses to various stresses [51]. In the present study, apart from δ15N, sugars contributed significantly to the clustering of the two species, as shown in the VIP scores plot of the top 20 parameters (Figure 7). In general, C. chengiana trees had higher soluble sugar contents, particularly at the drier and hotter site of LHK (p < 0.01). The strong increase in soluble sugar was mainly attributed to higher abundances of glucose, galactose, sucrose, D-cellobiose, fructose, isomaltose, and raffinose (Figure 4). Together with the declined abundances of intermediates sorbitol and melibiose, the metabolisms of site-mediated species-specific starch, sucrose, and galactose were projected. In addition, C. chengiana trees accumulated 1,6-anhydro-beta-glucose and turanose, whereas P. orientalis trees had higher foliar levels of trehalose as well as palatinose, melibiose, and melezitose irrespective of age and environmental conditions (Figure 4). The disaccharide trehalose mediates several biochemical, physiological, and molecular processes in plants and is involved in plant tolerance against different stresses, including drought and heat [52]. C. chengiana trees may actively control trehalose at a low level to prevent the inhibitory effects of high trehalose on growth, as observed in other plant species [53].
The two most abundant essential elements in plants are C and N, and their metabolisms are tightly coupled through the tricarboxylic acid (TCA) cycle and are closely involved in biotic and abiotic stress responses and cellular redox homeostasis [54]. The TCA cycle intermediates provide essential precursors for respiration and N metabolism, and their accumulation is extremely variable between species [55]. In the present study, we found pyruvic acid and malic acid were significantly lower in C. chengiana leaves than in P. orientalis leaves at both sites. In line with the declined abundances of organic acids involved in the TCA cycle, abundances of most amino acids and other N-compounds also tended to decrease except DL-norvaline and butylamine at LHK and proline and tryptophan at CJS, indicating species-specific N metabolism. In general, abundances of the glutamate family amino acids, i.e., glutamic acid, arginine, 4-aminobutanic acid (GABA), and its isomer of 3-aminobutanic acid [56] were lower in C. chengiana leaves than in P. orientalis leaves. Similar patterns were also observed in the amino acids involved in photorespiration, i.e., glycine, serine, and the precursor N-acetyl-cysteine to cysteine, indicating higher photorespiration in P. orientalis leaves [57]. It is worth pointing out that since we took the samples in autumn, the differences in C and N metabolites between the two species may also be attributed to translocation from leaves to other parts of the trees [58,59], which was not considered in the present study.
Secondary metabolites, as natural byproducts of primary metabolic processes, play a significant role in plant defense and, therefore, normally accumulate under stressed conditions. And its production and accumulation vary from species to species and are mediated by environmental conditions [60]. In the present study, higher foliar abundances of quinic acid, trans-3-coffeoyl-quinic acid, shikimic acid, as well as the aromatic amino acid tryptophan, the precursors of a variety of secondary metabolites observed in C. chengiana trees were not translated into higher abundances of most identified aromatic compounds. This may contribute to the higher input of C from these secondary metabolites synthesis into metabolites supporting the growth and biomass production of C. chengiana trees (Figure 2 and Figure 3) [61]. For example, biomass growth was negatively correlated with lignin content in both angiosperms and gymnosperms tree species, and sucrose may be a key regulator of growth and lignin production, especially the competition for C allocation between lignin and cellulosics [62]. Moreover, we also found benzaldehyde was significantly higher in C. chengiana leaves than in P. orientalis leaves. Studies have shown that this simplest aromatic aldehyde plays important roles in chemical communications as well as biotic and abiotic stress defense [41,63]. Further studies aiming to reveal the complex secondary metabolism of the two species are required.
Plants are subjected to a variety of environmental stresses, including elevated temperatures and limited water availability, which is particularly prominent in hot and dry valleys [7]. In the present study, both tree species reacted similarly in response to the hotter and drier conditions, i.e., declined abundances of most soluble sugars, organic acids, polyols, and aromatic compounds at LHK in comparison to CJS. Generally, stronger effects of hotter and drier conditions on C. chengiana trees were expected, as seen from the large differences between the two field sites. For example, higher concentrations of the osmoprotectant trehalose [52,53], maltotriose—indicating starch breakdown [64], serine and glycine—involved in photorespiration [57], myo-inositol—crucial for development and signaling in plants [65,66]—observed at LHK might collectively contribute to better coping with the hassle conditions [7,67] in addition to stomatal control. We also found that leaf δ15N values of the two species were both higher at LHK than CJS (Figure 3j), which reflected the difference of δ15N in soil N source [68]. Stimulated losses of N through ammonia, nitrate leaching, or denitrification at the LHK site are speculated [69]. A negative correlation between foliar δ15N and mean annual precipitation was also found across a wide range of ecosystems [70]. This may be attributed to the adaptation of preference N sources of the trees, i.e., the trees took up more δ15N enriched ammonium than δ15N depleted nitrate at the drier site LHK, and higher fungal discrimination at the CJS site [13,14,69]. It appears that the trees at the drier and hotter site LHK have been efficient in their nitrogen uptake from soil despite the low soil N concentration [14]. This observation was in line with the slightly higher total N and total amino acids contents (Figure 3), which indicates that the trees at LHK gained more nitrogen either for maintaining an efficient photosynthetic capacity within the leaves and/or for coping with the stressful conditions [71,72,73]. One possible mechanism for the observed higher nitrogen uptake is the warmer climate-enhanced activity of ectomycorrhizal fungi, which can obtain nitrogen from organic sources and deliver it to the host plant [74,75,76]. Yang et al. [77] showed that aboveground plant biomass could be a key factor driving the changes in soil organic C, total N, and arbuscular mycorrhizal fungal abundance in arid areas in China. Therefore, the present results also highlight the requirement of N input management practice in a long-term view of afforestation in similar arid areas [78]. We have to be aware that the differences within each species between the two field sites can also be due to both climate conditions and age effects since the trees at LHK are younger and smaller than those at CJS [79,80,81].
5. Conclusions
In summary, the results from this study suggest that C. chengiana grows faster than growth P. orientalis irrespective of site conditions at the Minjiang hot and dry valley in Southwest China. Trees of C. chengiana tended to close stomata under dry and hot conditions to prevent water loss. Differences between the two species were also observed in ROS levels, carbon and nitrogen fractions, and secondary metabolites, and they were mediated by climate conditions at the two sites. Our results, for the first time, compare the performance and metabolic profiles of two important afforestation cypress species, highlighting the species-specific metabolic regulations in response to stressful conditions. Considering that both trees are long-lived species, the growth advantage of C. chengiana over P. orientalis is likely to increase further with age. However, more research should be done, for example, on suitable areas and local adaptations before large-scale afforestation with C. chengiana.
Author Contributions
Conceptualization, B.D. and Z.L.; investigation and data curation, L.Z., Z.L. and B.D.; original draft preparation, Z.L., L.L. and B.D.; review and editing, B.D., J.K. and C.W.; funding acquisition, Z.L. and L.Z. All authors have read and agreed to the published version of the manuscript.
Funding
This work was supported by Mianyang Normal University, Grant/Award Numbers: QD2021A03; Science and Technology Department of Sichuan Province, China, Grant/Award Number: 22NSFSC0148 and 2024NSFSC0401.
Institutional Review Board Statement
Not applicable.
Informed Consent Statement
Not applicable.
Data Availability Statement
The data presented in this study are available on request from the corresponding author.
Acknowledgments
The authors thank Guanyu Liao, Huixian Huang, Mingli Shen, Xiaoju Feng, Fei Du, Shengqing Tang, Yuye Hu, Hui Ma, and Ruiyan Liu for their help during sampling, sample preparation and measurement.
Conflicts of Interest
The authors declare no conflict of interest.
References
- Schimel, D.S. Drylands in the Earth System. Science 2010, 327, 418–419. [Google Scholar] [CrossRef]
- Prăvălie, R. Drylands Extent and Environmental Issues. A Global Approach. Earth-Sci. Rev. 2016, 161, 259–278. [Google Scholar] [CrossRef]
- Chen, Y.; Li, Y.; Li, Z.; Liu, Y.; Huang, W.; Liu, X.; Feng, M. Analysis of the Impact of Global Climate Change on Dryland Areas. Adv. Earth Sci. 2022, 37, 111. [Google Scholar] [CrossRef]
- Liu, H.; Xu, C.; Allen, C.D.; Hartmann, H.; Wei, X.; Yakir, D.; Wu, X.; Yu, P. Nature-Based Framework for Sustainable Afforestation in Global Drylands under Changing Climate. Glob. Change Biol. 2022, 28, 2202–2220. [Google Scholar] [CrossRef] [PubMed]
- Ye, M.; Guan, W.; Wu, B.; Ma, K.; Liu, G.; Wang, X.; Chen, Q. Plant Community Complexity in the Arid Valley of Minjiang River, Southwestern China. Acta Ecol. Sin. 2006, 26, 3159–3165. [Google Scholar] [CrossRef]
- Sun, L.; Sun, R.; Chen, L.; Sun, T. Sensitive Indicators of Soil Nutrients from Reservoir Effects in the Hot-Dry Valleys of China. Catena 2022, 216, 106421. [Google Scholar] [CrossRef]
- Ma, H.; McConchie, J.A. The Dry-Hot Valleys and Forestation in Southwest China. J. For. Res. 2001, 12, 35–39. [Google Scholar] [CrossRef]
- Gong, Z.; Li, Y.; Liu, L.; Deng, S. Great Facilitation of Thirty Years of Reforestation with Mixed Species to Ecosystem Nitrogen Accumulation in Dry-Hot Valley in the Jinsha River. Int. J. Environ. Res. Public Health 2022, 19, 12660. [Google Scholar] [CrossRef] [PubMed]
- Yıldız, O.; Eşen, D.; Sargıncı, M.; Çetin, B.; Toprak, B.; Dönmez, A.H. Restoration Success in Afforestation Sites Established at Different Times in Arid Lands of Central Anatolia. For. Ecol. Manag. 2022, 503, 119808. [Google Scholar] [CrossRef]
- Li, S.; Huang, X.; Tang, R.; Li, J.; Zhu, B.; Su, J. Soil Microbial Diversity and Network Complexity Sustain Ecosystem Multifunctionality Following Afforestation in a Dry-Hot Valley Savanna. Catena 2023, 231, 107329. [Google Scholar] [CrossRef]
- Zhang, W.; Hu, Y.; Zhang, J.; Liu, M.; Yang, Z. Assessment of Land Use Change and Potential Eco-Service Value in the Upper Reaches of Minjiang River, China. J. For. Res. 2007, 18, 97–102. [Google Scholar] [CrossRef]
- Li, M.; Tian, C.; Wang, Y.; Liu, Q.; Lu, Y.; Shan, W. Impacts of Future Climate Change (2030-2059) on Debris Flow Hazard: A Case Study in the Upper Minjiang River Basin, China. J. Mt. Sci. 2018, 15, 1836–1850. [Google Scholar] [CrossRef]
- Wang, B.; Qu, L.Y.; Ma, K.M.; Zhang, X.Y.; Song, C.J. Patterns of Ecoenzymatic Stoichiometry in the Dominant Shrubs in the Semi-Arid Upper Minjiang River Valley. Acta Ecol. Sin. 2015, 35, 6078–6088. (In Chinese) [Google Scholar]
- Wang, B.; Qu, L.; Song, C.; Gong, Y. Effects of Dominant Shrubs on Soil Microbial Composition in the Semi-Arid Minjiang River Valley. Acta Ecol. Sin. 2015, 35, 2481–2493. (In Chinese) [Google Scholar]
- Gong, Z.; Tang, Y.; Xu, W.; Mou, Z. Rapid Sequestration of Ecosystem Carbon in 30-Year Reforestation with Mixed Species in Dry Hot Valley of the Jinsha River. Int. J. Environ. Res. Public Health 2019, 16, 1937. [Google Scholar] [CrossRef]
- Wei, H.E.; Tian, L.I.; Wei, Z.; Shilei, W.U.; Yu, S.U.; Yan, W.; You, J. Research on Species Diversity of Pinus radiata Plantation under Different Afforestation Models in Dry-hot Valley of the Minjiang River. J. Sichuan For. Sci. Technol. 2021, 42, 61–67. (In Chinese) [Google Scholar] [CrossRef]
- Pang, X.-Y.; Bao, W.-K.; Zhang, Y.-M. Evaluation of Soil Fertility Under Different Cupressus chengiana Forests Using Multivariate Approach1. Pedosphere 2006, 16, 602–615. [Google Scholar] [CrossRef]
- Hu, X.-G.; Mao, J.-F.; El-Kassaby, Y.A.; Jia, K.-H.; Jiao, S.-Q.; Zhou, S.-S.; Li, Y.; Coops, N.C.; Wang, T. Local Adaptation and Response of Platycladus orientalis (L.) Franco Populations to Climate Change. Forests 2019, 10, 622. [Google Scholar] [CrossRef]
- Li, J.; Milne, R.I.; Ru, D.; Miao, J.; Tao, W.; Zhang, L.; Xu, J.; Liu, J.; Mao, K. Allopatric Divergence and Hybridization within Cupressus chengiana (Cupressaceae), a Threatened Conifer in the Northern Hengduan Mountains of Western China. Mol. Ecol. 2020, 29, 1250–1266. [Google Scholar] [CrossRef] [PubMed]
- Li, S.; Wu, Z. Study on Models of Conversion of Cropland to Forest and Grassland in the Midwest China. Sci. Silvae Sin. 2002, 38, 154–159. (In Chinese) [Google Scholar]
- Li, F.; Bao, W.-K.; Pang, X.; Leng, L. Seedling emergence, survival and growth of five endemic species in the dry valley of Minjiang River. Acta Ecol. Sin. 2009, 29, 2219–2230. (In Chinese) [Google Scholar]
- Rosell, R.A.; Gasparoni, J.C.; Galantini, J.A. Soil Organic Matter Evaluation. In Assessment Methods for Soil Carbon; Lewis Publishers: Boca Raton, FL, USA, 2001; pp. 311–322. [Google Scholar]
- Yang, Y.; Wu, Q.; Yang, W.; Wu, F.; Zhang, L.; Xu, Z.; Liu, Y.; Tan, B.; Li, H.; Zhou, W. Temperature and Soil Nutrients Drive the Spatial Distributions of Soil Macroinvertebrates on the Eastern Tibetan Plateau. Ecosphere 2020, 11, e03075. [Google Scholar] [CrossRef]
- Heanes, D.L. Determination of Total organic-C in Soils by an Improved Chromic Acid Digestion and Spectrophotometric Procedure. Commun. Soil Sci. Plant Anal. 1984, 15, 1191–1213. [Google Scholar] [CrossRef]
- Du, B.; Kreuzwieser, J.; Winkler, J.B.; Ghirardo, A.; Schnitzler, J.-P.; Ache, P.; Alfarraj, S.; Hedrich, R.; White, P.; Rennenberg, H. Physiological Responses of Date Palm (Phoenix dactylifera) Seedlings to Acute Ozone Exposure at High Temperature. Environ. Pollut. 2018, 242, 905–913. [Google Scholar] [CrossRef]
- Li, G.; Wan, S.; Zhou, J.; Yang, Z.; Qin, P. Leaf Chlorophyll Fluorescence, Hyperspectral Reflectance, Pigments Content, Malondialdehyde and Proline Accumulation Responses of Castor Bean (Ricinus communis L.) Seedlings to Salt Stress Levels. Ind. Crops Prod. 2010, 31, 13–19. [Google Scholar] [CrossRef]
- Werner, C.; Hasenbein, N.; Maia, R.; Beyschlag, W.; Máguas, C. Evaluating High Time-Resolved Changes in Carbon Isotope Ratio of Respired CO2 by a Rapid in-Tube Incubation Technique. Rapid Commun. Mass Spectrom. 2007, 21, 1352–1360. [Google Scholar] [CrossRef] [PubMed]
- Du, B.; Jansen, K.; Junker, L.V.; Eiblmeier, M.; Kreuzwieser, J.; Gessler, A.; Ensminger, I.; Rennenberg, H. Elevated temperature differently affects foliar nitrogen partitioning in seedlings of diverse Douglas fir provenances. Tree Physiol. 2014, 34, 1090–1101. [Google Scholar] [CrossRef] [PubMed]
- Pang, Z.; Lu, Y.; Zhou, G.; Hui, F.; Xu, L.; Viau, C.; Spigelman, A.F.; MacDonald, P.E.; Wishart, D.S.; Li, S.; et al. MetaboAnalyst 6.0: Towards a Unified Platform for Metabolomics Data Processing, Analysis and Interpretation. Nucleic Acids Res. 2024, 52, W398–W406. [Google Scholar] [CrossRef]
- Long, H.; Qin, Z.; Liu, F.; Wei, Z.; Gan, S.; Pu, C.; You, J. Advances in Researches on Vegegation Restoration in Dry Valleys of Sichuan Provence. J. Sichuan For. Sci. Technol. 2013, 34, 27–32. (In Chinese) [Google Scholar]
- Chen, X.; Yang, S.; He, J.; Dai, Y.; Yang, H. The Present Situation and Recovery Strategy of Ecological Environments in the Dry Valleys in the Upper Reaches of the Minjiang River Area. J. Sichuan For. Sci. Technol. 2014, 35, 62–65. (In Chinese) [Google Scholar]
- Luo, D.; Feng, Q.; Shi, Z.; Li, D.; Yang, C.; Liu, Q.; He, J. Dynamics of Carbon and Nitrogen Storage of Cupressus Chengiana Plantations in the Arid Valley of Minjiang River, Southwest China. Chin. J. Appl. Ecol. 2015, 26, 1099–1105. (In Chinese) [Google Scholar]
- Karasov, T.L.; Chae, E.; Herman, J.J.; Bergelson, J. Mechanisms to Mitigate the Trade-Off between Growth and Defense. Plant Cell 2017, 29, 666–680. [Google Scholar] [CrossRef]
- Cope, O.L.; Keefover-Ring, K.; Kruger, E.L.; Lindroth, R.L. Growth–Defense Trade-Offs Shape Population Genetic Composition in an Iconic Forest Tree Species. Proc. Natl. Acad. Sci. USA 2021, 118, e2103162118. [Google Scholar] [CrossRef] [PubMed]
- He, Z.; Webster, S.; He, S.Y. Growth–Defense Trade-Offs in Plants. Curr. Biol. 2022, 32, R634–R639. [Google Scholar] [CrossRef] [PubMed]
- Liu, Q.; He, J.; Zhang, L.; Zhu, X.; Yang, C.; Li, D.; Feng, Q. Research on Photosynthetic and Water Physiological Characteristics of 10 Tree Species Used for Ecological Restoration in Dry Valleys. J. Sichuan For. Sci. Technol. 2019, 40, 20–24. (In Chinese) [Google Scholar]
- Smirnoff, N.; Arnaud, D. Hydrogen Peroxide Metabolism and Functions in Plants. New Phytol. 2019, 221, 1197–1214. [Google Scholar] [CrossRef]
- Li, D.; Wei, S.; Chen, J.; Feng, Q.; Xu, Z.; Li, X.; Liu, Q.; Cai, L. Comparative study on photosynthetic physiological and water physiological characteristics of Cupressus chengiana in wet and dry season, the upper Minjiang River dry valley. Acta Ecol. Sin. 2022, 42, 7381–7389. (In Chinese) [Google Scholar] [CrossRef]
- Rice-Evans, C.; Miller, N.; Paganga, G. Antioxidant Properties of Phenolic Compounds. Trends Plant Sci. 1997, 2, 152–159. [Google Scholar] [CrossRef]
- Matysik, J.; Alia; Bhalu, B.; Mohanty, P. Molecular Mechanisms of Quenching of Reactive Oxygen Species by Proline under Stress in Plants. Curr. Sci. 2002, 82, 525–532. [Google Scholar]
- Ullah, I.; Khan, A.L.; Ali, L.; Khan, A.R.; Waqas, M.; Hussain, J.; Lee, I.-J.; Shin, J.-H. Benzaldehyde as an Insecticidal, Antimicrobial, and Antioxidant Compound Produced by Photorhabdus Temperata M1021. J. Microbiol. 2015, 53, 127–133. [Google Scholar] [CrossRef]
- Bhattacharya, S.; Kundu, A. Sugars and Sugar Polyols in Overcoming Environmental Stresses. In Protective Chemical Agents in the Amelioration of Plant Abiotic Stress; Roychoudhury, A., Tripathi, D.K., Eds.; Wiley: Hoboken, NJ, USA, 2020; pp. 71–101. ISBN 978-1-119-55163-8. [Google Scholar]
- Corpas, F.J.; Gupta, D.K.; Palma, J.M. Tryptophan: A Precursor of Signaling Molecules in Higher Plants. In Hormones and Plant Response; Gupta, D.K., Corpas, F.J., Eds.; Springer International Publishing: Cham, Switzerland, 2021; pp. 273–289. ISBN 978-3-030-77477-6. [Google Scholar]
- Wheeler, G.L.; Jones, M.A.; Smirnoff, N. The Biosynthetic Pathway of Vitamin C in Higher Plants. Nature 1998, 393, 365–369. [Google Scholar] [CrossRef] [PubMed]
- Foyer, C.H.; Kunert, K. The Ascorbate–Glutathione Cycle Coming of Age. J. Exp. Bot. 2024, 75, 2682–2699. [Google Scholar] [CrossRef] [PubMed]
- Jansen, K.; Du, B.; Kayler, Z.; Siegwolf, R.; Ensminger, I.; Rennenberg, H.; Kammerer, B.; Jaeger, C.; Schaub, M.; Kreuzwieser, J. Douglas-Fir Seedlings Exhibit Metabolic Responses to Increased Temperature and Atmospheric Drought. PLoS ONE 2014, 9, e114165. [Google Scholar] [CrossRef] [PubMed]
- Yang, F.; Burzlaff, T.; Rennenberg, H. Drought Hardening of European Beech (Fagus sylvatica L.) and Silver Fir (Abies alba Mill.) Seedlings in Mixed Cultivation. Forests 2022, 13, 1386. [Google Scholar] [CrossRef]
- Werner, C.; Schnyder, H.; Cuntz, M.; Keitel, C.; Zeeman, M.J.; Dawson, T.E.; Badeck, F.-W.; Brugnoli, E.; Ghashghaie, J.; Grams, T.E.E.; et al. Progress and Challenges in Using Stable Isotopes to Trace Plant Carbon and Water Relations across Scales. Biogeosciences 2012, 9, 3083–3111. [Google Scholar] [CrossRef]
- Schweiger, R.; Castells, E.; Da Sois, L.; Martínez-Vilalta, J.; Müller, C. Highly Species-Specific Foliar Metabolomes of Diverse Woody Species and Relationships with the Leaf Economics Spectrum. Cells 2021, 10, 644. [Google Scholar] [CrossRef] [PubMed]
- Anzano, A.; Bonanomi, G.; Mazzoleni, S.; Lanzotti, V. Plant Metabolomics in Biotic and Abiotic Stress: A Critical Overview. Phytochem. Rev. 2022, 21, 503–524. [Google Scholar] [CrossRef]
- Couée, I.; Sulmon, C.; Gouesbet, G.; El Amrani, A. Involvement of Soluble Sugars in Reactive Oxygen Species Balance and Responses to Oxidative Stress in Plants. J. Exp. Bot. 2006, 57, 449–459. [Google Scholar] [CrossRef] [PubMed]
- Hassan, M.U.; Nawaz, M.; Shah, A.N.; Raza, A.; Barbanti, L.; Skalicky, M.; Hashem, M.; Brestic, M.; Pandey, S.; Alamri, S.; et al. Trehalose: A Key Player in Plant Growth Regulation and Tolerance to Abiotic Stresses. J. Plant Growth Regul. 2023, 42, 4935–4957. [Google Scholar] [CrossRef]
- Bae, H.; Herman, E.; Sicher, R. Exogenous Trehalose Promotes Non-Structural Carbohydrate Accumulation and Induces Chemical Detoxification and Stress Response Proteins in Arabidopsis Thaliana Grown in Liquid Culture. Plant Sci. 2005, 168, 1293–1301. [Google Scholar] [CrossRef]
- Zhang, Y.; Fernie, A.R. On the Role of the Tricarboxylic Acid Cycle in Plant Productivity. J. Integr. Plant Biol. 2018, 60, 1199–1216. [Google Scholar] [CrossRef] [PubMed]
- Zhang, Y.; Swart, C.; Alseekh, S.; Scossa, F.; Jiang, L.; Obata, T.; Graf, A.; Fernie, A.R. The Extra-Pathway Interactome of the TCA Cycle: Expected and Unexpected Metabolic Interactions. Plant Physiol. 2018, 177, 966–979. [Google Scholar] [CrossRef] [PubMed]
- Okumoto, S.; Funck, D.; Trovato, M.; Forlani, G. Editorial: Amino Acids of the Glutamate Family: Functions beyond Primary Metabolism. Front. Plant Sci. 2016, 7, 318. [Google Scholar] [CrossRef] [PubMed]
- Hildebrandt, T.M.; Nunes Nesi, A.; Araújo, W.L.; Braun, H.-P. Amino Acid Catabolism in Plants. Mol. Plant 2015, 8, 1563–1579. [Google Scholar] [CrossRef] [PubMed]
- Chapin, F.S., III; Kedrowski, R.A. Seasonal Changes in Nitrogen and Phosphorus Fractions and Autumn Retranslocation in Evergreen and Deciduous Taiga Trees. Ecology 1983, 64, 376–391. [Google Scholar] [CrossRef]
- Fife, D.N.; Nambiar, E.K.S.; Saur, E. Retranslocation of Foliar Nutrients in Evergreen Tree Species Planted in a Mediterranean Environment. Tree Physiol. 2008, 28, 187–196. [Google Scholar] [CrossRef] [PubMed]
- Khare, S.; Singh, N.B.; Singh, A.; Hussain, I.; Niharika, K.; Yadav, V.; Bano, C.; Yadav, R.K.; Amist, N. Plant Secondary Metabolites Synthesis and Their Regulations under Biotic and Abiotic Constraints. J. Plant Biol. 2020, 63, 203–216. [Google Scholar] [CrossRef]
- Jan, R.; Asaf, S.; Numan, M.; Lubna; Kim, K.-M. Plant Secondary Metabolite Biosynthesis and Transcriptional Regulation in Response to Biotic and Abiotic Stress Conditions. Agronomy 2021, 11, 968. [Google Scholar] [CrossRef]
- Novaes, E.; Kirst, M.; Chiang, V.; Winter-Sederoff, H.; Sederoff, R. Lignin and Biomass: A Negative Correlation for Wood Formation and Lignin Content in Trees. Plant Physiol. 2010, 154, 555–561. [Google Scholar] [CrossRef]
- Huang, X.-Q.; Li, R.; Fu, J.; Dudareva, N. A Peroxisomal Heterodimeric Enzyme Is Involved in Benzaldehyde Synthesis in Plants. Nat. Commun. 2022, 13, 1352. [Google Scholar] [CrossRef]
- Li, J.; Zhou, W.; Francisco, P.; Wong, R.; Zhang, D.; Smith, S.M. Inhibition of Arabidopsis Chloroplast β-Amylase BAM3 by Maltotriose Suggests a Mechanism for the Control of Transitory Leaf Starch Mobilisation. PLoS ONE 2017, 12, e0172504. [Google Scholar] [CrossRef]
- Gillaspy, G.E. The Cellular Language of Myo-Inositol Signaling. New Phytol. 2011, 192, 823–839. [Google Scholar] [CrossRef]
- Valluru, R.; Van den Ende, W. Myo-Inositol and beyond–Emerging Networks under Stress. Plant Sci. 2011, 181, 387–400. [Google Scholar] [CrossRef]
- Zhang, H.; Yang, X.; Luo, Z.; Yang, Y.; You, J.; Chen, D.; He, W. Spatial and Temporal Dynamic Analysis of Bare Soil Area in Maoxian Arid Valley Based on RS. J. Sichuan For. Sci. Technol. 2023, 44, 91–97. (In Chinese) [Google Scholar]
- Robinson, D. δ15N as an Integrator of the Nitrogen Cycle. Trends Ecol. Evol. 2001, 16, 153–162. [Google Scholar] [CrossRef] [PubMed]
- Hobbie, E.A.; Högberg, P. Nitrogen Isotopes Link Mycorrhizal Fungi and Plants to Nitrogen Dynamics. New Phytol. 2012, 196, 367–382. [Google Scholar] [CrossRef]
- Handley, L.L.; Austin, A.T.; Stewart, G.R.; Robinson, D.; Scrimgeour, C.M.; Raven, J.A.; Heaton, T.H.E.; Schmidt, S. The 15N Natural Abundance (δ15N) of Ecosystem Samples Reflects Measures of Water Availability. Funct. Plant Biol. 1999, 26, 185–199. [Google Scholar] [CrossRef]
- Rennenberg, H.; Loreto, F.; Polle, A.; Brilli, F.; Fares, S.; Beniwal, R.S.; Gessler, A. Physiological Responses of Forest Trees to Heat and Drought. Plant Biol. 2006, 8, 556–571. [Google Scholar] [CrossRef] [PubMed]
- Evans, J.R.; Clarke, V.C. The Nitrogen Cost of Photosynthesis. J. Exp. Bot. 2019, 70, 7–15. [Google Scholar] [CrossRef]
- Du, B.; Haensch, R.; Alfarraj, S.; Rennenberg, H. Strategies of Plants to Overcome Abiotic and Biotic Stresses. Biol. Rev. 2024, 99, 1524–1536. [Google Scholar] [CrossRef] [PubMed]
- Heinonsalo, J.; Sun, H.; Santalahti, M.; Bäcklund, K.; Hari, P.; Pumpanen, J. Evidences on the Ability of Mycorrhizal Genus Piloderma to Use Organic Nitrogen and Deliver It to Scots Pine. PLoS ONE 2015, 10, e0131561. [Google Scholar] [CrossRef] [PubMed]
- Liu, J.; Ngoc Ha, V.; Shen, Z.; Zhu, H.; Zhao, F.; Zhao, Z. Characteristics of Bulk and Rhizosphere Soil Microbial Community in an Ancient Platycladus Orientalis Forest. Appl. Soil Ecol. 2018, 132, 91–98. [Google Scholar] [CrossRef]
- Zhang, M.; Liu, S.; Cao, X.; Chen, M.; Chen, J.; Xu, G.; Shi, Z. The Effects of Ectomycorrhizal and Saprotropic Fungi on Soil Nitrogen Mineralization Differ from Those of Arbuscular and Ericoid Mycorrhizal Fungi on the Eastern Qinghai-Tibetan Plateau. Front. Plant Sci. 2023, 13, 1069730. [Google Scholar] [CrossRef]
- Yang, H.; Yuan, Y.; Zhang, Q.; Tang, J.; Liu, Y.; Chen, X. Changes in Soil Organic Carbon, Total Nitrogen, and Abundance of Arbuscular Mycorrhizal Fungi along a Large-Scale Aridity Gradient. Catena 2011, 87, 70–77. [Google Scholar] [CrossRef]
- Rennenberg, H.; Dannenmann, M.; Gessler, A.; Kreuzwieser, J.; Simon, J.; Papen, H. Nitrogen Balance in Forest Soils: Nutritional Limitation of Plants under Climate Change Stresses. Plant Biol. 2009, 11, 4–23. [Google Scholar] [CrossRef] [PubMed]
- Li, C.; Wu, C.; Duan, B.; Korpelainen, H.; Luukkanen, O. Age-Related Nutrient Content and Carbon Isotope Composition in the Leaves and Branches of Quercus aquifolioides along an Altitudinal Gradient. Trees 2009, 23, 1109–1121. [Google Scholar] [CrossRef]
- Steppe, K.; Niinemets, Ü.; Teskey, R.O. Tree Size- and Age-Related Changes in Leaf Physiology and Their Influence on Carbon Gain. In Size- and Age-Related Changes in Tree Structure and Function; Meinzer, F.C., Lachenbruch, B., Dawson, T.E., Eds.; Springer: Dordrecht, The Netherlands, 2011; pp. 235–253. ISBN 978-94-007-1242-3. [Google Scholar]
- Albert, L.P.; Wu, J.; Prohaska, N.; de Camargo, P.B.; Huxman, T.E.; Tribuzy, E.S.; Ivanov, V.Y.; Oliveira, R.S.; Garcia, S.; Smith, M.N. Age-Dependent Leaf Physiology and Consequences for Crown-Scale Carbon Uptake during the Dry Season in an Amazon Evergreen Forest. New Phytol. 2018, 219, 870–884. [Google Scholar] [CrossRef] [PubMed]


Disclaimer/Publisher’s Note: The statements, opinions and data contained in all publications are solely those of the individual author(s) and contributor(s) and not of MDPI and/or the editor(s). MDPI and/or the editor(s) disclaim responsibility for any injury to people or property resulting from any ideas, methods, instructions or products referred to in the content. |
© 2024 by the authors. Licensee MDPI, Basel, Switzerland. This article is an open access article distributed under the terms and conditions of the Creative Commons Attribution (CC BY) license (https://creativecommons.org/licenses/by/4.0/).