Article

Chemical Diversity of UK-Grown Tea Explored Using Metabolomics and Machine Learning

1
Department of Life Sciences, Aberystwyth University, Aberystwyth SY23 3DA, UK
2
Dartmoor Estate Tea, Furzeleigh Farm, Ashburton, Newton Abbot TQ13 7JL, UK
*
Authors to whom correspondence should be addressed.
These authors contributed equally to this work.
Metabolites 2025, 15(1), 52; https://doi.org/10.3390/metabo15010052
Submission received: 1 January 2025 / Revised: 12 January 2025 / Accepted: 13 January 2025 / Published: 15 January 2025
(This article belongs to the Section Plant Metabolism)

Abstract

:
Background/Objectives: Dartmoor Estate Tea plantation in Devon, UK, is renowned for its unique microclimate and varied soil conditions, which contribute to the distinctive flavours and chemical profiles of tea. The chemical diversity of fresh leaf samples from various garden locations was explored within the plantation. Methods: Fresh leaf, which differed by location, cultivar, time of day, and variety, was analysed using Flow Infusion Electrospray Ionisation Mass Spectrometry (FIE-MS). Results: Random forest classification revealed no significant differences between Georgian N2 cultivar garden locations. However, a significant degree of variability was observed within four tri-clonal variants (Tocklai Variety) with TV9 exhibiting greater similarity to the Georgian N2 cultivar compared to TV8 and TV11, while TV11 was found to be most like TV1. The intraclass variability in leaf composition was similar between the varieties. We explored the metabolic changes over the day in one variant (Camellia assamica Masters), yielding a model with a significant R2 value of 0.617 (p < 0.01, 3000 permutations). Starch and sucrose metabolism was found to be significant where the abundance of these chemical features increased throughout the day and then began to decrease at night. Conclusions: This research highlights the complex interplay of cultivars, geographical location, and temporal factors on the chemical composition of tea. It provides insightful data on the metabolic pathways influencing tea cultivation and production and underscores the importance of these variables in determining the final chemical profile and organoleptic characteristics of tea products.

1. Introduction

Tea is made from the leaves of the plant Camellia sinensis L. and is a widely consumed UK beverage, with a rich cultural and agricultural heritage spanning thousands of years [1]. The scientific exploration of tea has been significantly advanced by contributions from China and India, two of the largest tea-producing nations.
The regular consumption of tea promotes wellness, in particular, improved ageing, and a reduction of cardiovascular diseases, cancers, hepatopathy, obesity, and diabetes mellitus [2,3]. These benefits are largely attributed to the diverse bioactive compounds present in tea, which have been the subject of extensive research. Tea contains an array of primary and secondary metabolites, including sugars, polyphenols, amino acids, alkaloids, and volatile organic compounds, which contribute significantly to its health-promoting properties [2,3]. Studies have highlighted the role of plucking season, shading, and soil conditions, cultivar development, and the impact of climatic variations on secondary metabolites, which contribute to tea’s metabolomic profile [4,5,6,7]. The importance of genetic diversity, environmental influences, and targeted breeding objectives has been demonstrated in understanding and enhancing the chemical composition and quality of tea [8]. These variables not only affect the chemical profile of tea but also its sensory attributes, including flavour, aroma, and colour, and health-promoting attributes, underscoring the complexity of tea as a functional food.
Advances in tea research have provided critical insights into the biosynthesis of bioactive compounds such as polyphenols, amino acids, and alkaloids. Studies have emphasised the impact of traditional practices, such as fermentation and processing, on tea quality, authenticity, and flavour [9,10,11].
Metabolomics has emerged as a pivotal tool for evaluating the chemical composition, quality, and authenticity of tea and tea products. An advanced, non-targeted metabolomics approach facilitates the unbiased screening of primary and secondary chemical compounds [12], allowing researchers to investigate subtle variations between tea samples based on their origin, processing methods, and storage conditions, alongside multiple other factors. Studies have demonstrated the effectiveness of metabolomics in distinguishing tea varieties and assessing quality markers [13,14,15]. Additionally, metabolomic approaches have been used to investigate the age-related differences of tea leaf metabolites in the fresh leaves collected from tea plants aged 8 and 25 years [16]. By combining metabolomics with traditional sensory evaluations and modern analytical techniques, a comprehensive understanding of tea’s complexity and health benefits can be achieved.
Modern analytical technologies, such as high-resolution metabolomics, provide insights into plant metabolism and the biosynthesis of secondary metabolites [17]. These methods allow the exploration of the complex mechanisms of plant growth, development, and responses to environmental stimuli, thereby advancing our understanding of plant chemistry. Flow Infusion Electrospray Ionisation Mass Spectrometry (FIE-MS) can be used to produce a non-targeted comprehensive overview of the chemical content of biologically derived material as a high throughput metabolite fingerprinting tool [18]. Data obtained can be analysed using spectral binning [19] and further down-stream analysis. Machine learning using computational algorithms that can learn patterns, relationships, and insights from metabolomic data and create hypotheses. Hydrophilic Interaction Liquid Chromatography (HILIC) has the ability to separate polar compounds, such as sugars, amino acids, and organic acids, which are key metabolites in tea. This technique complements the global fingerprinting provided by FIE-MS by enabling confirmation of specific metabolites through retention time matching and MS/MS analysis.
Tea represents a cultural heritage but is also a functional beverage with significant health-promoting properties. Ongoing research into the varying bioactive compounds of tea continues to shed light on its multifaceted benefits, ensuring its enduring relevance in both dietary and therapeutic contexts. These findings provide a broader context for understanding the unique characteristics of tea grown in non-traditional regions such as the UK, which is the focus of this study.
This current study leverages advanced analytical techniques and machine learning to investigate the chemical diversity of tea grown in the UK. The Dartmoor Estate Tea plantation, located in Devon, UK, is known for its unique microclimate and soil diversity, which provide an unconventional setting for tea cultivation. This study focuses on six tea varieties grown at the estate, including the Georgian N2 cultivar (GRGN) and four Tocklai Tri-clonal variants (TV08, TV09, TV11, TV01), as well as Camellia assamica (Sin.Ass). These varieties were selected for their adaptability to diverse environmental conditions and their potential for chemical diversity.

2. Materials and Methods

2.1. Tea Plants

Six tea varieties were available at Dartmoor Estate Tea, UK (located at coordinates 50.49643894722191° N, −3.769534518786335° W) in September: GRGN (Georgian N2 cultivar, 535 plants available, and 48 plants were randomly sampled between two gardens), TV 08, 09, 11, and 01 (Camellia Sinensis L. Tocklai Tri-clonal Variants, 860 available plants and 128 plants were randomly sampled between two gardens), and Sin.Ass = Camellia assamica Masters; syn C. sinensis var assamica variety (1560 available plants in one garden, 64 plants were randomly sampled). A randomised sampling map was computer-generated before the investigation to account for batches, location (garden/plot) and time taken (Figure S1).
Tocklai has developed numerous high-yielding and disease-resistant Camellia sinensis L. tea clones and seed stock. These include improved varieties tailored for specific climatic and soil conditions, enabling better tea production. TV1 (Tocklai Variety 1) is known for its high yield potential, adaptable to diverse agro-climatic conditions, and moderately resistant to common pests and diseases. TV8 (Tocklai Variety 8) offers a balanced profile of yield and cup quality, performs well in moderately acidic soils, typical of tea-growing regions in Assam and North Bengal, and exhibits moderate resistance to certain pests and diseases. TV9 (Tocklai Variety 9) is a high yielding clone, tolerates waterlogged conditions better than many other clones, making it ideal for flood-prone areas, and offers good resistance to certain fungal diseases. TV11 (Tocklai Variety 11) has a high yield and vigorous growth under diverse climatic conditions, moderate resistance to pests and diseases, and performs well under organic cultivation practices.
Tea originating from Georgia, a Chinese hybrid called Keymin, classified as a Georgian N2 cultivar (GRGN) which is heavy frost resistant. They were created in the 1940s as an Indo-Chinese hybrid by an agronomist Ksenia Bakhtadze. Lastly, Camellia assamica Masters; syn C. sinensis var assamica cultivar (Sin.Ass) from the Himalayan region of India [20].

2.2. Fresh Leaf Sample Collection

For metabolome samples we took six laminar leaf punches using a single hole punch from three plants (biological replicates) for each experimental point, selecting the top two youngest leaves ensuring standardisation. These punches avoided any major leaf veins. We placed the leaf punches into a 2 mL Eppendorf tube containing a 5 mm diameter steel ball bearing using tweezers and then immediately placed the Eppendorf tubes into a Dewar to snap freeze in liquid nitrogen. We cleaned the single hole punch after each use by spraying with 70% ethanol.
For temporal sampling, the same method was applied, and samples were collected at 09:00, 12:00, 18:00, and 00:00, of the Sin.Ass variety, over one single day.
All leaf disc samples were frozen in liquid nitrogen immediately when they were collected in the field, then transported in liquid nitrogen and then stored at −80 °C.

2.3. Sample Preparation and Extraction

All procedures were carried out on ice. Mixer mill sample holders were pre-chilled at −80 °C. Bligh and Dyer extraction mix (chloroform:methanol:water 2:5:2) was prepared in advance and chilled to −20 °C, then stored on ice during use.
It was vitally important not to allow the samples to defrost during milling, so all sample tubes were first placed in liquid nitrogen before transferring to pre-chilled mixer mill holders. The samples were milled for 30 s at 30 Hz then placed in liquid nitrogen once more. If necessary, the milling process was repeated until a fine powder was obtained. The ground leaf material was immediately extracted by adding 1 mL of Bligh and Dyer extraction mix to each tube. The weight of milled material in each tube was not recorded, as a degree of uniformity was expected because each tube contained six leaf discs of uniform size. All samples were vortexed then shaken at 4 °C for 20 min before centrifugation at 13,000× g and 4 °C for 5 min. The supernatants were transferred into new labelled Eppendorf tubes and stored at −80 °C prior to analysis.

2.4. Sample Preparation for Analysis

The tea leaf extracts were defrosted, vortexed, and spun down (13,000× g and 4 °C for 5 min) before aliquoting. A preliminary trial had demonstrated that the optimum dilution for the samples was 1:10, so dilutions were prepared using Bligh and Dyer extraction mix before aliquoting 100 µls into HPLC vials with 200 µL inserts. For each sequence run, a quality control sample was prepared by combining 20 µL aliquots from all diluted samples in the run in a separate 5 mL Eppendorf tube and mixing before transferring 200 µL into an HPLC vial. Bligh and Dyer extraction mix (200 µL) was used as the control.

2.5. Flow Infusion Electrospray Ionisation Mass Spectrometry (FIE-MS)

FIE-MS was performed using an Exploris 120 mass analyser equipped with a Dionex Vanquish UHPLC system (Thermo Scientific, Waltham, MA, USA). Metabolite fingerprints were generated in both positive and negative ionisation modes, in a single run.
All samples were randomised to minimise batch effects using a computer-generated randomisation sequence. This ensured that samples from different locations, cultivars, and time points were evenly distributed across analytical runs. Samples (20 µL) were injected into a flow of 100 µL min−1 methanol:water (70:30, v/v). Quality control (QC) samples were prepared by pooling aliquots from all sample extracts, and these were injected at regular intervals during each sequence to monitor instrument performance. Ion intensities were acquired between m/z 55 and 1200 for 3.5 min at a resolution setting of 120,000, resulting in 3 (±1) ppm mass accuracy. Tuning and ESI source parameters were set according to the manufacturer’s recommendations. Following data acquisition, Chromeleon.cmbx files were first exported to .raw files and then converted to the .mzML open file format and centroided [21] using msconvert (TransProteomicPipeline) [22]. Spectral binning was applied using the R package binneR [19] and then standard post-acquisition processing routines were applied, including occupancy and QC filtering (Figure S2). Data were normalised and log2 transformed. Putative molecular formulas were generated by using MZedDB [23], an Aberystwyth University database for accurate mass annotation to 3 (±1) ppm accuracy. The ionisation products of the assigned molecular formulas were first searched against the KEGG compound database specific to Camellia sinensis for putative matches. Initial data analysis including classification was performed in R package metabolyseR (0.15.4).
Confirmational analysis (level 1) was performed on a TSQ Quantum Ultra EMR QQQ mass spectrometer (Thermo Fisher Scientific, San Jose, CA, USA) equipped with a heated electrospray ionisation source. Samples were delivered using an Accela UHPLC system (Thermo Fisher Scientific, San Jose, CA, USA) consisting of autosampler, column heater, and quaternary UHPLC-pump. Chromatographic separation was performed on a ZIC-pHILIC (Hydrophilic Interaction Liquid Chromatography polymeric 5 µm, 150 × 4.6 mm) column (Merck, Rahway, NJ, USA) as described [24,25].

2.6. Data Analysis

To provide a compositional overview of the samples, consensus structural classifications were compiled for each of the m/z features that were assigned a molecular formula. To do this, the molecular formulas were first searched against the KEGG compound database. Matching compounds were filtered based on their potential to form the relevant adduct under electrospray ionisation using the MZedDB ionisation rules [23]. Where no compound matches were identified in the KEGG compound database, the molecular formula was instead searched in the PubChem compound database using the same approach. The structural chemical classifications, based on the CHEMONT chemical taxonomy, were retrieved from the ClassyFire database for the matched compounds [26]. For each adduct of each assigned molecular formula, putative structural classifications were assigned to a depth based on a 66% or above consensus between the matched compounds.
Random forest (RF) regression was used to identify m/z features related to processing steps. RF was selected as the primary machine learning model due to its ability to handle high-dimensional, non-linear data and its robustness to overfitting when applied to relatively small sample sizes. Additionally, its interpretability through variable importance measures allowed us to identify key metabolites contributing to sample differentiation.
Confidence intervals (95%) were reported for key statistical tests to provide a range for expected variability.
K-means clustering was performed on the percentage relative abundance of the explanatory features. Functional and structural enrichment analysis was performed on each of the clusters to potentially derive both chemical classes and biological functions related to the cluster trends. Functional enrichment was performed on each of the clusters using the PageRank approach of the FELLA R package [27,28]. Structural enrichment was performed on each of the clusters using over-representation analysis with Fisher’s exact test.
Metabolite identification was achieved at Level 2 (putative annotations based on accurate mass matching) for most features, with selected compounds confirmed at Level 1 using authentic standards. The maximum error was 3 (±1) ppm. Matches were cross-referenced against KEGG and PubChem databases for annotation confidence.

3. Results

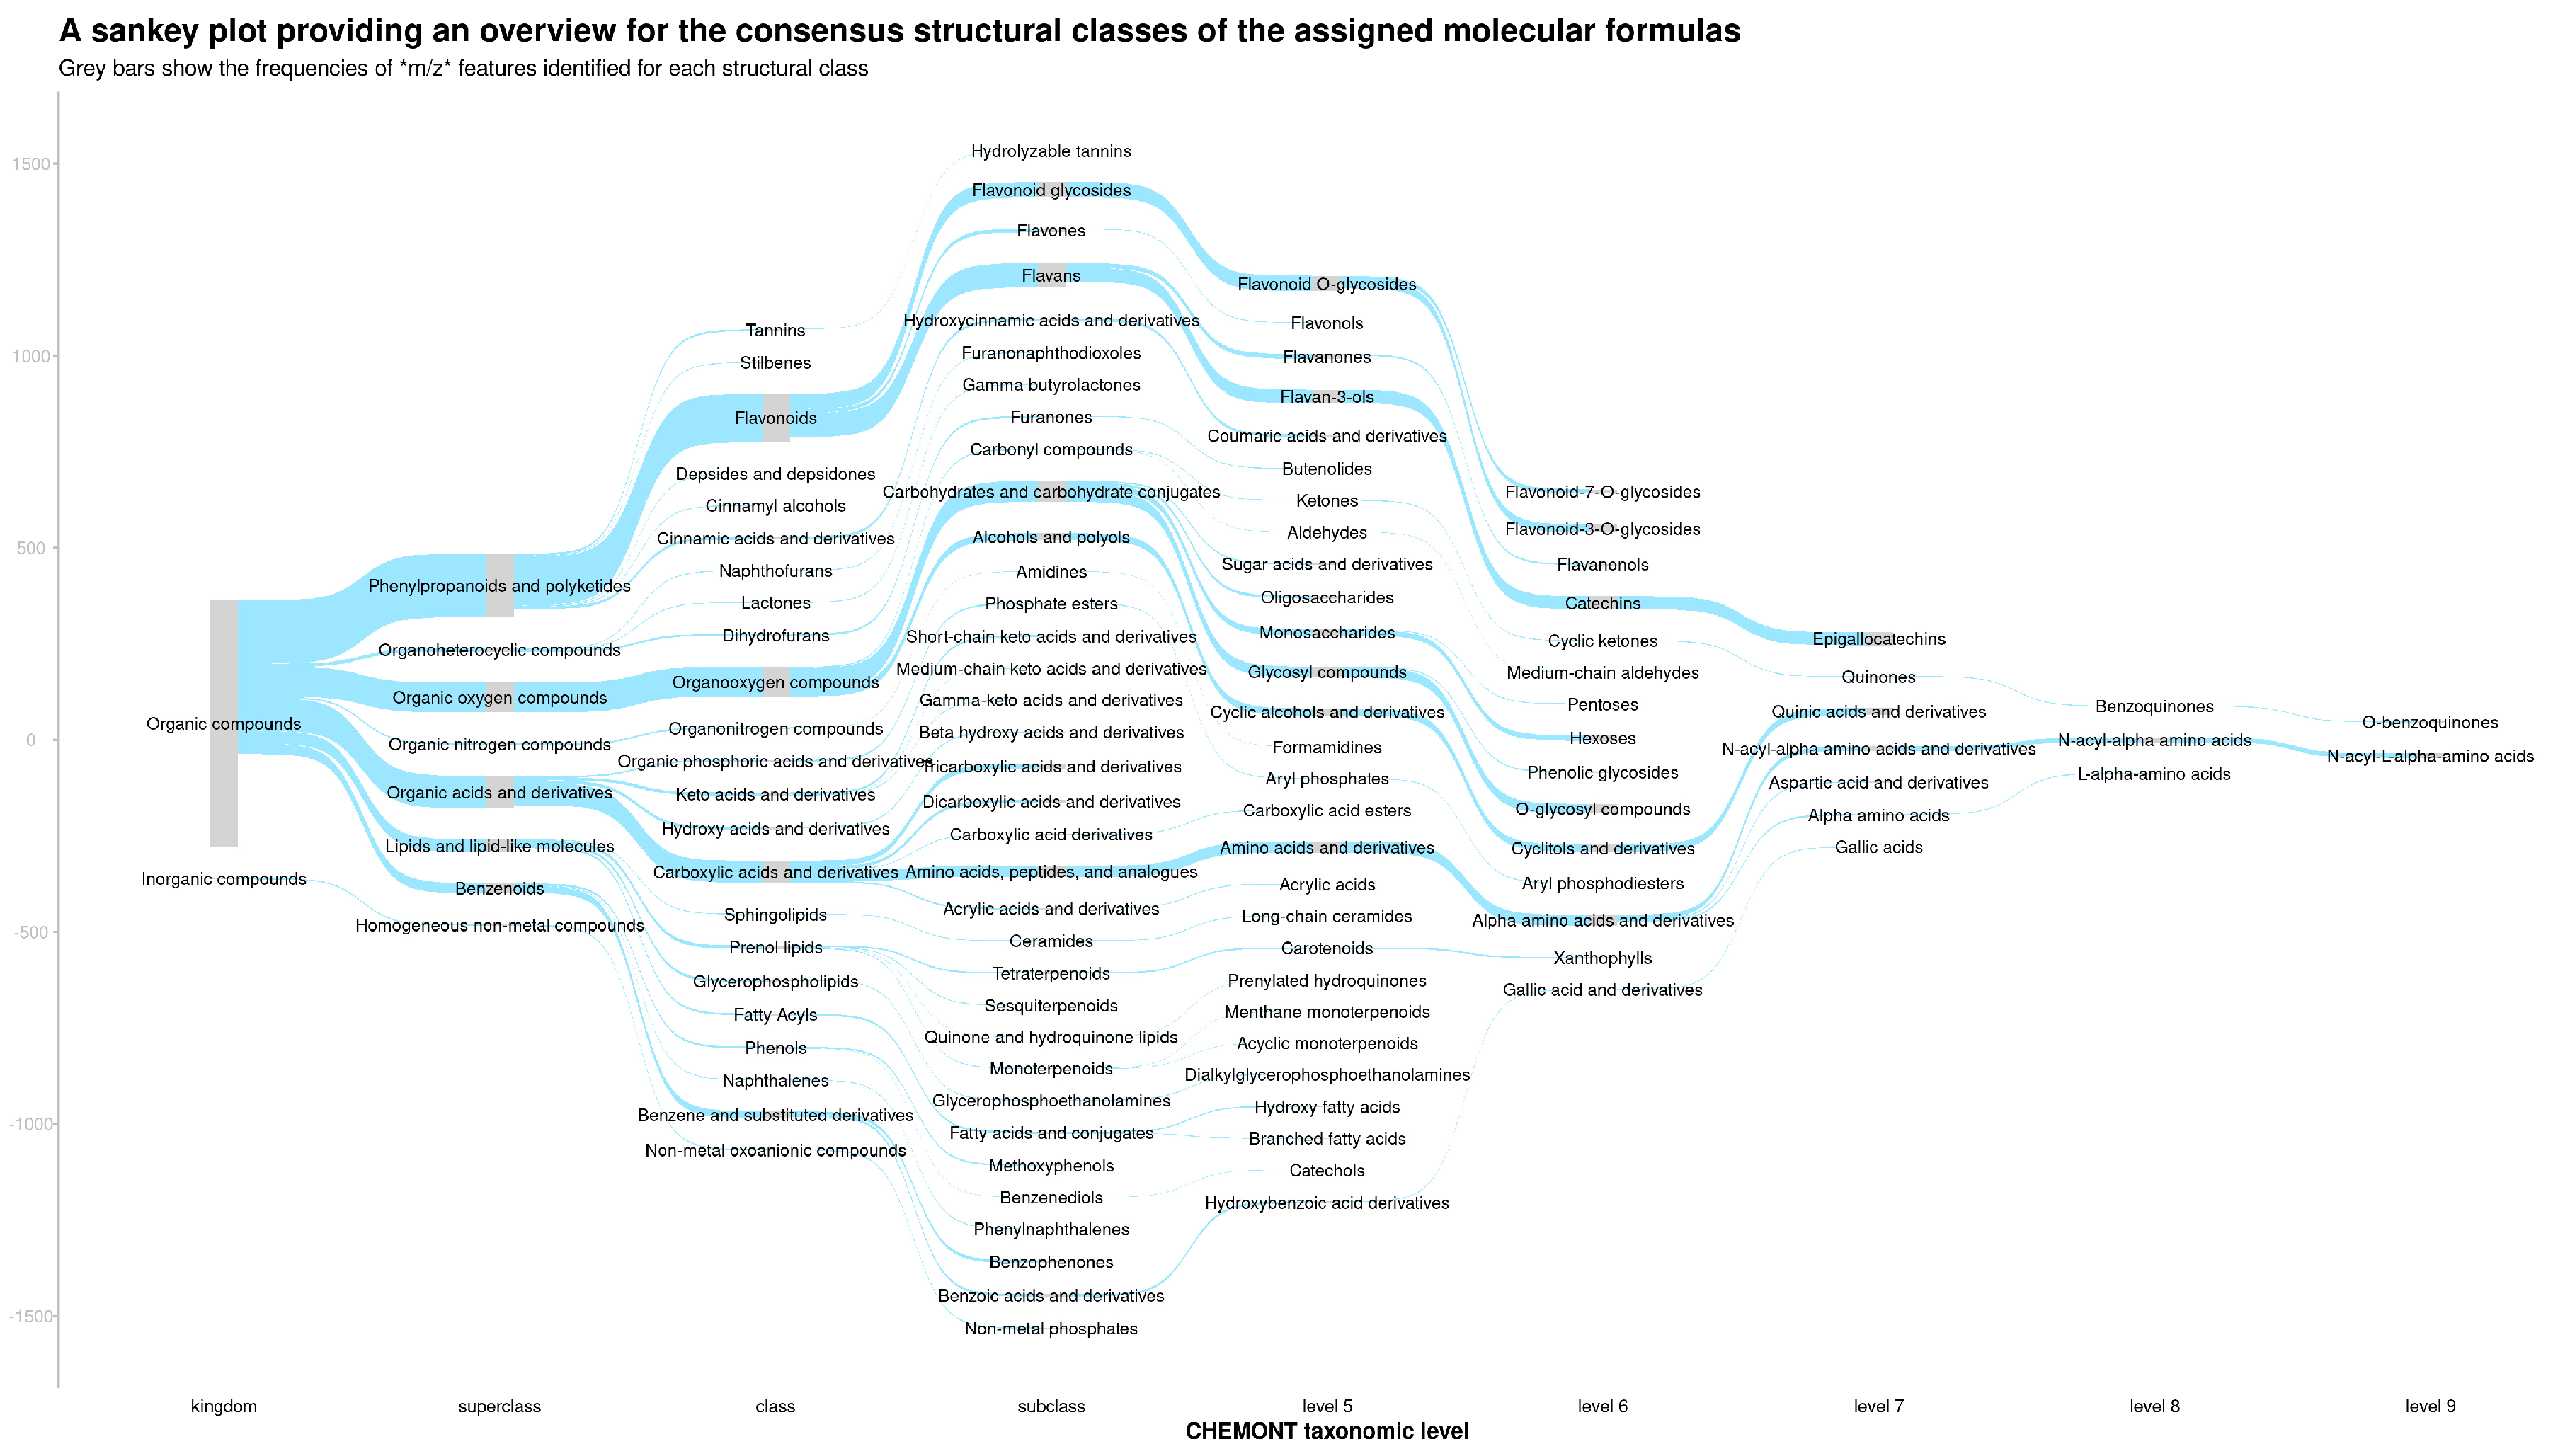
3.1. Structural Composition of the Tea Samples

The ionisation products of the assigned molecular formulas were first searched against the KEGG compound database specific to Camellia sinensis for putative matches. Any the structural classifications for any metabolite matches were retrieved from the Classyfire database. For the ionisation products of each assigned molecular formula, a consensus structural classification was assigned based on all the possible database matches using a consensus threshold of 66%. For ionisation products that did not match to the KEGG compound database, these were then matched against the PubChem database and consensus structural classifications assigned accordingly. Figure 1 shows a Sankey plot, which provides an overview of the structural composition of the tea samples. There was a high frequency of m/z features putatively classified as phenylpropanoids and polyketides, organic oxygen compounds, organic acids and derivatives, lipids and lipid-like molecules, and benzenoids.

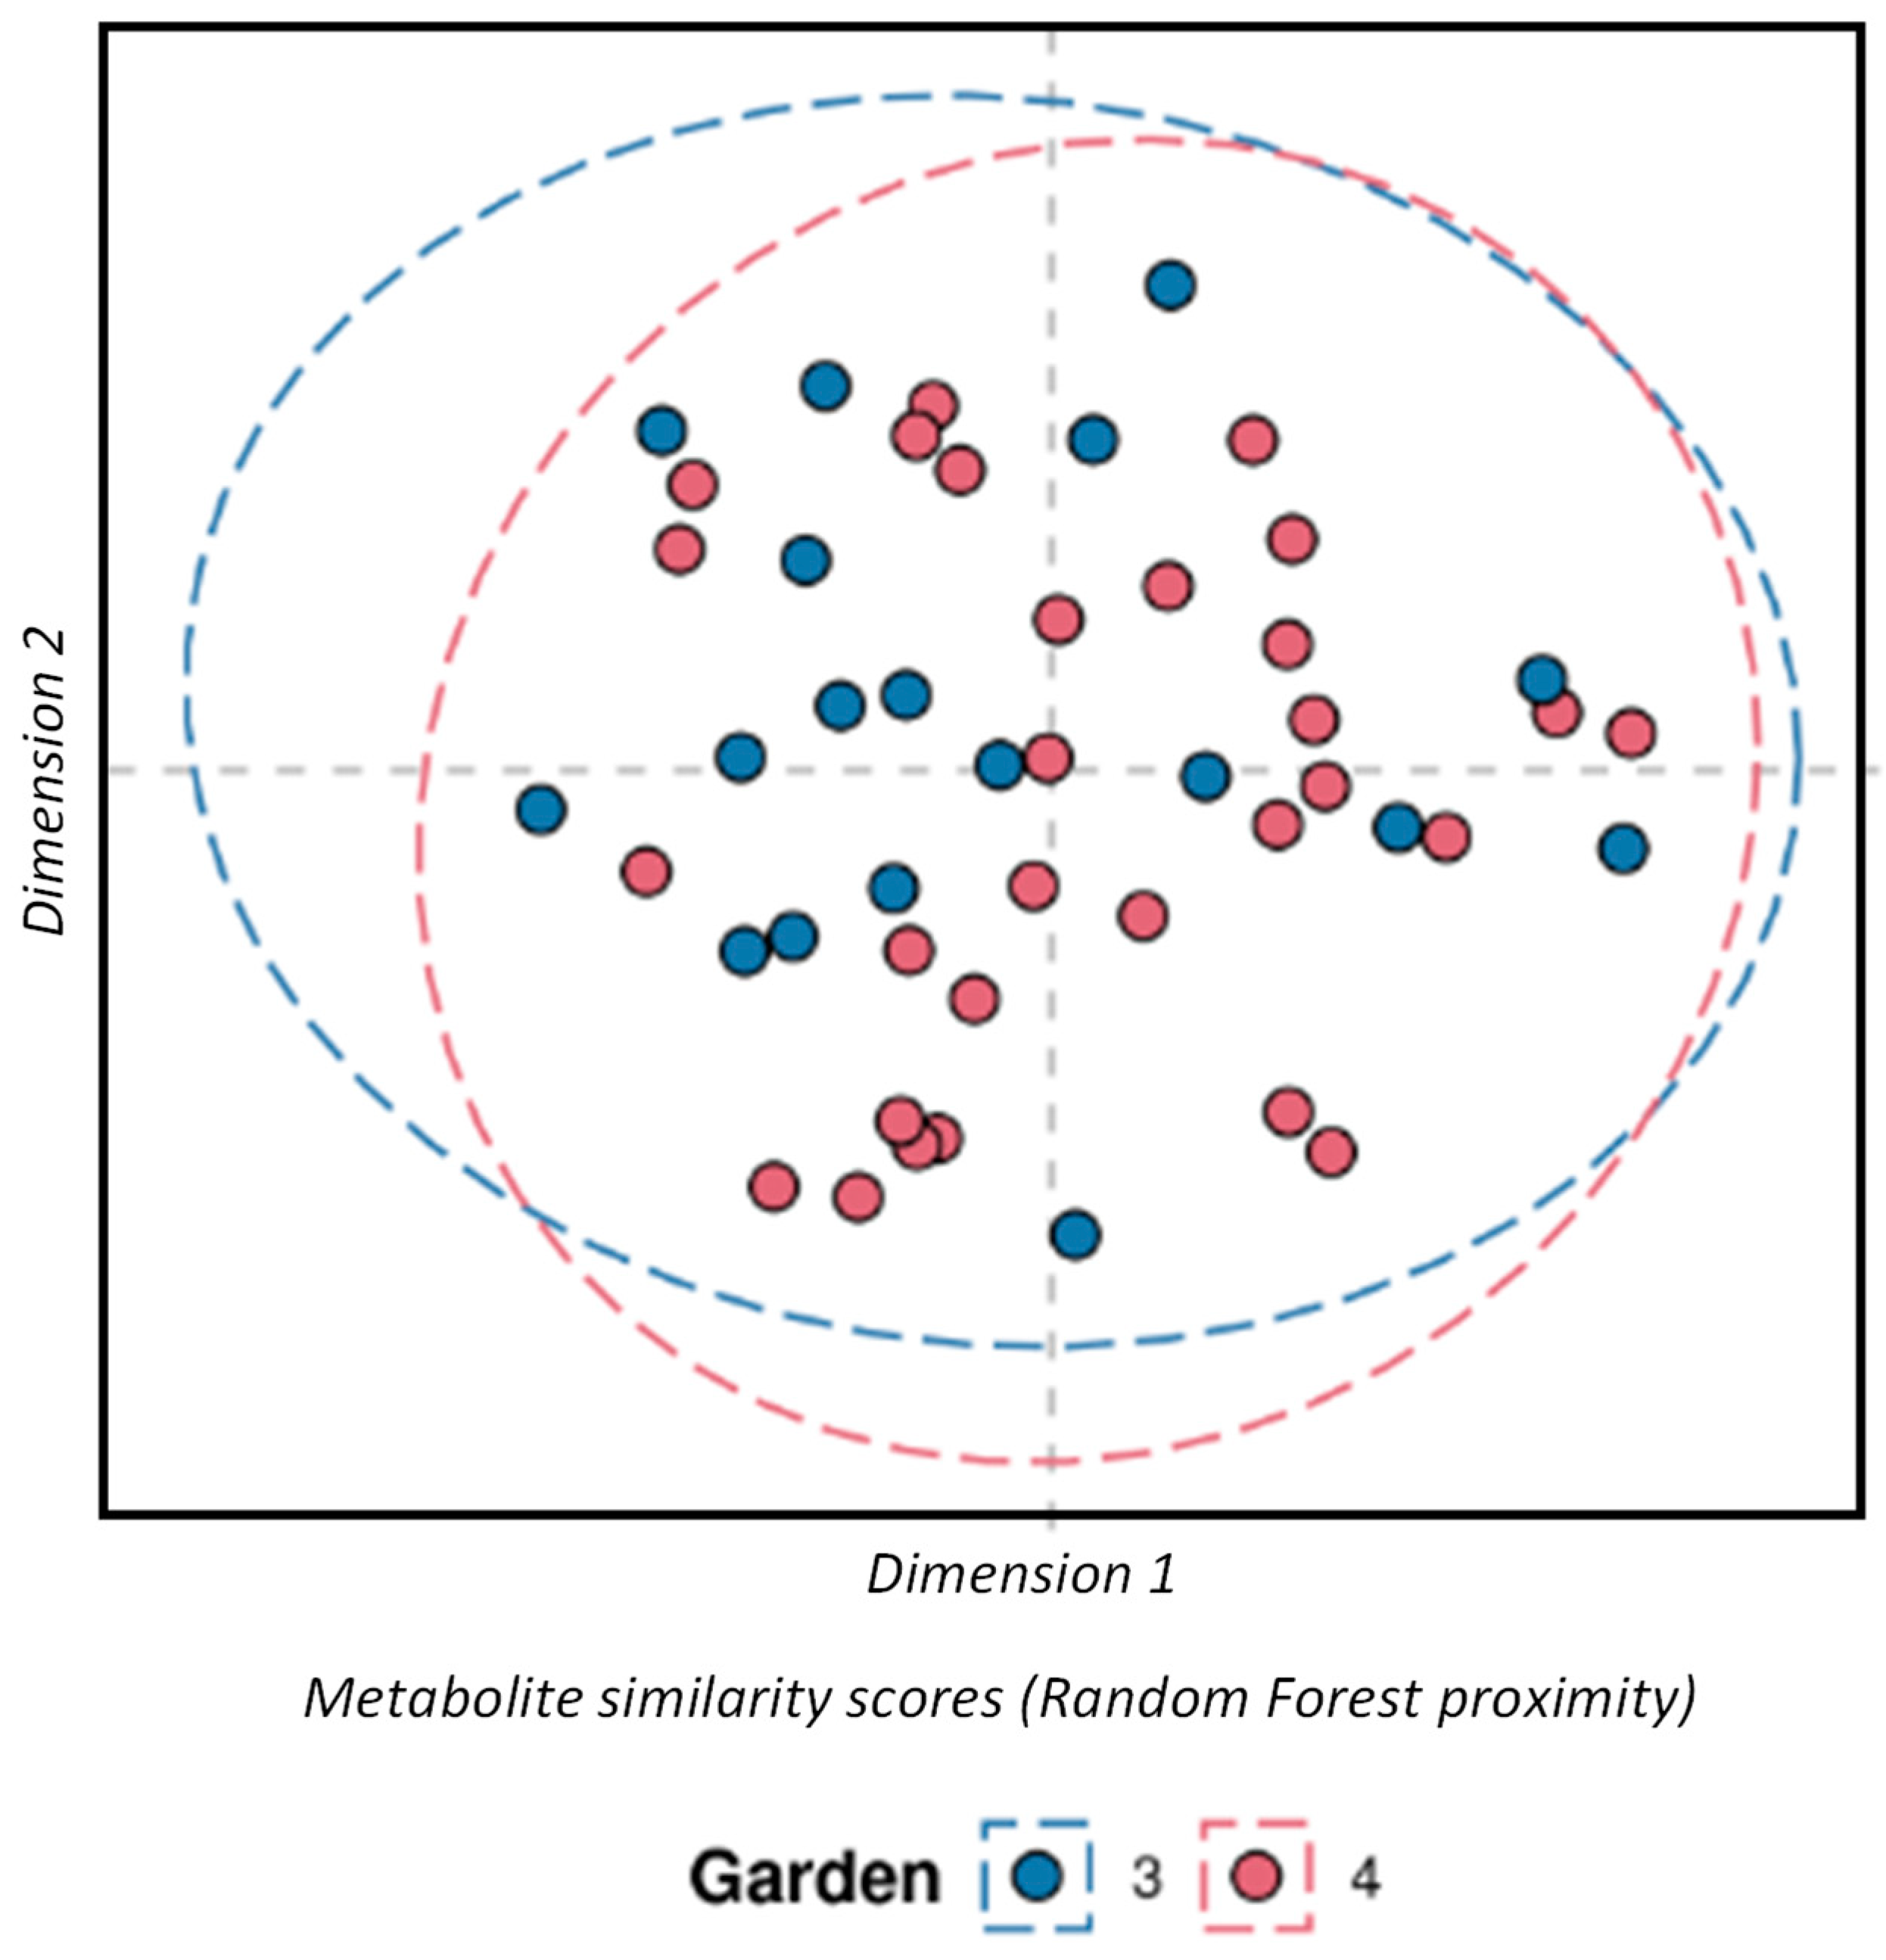
3.2. Variability Within the Georgian Tea

RF classification was performed to assess the difference of the Georgian tea plants between the two gardens. As shown in the multi-dimensional scaling plot (MDS) in Figure 2, there was no significant difference found between the plants in these gardens with a margin value of 0.00443 (p = 0.572, 3000 permutations). Very similar intraclass variability was also observed in both the gardens as shown by the intraclass distance distributions, where gardens 3 and 4 had median distance values of 0.656 and 0.687, respectively (Figure 3).

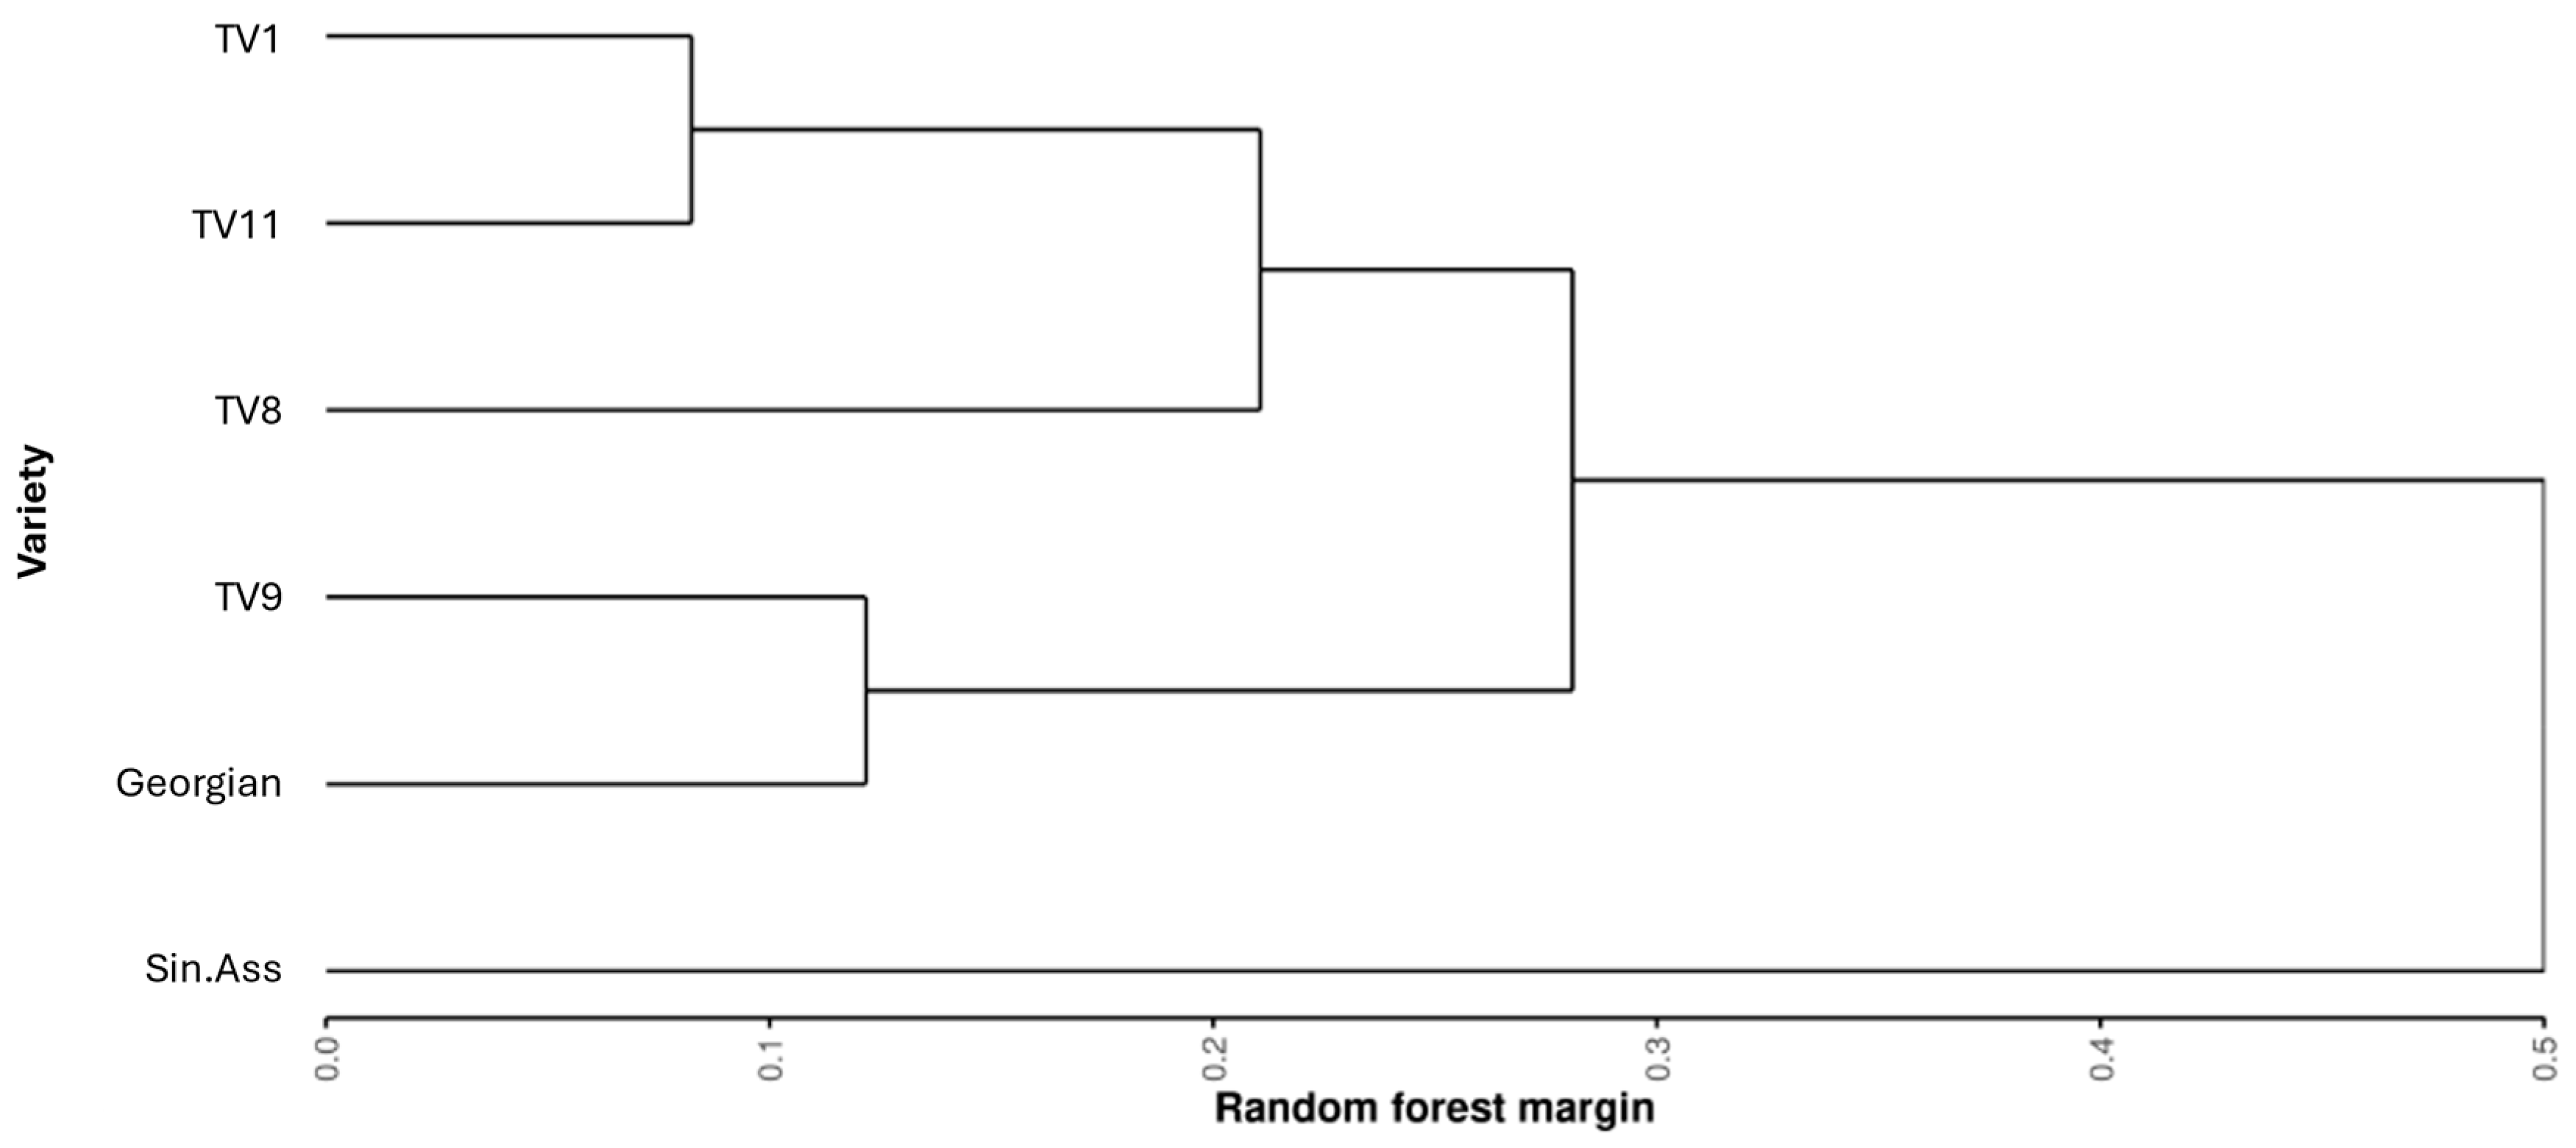
3.3. Variability Within the Tocklai Tri-Clonal Variants

Before assessing the variability within the Tocklai tri-clonal variants, it was first important to establish the relative difference across all the varieties sampled. Pairwise comparisons of RF classification were performed between all the varieties to assess the chemical relatedness between the tea varieties. Figure 4 shows a dendrogram of hierarchical cluster analysis for the resulting RF margin values. All these pairwise comparisons returned significant margin values (p < 0.05, 3000 permutations). This shows TV9 was more similar the Georgian varieties than TV8 and TV11, with TV11 showing the greatest similarity to TV1.
To quantify the intraclass variability within the Tocklai tri-clonal variants, all the sampled varieties were compared together using a single multinomial RF classification model. The MDS plot is shown in Figure 5 that is based on the sample proximity values from the RF model. This model gave a weak but significant margin value of 0.0183 (p < 0.001, 3000 permutations). The area of the ellipses (95% confidence interval) provides an estimate of the intraclass variability of the collected samples. These ellipses are of similar size across all the varieties, which suggests the observed intraclass variability in leaf composition is similar between the varieties.

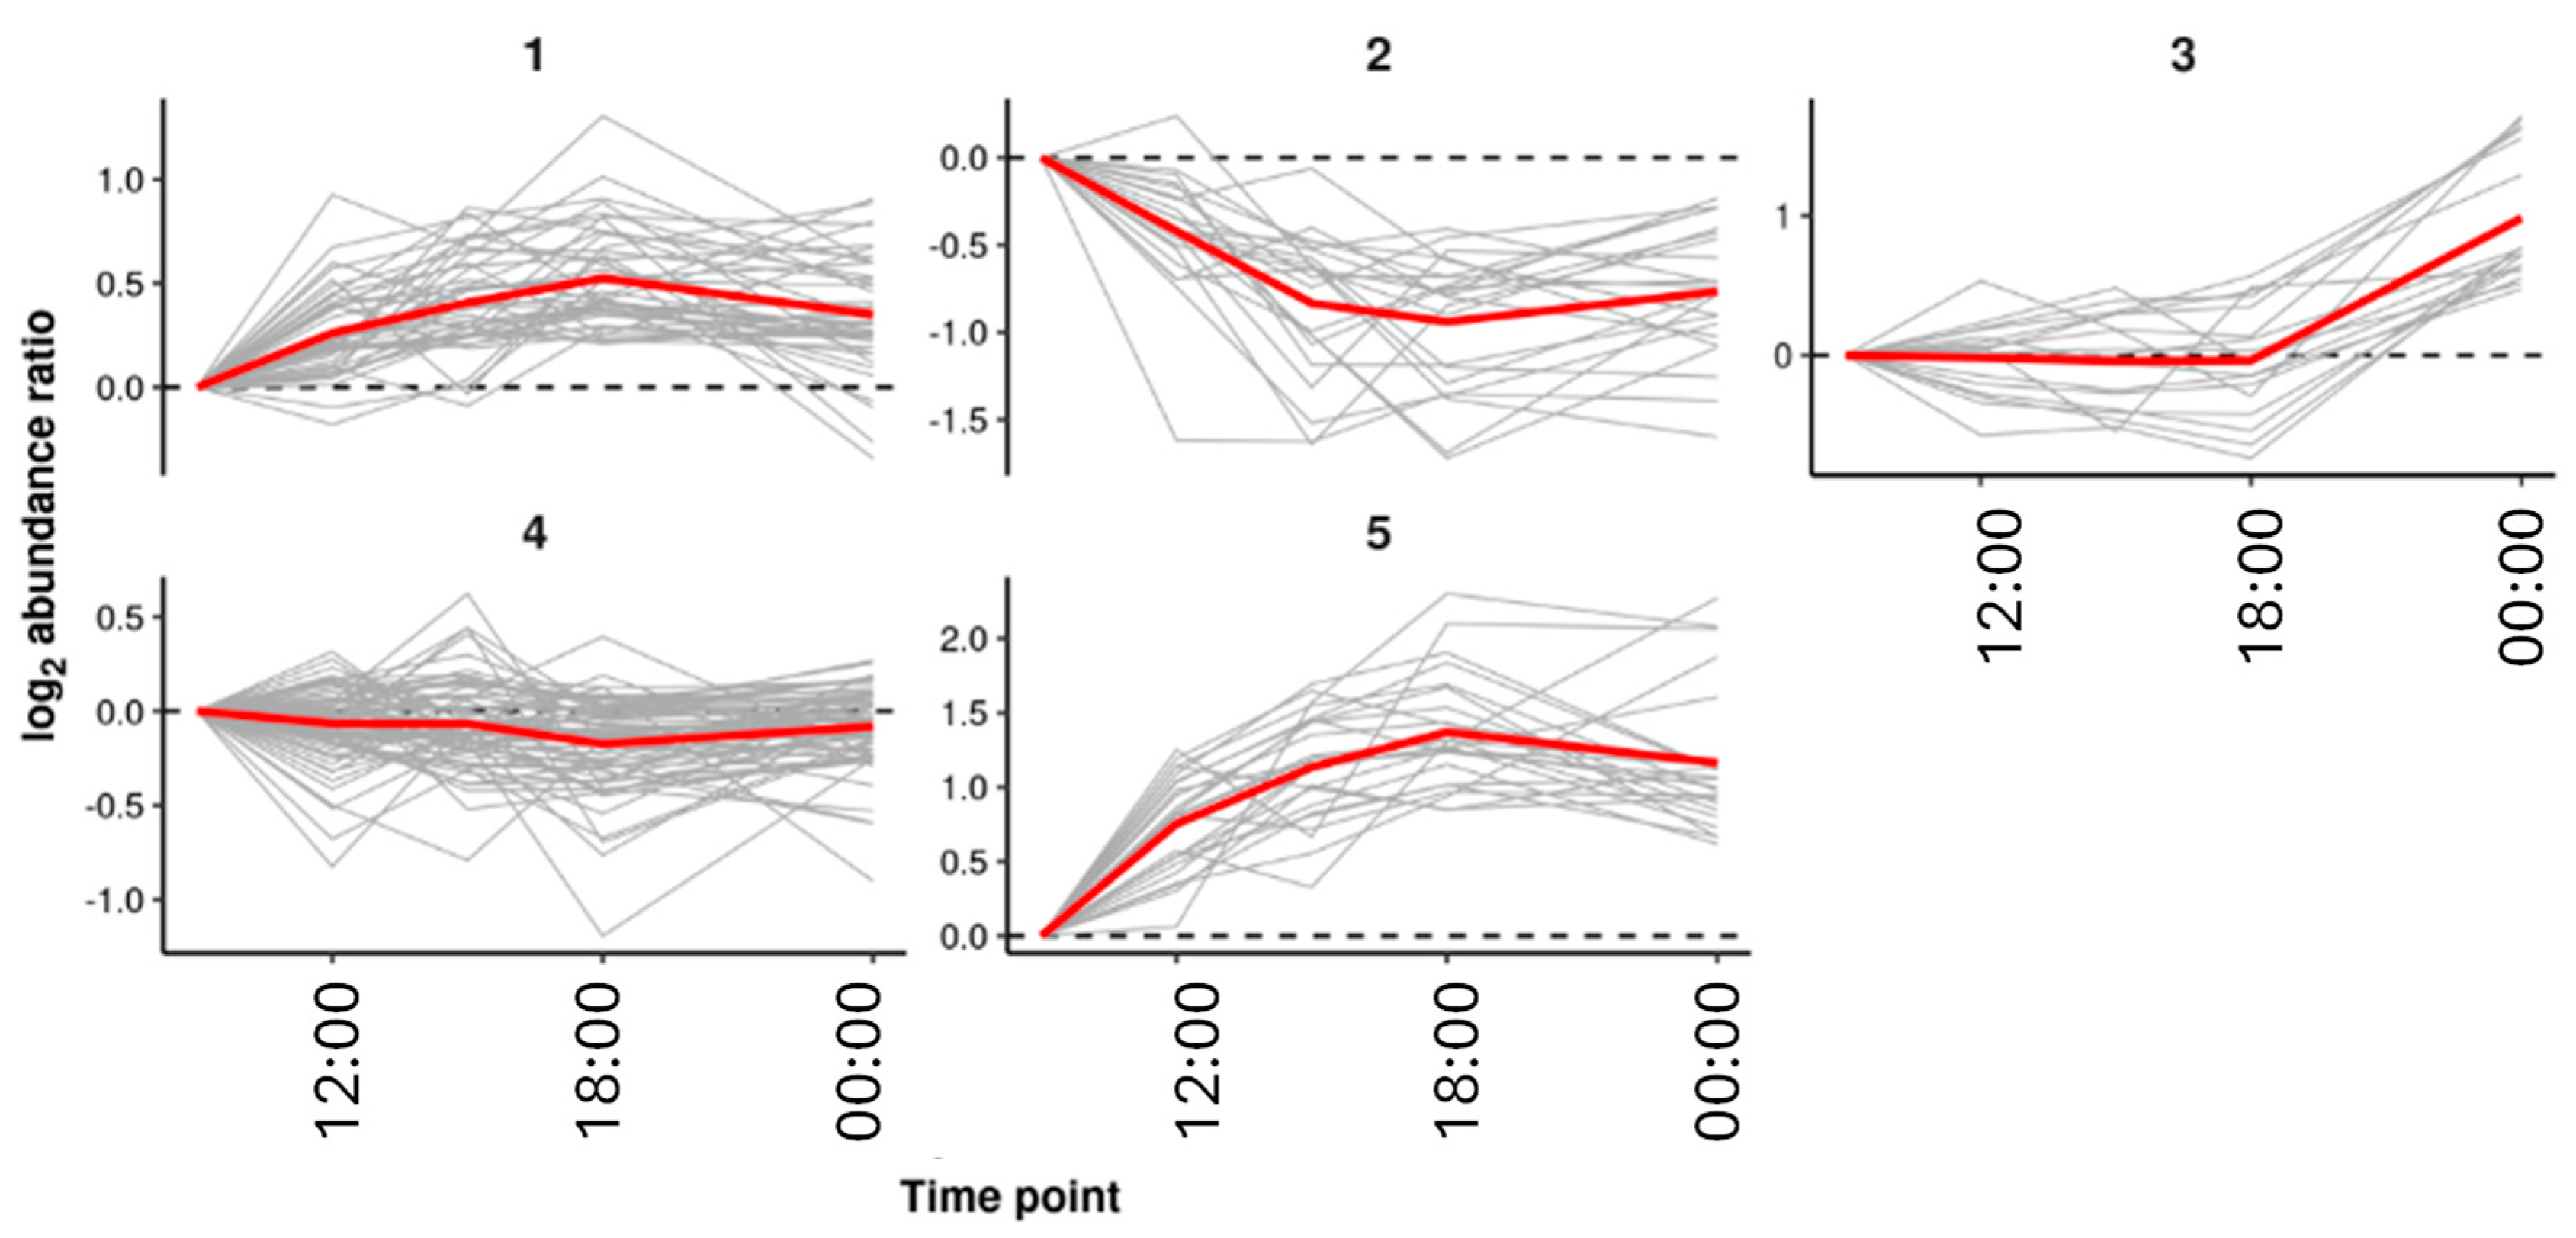
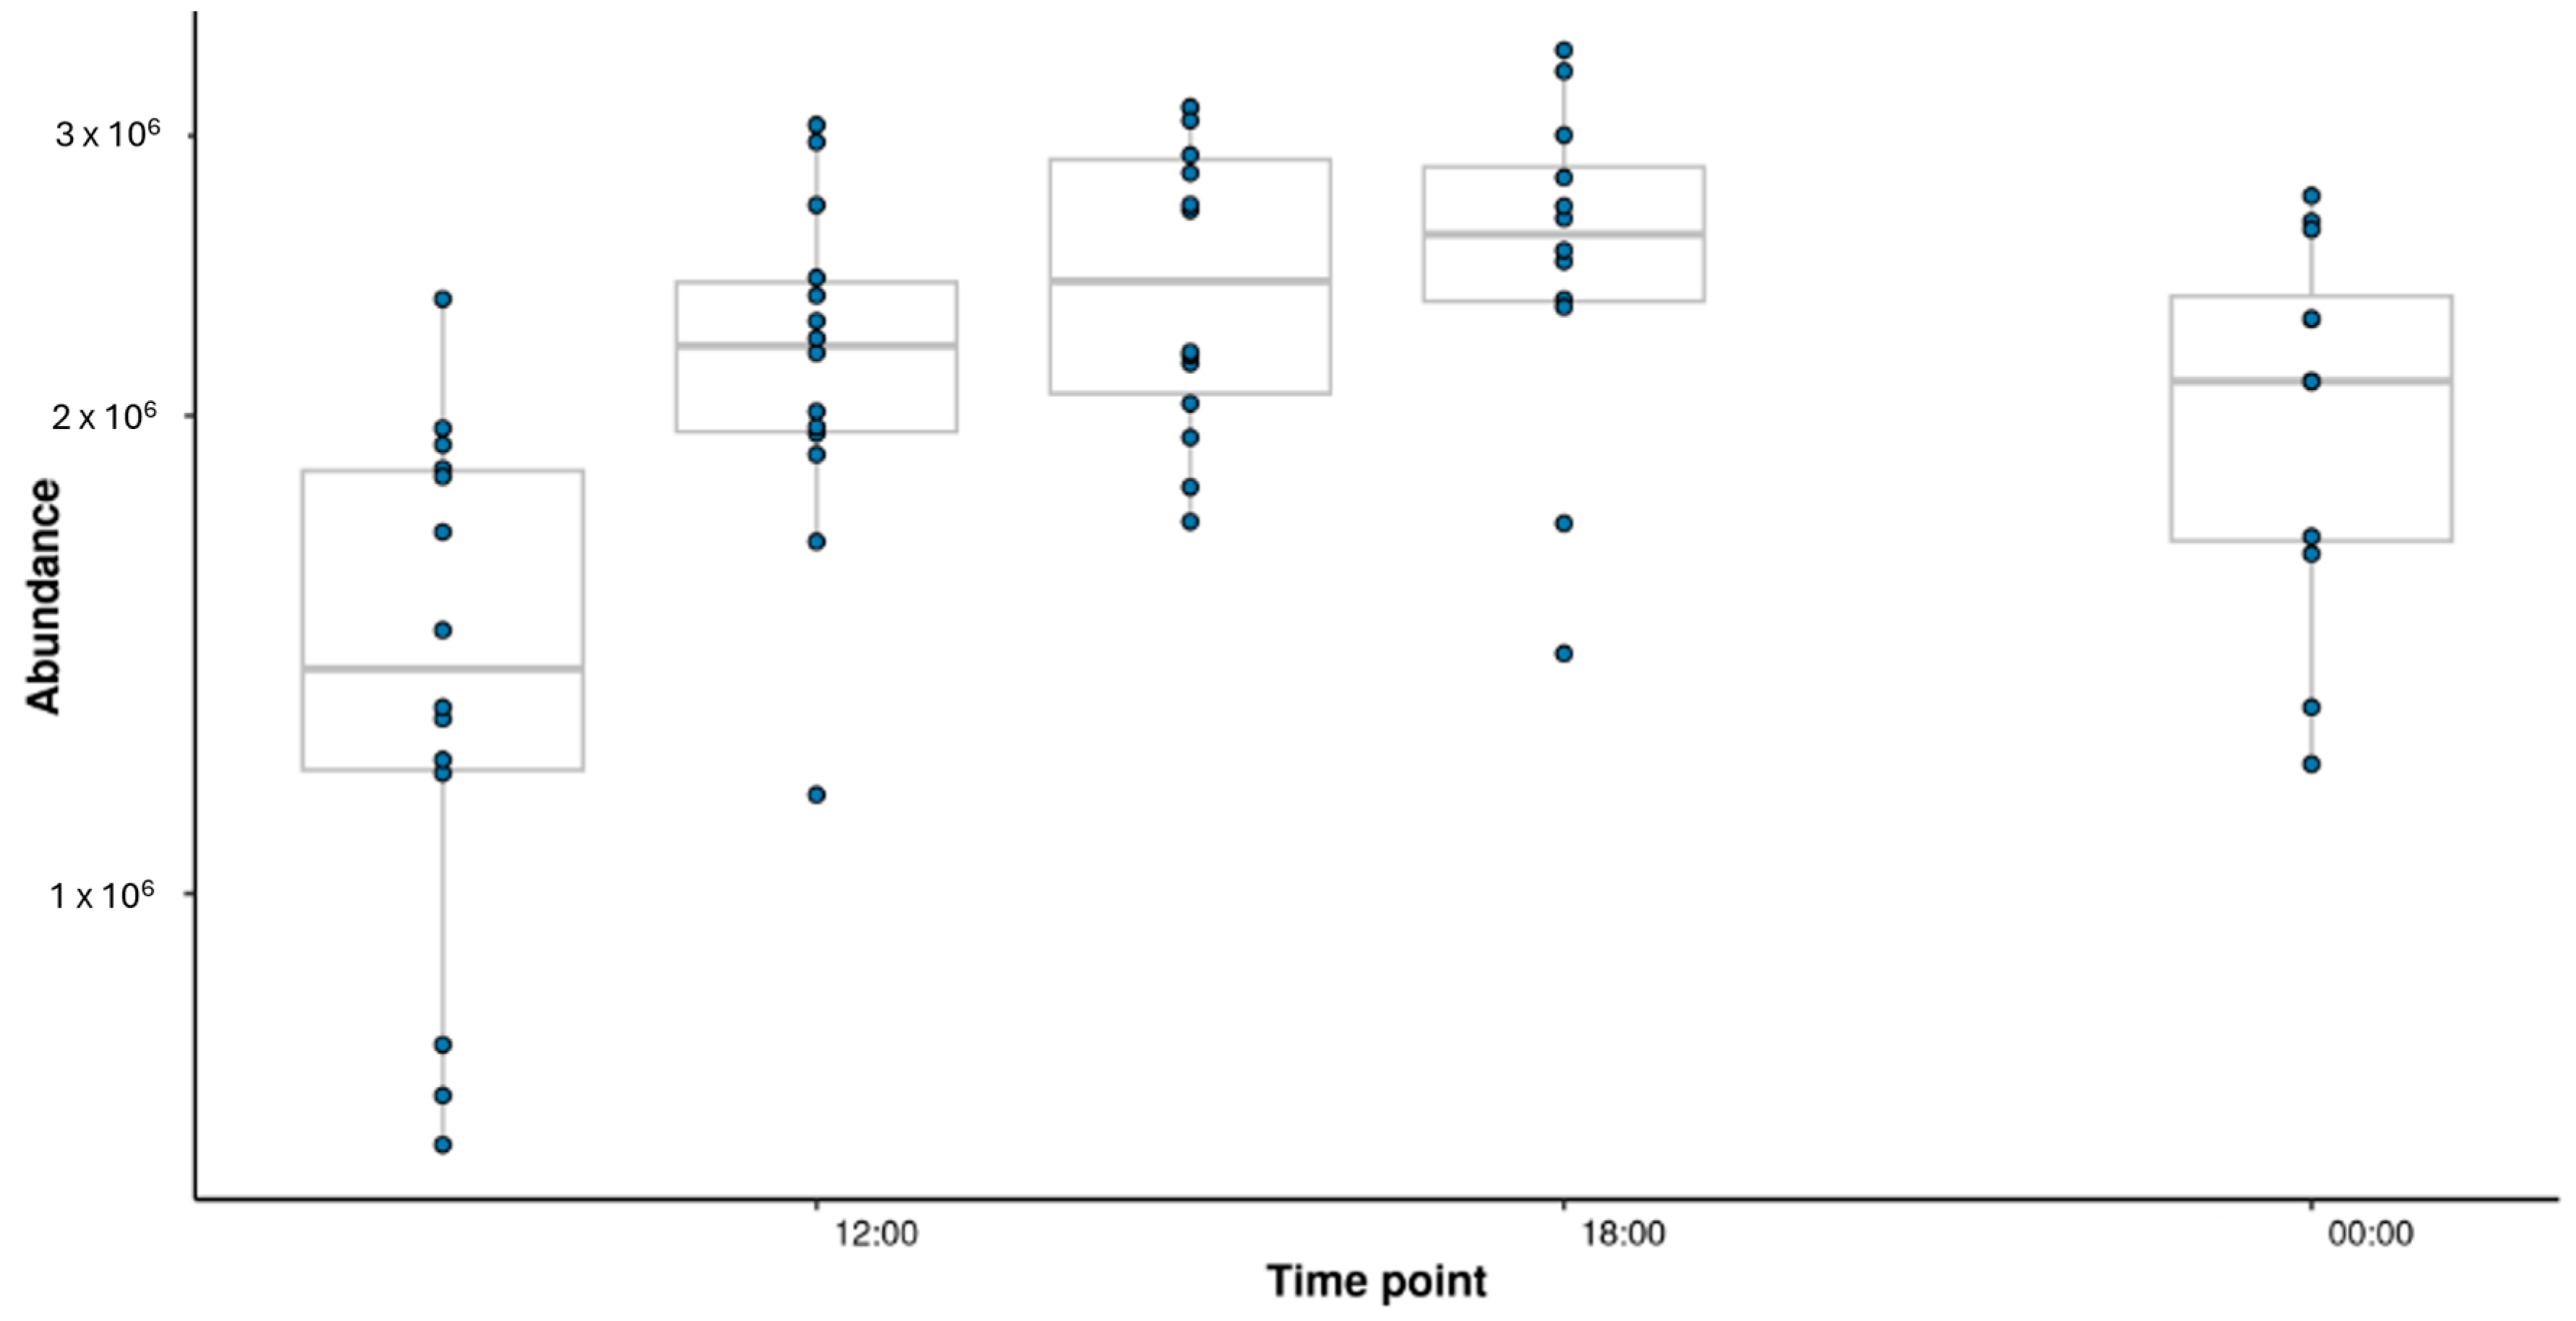
3.4. Metabolic Changes over the Day in One Variant

RF regression was used to identify m/z features related to sampling time point in C. sinensis var. assamica. This yielded a very strong model with a significant R2 value of 0.617 (p < 0.01, 3000 permutations). There were 174 features (m/z) found to be explanatory (% increase in mean squared error, p < 0.05, 3000 permutations). k-means clustering was performed on the log2 abundance ratios of the explanatory features taken relative to the first time point (9 a.m.). This grouped the explanatory features into five clusters of features showing similar trends across the sampling time points. The clusters in Figure 6 show the clustering of metabolites based on their temporal abundance patterns. Cluster 1, which includes sucrose, showed a clear diurnal rhythm, indicating its association with daytime photosynthetic activity. Clusters 3 and 5, which include amino acids and flavonoids, may represent biosynthetic pathways that are less directly linked to diurnal cycles and more influenced by other physiological processes.
Functional and structural enrichment analysis was performed on each of the clusters to potentially derive both chemical classes and biological functions related to the cluster trends. This identified significant metabolic pathways (Table 1). Structural enrichment was performed with over-representation analysis using Fisher’s exact test (Table 2). Both the structural subclass ‘Carbohydrates and carbohydrate conjugates’ and the metabolic pathway ‘Starch and sucrose metabolism’ were found to be significant for cluster 1, where the abundance of these features increase throughout daylight hours, peaking at 18:00 and then began to decrease. Figure 7 highlights the diurnal variation in sucrose abundance in Camellia sinensis var. assamica. The observed increase during daylight hours followed by a decline at night suggests a link between sucrose metabolism and photosynthetic activity. This aligns with the identification of starch and sucrose metabolism as a key pathway (Table 1, cluster 1). Sucrose was confirmed to Level 1 with standards using HILIC.

4. Discussion and Conclusions

Studies have demonstrated the effectiveness of metabolomics in distinguishing tea varieties and assessing quality markers [13,14,15]. Our study adds to this research and provides a detailed exploration of the chemical diversity and variability in tea samples from the Dartmoor Estate plantation in Devon, UK, highlighting the influence of cultivar, geographical location, and temporal factors. The findings demonstrate that while no significant differences were observed between Georgian garden locations, substantial chemical variability exists within tri-clonal Tocklai tea variants. Specifically, TV9 showed a greater similarity to Georgian cultivars than TV8 and TV11, with TV11 most closely related to TV01. These results underscore the role of genetic variation in influencing tea’s chemical composition and the potential for tailoring cultivation strategies to optimise specific traits. While statistical significance was achieved across most analyses, it is essential to interpret these results in the context of effect sizes and model power. However, future studies with larger sample sizes are warranted to confirm these findings and further enhance model robustness.
Temporal analyses of Camellia sinensis var. assamica revealed dynamic metabolic changes over the course of the day, particularly in starch and sucrose metabolism (cluster 1). The abundance of related metabolites increased during daylight hours before declining at night, demonstrating the importance of diurnal rhythms in influencing tea leaf composition. This highlights the potential for targeted harvesting schedules to maximise desired chemical profiles. This temporal regulation may influence not only the chemical composition of tea but also its flavour profile and quality. In another published study, High Performance Liquid Chromatography showed sucrose concentrations in the third and fourth tea leaves were significantly higher (p ≤ 0.05) than that of the bud, first, and second leaves. However, there was no significant effect of time of plucking affecting sucrose, concentrations in fresh leaves [29], unlike our results. On the other hand, it has been demonstrated the significant impact of seasonal changes on tea metabolite profiles, highlighting the intricate relationship between gene expression and metabolite biosynthesis [30]. Our observed chemical variability aligns with studies from traditional tea-growing regions. Significant climatic impacts on tea metabolite profiles in Assam have been reported [7], while seasonal changes were found in the amino acid concentrations in tea [31]. The enrichment of flavonoids in cluster 4 suggests a potential link to stress responses or secondary metabolism, which may be less directly tied to diurnal rhythms. These patterns align with known metabolic adaptations in plants to optimise growth and defence under variable environmental conditions.
The application of non-targeted metabolomics, FIE-MS, uncovered subtle compositional differences and identities of key metabolic pathways. By integrating metabolomics with functional and structural enrichment analyses (machine learning), this research advances our understanding of the complex interplay of environmental, genetic, and temporal factors in tea cultivation.
The review by [32] highlights the role of metabolomics in tea cultivation and processing, emphasising its ability to provide comprehensive chemical profiles that inform breeding strategies, cultivation practices, and processing methods. Our insights contribute to this broader knowledge of tea science, emphasising the importance of precision in agricultural and processing practices. They also offer valuable guidance for optimising tea production, enhancing its sensory qualities and bioactive potential, and preserving its cultural and economic significance in the global tea industry. While our study primarily focused on the metabolomic profiling of fresh tea leaves, it is well-documented that drying, fermentation, oxidation, and heat treatment significantly influence the chemical composition and sensory attributes of tea [33]. We have recently published insightful data on the metabolic pathways influencing tea processing, underscoring the importance of these variables in determining the final chemical profile and organoleptic characteristics of tea products [34].
The preparation of tea leaves for analysis traditionally considers developmental phases, from the collection of tender tips to fully mature leaves, which are known to influence chemical profiles and tea quality. While our study focused on standardised sampling of leaves across different cultivars and locations to minimise variability due to developmental stages, future research could include a stratified approach to analyse tips, flushes, and mature leaves separately to better capture the dynamic metabolomic changes during leaf development. Additionally, environmental factors such as soil composition, sunlight exposure, and altitude, which were monitored in this study, could be explored to see their impact on metabolomic profiles and tea quality.
A direct comparison of the metabolomic profiles of UK-grown tea with those from traditional tea-growing regions such as Georgia, India, and China would provide valuable insights into the influence of geography and cultivation practices on tea chemistry. Such comparative studies could highlight similarities and differences in secondary metabolite composition, contributing to an understanding of how environmental factors affect tea quality.
This research contributes to the growing field of metabolomics by providing a comprehensive chemical profile of tea grown in a non-traditional region. The integration of metabolomics with machine learning, specifically RF classification, enabled us to identify significant chemical variability across cultivars and time points. These findings offer new insights into the adaptability of tea plants and their potential for cultivation in emerging regions, contributing to global food security and agricultural diversification. This approach highlights the potential of machine learning tools in metabolomics for uncovering complex patterns in high-dimensional data. The approach used in this paper is robust for generating hypotheses and identifying broad trends; however, annotations based solely on molecular formulas remain tentative until confirmed by standards.
While this study provides valuable insights, it has certain limitations. The sampling was confined to a single growing season and location, limiting the ability to generalise findings across multiple climates or years. Additionally, the metabolomic analysis was based on fresh leaves and the effects of processing methods, such as drying and fermentation, were not explored. Future research should include multi-seasonal sampling, comparisons with traditional tea-growing regions, and analysis of processed tea to provide a more comprehensive understanding of tea chemistry.
To ensure robust biomarker discovery in metabolomics, replication across different harvest years and environmental conditions is critical. Variability in metabolomic profiles can arise due to biological factors such as plant age and environmental factors like soil composition, weather conditions, and harvest timing. High replication numbers, typically ranging between 9 and 24 replicates, are often necessary to increase confidence in observed trends while accounting for such variability. However, increasing replication beyond this range may inadvertently decrease the standard error to levels that favour outcomes arising by chance, thus underscoring the importance of balancing replication with experimental design rigor.
In this study, the replication numbers vary significantly, ranging from 3 at certain time points to 48 for specific varieties (e.g., Georgian). This variability reflects the exploratory nature of the research, which aimed to generate hypotheses regarding the chemical diversity of tea grown in a non-traditional region. While such variability is inherent to early-stage studies, it introduces potential biases that should be addressed in future investigations. For instance, future experiments could include replication across multiple harvest years under consistent conditions to verify that the observed patterns are not due to temporal or environmental chance events.
These considerations align with our objective to refine this metabolomics approach for hypothesis generation rather than clinical or diagnostic applications [35,36]. To address these potential biases and enhance robustness, future studies should prioritize controlled experimental designs with balanced replication and incorporate additional environmental and biological parameters to validate the findings presented here.
Future studies should aim to further investigate the relationship between chemical composition and sensory attributes, as well as the role of microbial and environmental interactions in influencing tea quality.

Supplementary Materials

The following supporting information can be downloaded at: https://www.mdpi.com/article/10.3390/metabo15010052/s1, Figure S1. Randomised sampling map was computer-generated before the investigation to account for batches, location (garden/plot), and time taken. Figure S2. Pre-treatment parameters.

Author Contributions

The study protocol was designed by A.J.L. and A.W.-W. Sample collection and data collection was carried out by A.J.L., A.W.-W., J.H., and K.B., P.M.M., L.L., M.B. and A.W., provided metabolomic analysis. T.W. and J.F. provided statistical analysis. A.J.L. wrote the first draft of the manuscript. The manuscript was critically reviewed by M.B. All authors have read and agreed to the published version of the manuscript.

Funding

Funded by Welsh Government Covid Recovery Challenge Fund (part of the Welsh Government’s Food and Drink Division funding), alongside Innovate UK Better Food for all (10068218), and the Joy Welch Research Fund (Aberystwyth University internal) 10068218 correspond to The Innovate UK Better Food for all only.

Institutional Review Board Statement

This article does not contain any studies with human and/or animal participants performed by any of the authors.

Informed Consent Statement

Not applicable.

Data Availability Statement

The metabolomics and metadata reported in this paper are available on request.

Acknowledgments

We would like to thank Tetrim Teas (Mari Arthur and Steffan Mcallister) for their huge amount of support and sampling efforts.

Conflicts of Interest

The authors declare no conflicts of interest.

Abbreviations

The following abbreviations are used in this manuscript. GRGN (Georgian N2 cultivar), TV 08, 09, 11, and 01 (Camellia sinensis L. Tocklai Tri-clonal Variant), Sin.Ass = Camellia assamica Masters; syn C. sinensis var assamica variety), (FIE-MS) Flow Infusion Electrospray Ionisation Mass Spectrometry, (HILIC) Hydrophilic interaction liquid chromatography, (RF) random forest, (MDS) multi-dimensional scaling plot.

References

  1. Huda, H.-S.-A.; Majid, N.B.A.; Chen, Y.; Adnan, M.; Ashraf, S.A.; Roszko, M.; Bryła, M.; Kieliszek, M.; Sasidharan, S. Exploring the ancient roots and modern global brews of tea and herbal beverages: A comprehensive review of origins, types, health benefits, market dynamics, and future trends. Food Sci. Nutr. 2024, 12, 6938–6955. [Google Scholar] [CrossRef]
  2. Samanta, S. Potential Bioactive Components and Health Promotional Benefits of Tea (Camellia sinensis). J. Am. Nutr. Assoc. 2022, 41, 65–93. [Google Scholar] [CrossRef] [PubMed]
  3. Cabrera, C.; Artacho, R.; Giménez, R. Beneficial effects of green tea—A review. J. Am. Coll. Nutr. 2006, 25, 79–99. [Google Scholar] [CrossRef]
  4. Chen, L.; Zhang, S.; Feng, Y.; Jiang, Y.; Yuan, H.; Shan, X.; Zhang, Q.; Niu, L.; Wang, S.; Zhou, Q.; et al. Seasonal variation in non-volatile flavor substances of fresh tea leaves (Camellia sinensis) by integrated lipidomics and metabolomics using UHPLC-Q-Exactive mass spectrometry. Food Chem. 2025, 462, 140986. [Google Scholar] [CrossRef]
  5. Tang, H.; Zhang, M.; Liu, J.; Cai, J. Metabolomic and Transcriptomic Analyses Reveal the Characteristics of Tea Flavonoids and Caffeine Accumulation and Regulation between Chinese Varieties (Camellia sinensis var. sinensis) and Assam Varieties (C. sinensis var. assamica). Genes 2022, 13, 1994. [Google Scholar] [CrossRef]
  6. Zou, D.; Yin, X.-L.; Gu, H.-W.; Peng, Z.-X.; Ding, B.; Li, Z.; Hu, X.-C.; Long, W.; Fu, H.; She, Y. Insight into the effect of cultivar and altitude on the identification of EnshiYulu tea grade in untargeted metabolomics analysis. Food Chem. 2024, 436, 137768. [Google Scholar] [CrossRef] [PubMed]
  7. Ahmed, S.; Griffin, T.S.; Kraner, D.; Schaffner, M.K.; Sharma, D.; Hazel, M.; Leitch, A.R.; Orians, C.M.; Han, W.; Stepp, J.R.; et al. Environmental Factors Variably Impact Tea Secondary Metabolites in the Context of Climate Change. Front. Plant Sci. 2019, 10, 939. [Google Scholar] [CrossRef]
  8. Li, H.; Song, K.; Zhang, X.; Wang, D.; Dong, S.; Liu, Y.; Yang, L. Application of Multi-Perspectives in Tea Breeding and the Main Directions. Int. J. Mol. Sci. 2023, 24, 12643. [Google Scholar] [CrossRef]
  9. Ma, D.; Pang, Y.; Xie, R.; Luo, J.; Xiao, S.; Wang, J.; Yang, R.; Wang, B. Unveiling metabolite network dynamics during Pu-erh tea storage via non-targeted metabolomics. LWT 2024, 209, 116789. [Google Scholar] [CrossRef]
  10. Aaqil, M.; Peng, C.; Kamal, A.; Nawaz, T.; Zhang, F.; Gong, J. Tea Harvesting and Processing Techniques and Its Effect on Phytochemical Profile and Final Quality of Black Tea: A Review. Foods 2023, 12, 4467. [Google Scholar] [CrossRef]
  11. He, Y.; Zhang, Q.; Inostroza, A.C.; Kierszniowska, S.; Liu, L.; Li, Y.; Ruan, J. Application of metabolic fingerprinting in tea quality evaluation. Food Control 2024, 160, 110361. [Google Scholar] [CrossRef]
  12. Draper, J.; Lloyd, A.J.; Goodacre, R.; Beckmann, M. Flow infusion electrospray ionisation mass spectrometry for high throughput, non-targeted metabolite fingerprinting: A review. Metabolomics 2013, 9, 4–29. [Google Scholar] [CrossRef]
  13. Fang, X.; Xue, R.; Xiao, J.; Pu, Q.; Wang, Y.; Yuan, Y.; Liu, B.; Sui, M.; Jiang, G.; Niaz, R.; et al. Effects of different fermentation modes on tea leaves: Revealing the metabolites modification by quasi-targeted metabolomics. Food Biosci. 2024, 62, 105223. [Google Scholar] [CrossRef]
  14. Li, J.; Wang, Y.; Suh, J.H. Multi-omics approach in tea polyphenol research regarding tea plant growth, development and tea processing: Current technologies and perspectives. Food Sci. Hum. Wellness 2022, 11, 524–536. [Google Scholar] [CrossRef]
  15. Lee, J.E.; Lee, B.J.; Chung, J.O.; Kim, H.N.; Kim, E.H.; Jung, S.; Lee, H.; Lee, S.J.; Hong, Y.S. Metabolomic unveiling of a diverse range of green tea (Camellia sinensis) metabolites dependent on geography. Food Chem. 2015, 174, 452–459. [Google Scholar] [CrossRef]
  16. Rubel Mozumder, N.H.M.; Lee, Y.-R.; Hwang, K.H.; Lee, M.-S.; Kim, E.-H.; Hong, Y.-S. Characterization of tea leaf metabolites dependent on tea (Camellia sinensis) plant age through 1H NMR-based metabolomics. Appl. Biol. Chem. 2020, 63, 10. [Google Scholar] [CrossRef]
  17. Patel, M.K.; Pandey, S.; Kumar, M.; Haque, M.I.; Pal, S.; Yadav, N.S. Plants Metabolome Study: Emerging Tools and Techniques. Plants 2021, 10, 2409. [Google Scholar] [CrossRef]
  18. Beckmann, M.; Parker, D.; Enot, D.P.; Duval, E.; Draper, J. High-throughput, nontargeted metabolite fingerprinting using nominal mass flow injection electrospray mass spectrometry. Nat. Protoc. 2008, 3, 486–504. [Google Scholar] [CrossRef] [PubMed]
  19. Finch, J.P.; Wilson, T.; Lyons, L.; Phillips, H.; Beckmann, M.; Draper, J. Spectral binning as an approach to post-acquisition processing of high resolution FIE-MS metabolome fingerprinting data. Metabolomics 2022, 18, 64. [Google Scholar] [CrossRef]
  20. Rawal, H.C.; Borchetia, S.; Rohilla, M.; Mazumder, A.; Gogoi, M.; Patel, P.K.; Ilango, R.V.J.; Das, B.; Mazumder, A.B.; Bandyopadhyay, T.; et al. First chromosome-scale genome of Indian tea (Camellia assamica Masters; syn C. sinensis var assamica) cultivar TV 1 reveals its evolution and domestication of caffeine synthesis. Ind. Crops Prod. 2024, 222, 119992. [Google Scholar] [CrossRef]
  21. Martens, L.; Chambers, M.; Sturm, M.; Kessner, D.; Levander, F.; Shofstahl, J.; Tang, W.H.; Römpp, A.; Neumann, S.; Pizarro, A.D.; et al. mzML—A Community Standard for Mass Spectrometry Data. Mol. Cell. Proteom. 2011, 10, R110.000133. [Google Scholar] [CrossRef] [PubMed]
  22. Chambers, M.C.; Maclean, B.; Burke, R.; Amodei, D.; Ruderman, D.L.; Neumann, S.; Gatto, L.; Fischer, B.; Pratt, B.; Egertson, J.; et al. A Cross-platform Toolkit for Mass Spectrometry and Proteomics. Nat. Biotechnol. 2012, 30, 918–920. [Google Scholar] [CrossRef]
  23. Draper, J.; Enot, D.P.; Parker, D.; Beckmann, M.; Snowdon, S.; Lin, W.; Zubair, H. Metabolite signal identification in accurate mass metabolomics data with MZedDB, an interactive m/z annotation tool utilising predicted ionisation behaviour ‘rules’. BMC Bioinform. 2009, 10, 227. [Google Scholar] [CrossRef]
  24. Beckmann, M.; Lloyd, A.J.; Wilson, T.; Torres, D.P.M.; Goios, A.C.L.; Willis, N.D.; Lyons, L.; Phillips, H.; Mathers, J.C.; Nash, R.J.; et al. Calystegines are Potential Urine Biomarkers for Dietary Exposure to Potato Products. Mol. Nutr. Food Res. 2020, 64, 2000515. [Google Scholar] [CrossRef] [PubMed]
  25. Lloyd, A.J.; Wilson, T.; Willis, N.D.; Lyons, L.; Phillips, H.; Janssen, H.G.; Stiegler, M.; Xie, L.; Tailliart, K.; Beckmann, M.; et al. Developing community-based urine sampling methods to deploy biomarker technology for assessment of dietary exposure. Public Health Nutr. 2020, 23, 3081–3092. [Google Scholar] [CrossRef]
  26. Djoumbou Feunang, Y.; Eisner, R.; Knox, C.; Chepelev, L.; Hastings, J.; Owen, G.; Fahy, E.; Steinbeck, C.; Subramanian, S.; Bolton, E.; et al. ClassyFire: Automated chemical classification with a comprehensive, computable taxonomy. J. Cheminform. 2016, 8, 61. [Google Scholar] [CrossRef]
  27. Picart-Armada, S.; Fernández-Albert, F.; Vinaixa, M.; Rodríguez, M.A.; Aivio, S.; Stracker, T.H.; Yanes, O.; Perera-Lluna, A. Null diffusion-based enrichment for metabolomics data. PLoS ONE 2017, 12, e0189012. [Google Scholar] [CrossRef] [PubMed]
  28. Picart-Armada, S.; Fernández-Albert, F.; Vinaixa, M.; Yanes, O.; Perera-Lluna, A. FELLA: An R package to enrich metabolomics data. BMC Bioinform. 2018, 19, 538. [Google Scholar] [CrossRef]
  29. Piyasena, K.N.P.; Hettiarachchi, L.S.K.; Jayawardhane, S.A.D.P.S.; Edirisinghe, E.N.U.; Jayasinghe, W.S. Evaluation of inherent fructose, glucose and sucrose concentrations in tea leaves (Camellia sinensis L.) and in black tea. Appl. Food Res. 2022, 2, 100100. [Google Scholar] [CrossRef]
  30. Gong, A.-D.; Lian, S.-B.; Wu, N.-N.; Zhou, Y.-J.; Zhao, S.-Q.; Zhang, L.-M.; Cheng, L.; Yuan, H.-Y. Integrated transcriptomics and metabolomics analysis of catechins, caffeine and theanine biosynthesis in tea plant (Camellia sinensis) over the course of seasons. BMC Plant Biol. 2020, 20, 294. [Google Scholar] [CrossRef]
  31. Fu, Z.; Chen, L.; Zhou, S.; Hong, Y.; Zhang, X.; Chen, H. Analysis of differences in the accumulation of tea compounds under various processing techniques, geographical origins, and harvesting seasons. Food Chem. 2024, 430, 137000. [Google Scholar] [CrossRef]
  32. Wen, M.; Zhu, M.; Han, Z.; Ho, C.T.; Granato, D.; Zhang, L. Comprehensive applications of metabolomics on tea science and technology: Opportunities, hurdles, and perspectives. Compr. Rev. Food Sci. Food Saf. 2023, 22, 4890–4924. [Google Scholar] [CrossRef]
  33. Su, S.; Long, P.; Zhang, Q.; Wen, M.; Han, Z.; Zhou, F.; Ke, J.; Wan, X.; Ho, C.-T.; Zhang, L. Chemical, sensory and biological variations of black tea under different drying temperatures. Food Chem. 2024, 446, 138827. [Google Scholar] [CrossRef] [PubMed]
  34. Lloyd, A.J.; Finch, J.; Warren-Walker, A.; Watson, A.; Lyons, L.; Martin, P.M.; Wilson, T.; Beckmann, M. Chemical attributes of UK grown tea and identifying health-promoting chemistry in tea after different processing methods using metabolomics and machine learning. Metabolomics 2025, Submitted. [Google Scholar]
  35. Catchpole, G.S.; Beckmann, M.; Enot, D.P.; Mondhe, M.; Zywicki, B.; Taylor, J.; Hardy, N.; Smith, A.; King, R.D.; Kell, D.B.; et al. Hierarchical metabolomics demonstrates substantial compositional similarity between genetically modified and conventional potato crops. Proc. Natl. Acad. Sci. USA 2005, 102, 14458–14462. [Google Scholar] [CrossRef]
  36. Enot, D.P.; Lin, W.; Beckmann, M.; Parker, D.; Overy, D.P.; Draper, J. Preprocessing, classification modeling and feature selection using flow injection electrospray mass spectrometry metabolite fingerprint data. Nat. Protoc. 2008, 3, 446–470. [Google Scholar] [CrossRef]
Figure 1. Consensus structural classes of assigned molecular formulas in tea samples. This Sankey plot illustrates the distribution of m/z features into consensus structural classes based on assigned molecular formulas in tea metabolomic data. Each bar represents the frequency of m/z features classified under the respective structural class. Grey bars denote the proportional contributions to the overall sample composition. Structural classes were derived using the ClassyFire database based on a 66% consensus threshold.
Metabolites 15 00052 g001
Figure 2. The difference of the Georgian tea variety field samples between the gardens. Multi-dimensional scaling plot of field sample metabolite similarity scores (proximity) from a random forest classification model. Where the eclipse shows the 95% confidence interval for each variety, estimated using the multivariate normal distribution.
Metabolites 15 00052 g002
Figure 3. Density distributions of interclass distances between samples of the Georgian tea plants, taken from different gardens. Where interclass distance based on the sample proximity values from a multinomial random classification model, supervised by garden.
Metabolites 15 00052 g003
Figure 4. The similarity of tea varieties based on metabolomic fingerprinting. Where similarity based on supervised random forest classification margin values of binary comparisons between each of the tea varieties.
Metabolites 15 00052 g004
Figure 5. Intraclass variability in tea metabolites across tea varieties. Multi-dimensional scaling plot of field samples similarity (proximity) from a multinominal random forest classification model. Where the eclipse shows the 95% confidence interval for each variety, estimated using the multivariate normal distribution.
Metabolites 15 00052 g005
Figure 6. Clusters of explanatory m/z feature trends across the sampling time points in Camellia sinensis var. assamica using k-means clustering. Where the abundance radios were calculated using the m/z feature median values relative to the 09:00 sampling time point. The clusters were identified using k-means clustering. Cluster averages are shown in red.
Metabolites 15 00052 g006
Figure 7. Temporal variation of sucrose abundance in Camellia sinensis var. assamica. Box plot showing the relative abundance of sucrose [M-H] across different time points in Camellia sinensis var. assamica. Data were normalised and log2 transformed. The box represents the interquartile range (IQR), with the median indicated by a horizontal line. Whiskers denote 1.5 times the IQR and dots represent outliers.
Metabolites 15 00052 g007
Table 1. Functional enrichment analysis was performed on each of the clusters to potentially derive both biochemical pathways and biological functions related to the cluster trends.
ClusterKEGG idKEGG Namep-Score
1csin00020Citrate cycle (TCA cycle)0.0000
1csin00040Pentose and glucuronate interconversions0.0000
1csin00053Ascorbate and aldarate metabolism0.0000
1csin00500Starch and sucrose metabolism0.0000
1csin00600Sphingolipid metabolism0.0000
1csin00603Glycosphingolipid biosynthesis0.0000
1csin00660C5-Branched dibasic acid metabolism0.0000
1csin00760Nicotinate and nicotinamide metabolism0.0000
1csin02010ABC transporters0.0000
1csin04016MAPK signaling pathway0.0000
3csin00030Pentose phosphate pathway0.0472
3csin00040Pentose and glucuronate interconversions0.0054
3csin00240Pyrimidine metabolism0.0110
3csin00250Alanine, aspartate and glutamate metabolism0.0000
3csin00280Valine, leucine and isoleucine degradation0.0000
3csin00330Arginine and proline metabolism0.0001
3csin00410beta-Alanine metabolism0.0001
3csin00470D-Amino acid metabolism0.0408
3csin00511Other glycan degradation0.0394
3csin00561Glycerolipid metabolism0.0000
3csin00620Pyruvate metabolism0.0000
3csin00670One carbon pool by folate0.0000
3csin00740Riboflavin metabolism0.0000
3csin00970Aminoacyl-tRNA biosynthesis0.0000
3csin01200Carbon metabolism0.0000
3csin04148Efferocytosis0.0000
4csin00941Flavonoid biosynthesis0.0000
4csin00999Biosynthesis of various plant secondary metab...0.0001
5csin00030Pentose phosphate pathway0.0000
5csin00040Pentose and glucuronate interconversions0.0000
5csin00053Ascorbate and aldarate metabolism0.0000
5csin00250Alanine, aspartate and glutamate metabolism0.0000
5csin00270Cysteine and methionine metabolism0.0000
5csin00290Valine, leucine and isoleucine biosynthesis0.0000
5csin00330Arginine and proline metabolism0.0042
5csin00750Vitamin B6 metabolism0.0000
5csin01230Biosynthesis of amino acids0.0019
5csin04016MAPK signaling pathway0.0000
Table 2. Structural enrichment analysis was performed on each of the clusters to potentially derive both chemical classes and biological functions related to the cluster trends.
ClusterClassificationp-ValueAdjusted p-Value
1Organic compounds0.0000.002
1Organic acids and derivatives0.0020.052
1O-glycosyl compounds0.0030.056
1Carbohydrates and carbohydrate conjugates0.0030.068
1Keto acids and derivatives0.0030.072
1Glycosyl compounds0.0040.078
1Organooxygen compounds0.0100.224
1Organic oxygen compounds0.0100.224
1Tricarboxylic acids and derivatives0.0100.225
1Medium-chain keto acids and derivatives0.0110.246
1Pentoses0.0220.490
1Gamma-keto acids and derivatives0.0220.490
1Carboxylic acids and derivatives0.0250.554
1Alpha amino acids0.0440.969
2Cyclic alcohols and derivatives0.0050.126
2Cyclitols and derivatives0.0050.126
2Quinic acids and derivatives0.0050.126
2Alcohols and polyols0.0050.126
2Organic compounds0.0060.154
2Organooxygen compounds0.0090.227
2Organic oxygen compounds0.0090.227
2Sphingolipids0.0110.286
2Long-chain ceramides0.0110.286
2Ceramides0.0110.286
2Non-metal oxoanionic compounds0.0170.427
2Inorganic compounds0.0170.427
2Non-metal phosphates0.0170.427
2Homogeneous non-metal compounds0.0170.427
2Cinnamic acids and derivatives0.0400.986
2Coumaric acids and derivatives0.0400.986
2Hydroxycinnamic acids and derivatives0.0400.986
3Hydroxy acids and derivatives0.0010.005
3Organic acids and derivatives0.0060.057
3Aspartic acid and derivatives0.0130.132
4No database hits0.0010.009
5Amino acids and derivatives0.0140.206
5Alpha amino acids and derivatives0.0140.206
5Amino acids, peptides, and analogues0.0140.206
5Hydroxy fatty acids0.0190.280
5Aspartic acid and derivatives0.0190.280
5Alpha amino acids0.0250.372
5Fatty Acyls0.0310.463
5Fatty acids and conjugates0.0310.463
5Carboxylic acids and derivatives0.0490.727
Disclaimer/Publisher’s Note: The statements, opinions and data contained in all publications are solely those of the individual author(s) and contributor(s) and not of MDPI and/or the editor(s). MDPI and/or the editor(s) disclaim responsibility for any injury to people or property resulting from any ideas, methods, instructions or products referred to in the content.

