Article

Cosmological Inference from within the Peculiar Local Universe

1
Institut d’Astrophysique de Paris, CNRS, UPMC, 98 bis Bld Arago, 75014 Paris, France
2
Tata Institute of Fundamental Research, Homi Bhabha Road, Mumbai 400005, India
3
Rudolf Peierls Centre for Theoretical Physics, University of Oxford, Parks Road, Oxford OX1 3PU, UK
*
Author to whom correspondence should be addressed.
Universe 2024, 10(5), 209; https://doi.org/10.3390/universe10050209
Submission received: 12 October 2023 / Revised: 23 April 2024 / Accepted: 2 May 2024 / Published: 7 May 2024
(This article belongs to the Special Issue The Large-Scale Structure of the Universe: Theory and Observation)

Abstract

:
The existence of ‘peculiar’ velocities due to the formation of cosmic structure marks a point of discord between the real universe and the usually assumed Friedmann–Lemaítre–Robertson–Walker metric, which accomodates only the smooth Hubble expansion on large scales. In the standard Λ CDM model framework, Type Ia supernovae data are routinely “corrected” for the peculiar velocities of both the observer and the supernova host galaxies relative to the cosmic rest frame, in order to infer evidence for acceleration of the expansion rate from their Hubble diagram. However, observations indicate a strong, coherent local bulk flow that continues outward without decaying out to a redshift z 0.1 , contrary to the Λ CDM expectation. By querying the halo catalogue of the Dark Sky Hubble-volume N-body simulation, we find that an observer placed in an unusual environment like our local universe should see correlations between supernovae in the JLA catalogue that are 2–8 times stronger than seen by a typical or Copernican observer. This accounts for our finding that peculiar velocity corrections have a large impact on the value of the cosmological constant inferred from supernova data. We also demonstrate that local universe-like observers will infer a downward biased value of the clustering parameter S 8 from comparing the density and velocity fields. More realistic modelling of the peculiar local universe is thus essential for correctly interpreting cosmological data.

1. Introduction

The flat Λ CDM ‘standard model’ of cosmology, which has a dominant fraction of its energy density Ω Λ 0.7 in the form of a cosmological constant and a fraction Ω m 0.3 in matter (of which 85 % is cold dark matter and 15 % baryons), is said to be a “good approximation to reality” [1]. It is nevertheless experiencing a crisis due to the significant tension between the value of the present expansion rate H 0 ( 100   h  km s−1 Mpc, h 0.7 ) determined using the ‘cosmic distance ladder’ anchored in the local universe, and the value inferred from the Cosmic Microwave Background (CMB) in the Λ CDM model framework [2]. Another tension is between the growth parameter S 8 = σ 8 ( Ω m / 0.3 ) 0.5 determined from observations of weak gravitational lensing, and from CMB data, where σ 8 is the variance of mass fluctuations in a top-hat sphere of radius 8   h 1  Mpc [3].
In the Λ CDM model, data are interpreted using the Friedmann–Lemaítre equations, obtained from general relativity assuming the Cosmological Principle. In its modern form this assumes statistical isotropy and homogeneity in the distribution of matter and radiation in the ‘cosmic rest frame’ (CRF) in which the CMB dipole, assumed to be of kinematical origin, is presumed to vanish. We have recently shown, however, that the distribution of distant matter as traced by quasars and radio galaxies is not isotropic in the CRF [4,5], thus challenging this foundational assumption of the Friedmann–Lemaítre–Robertson–Walker metric. We have also shown that the acceleration of the Hubble expansion rate inferred from Type Ia supernovae (SNe Ia) is anisotropic in the heliocentric frame, and so cannot be interpreted as due to Λ  [6]. It is likely an artefact [7] because of our being ‘tilted’ observers embedded in a coherent bulk flow, which gives rise to the prominent dipole anisotropy in the CMB. Moreover, the local bulk flow extends out significantly further than is expected in the standard Λ CDM model, and no convergence is seen to the CRF out as far as 200   h 1  Mpc [8]. In this paper, we focus on the impact of this anomaly on the S 8 tension and, more importantly, on the estimation of Ω Λ from SNe Ia data.
The relativistic viewpoint [9] is that such deviations from the Hubble flow should be thought of as variations in the expansion velocity field of the universe, rather than as ‘peculiar velocities’ with respect to a uniformly expanding space of the ‘background cosmology’, which is assumed a priori to be described by the Friedmann–Lemaítre equations. However, it is the latter approach that has become standard in cosmology, in particular for measuring the Hubble expansion rate. SNe Ia data [10], for example, are analysed in the framework of concordance cosmology (e.g., Ref. [11]) by making special relativistic corrections based on models of the local peculiar velocity field. For example, in order to obtain the ‘cosmological’ redshift from the measured value, corrections are made for (non-Hubble) velocities using Equation (1). These are typically a few hundreds of km s−1, so would appear to only be relevant at low redshift z 0.1 . However, they can affect the analysis at higher redshift too, since evidence for accelerated expansion is a dimming of the high-redshift SNe Ia in relation to the low-redshift SNe [12,13]. Moreover, the local velocity field is quite noisy, reflecting our rather inhomogeneous neighbourhood, and it is not clear exactly where the separation should be made between the nearby and distant universe. Various empirical methods for accounting for peculiar velocities have thus been proposed [14]; the above problem has often been circumvented by simply excluding from cosmological fits all the SNe Ia at low redshifts. However this severely deprecates the sample statistics (since about a quarter of all known SNe Ia are in fact very local) and moreover it is somewhat arbitrary, e.g., cuts have been applied at both z = 0.01 and at z = 0.025  [15]. Another option is to allow for an uncorrelated, and somewhat arbitrary, dispersion in the velocities of SNe Ia, e.g., Perlmutter et al. [12] took the redshift uncertainty due to peculiar velocities to be c σ z = 300  km s−1, while Riess et al. [13] used c σ z = 200  km s−1.
The alternative is to correct for the peculiar velocities [16]: for this purpose the IRAS PSCZ catalogue [17], the SMAC catalogue of clusters [14] and the 2M++ catalogue [18] have all been used to infer the peculiar velocity field from the underlying density field. However, these catalogues are rather limited and can be biased; moreover, linear Newtonian perturbation theory is used, hence the extracted velocities are model-dependent. Furthermore, these analyses assume convergence to the CRF at 100   h 1  Mpc, as is expected in the framework of the standard Λ CDM model, even though this is contradicted by many independent observations [8,14,19,20,21,22,23,24]. It is in any case inappropriate to use standard Λ CDM to make such corrections, since the model is itself a subject of the test being carried out.
Specifically, in analyses of the SDSS-II/SNLS3 Joint Lightcurve Analysis (JLA) catalogue of 740 SNe Ia [25], and the subsequent Pantheon catalogue of 1048 SNe Ia (which includes 279 SNe Ia from Pan-STARRS1) [26], the low-redshift SNe Ia have been retained in the cosmological fits by thus “correcting” the individual redshifts and magnitudes of the SNe for the local ‘bulk flow’ inferred from density field surveys out to z 0.04  [14] and z 0.067  [18]. However, as noted by [6], in both analyses SNe Ia immediately outside the survey volume of the peculiar velocity field were arbitrarily assumed to be at rest with respect to the cosmic rest frame, despite the fact that the same surveys detected a bulk flow extending beyond the survey volume of 372 ± 127  km s−1 and 159 ± 23  km s−1, respectively. Moreover the JLA and Pantheon analyses adopted different values of 150 km s−1 and 250 km s−1, respectively, for the dispersion c σ z of the bulk flow velocity.
Moreover the peculiar velocity corrections applied to both JLA and Pantheon contain significant errors and inconsistencies [6,27]. Since the covariance matrices for peculiar velocity corrections have not been provided separately, the impact of these errors on cosmological parameter estimation is hard to quantify. It should also be of concern that the the residual bulk flows of the peculiar velocity surveys align approximately with the directions of maximum hemispherical asymmetry in the sky coverage of the two catalogues.
On the theoretical side, the correlated fluctuations of SNe Ia magnitudes due to peculiar velocities and the impact on cosmological parameter estimation of making such corrections have been extensively studied [16,28,29,30]. However, all these studies assumed that the peculiar velocity statistics are those expected around a typical (aka Copernican) observer in a Λ CDM universe. Such an observer should in fact not observe a bulk flow exceeding ∼200 km s−1 beyond 100  h 1 Mpc ( z 0.033 ), independently of the form of the matter power spectrum [31], so clearly this assumption is in tension with reality. In this work, we use a cosmological N-body simulations to examine the validity of the peculiar velocity covariances proposed by Hui & Greene [29] in the light of additional information about our local universe. Essentially, we account for the cosmic variance due to observer location, which in our specific case is especially rare for a Λ CDM universe—as we quantify below.
The bulk flow observations suggest that we are not typical observers in a Λ CDM universe [32,33,34]. We discuss here the correlated fluctuations of SNe Ia magnitudes and redshifts due to the peculiar velocities and bulk flows in and around ‘Local Universe (LU)-like’ environments in the z = 0 halo catalogue of the DarkSky Λ CDM simulations [35]. We find that previous theoretical predictions [29] for randomly selected typical observers have underestimated the actual covariances for observers like ourselves by a factor of 2–8.
Next we discuss (Section 2) the peculiar velocity corrections employed in JLA [25] and show that these are both arbitrary and incomplete (Section 2.1). We compare the magnitude of the velocities used for the corrections in JLA against those obtained from the Cosmicflows-3 (CF-3) compilation [36] and demonstrate that the JLA values are underestimated by ∼48% on average. We also review the various relevant sources of uncertainties and dispersions that go into the JLA cosmological fits. We then explore (Section 2.2) various methods to fit for the extent of the bulk flow in the LU and present our likelihood analysis (Section 2.3). This is followed by a discussion of related work (Section 4). An Appendix presents the standard methodology of cosmology with SNe Ia (Appendix A), and the JLA catalogue (Appendix B).
We find that for any consistent treatment of the peculiar velocities (including ignoring them altogether), the JLA dataset favours Ω Λ 0.45 and is consistent with a non-accelerating universe at ∼ 2 σ . Larger values of Ω Λ which have been found in other analyses of the JLA catalogue [37,38] are in fact due to the incomplete peculiar velocity “corrections” applied. We demonstrate that, consistent with the recent finding from the Cosmicflows-4 survey [8], the JLA data favour a fast (>250 km s−1) bulk flow extending out to > 200   h 1  Mpc, which is quite unexpected in the standard Λ CDM model.
Subsequently (Section 3), we examine the S 8 parameter inferred by randomly selected Copernican observers as well as constrained ‘Local-Universe like’ observers by comparing the peculiar velocities around them with those expected from the density field. While the variance in S 8 as inferred by Copernican observers is already larger than the disagreement between a recent measurement [39] and the Λ CDM fiducial value from Planck, LU-like observers see both an additional downward bias on S 8 and a larger cosmic variance.

2. Selecting Local Universe Like Environments

Making the usual assumption that the CMB dipole is due to our motion with respect to the CRF (also known as the ‘CMB frame’) in which the universe looks isotropic, so the luminosity distance d L is related to the redshift z as in Equation (A2), the redshift of a supernova in the heliocentric frame z hel (obtained by correcting the actually measured redshift for the Earth’s motion around the Sun) is related to its redshift z in the CMB frame (sometimes labelled z CMB ) as [28]:
1 + z hel = ( 1 + z ) × ( 1 + z SN ) × ( 1 + z ) ,
where z is the redshift induced by our motion with respect to the CMB and z SN is the redshift due to the peculiar motion of supernova host galaxy in the CMB frame. The luminosity distance is similarly corrected as:
d L ( z hel ) = d L ( z ) ( 1 + z ) × ( 1 + z SN ) 2
to obtain d L as a function of z Equation (A2) for the standard Λ CDM model (see Appendix A). The covariance of SNe Ia magnitudes due to peculiar velocities is then given by [28,29,30]:
S i j = δ m i δ m j = 5 ln 10 2 ( 1 + z i ) 2 H ( z i ) d L ( z i ) ( 1 + z j ) 2 H ( z j ) d L ( z j ) ξ i j ,
where
ξ i j = ( v i . n ^ i ) ( v j . n ^ j ) = d D i d τ d D j d τ d k 2 π 2 P ( k , a = 1 )                                                                                                × l ( 2 l + 1 ) j l ( k χ i ) j l ( k χ j ) P l ( n ^ i . n ^ j ) .
Here D i is the linear structure growth factor at the redshift of the i th SNe, j l is the derivative of the l th spherical Bessel function and P l is the Legendre polynomial of order l. Note that according to this expression, the covariance in magnitudes between two SNe depends only on their relative angular separation (which comes in through P l ) and is independent of their absolute directions.
N-body simulations can be used to estimate ξ i j Equation (3) for different assumed observers. Figure 1 compares S i j evaluated using the Λ CDM expectation for ξ i j with that read off the z = 0 snapshot halo catalogue of Dark Sky, a Hubble volume, trillion-particle simulation [35], for two very different classes of observers. For the ‘Copernican observer’ in Figure 1 (left), the halo containing the observer and its orientation are selected at random—such an observer sees the universe as isotropic and homogeneous. However, for the constrained ‘LU-like’ observer’ (right), only halos satisfying the following criteria are considered (the first three being the same as in Ref. [32]):
(i)
The observer halo has a Milky Way (MW)-like mass, in the range 2.2 × 10 11 < M 200 < 1.4 × 10 12 M [40] for the halo mass contained within 200 kpc.
(ii)
The bulk velocity in a sphere of radius R = 3.125   h 1  Mpc centred on the observer is V = 622 ± 150  km s−1
(iii)
A Virgo-cluster like halo of mass M = ( 1.2 ± 0.6 ) × 10 15   h 1 M is present at a distance D = 12 ± 4   h 1  Mpc from the observer.
(iv)
The angle between the bulk flow of (ii) and the direction to the Virgo-like halo of (iii) is ( 44.5 ± 5 )
(v)
The bulk velocity in a sphere of R = 180   h 1  Mpc centered on the observer is 260 ± 100  km s−1 [19].
(vi)
The angle between the bulk flow of (v) and the direction to the Virgo-like halo of (iii) is ( 69.9 ± 7.5 ) .
(vii)
The angle between the bulk flows of (ii) and (v) is ( 35.6 ± 7.5 ) .
Note that such observers are very rare—we had to examine 8,721,498 halos in order to find 1000 that satisfied these criteria. Hence the above probability of 1000/8721498 = 0.0115% is an upper limit on the probability of finding our Local Universe in Λ CDM cosmology. After an observer satisfying the above criteria is found, the entire system is rotated so that the direction of the bulk flow of criterion (ii) and the direction to the Virgo-like halo of criterion (iii) correspond to the real observed directions. The criterion on the bulk flow direction is exact, while the criterion on the direction to the Virgolike halo is imposed only on the azimuthal angle in a coordinate system in which the z-axis points towards the bulk flow direction. Criterion (iv) then suffices to orient the system. Note that the angular tolerances in (iv), (vi), and (vii) are set to be less stringent than actual observational constraints in order to limit the required computation time.
Subsequently, the halos closest to each JLA supernova with z < 0.1 (of which there are 152) are identified in the DarkSky simulation as a proxy for the supernova host galaxy, and their velocities are queried. From these velocities, ξ i j can be calculated for each pair in the set of 152 supernovae. For the typical observer of Figure 1 (left), none of the steps regarding directional orientation discussed above are considered and observers are simply picked at random. As seen in Figure 1 (right), a realistic LU-like observer sees on average correlations between the supernovae of a JLA-like catalogue that are 2–8 times stronger than does a typical observer. This illustrates that the theoretical covariances of Hui & Greene [29], as given in Equation (4), is valid only for idealised observers who see neither a local bulk flow nor a preferred orientation in the sky.

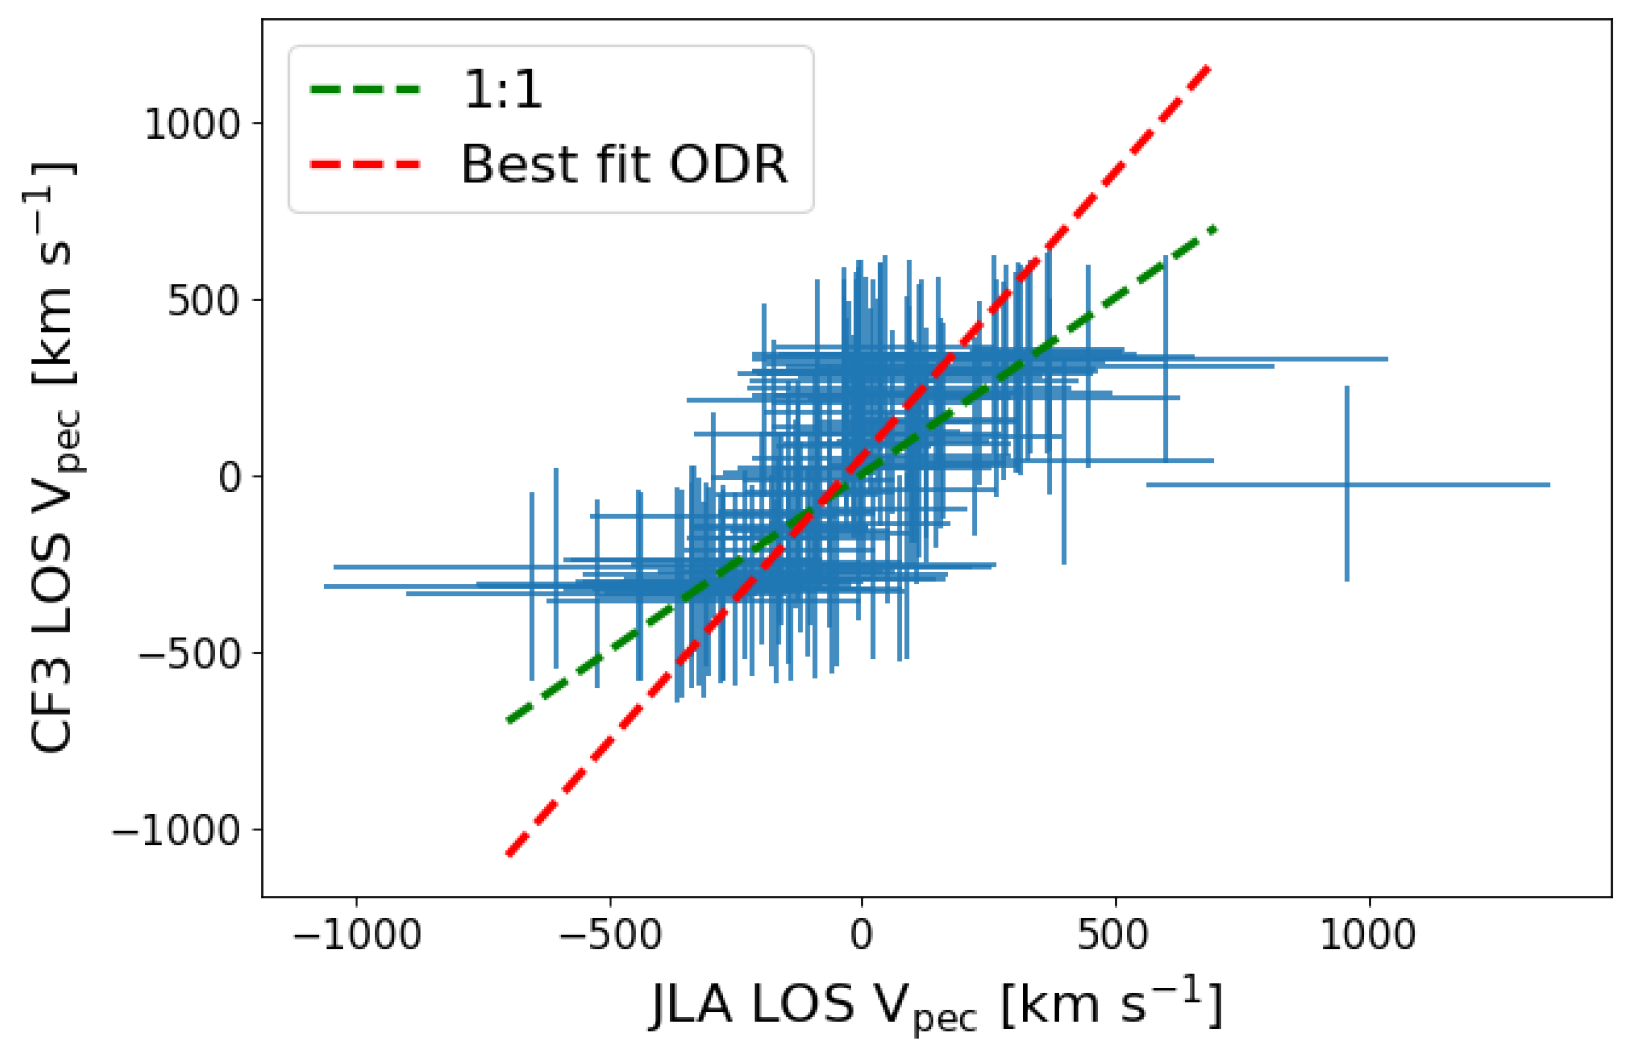
2.1. Peculiar Velocity Corrections in JLA

It had been noted in Ref. [6] that the peculiar velocity ‘corrections’ applied to the SNe Ia redshifts and magnitudes in the JLA catalogue (see Appendix B) are neither consistent nor complete. SNe Ia immediately beyond z 0.06 were taken to be stationary with respect to the CMB and assumed to only have an uncorrelated velocity dispersion c σ z = 150 km s−1 in the cosmological fits, even though observations of clusters indicate a bulk velocity of 372 ± 127 km s−1 due to sources beyond 200   h 1  Mpc [14]. Unlike the intrinsic dispersion σ M 0 which is assumed to be redshift-independent, the dispersion in the magnitudes as a result of the velocity dispersion is 5 σ z / ( z ln 10 ) i.e., the magnitudes of lower redshift supernovae are selectively more dispersed. As seen in Figure 2, the typical bulk flow in a Λ CDM universe (see, e.g., Ref. [41]) continues to much larger distances, with the velocity decreasing gradually. In some environments, the bulk velocity may even increase beyond a certain scale (as seen in the CosmicFlow-4 survey [8]), although the overall trend has to be a decreasing one if the Universe is to become homogeneous when averaged on large scales.
Cosmicflows-3 (CF-3) [36] is a compilation of the peculiar velocities of 17,669 nearby galaxies, using various independent distance estimators such as the Tully-Fisher relationship. In Figure 3, we compare the velocities that have been used to correct the JLA redshifts with those from CF-3. The  galaxy in the CF-3 dataset corresponding to a JLA supernova is identified by cross-matching with a tolerance of 0 . 01 , using the tool k3match. Out of 119 JLA SNe Ia at z CMB < 0.06 , 112 have CF-3 counterparts within 0 . 01 . It is seen from the regression line [42] in Figure 3 that peculiar velocities have been systematically underestimated by 48% in the corrections applied in the JLA analysis [25], compared to the actual measurements by CF-3.

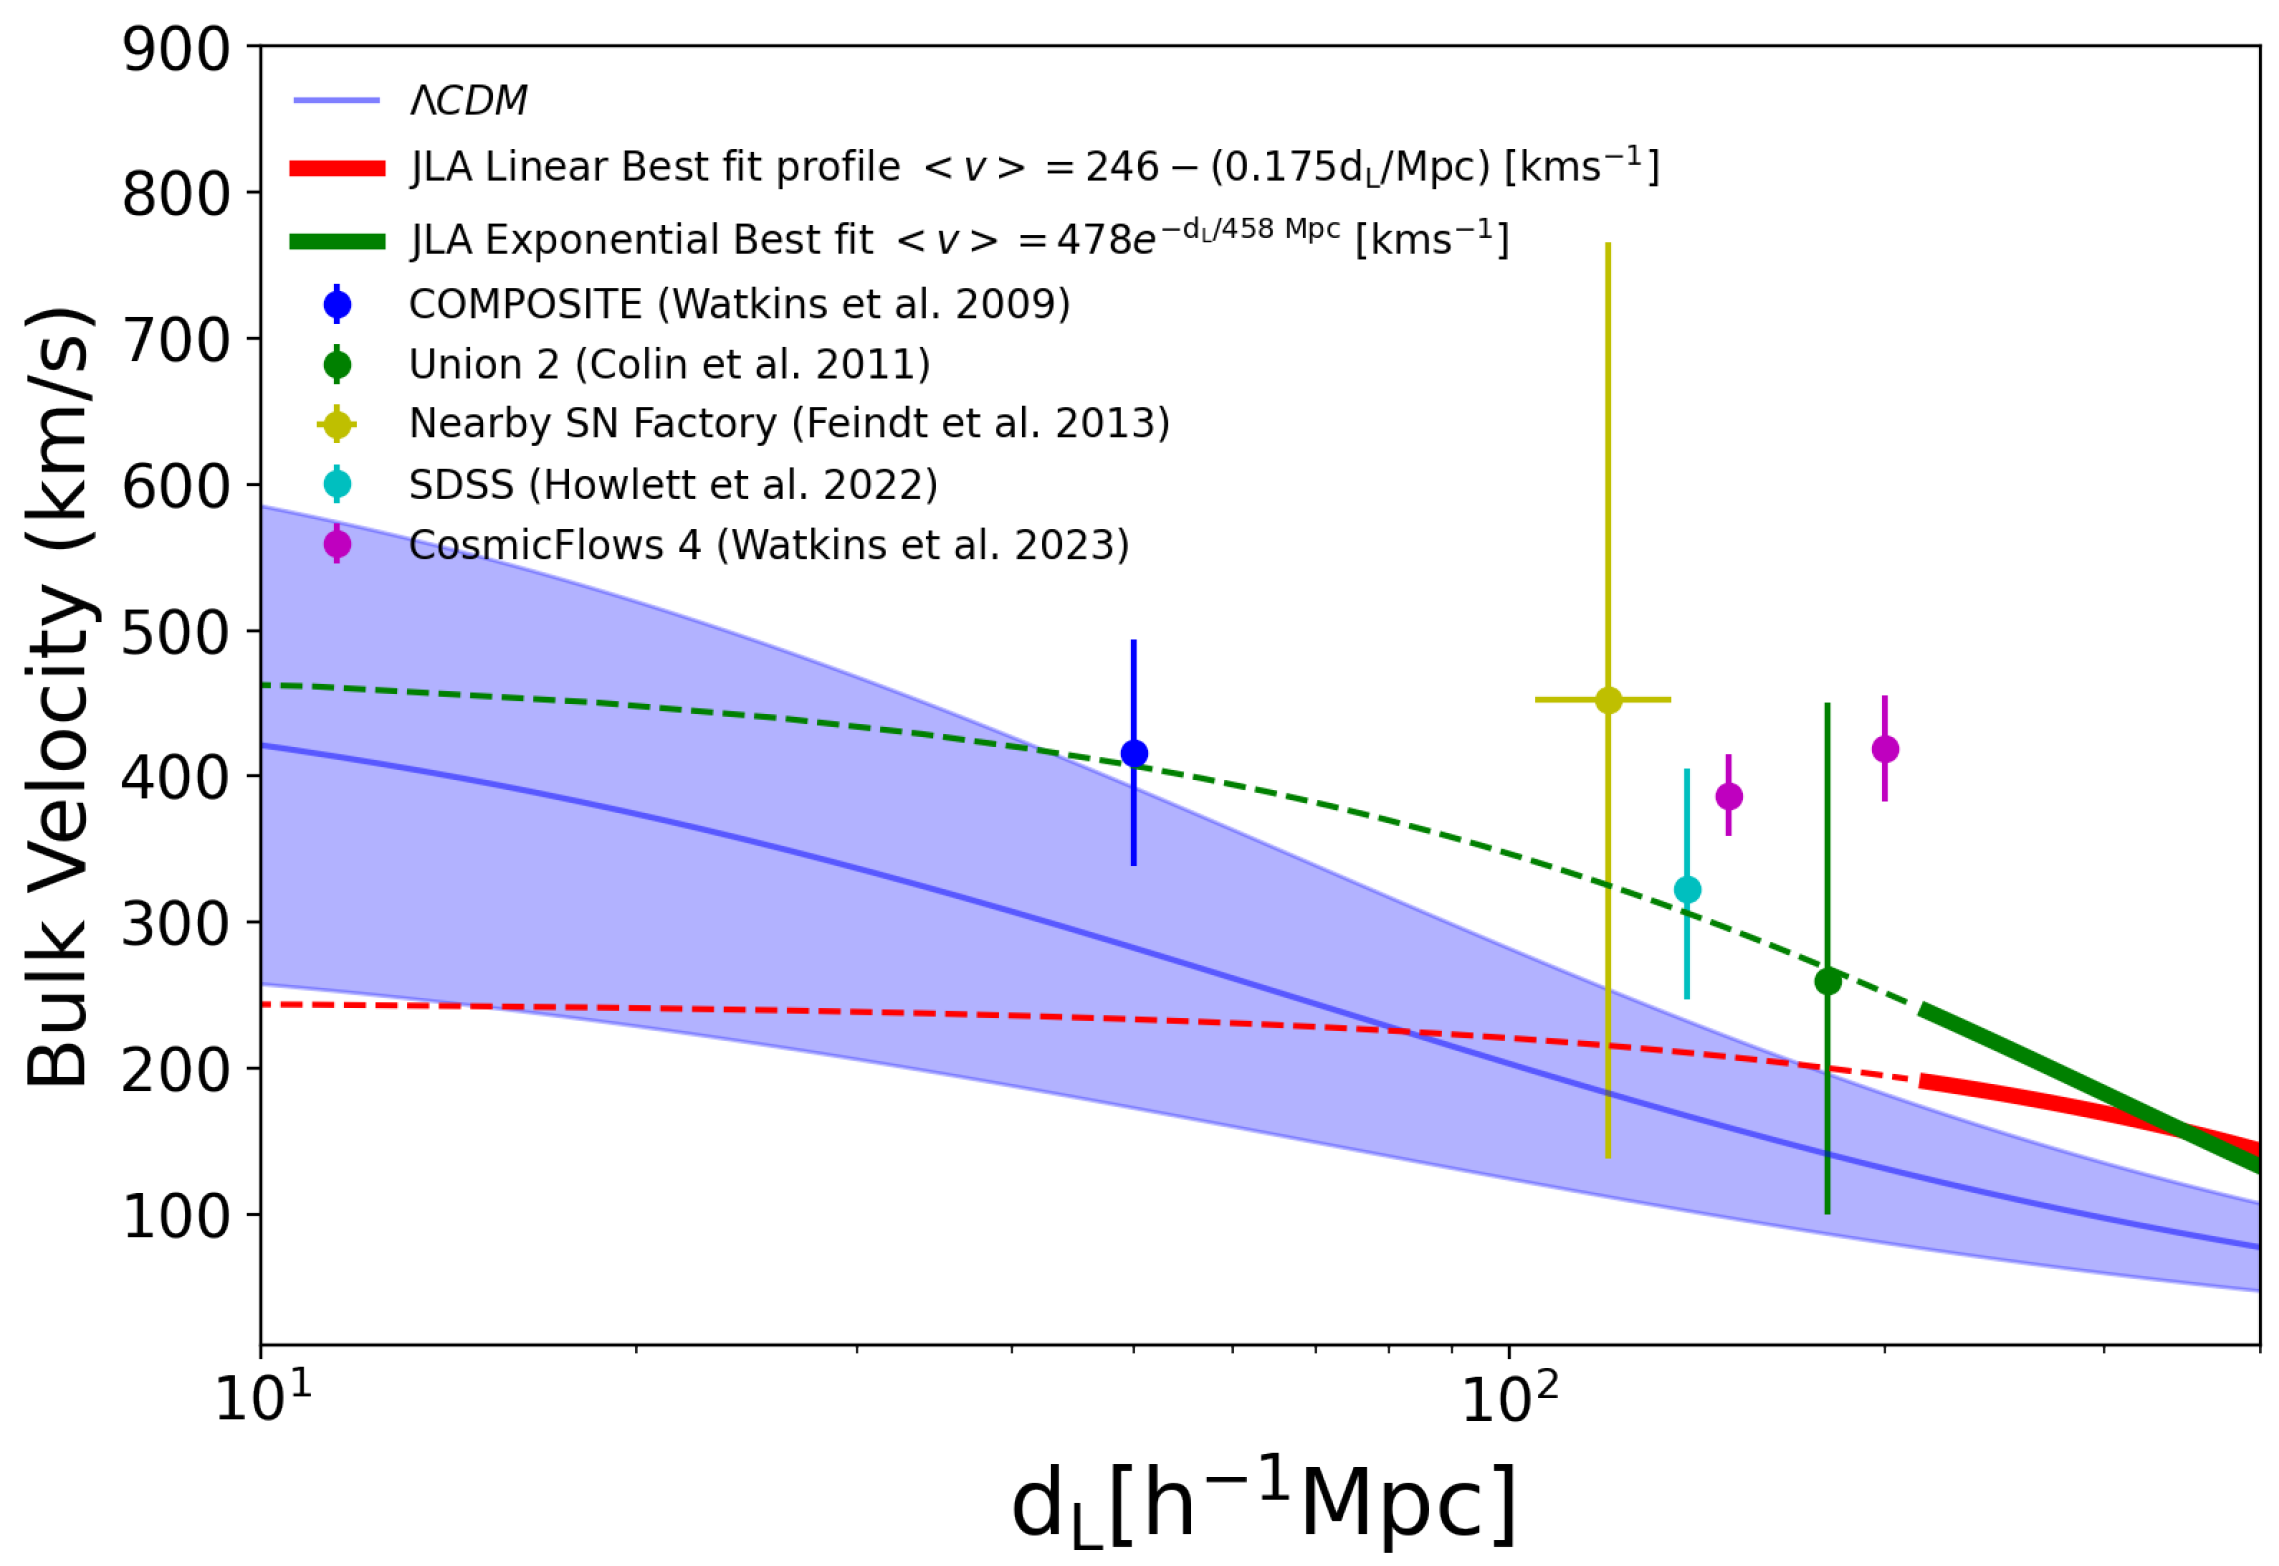
2.2. Fitting for a Bulk Flow

We consider two illustrative profiles for the bulk flow velocity. A linear ∼ 1 / r fall-off is expected if we are, e.g., being pulled by a ‘Great Attractor’:
v = P Q d L ,
where Q is a (dimensionless) scale parameter. We ensure that the velocity never goes negative by setting it to zero above d L = P / Q (see Figure 4). Our unusual bulk flow may however be due to a different physical cause, so we also consider an an exponentially falling form
v = P e d L / Q ,
where Q is the scale of the flow. The free parameters P and Q or Q in our modelling of the bulk flow can be determined along with the 10 other parameters used to fit SNe Ia data.
The effect of a bulk flow term is to modify the distance modulus of Equation (A1) such that:
Δ m bulk ( P , Q , z i ) = 5 ln 10 ( 1 + z i ) 2 H ( z i ) d L ( z i ) n ^ i [ P e d L ( z i ) / Q ] ,
for the exponentially falling bulk flow, and likewise for the linearly falling bulk flow with the expression from Equation (5) now substituted in the square brackets.

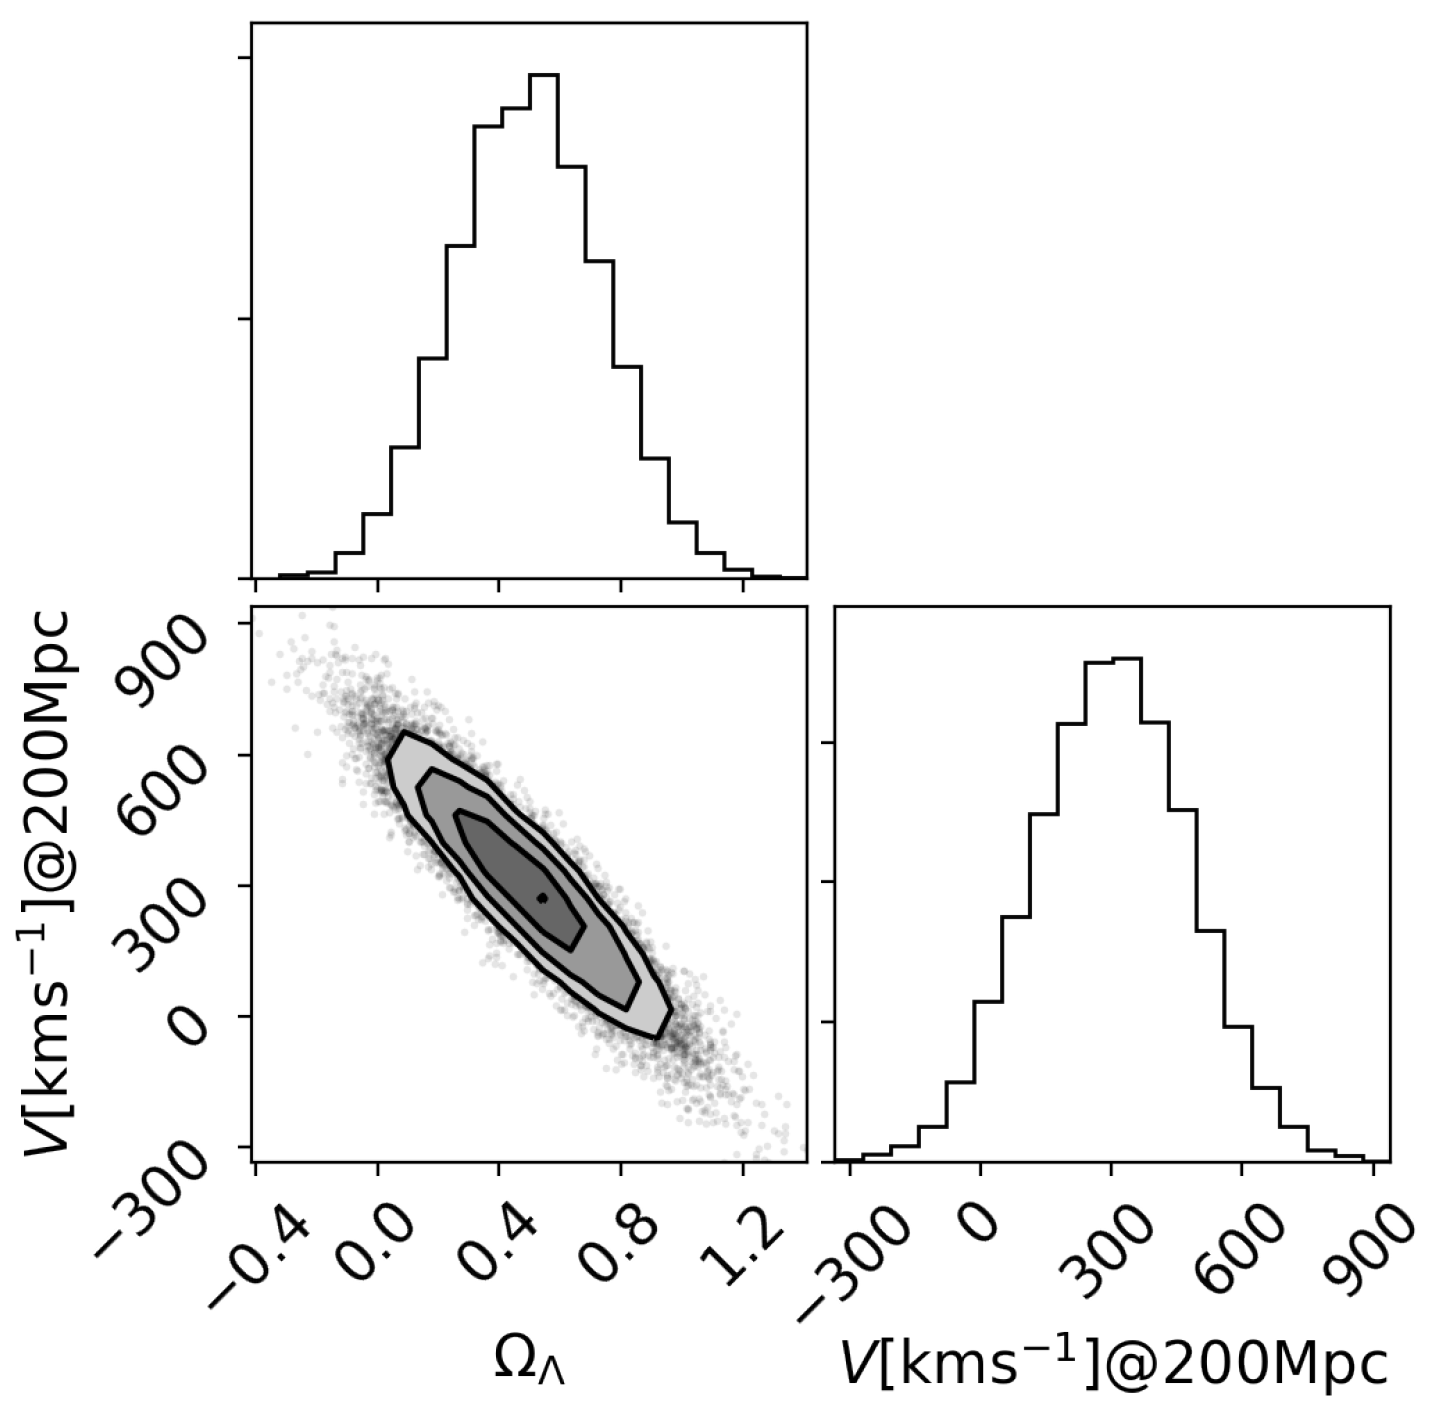
2.3. The Likelihood Analysis

We can now rewrite z SN and z in Equation (1) as functions of z hel , P and Q for the exponential (Equation (6)) or Q for the linear (Equation (5)) bulk flow models, respectively. A MLE [37] is then used with the two additional parameters P and Q (or Q ) for the bulk flow, in addition to the usual light curve fitting parameters in the SALT2 template [25]: α , x 1 , 0 , σ x 1 , 0 , β , c 0 , σ c 0 , M 0 , σ M 0 . Along with the two Λ CDM model parameters Ω m and Ω Λ we then have 12 parameters in total. As shown in Table 1, the following fits are performed (including an additional dispersion of c σ z = 150 km s−1 as recommended by Ref. [25]):
  • The same 10-parameter fit as in Ref. [37], using only the z CMB values provided by JLA.
  • The 10-parameter fit using d L ( z CMB , z hel ) = [ ( 1 + z hel ) / ( 1 + z CMB ) ] d L ( z CMB ) —as used in Ref. [28]—and the JLA provided z hel and z CMB values.
  • The 10-parameter fit as in 1, using only z hel values (JLA provided) as was done in all SNe Ia analyses until 2011.
  • The 10-parameter fit as in 1, using JLA provided z hel values, after subtracting out bias corrections to m B * .
  • Exponentially falling bulk flow: 12-parameter fit (including the P and Q parameters of Equation (6), using only JLA provided z hel values. No peculiar velocity corrections are applied.
  • Linearly falling bulk flow: 12-parameter fit (including the P and Q parameters of Equation (5) using only JLA provided z hel values. No peculiar velocity corrections are applied.
  • JLA-corrected redshifts + Exponential bulk flow: 12-parameter fit: SNe Ia with peculiar velocity corrections applied by JLA, are treated as in (ii) above, while an exponentially falling bulk flow is fitted to the remaining SNe.
  • JLA-corrected redshifts + Linear bulk flow: As in 7, but with the linear parametrisation of the bulk flow.
  • CF-3 data and the exponential bulk flow fit: 12-parameter fit using Equation (2) with the -derived values of z hel and z CMB (see Section 2.1) used for the low z SNe Ia to which the velocity correction can be applied. For the remaining objects, we use the JLA z hel values, and an Exponential bulk flow is fitted using Equation (6) as described above.
  • CF-3 data and the linear bulk flow fit: 12-parameter fit using Equation (5) with the -derived values of z hel and z CMB (see Section 2.1) used for the low z SNe Ia to which the velocity correction can be applied. For the remaining objects, we use the JLA z hel values, and a linear bulk flow is fitted using Equation (5).
In all these fits, the direction of the bulk flow is fixed to be in the CMB dipole direction as most previous analyses have shown large dipoles at intermediate redshifts converging to this direction [19,22,24,34,43]. In Table 1, we also show the fit results after imposing the additional constraint of ‘No acceleration’ for a Λ CDM universe i.e.: q 0 Ω Λ / 2 Ω m = 0 . For the last two fits, we also show the effect of imposing the constraint of zero curvature (‘Flat’): i.e.,  Ω Λ + Ω m = 1 .
The bulk flow fit is v = 478 e d L / 458 Mpc km s 1 for the exponential decay form (6), and  v = [ 246 0.175 ( d L / Mpc ) ] km s 1 for the linearly falling form (5). Including the bulk flow always improves the quality of the fit as can be seen from the smaller values of 2 log L max . This justifies adding the two parameters characterising it. In all the above fits apart from the ‘No acceleration’ ones, the best-fit bulk flow extends beyond 200   h 1  Mpc at 250 km s−1. Figure 4 shows our results along with selected recent observations.
Using the CF-3 data and the linear bulk flow fit, as well as other fits of similar quality, the difference in the goodness of fit of the best model (with the lowest value of 2 log L max ) with respect to the corresponding ‘No acceleration’ fit is now significantly smaller compared to previous studies. Figure 5 demonstrates the degeneracy between the derived value of Ω Λ and the local bulk flow, illustrating that the latter is an essential nuisance parameter to be added to cosmological fits when analysing SNe Ia. Allowing for the bulk flow in the fit demonstrates that the evidence for acceleration using SNe Ia data alone is even weaker than was found previously [37].
Table 1. Best-fit parameters and results for the fits described in Section 2.3 using the Maximum Likelihood Estimator [44]. Including the bulk flow improves the quality of the fit and decreases the significance of accelerated expansion, as seen from the decrease of 2 log L max . “No acceleration” corresponds to Ω Λ = Ω m / 2 .
Fit−2 log L max Ω m Ω Λ α x 1 , 0 σ x 1 , 0 β c 0 σ c 0 M 0 σ M 0 V (km s−1)
@ 200   h 1 Mpc
1.As in Ref. [37]−214.970.3410.5690.1340.03850.9313.059−0.0160.071−19.0520.108-
No acceleration−203.930.0680.0340.1320.03270.9323.045−0.0130.071−19.0060.110-
2.[37] + JLA z−221.930.3400.5650.1330.03850.9323.056−0.0160.071−19.0510.107-
No acceleration−210.990.0700.0350.1310.03280.9323.042−0.0130.071−19.0060.109-
3.No pec. vel. corr. to z−215.400.2850.4830.1340.03980.9323.038−0.0160.071−19.0510.108-
No acceleration−207.670.0510.0250.1320.03480.9323.023−0.0140.071−19.0120.110-
4.No pec. vel. corr. to z or m B −216.890.2350.3960.1350.03970.9323.029−0.0160.071−19.0400.109-
No acceleration−211.840.04130.0210.1330.03570.9323.016−0.0140.071−19.0080.110-
5.Exponential bulk flow−217.510.2890.4520.1340.03900.9323.036−0.0160.071−19.0370.107253
No acceleration−211.30.0770.0390.1320.03470.9323.024−0.0140.071−19.0020.108292
6.Linear bulk flow−217.470.2900.4550.1340.03900.9323.036−0.0160.071−19.0380.107265
No acceleration−211.990.0820.0410.1320.03470.9323.025−0.0140.071−19.0020.108282
7.JLA + Exp. bulk flow−224.870.3400.5700.1330.03870.9323.051−0.0160.072−19.0520.107271
No acceleration−216.30.0770.0390.1320.03470.9323.024−0.0140.071−19.0020.108295
8.JLA + Lin. bulk flow−225.080.3410.5770.1330.03870.9323.050−0.0160.071−19.0540.107238
No acceleration−214.140.0720.0360.1310.03280.9323.041−0.0130.071−19.0050.109251
9.+ Exp. Bulk Flow−225.610.2790.4270.1330.03860.9323.001−0.0160.071−19.0340.109309
No acceleration−220.720.0860.0430.1320.03460.9322.990−0.0150.071−19.0010.110398
Flat−223.960.3930.6070.1330.03570.9332.998−0.0160.071−19.0450.110338
10.+ Lin. bulk flow−225.730.2770.4310.1330.03860.9323.002−0.0160.071−19.0370.109211
No acceleration−220.160.0850.0420.1320.03460.9322.991−0.0150.071−19.0010.110249
Flat−224.180.3900.6100.1340.03990.9323.006−0.0160.071−19.0470.109215
The results in Table 1 may be summarised as follows:
  • Of all the fits, the only ones favouring Ω Λ > 0.5 are just those that include the incorrect and incomplete peculiar velocity ‘corrections’ of JLA [25].
  • Fit 4, which has no peculiar velocity corrections at all, as in the cosmic acceleration discovery papers [12] and [13], prefers Ω Λ = 0.396 with < 2 σ evidence for acceleration.
  • While previous work has suggested that bulk flows should not bias Ω Λ , it in fact drops by ∼ 30 % if we undo the peculiar velocity ‘corrections’ of JLA and instead use the kinematic data from. This illustrates the huge impact of considering a realistic LU-like observer such as ourselves, rather than the randomly located observer assumed in all previous analyses [16,28,29,30]. In particular this contradicts what is stated in Table 11 of Ref. [25].
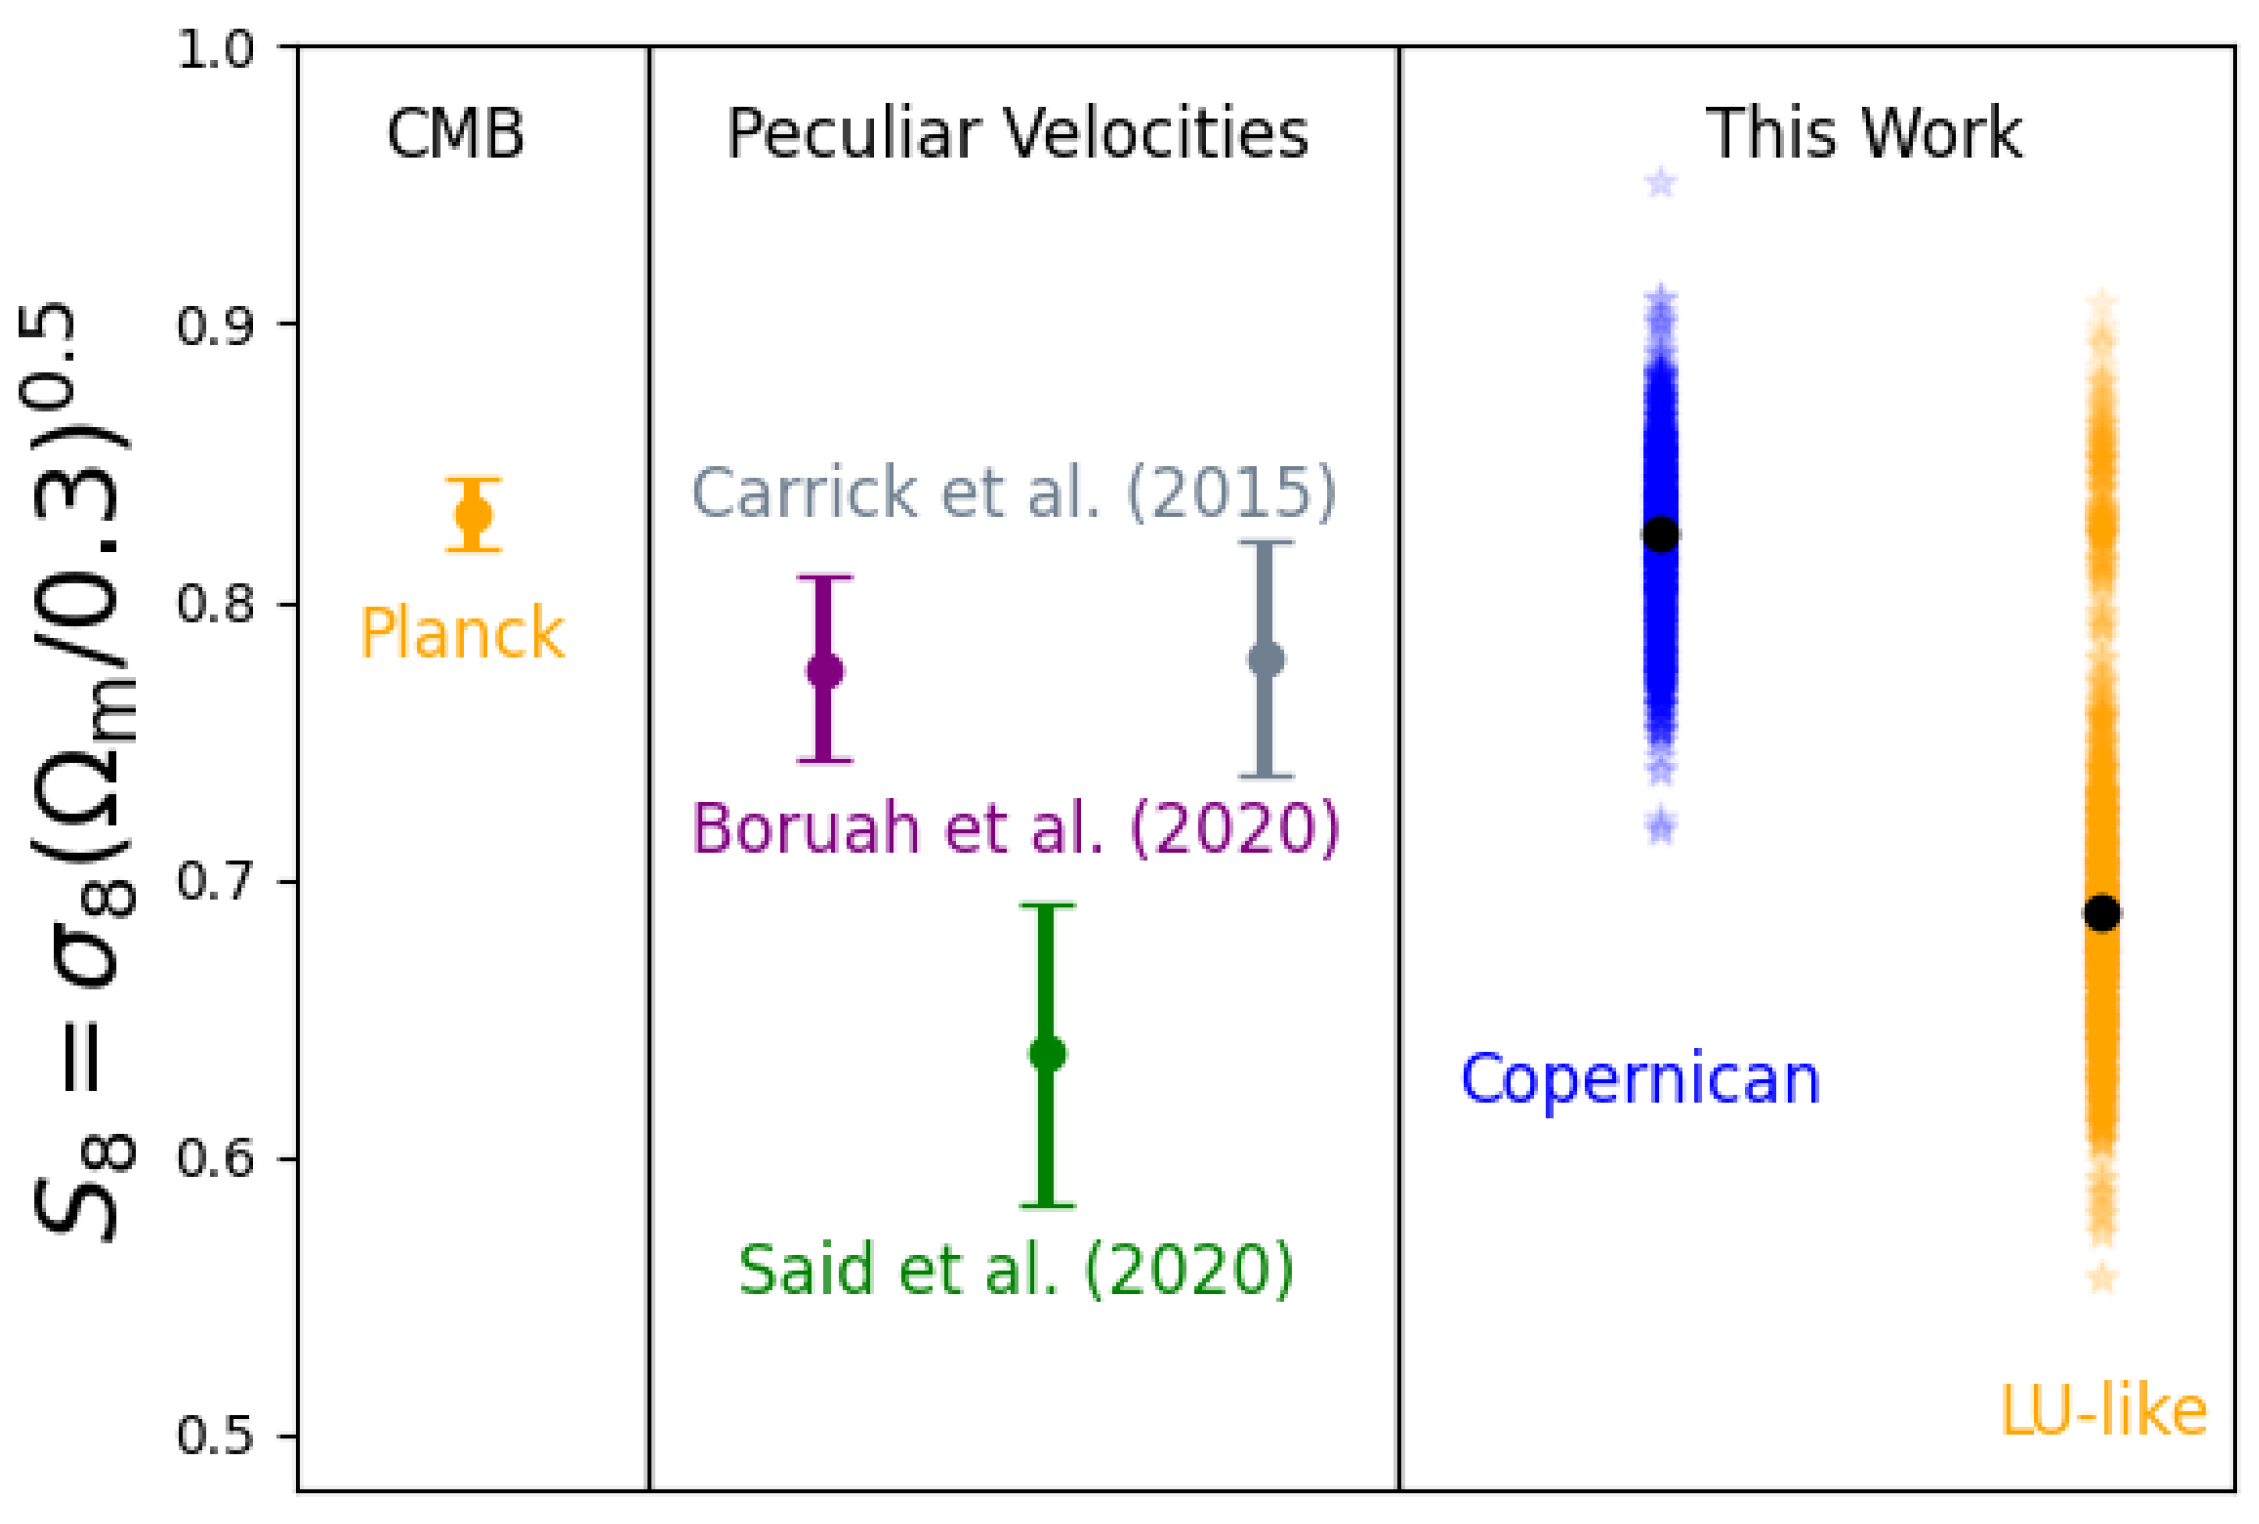
The discovery papers [12,13] assumed the uncertainty due to peculiar velocities to be c σ z = 300  km s−1 and 200 km s−1 respectively, but neither made SN-by-SN corrections. The JLA [25] and Pantheon [26] analyses employ incorrect peculiar velocity ‘corrections’, and adopt arbitrary redshift uncertainties of c σ z = 150  km s−1 and 250 km s−1, respectively.

3. Extracting S8

The peculiar velocity field v ( r ) is defined as
v ( r ) = H 0 f ( Ω m ) 4 π d 3 r δ ( r ) ( r r ) | r r | 3 ,
where f ( Ω m ) is the logarithmic growth rate of fluctuations (≃ Ω m 0.55 in the Λ CDM model) and δ ( r ) is the matter density contrast field:
δ ( r ) = ρ ( r ) ρ ¯ ρ ¯ .
The density in the above equation is that of gravitating matter, which is dominated by unobservable dark matter in the standard paradigm. It is usually assumed that observed luminous objects trace out the underlying matter density contrast with only linear bias
δ g = b g δ
where b g and δ g are the bias and the density fluctuation field of the tracers, respectively. The predicted peculiar velocity field
v pred ( r ) = H 0 4 π d 3 r δ t ( r ) ( r r ) | r r | 3
can now be compared to the ‘observed’ (in the case of the present study, simulated) to estimate the term β t
β t = v t v pred
for the tracer t   [39,45]. Thus, β t can be obtained by fitting a large number of measured tracer velocities against the predictions from the density field. For straightforward comparison with results from weak lensing, we convert this, as in Ref. [39], to  S 8 σ 8 ( Ω m / 0.3 ) 0.5 , using the input value of Ω m = 0.2952 used for the Dark Sky simulations.
In practice, the observational tracers used to map the velocity field need not be the same as are used to map the density field; in fact they usually are not [39]. However, since our aim is to study the effect of the local environment on velocity–density correlations, we use the same tracers for both, viz. the halos (we use halos rather than particles since the z = 0 halo catalogue of Dark Sky is computationally more tractable than the z = 0 particle snapshot). In order to keep our study as similar as possible to Ref. [45] we use a Gaussian kernel with a smoothing length of 5 h 1 Mpc to smooth out the density fluctuation field.
It is evident from Figure 6 that there is a downward bias in measurements of S 8 by Local Universe-like observers such as ourselves and the cosmic variance is also higher. This may well account for the tension between the value derived from Planck data, and that obtained by comparing the reconstructed velocity field from the 2M++ galaxy redshift compilation to supernovae, Fundamental Plane and Tully–Fisher distances [18,39,46].

4. Discussion

Other authors [30,47] have come to different conclusions regarding the impact of the bulk flow on cosmological parameter determination, so we comment on why this is so. In general relativity, space–time evolves according to the Einstein field equations, but for simplicity and tractability, structure formation is studied by linearising these around the maximally symmetric FLRW solution. By further making restricted ‘gauge’ choices [48], cosmological reality is simulated using Newtonian N-body simulations wherein there is a background space that expands homogeneously and isotropically, governed by just one scale factor, while density perturbations evolve around this background according to Newtonian gravity. However, solutions to the linearised field equations can only be linearisations of the solutions to the fully non-linear equations [49,50]; hence, this approach hides known physical phenomena. Indeed, a relativistic universe exhibits locally inhomogeneous expansion beyond that evident in linear perturbation theory around a maximally symmetric background [51]. It was therefore proposed to consider the expansion of the universe at late times as an average effect, arising out of the coarse-graining of physics at smaller scales [52]. Peculiar velocities are thus at the interface between the real universe and its idealisation modelled by first-order perturbation of the fluid equations or in a Newtonian N-body simulation. Note that in the real universe, peculiar velocities are differences in the expansion rate of the universe at different space–time points, while in an N-body simulation they arise by construction from Newtonian gravity acting on top of a hypothetical uniformly expanding space. Refs. [29,30] use the restricted longitudinal or conformal-Newtonian ‘gauge’ [48] to derive the covariance (Equation 3) for a typical observer. But, as Figure 1 shows, this would be relevant for cosmology only if each SNe Ia were being observed from a different, randomly sampled, host galaxy. In practice we observe the real universe from only one unique vantage point. Nevertheless, Ref. [30] adds this covariance as a “guaranteed theoretical signal” to the uncertainty budget of the JLA data, thus weakening the preference for a bulk flow to ≲ 2 σ (as seen in their Figure 4).
Ref. [47] claims further that any bias in the inference of dark energy parameters due to the effect of peculiar velocities can be determined a priori via simulations. This misses the point, however, that Λ CDM is a model and N-body simulations contain only as much physics as have been coded into them, i.e., neither capture the real universe. In fact Ref. [47] acknowledges that ignoring the velocity covariance altogether would lead to larger effects due to peculiar velocities—just as we have established here.

5. Conclusions

To summarise, we are not typical (Copernican) observers— we are embedded in a fast and deep bulk flow and this has significant impact on the covariances used in supernova cosmology.1 We have studied the effect on SNe Ia redshifts in the JLA catalogue of the peculiar velocities of their host galaxies. Using direct measurements of these from Cosmicflows-3, we find that the effect of peculiar velocities for low redshift SNe Ia has been underestimated by 48%. We show that the usual procedure of adding a constant velocity dispersion of a few hundred km s−1 to account for peculiar velocities at high redshift does not take into account the correlated flow of the galaxies. By analysing the DarkSky simulation [35], we demonstrate that ‘Local universe-like’ observers like ourselves see a 2–8 times stronger correlation between the SNe Ia than a randomly located observer does. The JLA analysis [25] corrected the data assuming the CMB dipole to be entirely kinematic in origin and that convergence to the CMB rest frame occurs abruptly at redshift z 0.06 . Since neither assumption is fully supported by observations, we have adopted a general model of the bulk flow which introduces two additional parameters in the analysis. We do not adopt the Λ CDM model a priori, nor do we make assumptions about the origin of the CMB dipole. This provides an independent estimate of the bulk flow and we find that it persists out to distances beyond 200  h 1 Mpc, with a speed of ∼250 km s−1. Our maximum likelihood analysis then shows that the accelerated expansion of the universe cannot be inferred as a statistically significant result from the SNe Ia data alone.

Author Contributions

All authors have contributed to all stages of this work, and read and agreed to the published version of the manuscript.

Funding

This research received no external funding.

Data Availability Statement

No new data were created or analyzed in this study. Data sharing is not applicable to this article.

Conflicts of Interest

The authors declare no conflicts of interest.

Appendix A. Supernova Cosmology

The largest public catalogues of SNe Ia lightcurves, the JLA [25] and its successor Pantheon [26], employ the ‘Spectral Adaptive Lightcurve Template 2’ (SALT2) to fit each SNe Ia light curve with 3 parameters: the apparent magnitude m B * (at maximum in the rest frame ‘B-band’) and the ‘shape’ and ‘colour’ corrections, x 1 and c [53] (a ‘host galaxy mass correction’ may also be included, however the MLE is insensitive to this parameter [44]). The distance modulus is then
μ SN = m B M + α x 1 β c ,
where α and β are assumed to be constants, as is M the absolute SNe Ia magnitude, as befits a ‘standard candle’. In the standard Λ CDM cosmological model, this is related to the luminosity distance d L as
μ 25 + 5 log 10 ( d L / Mpc ) , where : d L = ( 1 + z ) d H Ω k sin Ω k 0 z H 0 d z H ( z ) , for Ω k > 0 = ( 1 + z ) d H 0 z H 0 d z H ( z ) , for Ω k = 0 = ( 1 + z ) d H Ω k sinh Ω k 0 z H 0 d z H ( z ) , for Ω k < 0 d H = c / H 0 3000   h 1 Mpc , H 0 100   h km s 1 Mpc 1 , H = H 0 Ω m ( 1 + z ) 3 + Ω k ( 1 + z ) 2 + Ω Λ .
Here, H, the Hubble parameter ( H 0 being its present value), d H is the ‘Hubble distance’ and Ω m , Ω Λ , Ω k are the matter, cosmological constant and curvature densities in units of the critical density. In the standard Λ CDM model, these are related by the ‘cosmic sum rule’: 1 = Ω m + Ω Λ + Ω k , which is simply rewriting the Friedmann equation.
Thus, knowing the redshift and distance of the ‘standardised’ SNe Ia, one can determine the cosmological parameters. However these are measured from Earth and usually quoted in the heliocentric frame (allowing for the Earth’s motion around the Sun), so they need to first be translated to the reference frame in which the universe is (statistically) isotropic and homogeneous and the above equations hold. Assuming that the CMB dipole is purely kinematic in origin, this is taken to be the ‘CMB frame’ which can be reached by a local special relativistic boost, so the measured values are corrected as in Equation (1) for the redshift and Equation (2) for the luminosity distance.

Appendix B. The Joint Lightcurve Analysis Catalogue

The JLA catalogue [25] consists of 740 spectroscopically confirmed SNe Ia, including several low redshift ( z < 0.1 ) samples, three seasons of SDSS-II ( 0.05 < z < 0.4 ) and three years of SNLS ( 0.2 < z < 1 ) data, all calibrated consistently in the ‘Spectral Adaptive Lightcurve Template 2’ (SALT2) scheme. Figure A1 and Figure A2 show, respectively, the sky coverage and redshift distribution of this publicly available catalogue.
Figure A1. Sky distribution (Mollweide projection, equatorial coordinates) of the 4 subsamples of the JLA catalogue: low z (red dots), SDSS (green dots), HST (black dots), clusters of many SNe Ia from SNLS (blue dots). The directions of the CMB dipole (star), the SMAC bulk flow (triangle) [16], and the 2M++ bulk flow (inverted triangle) [18] are shown in grey.
Universe 10 00209 g0a1
Figure A2. The redshift distribution of the 4 samples that make up the SDSS-II/SNLS3 Joint Lightcurve Analysis catalogue.
Universe 10 00209 g0a2
We use the publicly available SALT2 light curve fits carried out by the JLA collaboration [25], but rather than use their ‘constrained’ χ 2 statistic which is unprincipled, we employ the Maximum Likelihood Estimator (MLE) due to Nielsen et al. [37]. Note that the distribution of ‘pulls’ using this MLE is gaussian, while the best fit and its uncertainties explicitly satisfy Wilk’s theorem [37]. Our approach is frequentist but equivalent to the ‘Bayesian Hierarchical Model’ [38,54,55]. It has been used in independent analyses of SNe Ia [56,57].
Ref. [38] advocated that the shape and colour parameters be allowed to depend on both the SNe Ia sample and the redshift; however, this introduces 12 additional parameters (to the 10 used above) and thus violates the Bayesian information criterion [6,58]. Ref. [59] noted that if x 1 and c evolve with redshift, the likelihood-based methods return biased values of the parameters (while the ‘constrained χ 2 ’ method continues to be robust); however, this conclusion is arrived at using Monte Carlo simulations which assume the Λ CDM model and is therefore a circular argument. It has been emphasised by [56] that systematic uncertainties and selection biases in the data need to be corrected for in a model-independent manner, before fitting to a particular cosmological model. For further discussion of these and other related issues, see Ref. [60].

Note

1
There are other corrections too such as for gravitational lensing, which become more important than the effect of peculiar velocities at redshift z > 0.15 —see Figure B.1 of Ref. [6].

References

  1. Peebles, P.J.E. Anomalies in physical cosmology. Ann. Phys. 2022, 447, 169159. [Google Scholar] [CrossRef]
  2. Freedman, W.L. Measurements of the Hubble constant: Tensions in perspective. Astrophys. J. 2021, 919, 16. [Google Scholar] [CrossRef]
  3. Abdalla, E.; Franco Abellán, G.; Aboubrahim, A.; Agnello, A.; Akarsu, O.; Akrami, Y.; Alestas, G.; Aloni, D.; Amendola, L.; Anchordoqui, L.A.; et al. Cosmology intertwined: A review of the particle physics, astrophysics, and cosmology associated with the cosmological tensions and anomalies. J. High Energy Astropys. 2022, 34, 49. [Google Scholar] [CrossRef]
  4. Secrest, N.J.; von Hausegger, S.; Rameez, M.; Mohayaee, R.; Sarkar, S.; Colin, J. A Test of the Cosmological Principle with Quasars. Astrophys. J. Lett. 2021, 908, L51. [Google Scholar] [CrossRef]
  5. Secrest, N.J.; von Hausegger, S.; Rameez, M.; Mohayaee, R.; Sarkar, S. A Challenge to the Standard Cosmological Model. Astrophys. J. Lett. 2022, 937, L31. [Google Scholar] [CrossRef]
  6. Colin, J.; Mohayaee, R.; Rameez, M.; Sarkar, S. Evidence for anisotropy of cosmic acceleration. Astron. Astrophys. 2019, 631, L13. [Google Scholar] [CrossRef]
  7. Tsagas, C.G.; Kadiltzoglou, M.I.; Asvesta, K. The deceleration parameter in “tilted” Friedmann universes: Newtonian vs relativistic treatment. Astrophys. Space Sci. 2021, 366, 90. [Google Scholar] [CrossRef]
  8. Watkins, R.; Allen, T.; Bradford, C.J.; Walker, A.; Feldman, H.A.; Cionitti, R.; Al-Shorman, Y.; Kourkchi, E.; Tully, R.B. Analysing the large-scale bulk flow using Cosmicflows4: Increasing tension with the standard cosmological model. Mon. Not. Roy. Astron. Soc. 2023, 524, 1885. [Google Scholar] [CrossRef]
  9. McClure, M.L.; Dyer, C.C. Anisotropy in the Hubble constant as observed in the HST Extragalactic Distance Scale Key Project results. New Astron. 2007, 12, 533. [Google Scholar] [CrossRef]
  10. Leibundgut, B. Type Ia supernovae. Astron. Astrophys. Rev. 2000, 10, 179. [Google Scholar] [CrossRef]
  11. Brout, D.; Scolnic, D.; Popovic, B.; Riess, A.G.; Zuntz, J.; Kessler, R.; Carr, A.; Davis, T.M.; Hinton, S.; Jones, D.; et al. The Pantheon+ Analysis: Cosmological Constraints. Astrophys. J. 2022, 938, 110. [Google Scholar] [CrossRef]
  12. Perlmutter, S.; Aldering, G.; Goldhaber, G.; Knop, R.A.; Nugent, P.; Castro, P.G.; Deustua, S.; Fabbro, S.; Goobar, A.; Groom, D.E.; et al. Measurements of Omega and Lambda from 42 high redshift supernovae. Astrophys. J. 1999, 517, 565. [Google Scholar] [CrossRef]
  13. Riess, A.G.; Filippenko, A.V.; Challis, P.; Clocchiatti, A.; Diercks, A.; Garnavich, P.M.; Gillil, R.L.; Hogan, C.J.; Jha, S.; Kirshner, R.P.; et al. Observational evidence from supernovae for an accelerating universe and a cosmological constant. Astron. J. 1998, 116, 1009. [Google Scholar] [CrossRef]
  14. Hudson, M.J.; Smith, R.J.; Lucey, J.R.; Branchini, E. Streaming motions of galaxy clusters within 12000 km/s. 5. The peculiar velocity field. Mon. Not. Roy. Astron. Soc. 2004, 352, 61. [Google Scholar] [CrossRef]
  15. Conley, A.; Guy, J.; Sullivan, M.; Regnault, N.; Astier, P.; Ball, C.; Basa, S.; Carlberg, R.G.; Fouchez, D.; Hardin, D.; et al. Supernova Constraints and Systematic Uncertainties from the First 3 Years of the Supernova Legacy Survey. Astrophys. J. Suppl. 2011, 192, 1. [Google Scholar] [CrossRef]
  16. Neill, J.D.; Hudson, M.J.; Conley, A. The peculiar velocities of local Type Ia supernovae and their impact on cosmology. Astrophys. J. Lett. 2007, 661, L123. [Google Scholar] [CrossRef]
  17. Saunders, W.; Sutherl, W.J.; Maddox, S.J.; Keeble, O.; Oliver, S.J.; Rowan-Robinson, M.; McMahon, R.G.; Efstathiou, G.P.; Tadros, H.; White, S.D.; et al. The PSCz catalogue. Mon. Not. Roy. Astron. Soc. 2000, 317, 55. [Google Scholar] [CrossRef]
  18. Carrick, J.; Turnbull, S.J.; Lavaux, G.; Hudson, M.J. Cosmological parameters from the comparison of peculiar velocities with predictions from the 2M++ density field. Mon. Not. Roy. Astron. Soc. 2015, 450, 317. [Google Scholar] [CrossRef]
  19. Colin, J.; Mohayaee, R.; Sarkar, S.; Shafieloo, A. Probing the anisotropic local universe and beyond with SNe Ia data. Mon. Not. Roy. Astron. Soc. 2011, 414, 264. [Google Scholar] [CrossRef]
  20. Feindt, U.; Kerschhaggl, M.; Kowalski, M.; Aldering, G.; Antilogus, P.; Aragon, C.; Bailey, S.; Baltay, C.; Bongard, S.; Buton, C.; et al. Measuring cosmic bulk flows with Type Ia supernovae from the Nearby Supernova Factory. Astron. Astrophys. 2013, 560, A90. [Google Scholar] [CrossRef]
  21. Howlett, C.; Said, K.; Lucey, J.R.; Colless, M.; Qin, F.; Lai, Y.; Tully, R.B.; Davis, T.M. The sloan digital sky survey peculiar velocity catalogue. Mon. Not. Roy. Astron. Soc. 2022, 515, 953. [Google Scholar] [CrossRef]
  22. Lavaux, G.; Tully, R.B.; Mohayaee, R.; Colombi, S. Cosmic flow from 2MASS redshift survey: The origin of CMB dipole and implications for LCDM cosmology. Astrophys. J. 2010, 709, 48. [Google Scholar] [CrossRef]
  23. Magoulas, C.; Springob, C.; Colless, M.; Mould, J.; Lucey, J.; Erdoğdu, P.; Jones, D.H. Measuring the cosmic bulk flow with 6dFGSv. Proc. IAU Symp. 2016, 308, 336. [Google Scholar] [CrossRef]
  24. Watkins, R.; Feldman, H.A.; Hudson, M.J. Large-scale bulk flows from the Cosmicflows-2 catalogue. Mon. Not. Roy. Astron. Soc. 2009, 392, 743. [Google Scholar] [CrossRef]
  25. Betoule, M.; Kessler, R.; Guy, J.; Mosher, J.; Hardin, D.; Biswas, R.; Astier, P.; El-Hage, P.; Konig, M.; Kuhlmann, S.; et al. Improved cosmological constraints from a joint analysis of the SDSS-II and SNLS supernova samples. Astron. Astrophys. 2014, 568, A22. [Google Scholar] [CrossRef]
  26. Scolnic, D.M.; Jones, D.O.; Rest, A.; Pan, Y.C.; Chornock, R.; Foley, R.J.; Huber, M.E.; Kessler, R.; Narayan, G.; Riess, A.G.; et al. The Complete Light-curve Sample of Spectroscopically Confirmed SNe Ia from Pan-STARRS1 and Cosmological Constraints from the Combined Pantheon Sample. Astrophys. J. 2018, 859, 101. [Google Scholar] [CrossRef]
  27. Rameez, M.; Sarkar, S. Is there really a Hubble tension? Class. Quant. Grav. 2021, 38, 154005. [Google Scholar] [CrossRef]
  28. Davis, T.M.; Hui, L.; Frieman, J.A.; Haugbølle, T.; Kessler, R.; Sinclair, B.; Sollerman, J.; Bassett, B.; Marriner, J.; Mørtsell, E.; et al. The effect of peculiar velocities on supernova cosmology. Astrophys. J. 2011, 741, 67. [Google Scholar] [CrossRef]
  29. Hui, L.; Greene, P.B. Correlated fluctuations in luminosity distance and the (surprising) importance of peculiar motion in supernova surveys. Phys. Rev. D 2006, 73, 123526. [Google Scholar] [CrossRef]
  30. Huterer, D.; Shafer, D.L.; Schmidt, F. No evidence for bulk velocity from Type Ia supernovae. J. Cosmo. Astropart. Phys. 2015, 12, 033. [Google Scholar] [CrossRef]
  31. Hunt, P.; Sarkar, S. Constraints on large scale inhomogeneities from WMAP-5 and SDSS: Confrontation with recent observations. Mon. Not. Roy. Astron. Soc. 2010, 401, 547. [Google Scholar] [CrossRef]
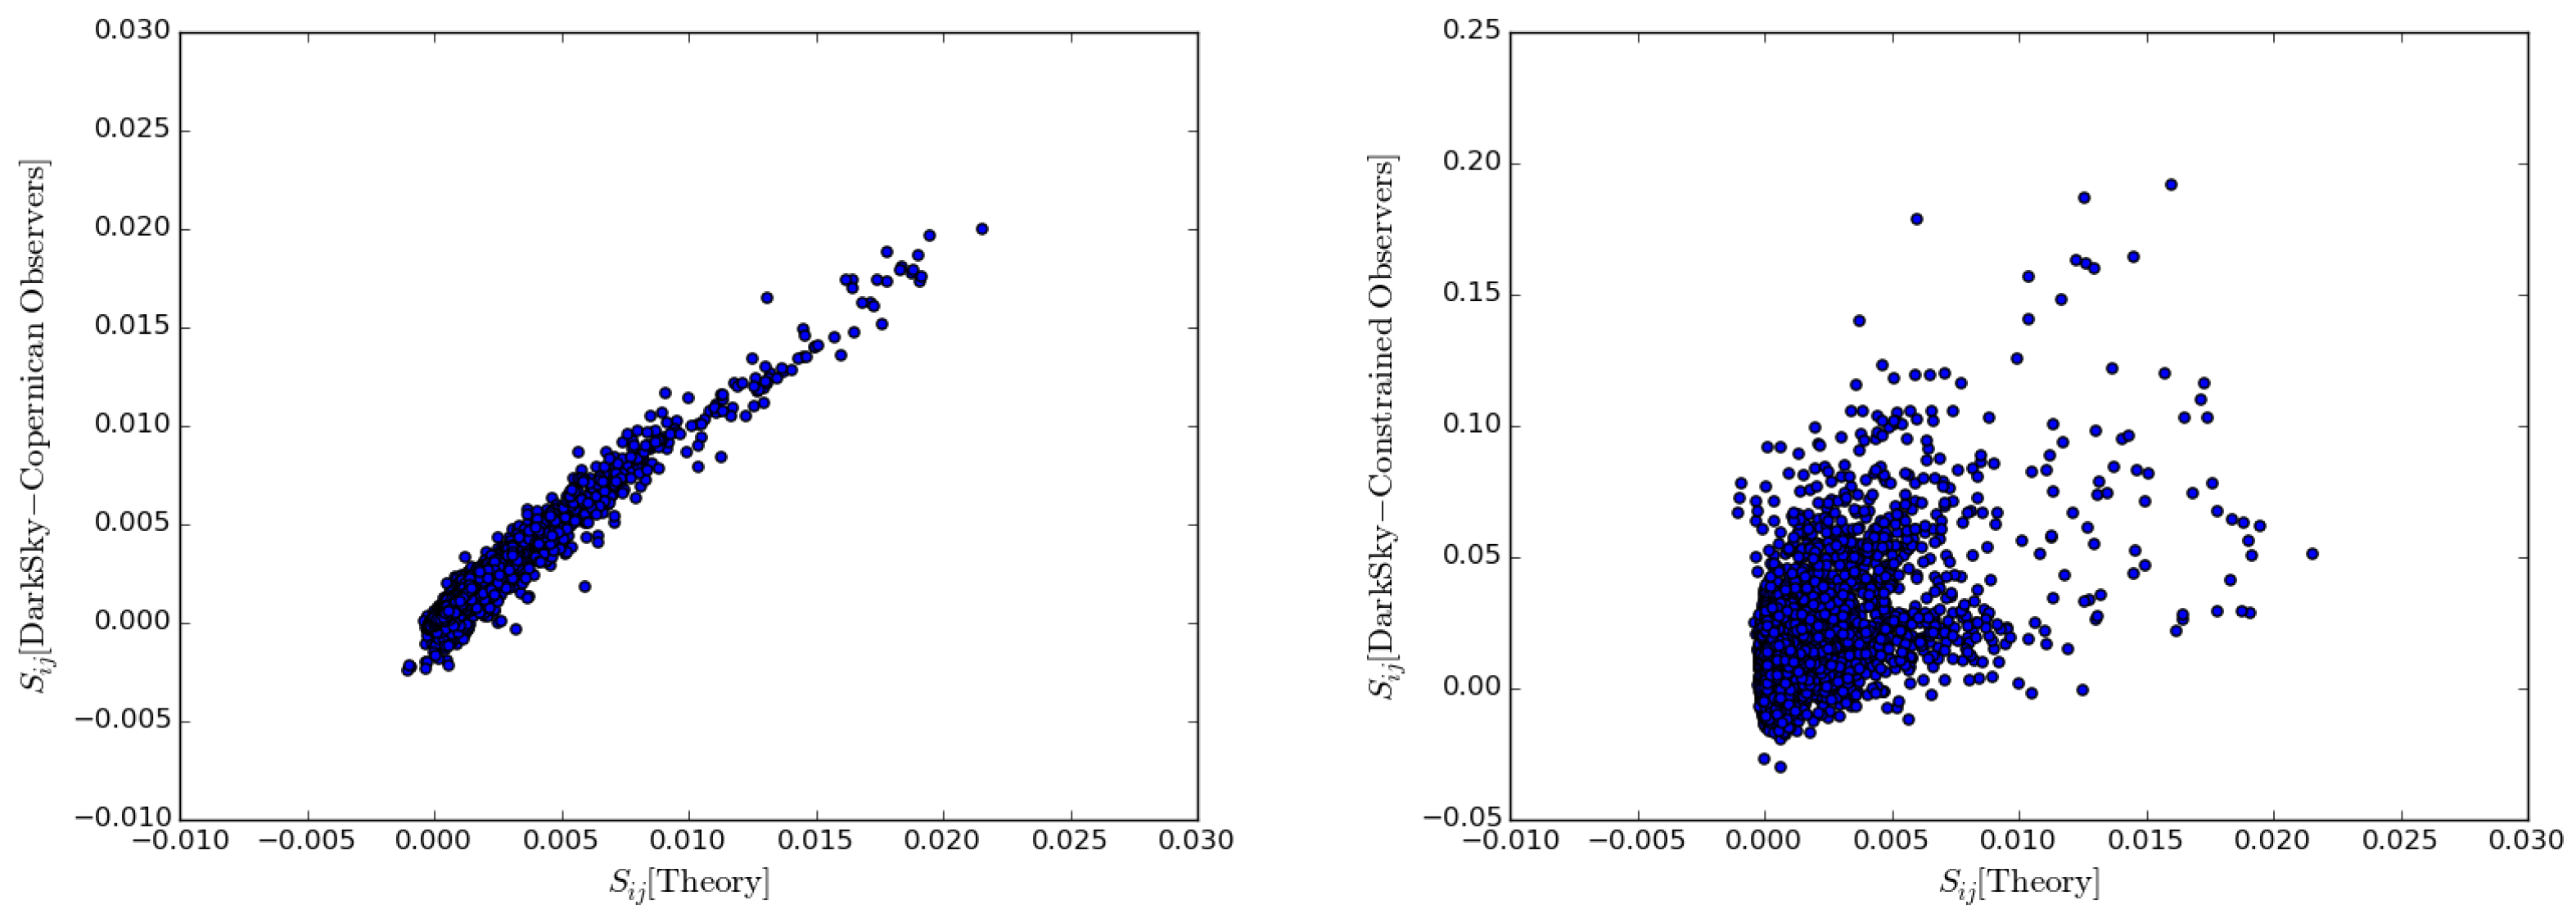
  32. Hellwing, W.A.; Nusser, A.; Feix, M.; Bilicki, M. Not a Copernican observer: Biased peculiar velocity statistics in the local universe. Mon. Not. Roy. Astron. Soc. 2017, 467, 2787. [Google Scholar] [CrossRef]
  33. Hellwing, W.A.; Bilicki, M.; Libeskind, N.I. Uneven flows: On cosmic bulk flows, local observers, and gravity. Phys. Rev. D 2018, 97, 103519. [Google Scholar] [CrossRef]
  34. Rameez, M.; Mohayaee, R.; Sarkar, S.; Colin, J. The dipole anisotropy of AllWISE galaxies. Mon. Not. Roy. Astron. Soc. 2018, 477, 1772. [Google Scholar] [CrossRef]
  35. Skillman, S.W.; Warren, M.S.; Turk, M.J.; Wechsler, R.H.; Holz, D.E.; Sutter, P.M. Dark Sky simulations: Early data release. arXiv 2014, arXiv:1407.2600. [Google Scholar]
  36. Tully, R.B.; Courtois, H.M.; Sorce, J.G. Cosmicflows-3. Astron J. 2016, 152, 50. [Google Scholar] [CrossRef]
  37. Nielsen, J.T.; Guffanti, A.; Sarkar, S. Marginal evidence for cosmic acceleration from Type Ia supernovae. Sci. Rep. 2016, 6, 35596. [Google Scholar] [CrossRef] [PubMed]
  38. Rubin, D.; Hayden, B. Is the expansion of the universe accelerating? All signs point to yes. Astrophys. J. Lett. 2016, 833, L30. [Google Scholar] [CrossRef]
  39. Boruah, S.S.; Hudson, M.J.; Lavaux, G. Cosmic flows in the nearby universe: New peculiar velocities from SNe and cosmological constraints. Mon. Not. Roy. Astron. Soc. 2020, 498, 2703. [Google Scholar] [CrossRef]
  40. Cautun, M.; Frenk, C.S.; van de Weygaert, R.; Hellwing, W.A.; Jones, B.J.T. Milky Way mass constraints from the Galactic satellite gap. Mon. Not. Roy. Astron. Soc. 2014, 445, 2049. [Google Scholar] [CrossRef]
  41. Hong, T.; Springob, C.M.; Staveley-Smith, L.; Scrimgeour, M.I.; Masters, K.L.; Macri, L.M.; Koribalski, B.S.; Jones, D.H.; Jarrett, T.H. 2MTF – IV. A bulk flow measurement of the local universe. Mon. Not. Roy. Astron. Soc. 2014, 445, 402. [Google Scholar] [CrossRef]
  42. Boggs, P.T.; Rogers, J.E. Orthogonal distance regression. Contemp. Math. 1990, 112, 183. [Google Scholar] [CrossRef]
  43. Colin, J.; Mohayaee, R.; Rameez, M.; Sarkar, S. High redshift radio galaxies and divergence from the CMB dipole. Mon. Not. Roy. Astron. Soc. 2017, 471, 1045. [Google Scholar] [CrossRef]
  44. Nielsen, J.T. Supernovae as cosmological probes. arXiv 2015, arXiv:1508.07850. [Google Scholar]
  45. Hollinger, A.M.; Hudson, M.J. Assessing the accuracy of cosmological parameters estimated from velocity – density comparisons via simulations. Mon. Not. Roy. Astron. Soc. 2021, 502, 3723. [Google Scholar] [CrossRef]
  46. Said, K.; Colless, M.; Magoulas, C.; Lucey, J.R.; Hudson, M.J. Joint analysis of 6dFGS and SDSS peculiar velocities for the growth rate of cosmic structure and tests of gravity. Mon. Not. Roy. Astron. Soc. 2020, 497, 1275. [Google Scholar] [CrossRef]
  47. Huterer, D. Specific effect of peculiar velocities on dark-energy constraints from Type Ia supernovae. Astrophys. J. Lett. 2020, 904, L28. [Google Scholar] [CrossRef]
  48. Bertschinger, E. Cosmological dynamics: Course 1. arXiv 1993, arXiv:astro-ph/9503125. [Google Scholar]
  49. Mukhanov, V.F.; Feldman, H.A.; Brandenberger, R.K. Theory of cosmological perturbations. Part 1. Classical perturbations. Part 2. Quantum theory of perturbations. Part 3. Extensions. Phys. Rep. 1992, 215, 203. [Google Scholar] [CrossRef]
  50. D’Eath, P.D. On the existence of perturbed Robertson-Walker universes. Ann. Phys. 1976, 98, 237. [Google Scholar] [CrossRef]
  51. Giblin, J.T.; Mertens, J.B.; Starkman, G.D. Departures from the Friedmann-Lemaitre-Robertston-Walker cosmological model in an inhomogeneous universe: A numerical examination. Phys. Rev. Lett. 2015, 116, 251301. [Google Scholar] [CrossRef]
  52. Buchert, T.; Carfora, M.; Ellis, G.F.R.; Kolb, E.W.; MacCallum, M.A.H.; Ostrowski, J.J.; Räsänen, S.; Roukema, B.F.; Andersson, L.; Coley, A.A.; et al. Is there proof that backreaction of inhomogeneities is irrelevant in cosmology? Class. Quant. Grav. 2015, 32, 215021. [Google Scholar] [CrossRef]
  53. Guy, J.; Astier, P.; Baumont, S.; Hardin, D.; Pain, R.; Regnault, N.; Basa, S.; Carlberg, R.G.; Conley, A.; Fabbro, S.; et al. SALT2: Using distant supernovae to improve the use of Type Ia supernovae as distance indicators. Astron. Astrophys. 2007, 466, 11. [Google Scholar] [CrossRef]
  54. March, M.; Trotta, R.; Berkes, P.; Starkman, G.; Vaudrevange, P. Improved constraints on cosmological parameters from Type Ia supernova data. Mon. Not. Roy. Astron. Soc. 2011, 418, 2308–2329. [Google Scholar] [CrossRef]
  55. Shariff, H.; Xiao, J.; Trotta, R.; van Dyk, D.A. BAHAMAS: New analysis of Type Ia supernovae reveals inconsistencies with standard cosmology. Astrophys. J. 2016, 827, 1. [Google Scholar] [CrossRef]
  56. Dam, L.H.; Heinesen, A.; Wiltshire, D.L. Apparent cosmic acceleration from Type Ia supernovae. Mon. Not. Roy. Astron. Soc. 2017, 472, 835. [Google Scholar] [CrossRef]
  57. Desgrange, C.; Heinesen, A.; Buchert, T. Dynamical spatial curvature as a fit to Type Ia supernovae. Intern. J. Mod. Phys. D 2019, 28, 1950143. [Google Scholar] [CrossRef]
  58. Colin, J.; Mohayaee, R.; Rameez, M.; Sarkar, S. A response to Rubin & Heitlauf: “Is the expansion of the universe accelerating? All signs still point to yes”. arXiv 2019, arXiv:1912.04257. [Google Scholar]
  59. Karpenka, N.V. The supernova cosmology cookbook: Bayesian numerical recipes. arXiv 2015, arXiv:1503.03844. [Google Scholar]
  60. Mohayaee, R.; Rameez, M.; Sarkar, S. Do supernovae indicate an accelerating universe? Eur. Phys. J. ST 2021, 230, 2067. [Google Scholar] [CrossRef]
Figure 1. The theoretically expected covariance S i j (Equation (3)) plotted against the value found in N-body simulations—in regions around typical observers (left) and constrained ‘Local Universe-like’ observers (right). Each point is an average over 1000 observers.
Universe 10 00209 g001
Figure 2. The bulk flow velocity profiles around 10 random ‘Local Universe-like’ observers satisfying the criteria in Section 2. Note that the velocity profile around an individual observer need not decrease monotonically, even though the ensemble average in the Λ CDM model (dark blue curve) does so. Indeed, the Cosmicflows-4 data [8] indicates a rising velocity with depth. The shaded blue region is the ± 1 σ band around the mean value.
Universe 10 00209 g002
Figure 3. The line-of-sight velocity of SNe Ia inferred from their z hel and z CMB values quoted by JLA, plotted versus the line-of-sight component of the velocity of the group the object belongs to in the dataset ( V CMB g p ). The blue horizontal bars are the diagonal errors in the JLA cosmology fit (statistical plus systematic), while the blue vertical bars indicate the random error of 250 km s−1 in the measurement. The green dashed line indicates when the two are equal, while the red dashed line shows the best-fit orthogonal distance regression which has a slope of 1.61, i.e., the JLA velocities have been underestimated on average by 48%. (Note that the outlier (SN1992bh) has a peculiar velocity of 1000 km s−1 according to JLA, but zero according to CF-3).
Universe 10 00209 g003
Figure 4. The profile of bulk flow expected in a Λ CDM universe using a top-hat window function is shown as the solid blue line, while the shaded region shows the ± 1 σ range. Several discrepant measurements (with ± 1 σ uncertainties) using various surveys are shown for comparison [8,19,20,21,24]. The red and green lines show, respectively, the linear and exponential fits to the bulk flow using JLA data — rows 9 and 10 of Table 1 (the dashed lines indicate the extrapolated fits). Note that the fits are not done to the other selected measurements shown.
Universe 10 00209 g004
Figure 5. 1, 2 and 3 σ contours corresponding to the fit in row 9 of Table 1 wherein peculiar velocities from Cosmicflows-3 are used for SN-by-SN corrections and the flow is allowed to continue beyond the survey volume with an exponential fall-off (Equation (6)). The velocity of the bulk flow at a top-hat smoothing scale of radius 200 Mpc is shown in the right histogram of the posterior. The top histogram shows the extracted value of Ω Λ , which is seen to be degenerate with this bulk flow velocity.
Universe 10 00209 g005
Figure 6. Distribution of the S 8 parameter extracted by comparing the ‘observed’ (in this case, simulated) peculiar velocity with the prediction from the density contrast field, for 1000 observers selected at random (Copernican) as well as selected to be in Local Universe-like (LU-like) environments. The median values are shown in black. For comparison, the measurements [18,39,46] made using the same method are shown, as well as the value derived from the CMB measurements by Planck.
Universe 10 00209 g006
Disclaimer/Publisher’s Note: The statements, opinions and data contained in all publications are solely those of the individual author(s) and contributor(s) and not of MDPI and/or the editor(s). MDPI and/or the editor(s) disclaim responsibility for any injury to people or property resulting from any ideas, methods, instructions or products referred to in the content.

