Article

‘X-Currents’ and Extreme Brightening in Dayside Aurora

1
Natural Science Department, Pepperdine University, Malibu, CA 90263, USA
2
Institute of Earth Sciences, National Taiwan University, Academia Sinica, Taipei 106, Taiwan
3
Geophysical Department, University Centre in Svalbard, N-9170 Longyearbyen, Norway
*
Author to whom correspondence should be addressed.
Universe 2024, 10(5), 216; https://doi.org/10.3390/universe10050216
Submission received: 18 February 2024 / Revised: 12 April 2024 / Accepted: 16 April 2024 / Published: 14 May 2024
(This article belongs to the Section Planetary Sciences)

Abstract

:
Solar-terrestrial interaction is a dynamic process that manifests itself in the ionosphere. Interplanetary (IP) shocks or solar wind dynamic pressure pulses can generate enhanced brightening in dayside aurora. Foreshock transients are capable of inducing pressure changes, larger in magnitude than solar wind pressure pulses, which also contribute to intensifying dayside aurora. These pressure variations can accelerate particles into the ionosphere, generating field-aligned currents that produce magnetic impulse events and enhanced dayside auroral activity with periods of increased brightening. This study presents several dayside auroral brightening events that are not associated with IP shocks or solar wind dynamic pressure pulses. The dayside auroral brightening events are associated with a green (557.7 nm) to red (630.0 nm) ratio which is greater than 15. These extreme brightening events (EBEs) begin on the eastern or western end of a pre-existing dayside auroral arc. Periodic pulses of enhanced brightening are correlated with large sharp increases in the X-component (points toward the north-geographic pole) from ground magnetometers in the IMAGE network. EBEs occur predominately before magnetic noon and with X-component signatures from high-latitude stations. Ground-based data were obtained from the Kjell Henriksen Observatory in Longyearbyen and the IMAGE magnetometer network.

1. Introduction

Dayside aurora is important for understanding solar-terrestrial interactions. Auroral activity is enhanced when there are changes in the solar wind conditions and/or when accompanied by solar wind transients [1,2]. Solar wind parameters that can have an impact on the magnetosphere are the solar wind speed, solar wind dynamic pressure, and interplanetary magnetic field (IMF). Solar wind transients that have an influence on the terrestrial environment are generally classified as (i) coronal mass ejections, (ii) solar flares, (iii) stream interaction events, and (iv) solar energetic particle events [3]. A magnetic cloud [4] coupled with high-speed solar wind can generate a range of IMF configurations which, in turn, generate a number of different dayside auroral features [5]. Sandholt et al. [5] developed classifications for the different dayside auroral features by correlating the auroral features with the different IMF configurations.
Sandholt et al. [5,6,7,8,9,10,11], using ground-based optical data, classified two types of aurora type (category) 1 and type (category) 2. Type 1 aurorae occur when the IMF is southward and are associated with dayside auroral arcs that brighten at the dayside auroral oval and then propagate poleward (poleward-moving auroral forms, PMAFs). PMAFs are believed to be the ionospheric signatures of magnetic reconnection at low latitudes [5,9,12,13,14,15,16,17,18,19,20]. The east-west (EW) motion of the PMAF is dependent on the IMF B y -component [5]. The intensity reported by Sandholt et al. [5] for type 1 aurorae are ~2–5 kR for the red 630.0 nm emission.
Type 2 aurorae are observed for northward IMF conditions during times of low magnetic shear [5] and are typically associated with equatorward motion [5]. The poleward and equatorward boundaries of type 2 aurorae at times, may have discrete forms that have enhanced emission (green line: 557.7 nm) [5]. Ionospheric signatures from possible high-latitude reconnection are associated with type 2 aurorae [5,7,8,11,21]. Type 2 aurorae also move EW depending on the IMF B y -component [5].
Location wise, type 2 aurorae are observed at higher latitudes than type 1 aurorae. Both type 1 and type 2 dayside aurorae are discrete auroral forms with rayed bands (longer rays for type 2 aurora), close to magnetic noon (9 UT). type 1 and type 2 aurorae can be observed together, due to reconnection occurring both at low and high latitudes [5]. Type 2 aurorae are similar, but extend out toward the dawn (west) and dusk (east) sectors [5]. Type 3 aurorae are auroral bands that extend in the E-W direction, which consist of a non-homogeneous diffuse green line emission (557.7 nm).
The auroral classifications by Sandholt et al. [5] are mainly (a) discrete auroral arcs with rayed bands (type 1 and type 2) during intervals of northward IMF (Type 2) and southward IMF (Type 1), (b) diffuse 557.7 nm (green line emission) quasi-steady aurora (type 3) at low latitudes for both northward and southward IMF, (c) nonhomogeneous aurora for multiple arcs with an EW extent in the pre-noon sector (type 4) for northward IMF, (d) multiple arcs and active spiral forms in the post noon sector (type 5) during northward IMF intervals, and (e) single arcs in the pre-noon (type 6) and post-noon sectors (type 7) for periods of southward IMF [5]. Auroral emission intensities for type 4 (pre-magnetic noon) and 5 (post-magnetic noon) arcs are reported to be ~1–10 kR for both the red (630.0 nm) and green (557.7 nm) emissions [5].
Northward IMF B y conditions can also provide the conditions to generate cusp-aligned arcs [2], transpolar arcs (TPAs, e.g. theta aurora) [21], and cusp spots [22,23,24,25]. These auroral features are also associated with high-latitude reconnection located on the magnetopause of the lobe [24,25]. Periods of high solar wind speeds and dynamic pressure coinciding with the dayside convection pattern generate throat aurora [26,27,28,29].
This paper presents an observational study of dayside aurora from 6–11 UT using ground optical data from the Kjell Henriksen Observatory in Longyearbyen, Svalbard. The observational data are used in conjunction with, magnetometer data from the IMAGE (International Monitor for Auroral Geomagnetic Effects) [30] magnetometer network and spacecraft data from the NASA Space Physics Data Facility, OMNIWEB. The dayside auroral events presented exhibit extreme brightening, defined as being when the green (557.7 nm) to red (630.0 nm) emission ratio is greater than 15 in the dayside auroral arcs. This intensity values for the green-to-red ratio were obtained from the five-channel meridian scanning photometer (MSP). The MSP sweeps through a one-degree field of view, along the magnetic meridian, recording the red and green emissions from the neutral oxygen atoms [17,31]. The extreme brightening events (EBEs) occur during periods when the IMF B z -component is both northward and southward and during intervals of the brief pressure pulses, 0.1 < Δ P P < 0.5 [13,32]. Enhancements in the X-component of ground magnetometer data have been shown to be associated with the extreme increases in the brightness levels of the dayside auroral arcs, EBEs. The magnetic X-component points towards the north geographic pole. Since currents are the source of magnetic fields, the ‘X-currents’ in the title are defined as being the current source that generates the EBEs (extreme brightening events).

2. Materials and Methods

Ground-based optical data were obtained from the Kjell Henriksen Observatory (KHO) in Longyearbyen, Svalbard (GEO: 78.148 ° N, 16.043 ° E; AACGM: 75.24 ° N, 111.21 ° E). All-Sky camera (ASC) images were obtained from the Boreal Aurora Camera Constellation (BACC). The ASC was fitted with a Sony Exmor IMX174 CMOS sensor, with peak quantum efficiency at 500 nm, 78%. A fish-eye lens, C-mount Fujinon F/1.4, with a field of view of 185 degrees and an image diameter of 5.7 mm was used as the front optic. The instrument is designed to capture the visible part of the electromagnetic spectrum, 4000–7000 angstroms [17,33]. Solar wind data (1 min DSCOVR/ACE/WIND data shifted to bow shock-nose, BSN) were obtained using the DSCOVR/ACE/WIND spacecraft. Ground-based magnetometer data were obtained from the IMAGE (International Monitor for Auroral Geomagnetic Effects) [30].

3. Results

3.1. 18 December 2017

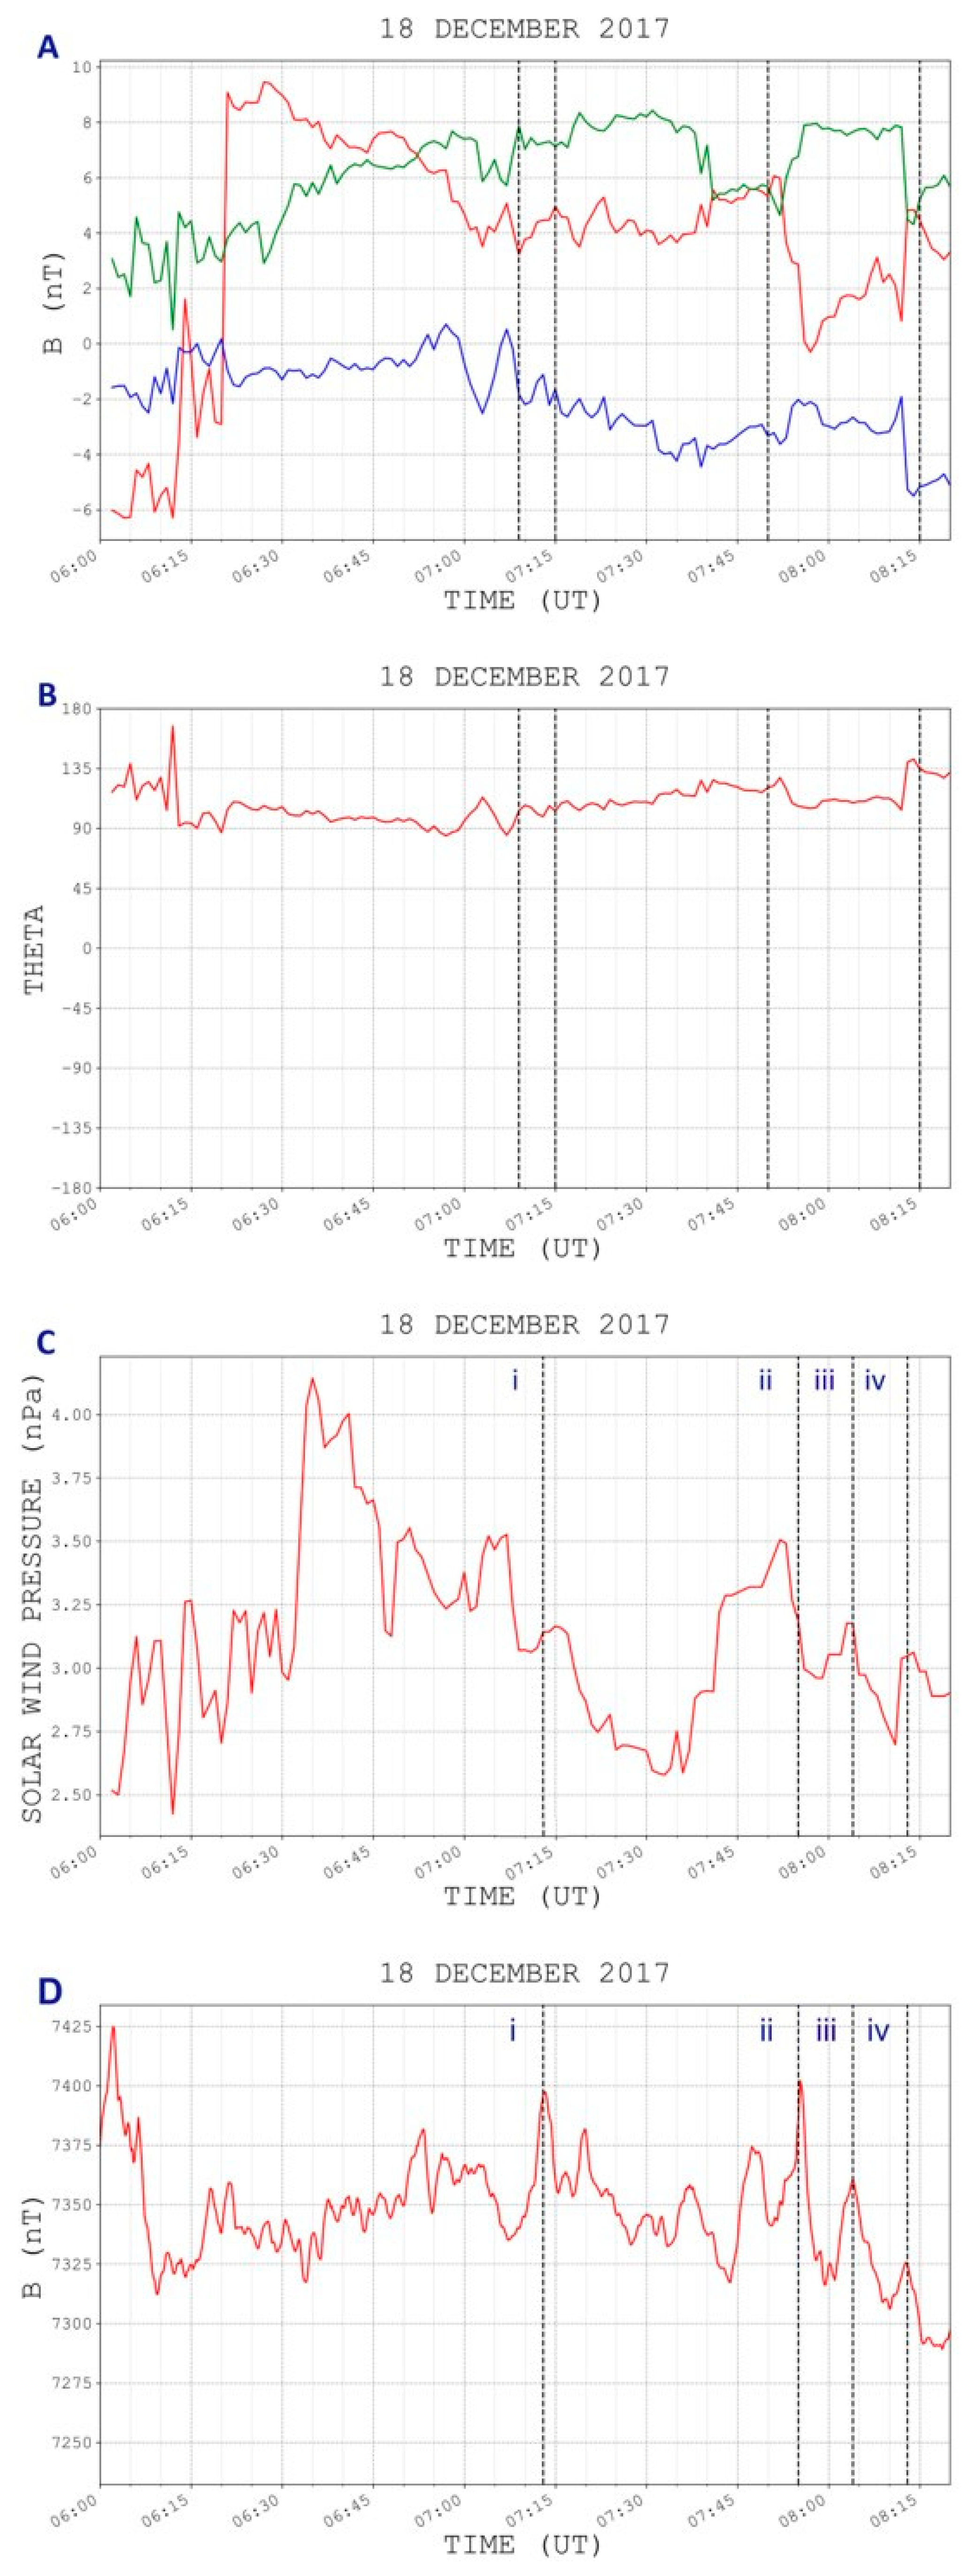
A series of PMAFs in Figure 1 move away from the dayside auroral oval one after another, in an ordered fashion. This dayside auroral sequence of poleward-moving auroral forms (PMAFs) is first presented to illustrate a typical ionospheric signature due to the solar-terrestrial interaction. The PMAF events are the result of magnetic reconnection occurring on the dayside magnetopause. IMF conditions in Region I (first interval between the dashed lines in Figure 2A with the time interval between 07:09–07:15 UT) are: B x < 0 , B y > 0 , and B z < 0 .
The clock angle ( θ C A ), see Figure 2B, for Region I is θ C A 108 , which is conducive to magnetic reconnection [34]. A pressure pulse occurs due to a change in the solar wind pressure between 07:01 UT and 07:04 UT Δ P P = 0.079 , see small and sharp pressure increase to the left of vertical line i at 07:13 UT in Figure 2C, for the series of ASC images in Figure 1.
At 07:09:23 UT (Figure 1a) the first PMAF (red arrow) is moving away from the dayside auroral oval. Also, during this time there is a slight intensification of the dayside auroral oval on the far eastern edge (yellow arrow). The intensification spreads westward through the most poleward edge of the dayside auroral oval. Figure 1b, the ASC image at 07:11:39 UT, shows the first PMAF (red arrow), poleward of the dayside auroral oval, which has faded since drifting poleward away from the dayside auroral oval. The most poleward dayside auroral arc in Figure 1a (yellow arrow) has brightened (from east to west) and moved poleward, forming the second PMAFs (yellow arrow in Figure 1b). As this second PMAF moves poleward, multiple rays begin to intensify in an east-to-west fashion. A slight intensification occurred at, 07:13 UT (Figure 1c) as the second PMAF moved poleward. This increased brightening corresponds to the peak in the X-component (LYR X) (the X-component points towards the geographic north) of the magnetometer located in Longyearbyen, which also occurs at 07:13 UT (see vertical line i in Figure 2D). After a few minutes, at 07:14:05 UT (Figure 1d) the PMAF has drifts poleward, just passing the east-west line (the yellow line in Figure 1d) in the center of the ASC image. At 07:15 UT (Figure 1e) there is a slight intensification of the auroral rays at the western edge of the second PMAF (see the yellow arrow). Equatorward of the second PMAF are a number of PMAFs that are moving poleward during the interval when the dayside auroral oval is expanded. The PMAF fades from view at approximately 07:16:36 UT. The second PMAF in Figure 1, depicts a typical history of increased brightening events of a PMAF during its evolution. There are intensifications on the poleward edge of the observable dayside auroral oval, which eventually begins drifting poleward. The PMAF can intensify in brightness during its poleward migration after breaking away from the dayside auroral oval. The intensities for both the green (557.7 nm) and red (630.0 nm) emissions are obtained from the meridian scanning photometer (MSP) instrument, located in the Kjell Henriksen Observatory. green-to-red emission ratio is less than 10 for this event.
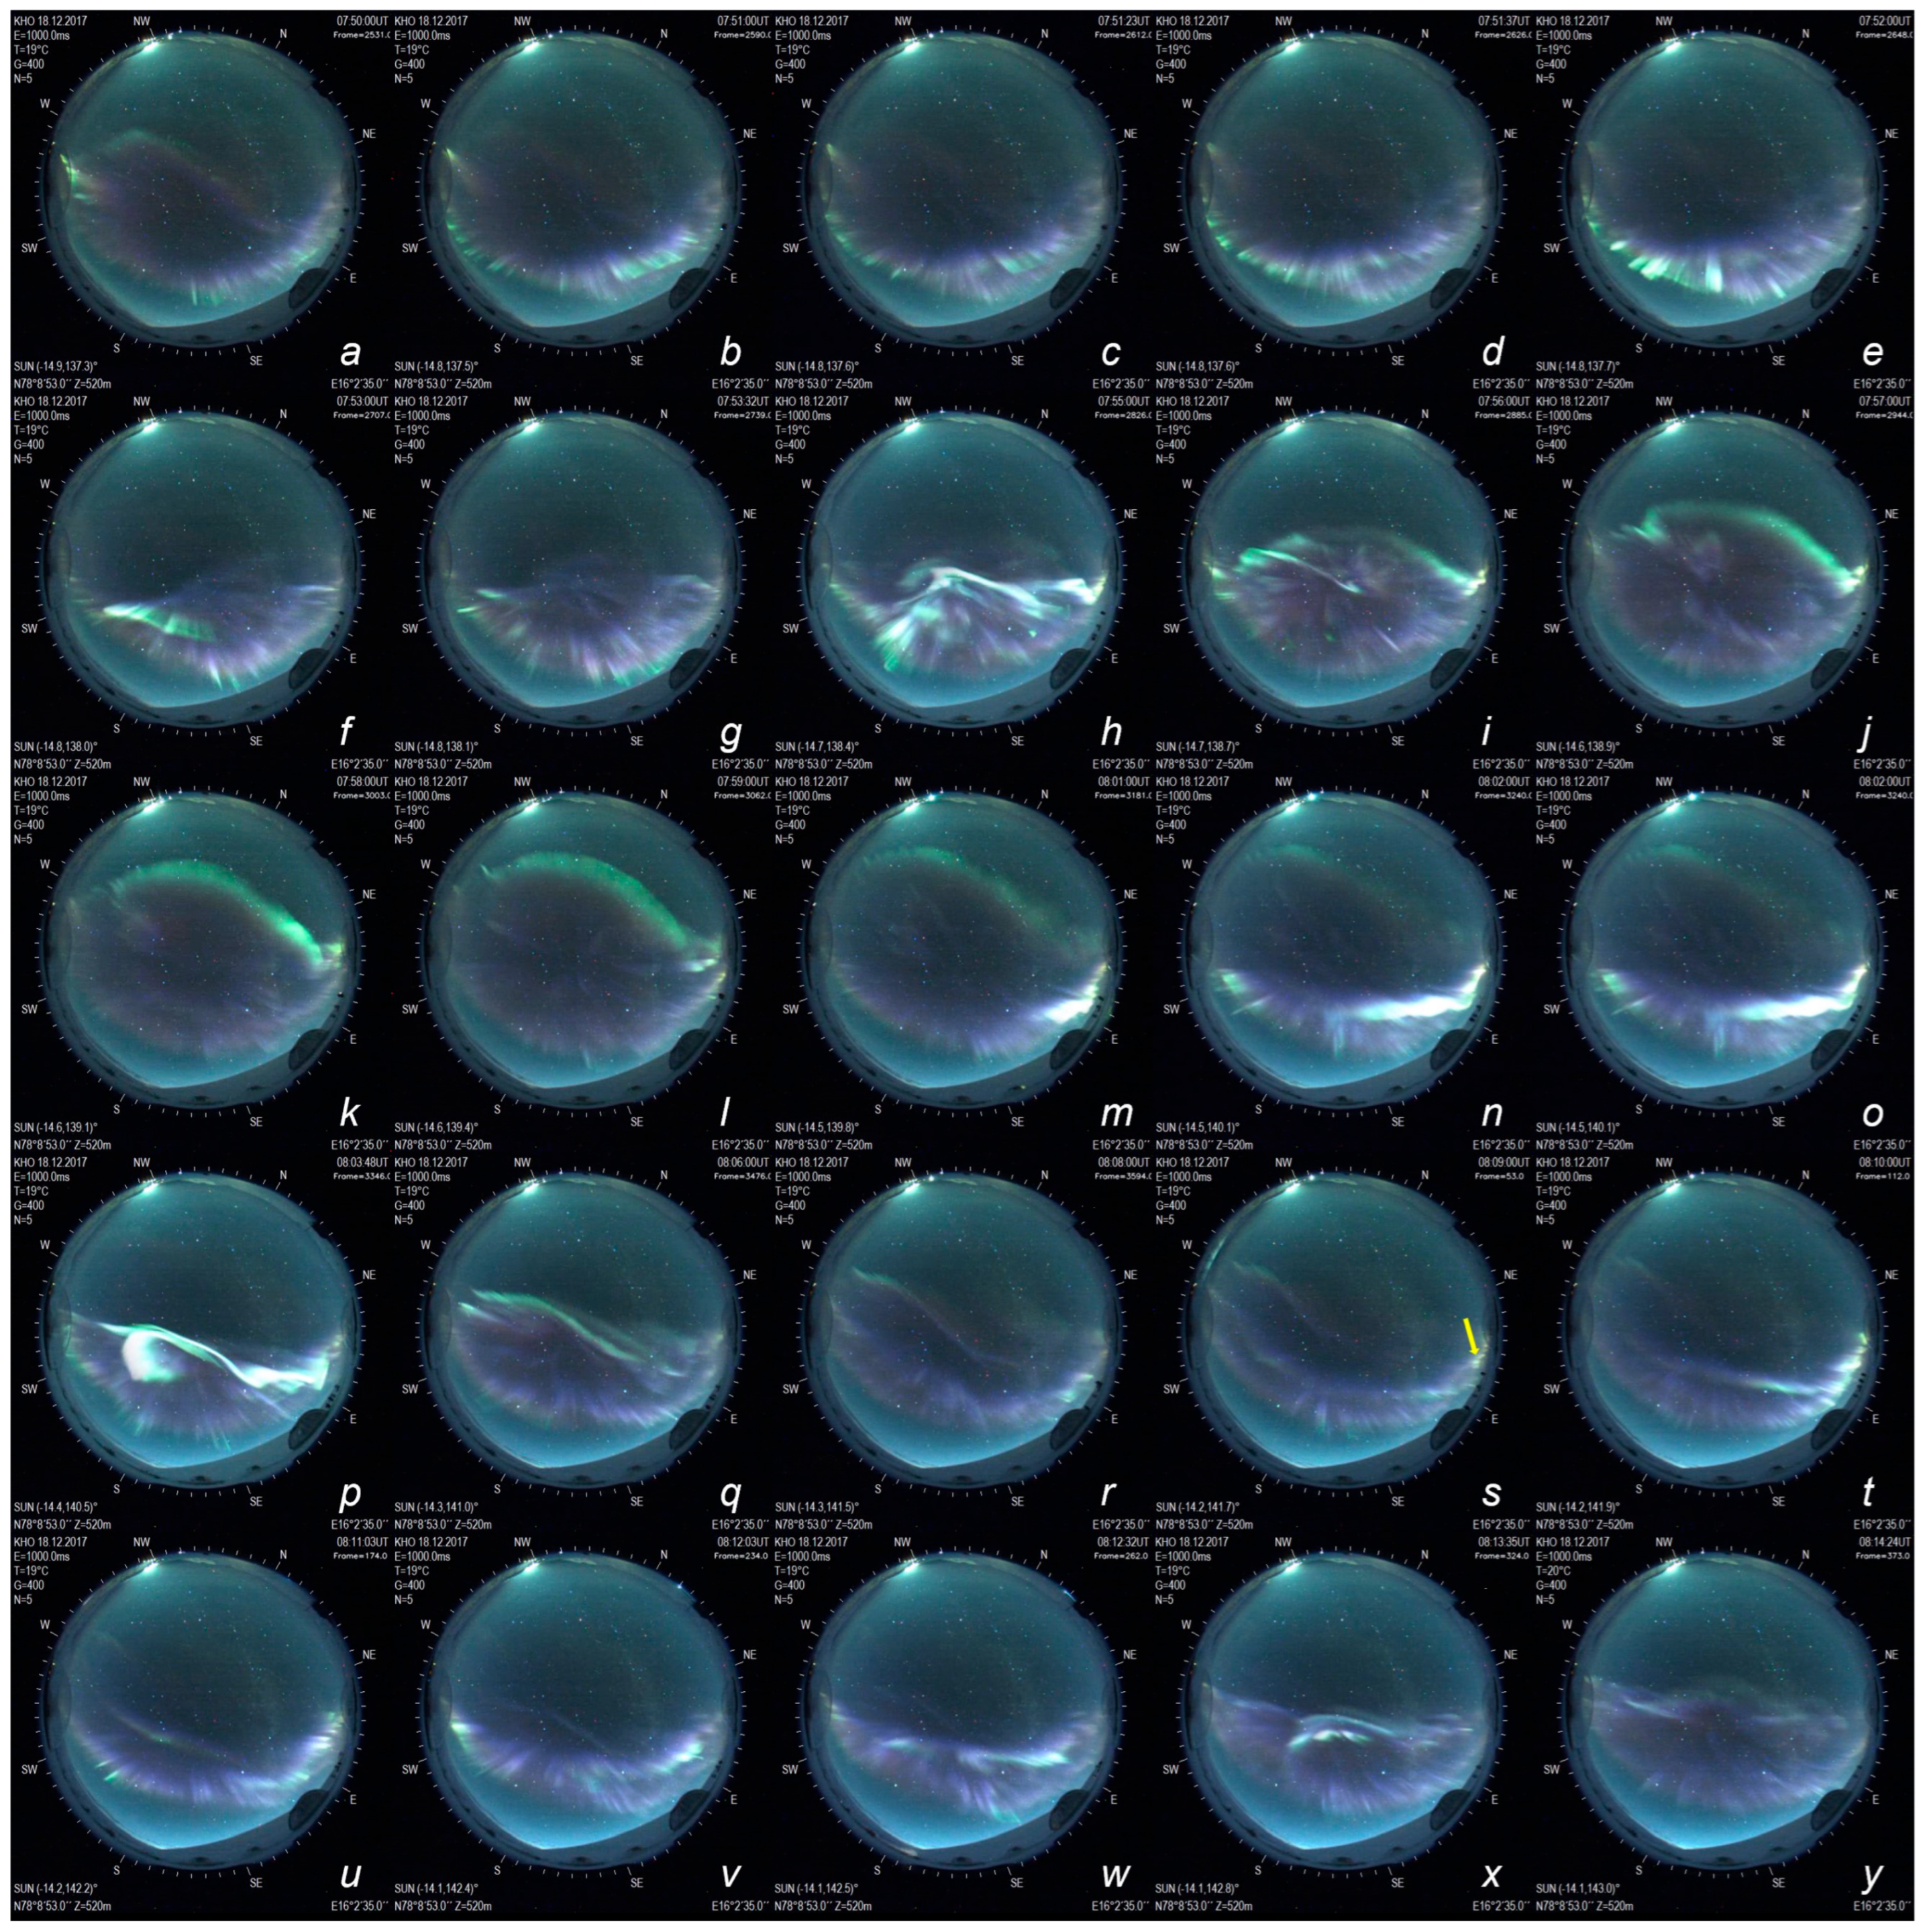
Figure 3 contains a series of ASC images from Region II (07:50–08:15 UT), where again the IMF conditions are B x < 0 , B y > 0 , and B z < 0 . The clock angle for this time interval is θ C A 100 , again conducive for dayside magnetic reconnection [34]. A number of PMAFs occur during this interval, but the intensifications in brightness for these PMAFs are greater than those in the PMAFs observed during the time interval for Region I. Figure 2C, to the left of vertical line ii, shows the solar wind pressure at a local minimum at 7:36 UT, from which it rises to at a peak at 7:52 UT Δ P P = 0.262 . After this peak until 07:55UT, there is a rapid decrease in the solar wind pressure. The ram pressure then continues to quickly decrease, reaching a minimum at 07:57 UT. Figure 2D at 07:50 UT, shows LYR X at a minimum, after which there is a steady increase until 07:54 UT. At 07:54 UT, there is a rapid and steep increase until the local max is reached at 07:55 UT.
Figure 3a–y show the evolution of 4 PMAF events. The first PMAF is observed in Figure 3a–i. Figure 3a, at 07:50 UT, shows the dayside auroral oval expanded and the remnant of a faded PMAF just past the zenith of the ASC, aligned with the W-E geographic coordinates (see yellow line drawn in Figure 1d). Figure 3a shows the eastern end of the dayside auroral oval intensifying. Between 07:50 UT (Figure 3a) and 07:51:23 UT (Figure 3c) the eastern end of the most poleward arc in the dayside auroral oval initially brightens, with the intensification spreading westward through the most poleward arc. LYR X, see Figure 2D, also begins to increase after 7:50 UT. At 07:51:57 UT (Figure 3d) the most poleward edge of the dayside aurora begins to separate from the dayside auroral oval, forming the first PMAF. Figure 3e,f show the continued westward brightening and anti-sunward motion of the first PMAF. The brightening has mostly diminished for the first PMAF at 7:53:32 UT (Figure 3g), but a slight intensification in brightness is noted on the far eastern ray of the PMAF. By 07:55 UT (Figure 3h), the intensification spreads westward through the first PMAF. This brightening is more enhanced than that observed in the PMAF (in Figure 1) during the Region I time interval. The major intensification, for the first PMAF, which occurs between 07:54 UT and 07:55 UT, is well correlated with the increase in LYR X, which reaches a peak at 07:55 UT, see vertical line ii in Figure 2D. By 07:56 UT (Figure 3i), the first PMAF drifts poleward and is characterized by the elongated E-W green auroral arc, with another intensification occurring at its eastern end. This intensification propagates westward along the first PMAF as it continues to move poleward, see Figure 3j. At 07:58 UT (Figure 3k), the first PMAF forms an elongated E-W arc with enhanced green emissions and increased brightening on its eastern end.
There is a solar wind pressure pulse which occurs with a gradual pressure increase between ~7:58–08:03 UT (left of vertical line iii in Figure 2C, Δ P P = 0.068 ). The PMAF decreases in brightness between 07:59 UT and 08:01 UT (Figure 3l,m), with LYR X reaching a local minimum at 08:00 UT, see Figure 2D. Also, at 07:59 UT below the far eastern end of the first PMAF (green auroral arc) an intensification begins on the most poleward arc of the dayside auroral oval and spreads westward, as the LYR X component begins to increase. This intensification of the most poleward edge of the dayside auroral oval is the start of the second PMAF event. By 8:01 UT (Figure 3m) the westward spreading brightness intensifies, noted by the intense thick and white brightness along the poleward edge of the dayside auroral oval. At the same time, the first PMAF in the poleward part of the ASC image (Figure 3m) keeps decreasing in brightness. Figure 3n, at 8:02 UT, shows intense westward brightening continuing along the poleward part of the dayside auroral oval and is beginning to separate and drift poleward, this is the second PMAF. Figure 3o (08:02:25 UT), shows the second PMAF has clearly separated from the dayside auroral oval and is continues to move poleward. The first PMAF has decreased significantly in brightness since it was first formed and is barely visible (Figure 3o).
At 08:03:48 UT (Figure 3p) the second PMAF continues its poleward drift and has achieved its approximate maximum brightening, which is correlated with the local max for LYR X at 8:04 UT, see vertical line iii in Figure 2D, after which it begins to decline. This brightening event is very enhanced when compared to the PMAFs that have been previously discussed (PMAF event in Figure 1 and the first PMAF in Figure 3).
The second PMAF continues its poleward journey and at 8:06 UT (Figure 3q) it is aligned along the E-W direction and is decreasing in brightness as the LYR X continues to decrease. Between 08:08 UT (Figure 3r) and 08:09 UT (Figure 3s), the second PMAF continues to move poleward and fade, and is now barely visible.
Figure 3r also shows another intensification at the eastern edge of the most poleward arc in the dayside auroral oval. By 08:09 (yellow arrow in Figure 3s), the intensification has spread westward and separates from the dayside auroral oval, forming the third PMAF. At 08:10 UT (Figure 3t), the intensification again spreads westward along the PMAF and also along the most poleward edge of the observed dayside auroral oval. Figure 2D shows that LYR X begins to increase at 08:10 UT, which corresponds with the onset of brightness in the third PMAF and dayside auroral oval in Figure 3t. The third PMAF is observed in Figure 3u drifting anti-sunward and quickly fading.
Another solar wind pressure pulse occurs during a sharp increase between 08:11–08:12 UT Δ P P = 0.112 . Between 08:11:03 UT (Figure 3u) and 08:12:32 UT (Figure 3v,w) another brightening on the eastward end of an auroral arc spreads westward through the most poleward arc of the dayside auroral oval. Figure 3v shows the fourth PMAF separating from the dayside auroral oval and moving into the polar cap. Maximum brightness occurs at ~08:13:35 UT (Figure 3x) Again, this enhanced brightness is correlated with increasing LYR X, which reaches another local maximum at 08:13 UT, see vertical line iv in Figure 2D. A few minutes later, at 08:14:24 UT (Figure 3y), the intensity of the fourth PMAF diminishes as it continues to move anti-sunward and barely visible by 08:15:03 UT. These four dayside auroral events had a green-to-red ratio that was less than 10.
We will use these examples as a reference for the following dayside auroral events which exhibit extreme brightening intensification in brightness for the upcoming examples.

3.2. 6 December 2018

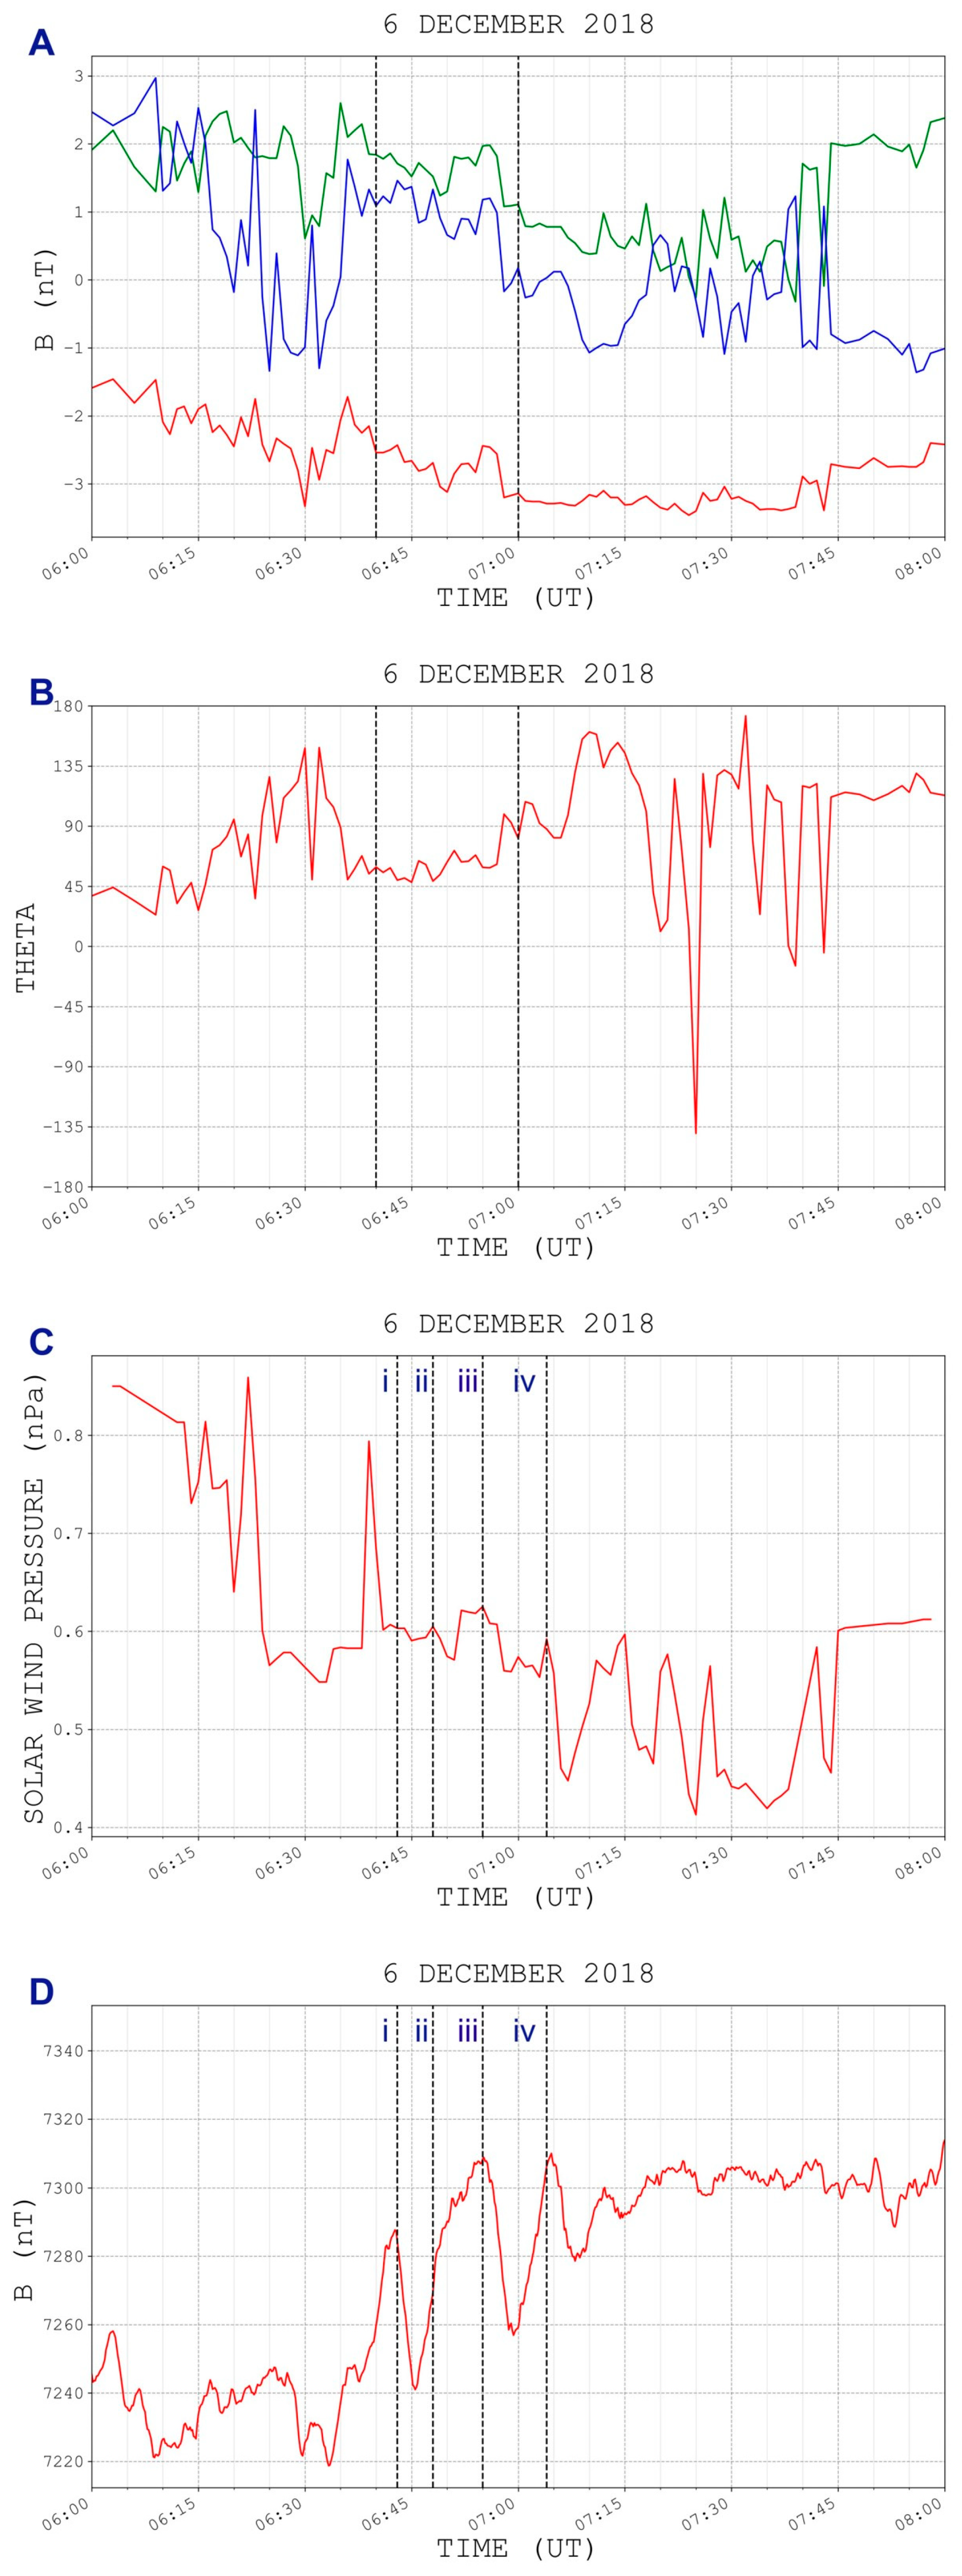
Figure 4A–D contain the IMF, clock angle, solar wind dynamic pressure, and ground magnetometer data for the ASC auroral events in Figure 5. The ASC images in Figure 5, occur for the following IMF components B x < 0 , B y > 0 , and B z > 0 , with a small clock angle: θ C A < 75 , see Figure 4A,B. The ram pressure is very low for this day and follows the density. Just before the onset of the auroral event at 06:40 UT there is a sharp increase in the solar wind pressure, left of the vertical line i in Figure 4C Δ P P = 0.266 . Pre-dawn auroral activity before 06:45 UT, consisted of elongated ray band arcs increasing and decreasing in brightness, with no poleward motion. At 06:40 UT (Figure 5a), auroral activity can be seen along with some clouds. Auroral intensification occurs shortly afterwards; see Figure 5b (06:40:18 UT). The ASC images from 06:42–06:43:18 UT (Figure 5c–e) show increasing intensification of the auroral arcs, peaking in brightness at 06:43:18 UT. This intensification coincides with the increasing LYR X-component, which has a local maximum at 06:43 UT (vertical line i in Figure 4D) and then begins decreasing. Figure 5f (06:45 UT) shows a significant decrease in auroral brightness. Auroral activity starts again after 06:45 UT, with a slight increase in brightness at 06:45:17 UT (Figure 5g). The intensification is mostly on the westward side of the ASC image. Auroral brightening intensifies between 06:45:17 UT and 06:46:17 UT (in Figure 5h, there is a steep increase in LYR X at 06:46 UT). An intensification at 06:46:55 UT (Figure 5i) is located on the western edge of the ASC image, indicated by the yellow arrow. The auroral arcs elongated along a line, connecting points between W-SW and NE-E, in the ASC image in Figure 5i have increased in brightness. These auroral intensifications coincide with the increasing LYR X-component which begins increasing at 06:46 UT, the local minimum to the right of the vertical line i in Figure 4D at 06:43 UT. By 06:47:13 UT the aforementioned intensification indicated by the yellow arrow in Figure 5i, significantly increased in brightness at 06:47:13 UT (Figure 5j). This region will act as a source for this extreme brightening event, EBE, with the intensification in brightness spreading eastward from this spot. Figure 5k (06:47:40 UT) shows that the intensification in brightness has been spreading eastward through the auroral arc system since 06:47:13 UT. By 06:48 UT (Figure 5l), there is a significant eastward extent of the extreme auroral intensification. Maximum intensification of brightness occurs at 06:48:25 UT (Figure 5m) and is elongated along a line connecting the midpoints between W-NW and NE-E. This is an EBE event. The LYR X-component which displays a sharp increase from 06:46 UT to 06:48 UT (vertical line in Figure 4D). After this time, there is a gradual increase in the LYR X-component, reaching a local maximum at 06:55 UT (vertical line iii in Figure 4D). After the maximum intensification, the brightness begins to decrease. However, there is still significant intensification at the NE end of the ASC image at 06:49 UT (Figure 5n). Figure 5o at 06:49:15 UT, shows a continued decrease in brightness from the maximum at 06:48:25 UT. By 06:49:50 UT (Figure 5p) an intensification at the western end of the auroral arc has started. This intensification spreads eastward, as can be observed in the ASC images from 06:50:06–06:51:25 UT (Figure 5q–s), reaching a maximum in brightness at 06:51:25 UT and with a slight poleward drift. The brightness in the auroral arc decreased by 06:52:18 UT (Figure 5t) and continued decreasing, see Figure 5u (06:52:44 UT). Another intensification occurs at 06:55 UT (Figure 5v) and begins spreading eastward, maxing out by 06:55:06 UT (Figure 5w). The rising and falling brightness after the EBE maximum at 06:48:25 UT, occurs simultaneously with the continued gradual increase in the LYR X-component between 06:48 and 06:55 UT. The EBE event coincided with the steep increase in the LYR X-component during the interval between 06:46 and 06:48 UT. Finally, by 06:58 UT (Figure 5x), the auroral arc is barely visible. Another brightening sequence begins at 07:02:35 UT, first intensifying on the western edge of an arc. The intensification in brightness spreads eastward, reaching a maximum at 07:04:16 UT. This intensification aligns with the local maximum in the LYR X-component at 07:04 UT; see vertical line iv in Figure 4D.

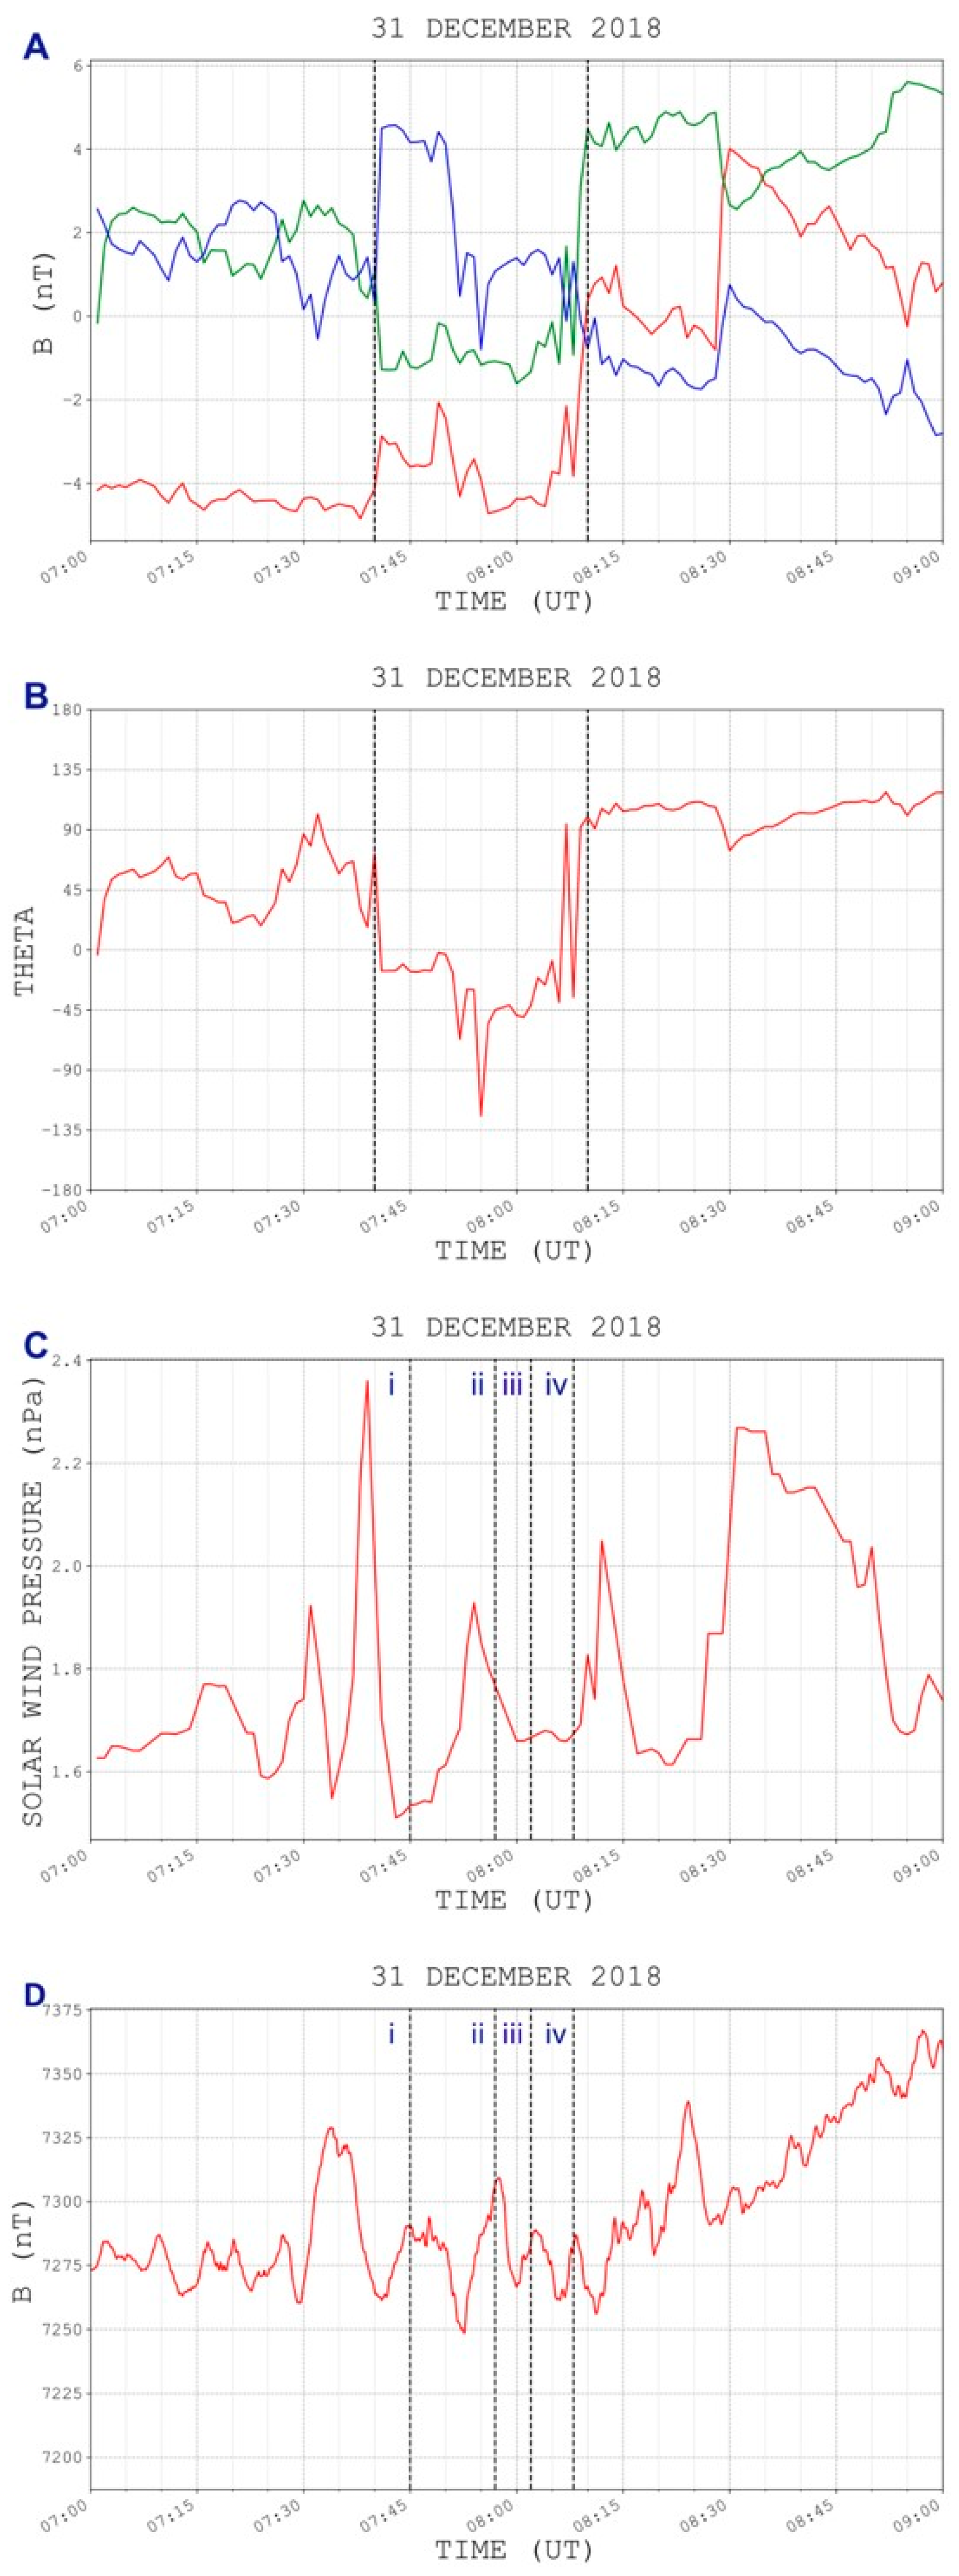
3.3. 31 December 2018

Figure 6 displays the solar wind parameters (Panels A–C) and the ground magnetometer X-component (Panel D) for the 31 December 2018 EBE. The ASC images in Figure 7 occurred for the IMF components B x < 0 , B y < 0 , and B z > 0 , where the clock angle is θ C A < 75 . There was a sharp increase in the solar wind pressure between 07:3 and 07.39 UT Δ P P = 0.344 , this spike can be seen to the right of vertical line i in Figure 6C. At 07:25:00 UT, the dayside aurora is very active with ray-banned arcs northward of the E-W line of the ASC image, with a few arcs southward. Notice that below the auroral arcs is a pulsating diffuse green aurora. Between 07:25:00 UT and 07:27:37 UT auroral brightening occurs throughout the ray-banned arcs, peaking at approximately 07:27:37 UT. The auroral arcs are now found mostly northward of the E-W line on the ASC image. The diffuse green aurora is still observed southward of the E-W line on the ASC image. Auroral activity is still very active, with intensity varying in east-west elongated rayed arcs, see the ASC images at 07:40 UT (Figure 7a) and 07:45 UT (Figure 7b). The enhanced brightening at 07:45 UT, occurs when the LYR X-component reaches a local maximum at ~7:45 UT (vertical line i in Figure 6D), after gradually increasing from a local minimum at 07:41 UT. At 07:50 UT (Figure 7c), the intensity was low, but rayed arcs can still be observed. The lower auroral brightness coincides with the decreasing LYR X-component at 7:50 UT. At 07:51 UT (Figure 7d), an auroral arc in the center of the ASC image has brightened, but mostly faded by 07:52 UT (Figure 7e). However, there was a small intensification at 07:52 UT in the auroral display in the lower arc, at the NE end of the ASC image (see the yellow arrow in Figure 7e). From this intensification, the brightness will spread westward, see the ASC image at 07:53 UT (in Figure 7f, at 07:53 UT, there is a sharp increase in LYR X). The intensification in the rays on the western side of the ASC image, also occurs at 07:53 UT. This intensification substantially increased by 07:53:23 UT (yellow arrow in Figure 7g) in the auroral arcs aligned in the SW-NE direction. Intensification on the NE part of the auroral arcs moved westward. By 07:54:41 UT (first yellow arrow in Figure 7h below the ASC NW coordinate), the rayed arcs on the western edge of the ASC image had faded (see the second yellow arrow below the ASC N-coordinate), while the elongated arcs continued to intensify, including intensification on the NE part of the middle auroral arc; it had intensified slightly from 07:53:23 UT This intensification on the NE part of the middle auroral arc, continues to move westward, which can be seen in the ASC image at 07:55:20 UT (Figure 7i). The whole elongated dayside auroral arc has significantly increased in brightness. The intensification continues propagating westward along the auroral arcs, see ASC images 07:56:10 UT (Figure 7j) through 07:58 UT (Figure 7l). The western end of the auroral arc approximately reaches maximum intensity, while the eastern end of the arc decreases in brightness. This occurs simultaneously with the increasing LYR X-component, which has a local max at ~07:57 UT (See vertical line ii in Figure 6D). This is another example of an EBE. Between 07:58 UT and 07:59 UT (Figure 7m) the brightness fades substantially. By 08:00 (Figure 7n) UT the EBE event has faded from view. Two other local maximums for the LYR X-component, 08:02 UT and 08:08 UT, coincide with two other enhanced auroral intensifications at 08:02:43 UT (Figure 7o) and 08:08:30 UT. However, these enhanced brightening’s do not spread westward/eastward through the arcs.

4. Discussion

The auroral classifications by Sandholt et al. [5] are mainly (a) discrete auroral arcs with rayed bands (Type 1 and Type 2) during intervals of northward IMF (Type 2) and southward IMF (Type 1), (b) diffuse 557.7 nm (green line emission) quasi-steady aurora (Type 3) at low latitudes for both northward and southward IMF, (c) nonhomogeneous aurora for multiple arcs with an east-west extent in the pre-noon sector (Type 4) for northward IMF, (d) multiple arcs and active spiral forms in the post noon sector (Type 5) during northward IMF intervals, and (e) single arcs in the pre-noon (Type 6) and post-noon sectors (Type 7) for periods of southward IMF. Shock aurora reported by Zhou et al. [32] found diffuse aurora combined with tailward moving auroral rays. Sandholt et al. [13] reported that steep increases in solar wind dynamic pressure/density resulted in magnetic deflections in the X-component recorded by ground magnetometer stations.
The difference in the dayside auroral activity in this study from Sandholt et al. [5], are the extreme brightening events which occur mostly in the pre-noon and noon sectors. Type 2 aurorae, which occur during northward IMF, move equatorward. The EBEs in this study occur for northward IMF, but do not move equatorward. One EBE (6 December 2018, Figure 5) drifted slightly poleward. None of the extreme brightening events examined in this study had tailward-moving auroral rays. EBE are elongated east-west arcs with embedded rays, but they were relativity stationary. Each dayside auroral brightening, enhanced or extreme, started with a sharp increase from a local minimum, in the magnetic X-component by ground magnetometers in Longyearbyen, and reached a local maximum close to the time the auroral features reached maximum brightness. Some of these were accompanied by brief pressure pulses 0.1 < Δ P P < 0.5 [13,32], but the largest ratio found was Δ P P = 0.201 (31 December 2018). The EBE for 6 December 2018 occurred with an insignificant pressure pulse Δ P P < < 0.1 . The PMAF (18 December 2017) had a ratio of Δ P P = 0.068 . The PMAF at 07:13 UT on 18 December 2017 was preceded by a pressure pulse Δ P P = 0.079 . Both events, 6 and 31 December 2018 had a green-to-red ratios greater than 15, 33.30 and 19.2 respectively. During the ASC intervals which had the maximum brightness, the intensities for both the green (557.7 nm) and red (630.0 nm) emissions were obtained from the meridian scanning photometer (MSP) instrument, located in the Kjell Henriksen Observatory. These numbers were used to calculate the green-to-red ratios.
A powerful rapid localized compression of the magnetosphere generated an ionospheric response, which resulted in an extremely energetic dayside auroral display, named a foreshock aurora [35]. Figure 8 is a different ASC image, the same ASC data set, than that in Figure 2 from Briggs et al. [35]. The Magnetospheric Multiscale (MMS) spacecraft detected a rapid compression of the bow shock/magnetosheath system, which was compressed a few Earth radii in a few minutes. The foreshock aurora exhibited intense brightening while displaying significant undulations during its development. The events reported in this study, exhibit an increased brightening which is much more extreme than that observed in the Foreshock Aurora, compare ASC images in this study (Figure 5 and Figure 7) with Figure 8. There are two differences between the foreshock aurora and the EBEs in this study: (i) extreme brightening throughout dayside auroral arcs elongated mostly in the east-west direction, and (ii) the apparent thickness of the brightening exhibited by the EBEs.

5. Conclusions

This study presents two examples of extremely brightening green to red ratios of 33.30 for 6 December 2018 and 19.2 for 31 December 2018. IMF conditions B x < 0 and B z > 0 are the common factors for all of the EBEs, with one occurring for B y > 0 and one occurring for B y < 0 . The solar wind monitors did not record any interplanetary shock that could have generated a shock aurora. The PMAF event (18 December 2017) occurred for IMF conditions conducive for low latitude reconnection and was preceded by a pressure pulse with a ratio below that needed for a brief pressure pulse Δ P P < 0.1 . The westward motion of the intensity moving through the PMAF corresponds with the IMF y-component being positive ( B y > 0 ). A brief pressure pulse preceded the EBE on 31 December 2018, but was on the low end of the ratio 0.1 < Δ P P = 0.201 < 0.5 . I would not expect this pressure pulse to generate the EBE. The other EBE on 6 December 2018 was not associated with any significant pressure pulse. High-latitude reconnection for northward IMF could be possible for the EBE events on 6th and 31st of December 2018, [9,36].
It is clear from the solar wind monitors that the EBEs are not caused by any type of pressure enhancement. However, both EBE’s are associated with enhancements in the X-component of the magnetometer data. The intensity enhancement of the EBEs is associated with the increased deviation of the magnetic X-component of the ground magnetometers. This deflection in the magnetic X-component, is due to an increase in the Hall current [37]. An increase in this component of ionospheric current system increases the flux of electrons, which then collide with the neutral oxygen atoms and generate a higher flux of the green emissions. ‘X-currents’ in the title, simply refer to the Hall currents that generate the EBEs (extreme brightening events).
One hypothesis is that these extreme brightening events may be caused by a solar wind transient. The mechanism that generated the foreshock aurora [35] and caused a rapid compression of the bow shock-magnetosheath-magnetopause is still not known. No extreme brightening occurred in the foreshock aurora. Another possibility could be due to reconnection, where enhanced J flows from the reconnection site into the polar atmosphere [38]. Future studies combining other data sets (e.g., near-Earth spacecraft, radar data) are needed to completely understand the mechanism that generates the extreme brightening events. Gaining insight into the development of these extreme brightening events will increase our knowledge of the mechanisms that transfer energy from the solar wind into the Earth’s magnetosphere during solar–terrestrial interactions.

Author Contributions

G.F.: designed the study, analyzed the data and theory, and wrote the manuscript; L.-C.L.: collaborated with G.F. on the theory and proofread the manuscript; J.M.: wrote the software to analyze the data; A.W.: analyzed data; J.P.: analyzed the data and produced the ASC image Figures; M.K.: analyzed the data; B.S.: analyzed the data; O.B.: analyzed the data; A.D.: analyzed the data; F.S.: provided the BACC all-sky camera data; D.L.: provided the meridian scanning photometer data. All authors have read and agreed to the published version of the manuscript.

Funding

This research was funded by the KECK GRANT via Pepperdine University. The work by Lou Lee is supported by the National Science and Technology Council (Taiwan) (NSTC 112-211-M-002-019).

Data Availability Statement

Link for the satellite data (WIND and ACE): https://wind.nasa.gov/mfi/, accessed on 17 February 2024. Link to the Kjell Henriksen Observatory site for the ground-based data: http://kho.unis.no/, accessed on 17 February 2024. More information on the Boreal Aurora Camera Constellation is also available via this link: http://kho.unis.no/, accessed on 17 February 2024.

Acknowledgments

“We thank the institutes who maintain the IMAGE Magnetometer Array: Tromsø Geophysical Observatory of UiT the Arctic University of Norway (Norway), Finnish Meteorological Institute (Finland), Institute of Geophysics Polish Academy of Sciences (Poland), GFZ German Research Centre for Geosciences (Germany), Geological Survey of Sweden (Sweden), Swedish Institute of Space Physics (Sweden), Sodankylä Geophysical Observatory of the University of Oulu (Finland), DTU Technical University of Denmark (Denmark), National Science and Technology Council (Taiwan) and Science Institute of the University of Iceland (Iceland). The provisioning of data from AAL, GOT, HAS, NRA, VXJ, FKP, SIN, BOR, SCO and KUL is supported by the ESA contracts number 4000128139/19/D/CT as well as 4000138064/22/D/KS.” The authors would like to thank Fred Sigernes, Chief Scientist at the Kjell Henriksen Observatory, for the ground-based optical data (all-sky camera and meridian scanning photometer). The authors would also like to thank NASA for providing access to their satellite data.

Conflicts of Interest

The authors declare no conflict of interest.

References

  1. Frey, H.; Han, D.-S.; Kataoka, R.; Lessard, M.; Milan, S.; Nishimura, Y.; Strangeway, R.; Zou, Y. Dayside Aurora. Space Sci. Rev. 2019, 215, 51. [Google Scholar] [CrossRef]
  2. Hosokawa, K.; Kullen, A.; Milan, S.; Reidy, J.; Zou, Y.; Frey, H.U.; Maggiolo, R.; Fear, R. Aurora in the Polar Cap: A Review. Space Sci. Rev. 2020, 216, 15. [Google Scholar] [CrossRef]
  3. Zhang, J.; Temmer, M.; Gopalswamy, N.; Malandraki, O.; Nitta, N.V.; Patsourakos, S.; Shen, F.; Vršnak, B.; Wang, Y.; Webb, D.; et al. Earth-affecting solar transients: A review of progresses in solar cycle 24. Prog. Earth Planet. Sci. 2021, 8, 56. [Google Scholar] [CrossRef] [PubMed]
  4. Burlaga, L.; Sittler, E.; Mariani, F.; Schwenn, R. Magnetic loop behind an interplanetary shock: Voyager, Helios, and IMP 8 observations. J. Geophys. Res. 1981, 86, 6673. [Google Scholar] [CrossRef]
  5. Sandholt, P.E.; Farrugia, C.J.; Moen, J.; Noraberg, Ø.; Lybekk, B.; Sten, T.; Hansen, T. A classification of dayside auroral forms and activities as a function of interplanetary magnetic field orientation. J. Geophys. Res. Space Phys. 1998, 103, 23325–23345. [Google Scholar] [CrossRef]
  6. Øieroset, M.; Sandholt, P.E.; Denig, W.F.; Cowley, S.W.H. Northward interplanetary magnetic field cusp aurora and high-latitude magnetopause reconnection. J. Geophys. Res. Space Phys. 1997, 102, 11349–11362. [Google Scholar] [CrossRef]
  7. Sandholt, E.; Farrugia, C.J.; Cowley, S.W.H.; Lester, M.; Denig, W.F.; Cerisier, J.-C.; Milan, S.E.; Moen, J.; Trondsen, E.; Lybekk, B. Dynamic cusp aurora and associated pulsed reverse convection during northward interplanetary magnetic field. J. Geophys. Res. Space Phys. 2000, 105, 12869–12894. [Google Scholar] [CrossRef]
  8. Sandholt, E.; Farrugia, C.J.; Cowley, S.W.H.; Lester, M.; Cerisier, J.C. Excitation of transient lobe cell convection and auroral arc at the cusp poleward boundary during a transition of the interplanetary magnetic field from south to north. Ann. Geophys. 2001, 19, 487–493. [Google Scholar] [CrossRef]
  9. Sandholt, E.; Farrugia, C.J.; Øieroset, M.; Stauning, P.; Cowley, S.W.H. Auroral signature of lobe reconnection. Geophys. Res. Lett. 1996, 23, 1725–1728. [Google Scholar] [CrossRef]
  10. Sandholt, E.; Farrugia, C.; Denig, W. Dayside Aurora and the Role of IMF\By\/\Bz\: Detailed Morphology and Response to Magnetopause Reconnection. Ann. Geophys. 2004, 22, 613–628. [Google Scholar] [CrossRef]
  11. Lockwood, M.; Moen, J. Reconfiguration and closure of lobe flux by reconnection during northward IMF: Possible evidence for signatures in cusp/cleft auroral emissions. Ann. Geophys. 1999, 17, 996–1011. [Google Scholar] [CrossRef]
  12. Sandholt, E.; Farrugia, C.J.; Cowley, S.W.H.; Denig, W.F.; Lester, M.; Moen, J.; Lybekk, B. Capture of magnetosheath plasma by the magnetosphere during northward IMF. Geophys. Res. Lett. 1999, 26, 2833–2836. [Google Scholar] [CrossRef]
  13. Sandholt, E.; Farrugia, C.J.; Burlaga, L.F.; Holtet, J.A.; Moen, J.; Lybekk, B.; Jacobsen, B.; Opsvik, D.; Egeland, A.; Lepping, R.; et al. Cusp/cleft auroral activity in relation to solar wind dynamic pressure, interplanetary magnetic field Bz and By. J. Geophys. Res. Space Phys. 1994, 99, 17323–17342. [Google Scholar] [CrossRef]
  14. Horwitz, J.L.; Akasofu, S.-I. The response of the dayside aurora to sharp northward and southward transitions of the interplanetary magnetic field and to magnetospheric substorms. J. Geophys. Res. 1977, 82, 2723–2734. [Google Scholar] [CrossRef]
  15. Rairden, R.L.; Mende, S.B. Properties of 6300-Å auroral emissions at South Pole. J. Geophys. Res. Space Phys. 1989, 94, 1402–1416. [Google Scholar] [CrossRef]
  16. Fasel, G.J.; Lee, L.C.; Smith, R.W. A mechanism for the multiple brightenings of dayside poleward-moving auroral forms. Geophys. Res. Lett. 1993, 20, 2247–2250. [Google Scholar] [CrossRef]
  17. Fasel, G.J. Dayside poleward moving auroral forms: A statistical study. J. Geophys. Res. Space Phys. 1995, 100, 11891–11905. [Google Scholar] [CrossRef]
  18. Xing, Z.Y.; Yang, H.G.; Han, D.S.; Wu, Z.S.; Hu, Z.J.; Zhang, Q.H.; Kamide, Y.; Hu, H.Q.; Zhang, B.C.; Liu, J.M.; et al. Poleward moving auroral forms (PMAFs) observed at the Yellow River Station: A statistical study of its dependence on the solar wind conditions. J. Atmos. Sol.-Terr. Phys. 2012, 86, 25–33. [Google Scholar] [CrossRef]
  19. Drury, E.E.; Mende, S.B.; Frey, H.U.; Doolittle, J.H. Southern Hemisphere poleward moving auroral forms. J. Geophys. Res. Space Phys. 2003, 108, 1114. [Google Scholar] [CrossRef]
  20. Sandholt, P.E.; Farrugia, C.J. Poleward moving auroral forms (PMAFs) revisited: Responses of aurorae, plasma convection and Birkeland currents in the pre- and postnoon sectors under positive and negative IMF By conditions. Ann. Geophys. 2007, 25, 1629–1652. [Google Scholar] [CrossRef]
  21. Sandholt, P.E.; Farrugia, C.J.; Moen, J.; Cowley, S.W.H.; Lybekk, B. Dynamics of the aurora and associated convection currents during a cusp bifurcation event. Geophys. Res. Lett. 1998, 25, 4313–4316. [Google Scholar] [CrossRef]
  22. Carter, J.A.; Milan, S.E.; Fear, R.C.; Kullen, A.; Hairston, M.R. Dayside reconnection under interplanetary magnetic field By-dominated conditions: The formation and movement of bending arcs. J. Geophys. Res. Space Phys. 2015, 120, 2967–2978. [Google Scholar] [CrossRef]
  23. Frey, H.U.; Mende, S.B.; Immel, T.J.; Fuselier, S.A.; Claflin, E.S.; Gérard, J.-C.; Hubert, B. Proton aurora in the cusp. J. Geophys. Res. Space Phys. 2002, 107, SMP 2-1–SMP 2-17. [Google Scholar] [CrossRef]
  24. Fear, R.C.; Milan, S.E.; Carter, J.A.; Maggiolo, R. The interaction between transpolar arcs and cusp spots. Geophys. Res. Lett. 2015, 42, 9685–9693. [Google Scholar] [CrossRef]
  25. Milan, S.E.; Evans, T.A.; Hubert, B. Average auroral configuration parameterized by geomagnetic activity and solar wind conditions. Ann. Geophys. 2010, 28, 1003–1012. [Google Scholar] [CrossRef]
  26. Han, D.-S.; Hietala, H.; Chen, X.C.; Nishimura, Y.; Lyons, L.R.; Liu, J.J.; Hu, H.Q.; Yang, H.G. Observational properties of dayside throat aurora and implications on the possible generation mechanisms. J. Geophys. Res. Space Phys. 2017, 122, 1853–1870. [Google Scholar] [CrossRef]
  27. Han, D.-S.; Nishimura, Y.; Lyons, L.R.; Hu, H.Q.; Yang, H.G. Throat aurora: The ionospheric signature of magnetosheath particles penetrating into the magnetosphere. Geophys. Res. Lett. 2016, 43, 1819–1827. [Google Scholar] [CrossRef]
  28. Han, D.-S.; Xu, T.; Jin, Y.; Oksavik, K.; Chen, X.C.; Liu, J.J.; Zhang, Q.; Baddeley, L.; Herlingshaw, K. Observational Evidence for Throat Aurora Being Associated With Magnetopause Reconnection. Geophys. Res. Lett. 2019, 46, 7113–7120. [Google Scholar] [CrossRef]
  29. Rodriguez, J.V.; Carlson, H.C.; Heelis, R.A. Auroral forms that extend equatorward from the persistent midday aurora during geomagnetically quiet periods. J. Atmos. Sol.-Terr. Phys. 2012, 86, 6–24. [Google Scholar] [CrossRef]
  30. Tanskanen, E.I. A comprehensive high-throughput analysis of substorms observed by IMAGE magnetometer network: Years 1993–2003 examined. J. Geophys. Res. Space Phys. 2009, 114. [Google Scholar] [CrossRef]
  31. Fasel, G.J.; Lee, L.C.; Lake, E.; Csonge, D.; Yonano, B.; Bradley, O.; Briggs, J.; Lee, S.H.; Mann, J.; Sigernes, F.; et al. Correlation between the solar wind speed and the passage of poleward-moving auroral forms into the polar cap. Front. Astron. Space Sci. 2024, 10, 1233060. [Google Scholar] [CrossRef]
  32. Zhou, X.Y.; Fukui, K.; Carlson, H.C.; Moen, J.I.; Strangeway, R.J. Shock aurora: Ground-based imager observations. J. Geophys. Res. Space Phys. 2009, 114, A12216. [Google Scholar] [CrossRef]
  33. Sigernes, F.; Syrjasuo, M.; Ellingsen, P.G.; Lybekk, B.; Trondsen, E.; Clausen, L.; Moen, J.; Mattanen, J.; Kauristie, K. Status: The Boreal Aurora Camera Constellation (BACC); UNIS: Longyearbyen, Svalbard and Jan Mayen, 2017; pp. 1–15. [Google Scholar]
  34. Twitty, C.; Phan, T.D.; Paschmann, G.; Lavraud, B.; Rème, H.; Dunlop, M. Cluster survey of cusp reconnection and its IMF dependence. Geophys. Res. Lett. 2004, 31, L19808. [Google Scholar] [CrossRef]
  35. Briggs, J.K.; Fasel, G.J.; Silveira, M.; Sibeck, D.G.; Lin, Y.; Sigernes, F. Dayside Auroral Observation Resulting From a Rapid Localized Compression of the Earth’s Magnetic Field. Geophys. Res. Lett. 2020, 47, e2020GL088995. [Google Scholar] [CrossRef]
  36. Trattner, K.; Fuselier, S.A.; Petrinec, S.M. Location of the reconnection line for northward interplanetary magnetic field. J. Geophys. Res. Space Phys. 2004, 109, A03219. [Google Scholar] [CrossRef]
  37. Cowley, S.W.H. Magnetosphere-Ionosphere Interactions: A Tutorial Review. In Magnetospheric Current Systems; American Geophysical Union: Washington, DC, USA, 2000; pp. 91–106. [Google Scholar] [CrossRef]
  38. Lanzerotti, L.J.; Lee, L.C.; Maclennan, C.G.; Wolfe, A.; Medford, L.V. Possible evidence of flux transfer events in the polar ionosphere. Geophys. Res. Lett. 1986, 13, 1089–1092. [Google Scholar] [CrossRef]
Figure 1. The geographic coordinates are given on the ASC images. ASC images for 18 December 2017 for Region I, 07:09–07:15 UT. This series of ASC images, (ae), shows the evolution of poleward-moving auroral forms for a typical dayside aurora during southward IMF conditions (see Figure 2A, Region I for the IMF conditions). (a) shows a PMAF moving away from the auroral oval (red arrow) and one beginning to brighten (yellow arrow). (b) shows the same two PMAFs (red and yellow arrows) first seen in (a), both PMAFs have moved anti-sunward. (c,d) show both PMAFs approaching and passing the east-west boundary depicted by the yellow line in (d). (e) shows the extent of the anti-sunward journey of the PMAF highlighted by the yellow arrow.
Universe 10 00216 g001
Figure 2. IMF data (1 min BSN-time shifted data) from the DSCOVR spacecraft (XGSE ≈ 231.36 RE, YGSE ≈ 39.58 RE, ZGSE ≈ –4.7 RE) for 18 December 2017. (A) contains the IMF components: B x (red), B y (green), and B z (blue). (B) is the clock angle obtained from the IMF B y and B z -components. (C) is the solar wind pressure. (D) is the X-component (the X-component is directed toward the north geographic-pole) at Longyearbyen (LYR X) from the IMAGE magnetometer chain. Vertical lines in the top 2 panels identify 2 regions for the ASC images. Region I is the ASC time interval 07:09–07:15 UT and Region II is the ASC time interval: 07:50–08:20 UT. The vertical lines (labeled by Roman numerals to the left of the vertical line: i, ii, iii, and iv) in Panels (C,D) correspond to the time of the peaks: (i) 7:13 UT, (ii) 7:55 UT, (iii) 8:04 UT, and (iv) 08:13 UT for LYR X.
Universe 10 00216 g002
Figure 3. ASC images for 18 December 2017 for Region II (07:50–08:15 UT, (ay)) in Figure 2C,D. Figure 3 shows the evolution and anti-sunward propagation of 4 PMAF events. The evolution of the first PMAF originates when the most poleward arc of the dayside auroral oval begins to brighten at its most eastward end (a) and drifts anti-sunward until (l), where it begins to fade from view. (lr) show the evolution of the second PMAF, again brightening on eastward end of the most poleward dayside auroral arc (l), drifting anti-sunward before it fades from view (qs). The evolution of the third PMAF is displayed in (su), with the yellow arrow indicating the initial brightening at the eastward end of the most poleward arc in the dayside auroral oval. Finally, the fourth PMAF is shown from (uy). The green to red emission line ratio is less than 10. The intensities for both the green (557.7 nm) and red (630.0 nm) emissions were obtained from the meridian scanning photometer (MSP) instrument, located in the Kjell Henriksen Observatory. Geographic coordinates are similar to Figure 1.
Universe 10 00216 g003
Figure 4. IMF data (1 min BSN-time shifted data) from the DSCOVR spacecraft (XGSE = 233.12 RE, YGSE = 38.86 RE, and ZGSE = 3.23 RE) for 6 December 2018. Panel (A) contains the IMF components: B x (red), B y (green), and B z (blue). Panel (B) is the clock angle obtained from the IMF B y and B z -components. Panel (C) is the solar wind pressure. Panel (D) is the LYR X-component from the IMAGE magnetometer chain. Vertical lines in the top 2 panels identify the time interval, 6:40–07:00 UT, for the ASC images. The vertical lines (represented by Roman numerals to the left of the line: i, ii, iii, and iv) in panels (C,D) correspond to the time of the peaks: (i) 06:43 UT, (ii) 06:48 UT, (iii) 06:55 UT, and (iv) 07:04 UT for the LYR X-component.
Universe 10 00216 g004
Figure 5. ASC images for 6 December 2018, for the time interval: 06:40–07:00 UT. The IMF for this interval is: B x < 0 , B y > 0 , and B z > 0 , see Figure 4A. (ag) show the dayside auroral oval conditions before the onset of the extreme brightening. (h) shows the auroral arcs beginning to intensify. (i) shows the beginning of the extreme brightening phase, with the yellow arrow denoting the initial brightening location. (en) contain the extreme brightening phase. (oy) contains the post extreme brightening dayside aurora. Notice the thickness and extreme brightness in image 7m. The green-to-red ratio is 33.30 for this event. The intensities for both the green (557.7 nm) and red (630.0 nm) emissions were obtained from the meridian Scanning photometer (MSP) instrument, located in the Kjell Henriksen Observatory. Geographic coordinates are similar to Figure 1.
Universe 10 00216 g005
Figure 6. IMF data (1 min BSN-time shifted data) from the DSCOVR spacecraft (XGSE = 241.3 RE, YGSE = 14 RE, and ZGSE = −18.8 RE) for 31 December 2018. Panel (A) contains the IMF components: B x (red), B y (green), and B z (blue). Panel (B) is the clock angle obtained from the IMF B y and B z -components. Panel (C) is the solar wind pressure. Panel (D) is the LYR X-component from the IMAGE magnetometer chain. Vertical lines in the top 2 panels identify the time interval, 7:40–08:10 UT, for the ASC images. The vertical lines (represented by Roman numerals to the left of the line: i, ii, iii, and iv) in Panels (C,D) correspond to time of the peaks: (i) 07:45 UT, (ii) 07:57 UT, (iii) 08:02 UT, and (iv) 08:08 UT for the LYR X-component.
Universe 10 00216 g006
Figure 7. ASC image for 31 December 2018. B x < 0 , B y < 0 , and B z > 0 . (ad) show the dayside auroral oval conditions before the onset of the extreme brightening. (e) shows the auroral arcs beginning to intensify. (e,f) shows the beginning of the active aurora period, with the yellow arrow denoting the initial brightening location (see (e)) and the subsequent enhanced brightening (see (f)). (g) points to the next active auroral brightening area. (h) points to the region where auroral brightening begins to fade after intensifying in (g), as the arcs aligned with W-NE begin the extreme brightening phase. (il) contain the extreme brightening phase. (mo) contains the post extreme brightening dayside aurora. Notice the extreme brightness and thickness in image (j). The green to red ratio is 19.2. The intensities for both the green (557.7 nm) and red (630.0 nm) emissions were obtained from the meridian scanning photometer (MSP) instrument, located in the Kjell Henriksen Observatory. Geographic coordinates are similar to Figure 1.
Universe 10 00216 g007
Figure 8. ASC image for 10 December 2016. This is the foreshock aurora due to a rapid compression of the bow shock/magnetosheath system, which was compressed approximately a few RE in a few minutes [35]. The green-to-red ratio was less than 10. The intensities for both the green (557.7 nm) and red (630.0 nm) emissions are obtained from the meridian scanning photometer (MSP) instrument, located in the Kjell Henriksen Observatory. Geographic coordinates are similar to Figure 1.
Universe 10 00216 g008
Disclaimer/Publisher’s Note: The statements, opinions and data contained in all publications are solely those of the individual author(s) and contributor(s) and not of MDPI and/or the editor(s). MDPI and/or the editor(s) disclaim responsibility for any injury to people or property resulting from any ideas, methods, instructions or products referred to in the content.