Article

Minute-Cadence Observations of the LAMOST Fields with the TMTS: IV—Catalog of Cataclysmic Variables from the First 3-yr Survey

by
Qichun Liu
1,
Jie Lin
1,2,3,*,
Xiaofeng Wang
1,*,
Zhibin Dai
4,5,
Yongkang Sun
6,7,
Gaobo Xi
1,
Jun Mo
1,
Jialian Liu
1,
Shengyu Yan
1,
Alexei V. Filippenko
8,
Thomas G. Brink
8,
Yi Yang
1,8,
Kishore C. Patra
8,
Yongzhi Cai
4,5,9,
Zhihao Chen
1,
Liyang Chen
1,
Fangzhou Guo
1,
Xiaojun Jiang
7,10,11,
Gaici Li
1,
Wenxiong Li
10,
Weili Lin
12,
Cheng Miao
1,
Xiaoran Ma
1,
Haowei Peng
1,
Qiqi Xia
1,
Danfeng Xiang
1 and
Jicheng Zhang
13
add Show full author list remove Hide full author list
1
Physics Department and Tsinghua Center for Astrophysics, Tsinghua University, Beijing 100084, China
2
CAS Key Laboratory for Research in Galaxies and Cosmology, Department of Astronomy, University of Science and Technology of China, Hefei 230026, China
3
School of Astronomy and Space Sciences, University of Science and Technology of China, Hefei 230026, China
4
Yunnan Observatories, Chinese Academy of Sciences, Kunming 650216, China
5
Key Laboratory for the Structure and Evolution of Celestial Objects, Chinese Academy of Sciences, Kunming 650216, China
6
National Astronomical Observatories, Chinese Academy of Sciences, Beijing 100101, China
7
School of Astronomy and Space Science, University of Chinese Academy of Sciences, Beijing 100049, China
8
Department of Astronomy, University of California, Berkeley, CA 94720-3411, USA
9
International Centre of Supernovae, Yunnan Key Laboratory, Kunming 650216, China
10
CAS Key Laboratory of Optical Astronomy, National Astronomical Observatories, Chinese Academy of Sciences, Beijing 100101, China
11
Center for Astronomical Mega-Science, Chinese Academy of Sciences, 20A Datun Road, Chaoyang District, Beijing 100101, China
12
Department of Astronomy, Xiamen University, Xiamen 361005, China
13
Department of Astronomy, Beijing Normal University, Beijing 100875, China
*
Authors to whom correspondence should be addressed.
Universe 2024, 10(9), 337; https://doi.org/10.3390/universe10090337
Submission received: 18 July 2024 / Revised: 16 August 2024 / Accepted: 20 August 2024 / Published: 23 August 2024

Abstract

:
The Tsinghua University–Ma Huateng Telescopes for Survey (TMTS) started to monitor the LAMOST plates in 2020, leading to the discovery of numerous short-period eclipsing binaries, peculiar pulsators, flare stars, and other variable objects. Here, we present the uninterrupted light curves for a sample of 64 cataclysmic variables (CVs) observed/discovered using the TMTS during its first three-year observations, and we introduce new CVs and new light-variation periods (from known CVs) revealed through the TMTS observations. Thanks to the high-cadence observations of TMTS, diverse light variations, including superhumps, quasi-periodic oscillations, large-amplitude orbital modulations, and rotational modulations, are able to be detected in our CV samples, providing key observational clues for understanding the fast-developing physical processes in various CVs. All of these short-timescale light-curve features help further classify the subtypes of CV systems. We highlight the light-curve features observed in our CV sample and discuss further implications of minute-cadence light curves for CV identifications and classifications. Moreover, we examine the Hα emission lines in the spectra from our nonmagnetic CV samples (i.e., dwarf novae and nova-like subclasses) and find that the distribution of Hα emission strength shows significant differences between the sources with orbital periods above and below the period gap, which agrees with the trend seen from the SDSS nonmagnetic CV sample.

1. Introduction

Cataclysmic variables (CVs) are semidetached binaries consisting of a white dwarf (WD) and a Roche-lobe-overflowing low-mass companion that is usually on or near the late-type main sequence. Observations of CVs provide opportunities to study accretion theories, the physics of compact objects, and the evolution of WD binaries, as some of them may ultimately end as Type Ia supernova explosions [1,2] or form an AM CVn system with mHz gravitational waves (GWs) detected via space-born GW observatories [3,4,5,6].
In CV systems, material from the donor star will be accreted onto the WD companion through the inner Lagrangian point L 1 [7] and form a surrounding accretion disc or fall into the magnetic poles of the WD, depending on the strength of the WD’s magnetic field. Nonmagnetic CVs have two main subclasses, namely dwarf novae (DNe) and nova-like variables (NLs), which are both disk-dominant systems. The dominant difference between them is that the DN subclass undergoes recurrent outbursts, while the NL subclass does not [8]. In comparison, magnetic CVs can also be divided into two subclasses, intermediate polars (IPs, or DQ Her) with weak magnetic fields and polars (or AM Her/AM) with stronger magnetic fields (e.g., 10–200 MG) [9]. The magnetic fields of IPs are not strong enough to prevent the formation of a disk, while their accretion mode may switch among different states (i.e., high/low state) [10]. Owing to the strong magnetic fields of polars, their accreted material follows the magnetic field lines to reach directly near the WD’s magnetic poles and form accretion columns. The collision of subsonic falling flows against the WD photosphere leads to the formation of a shock, and the shock-heated emission contributes significantly to the radiation of polars [11,12].
Superhumps are the periodic light-curve modulations of CVs with a photometric period comparable to their orbital period and an amplitude of about 0.3–0.4 mag [7]. The modulation period is slightly longer than the orbital period in positive superhumps (pSHs), while the modulation period is shorter than the orbital period in negative superhumps (nSHs) [13]. The pSHs were proposed to be induced via tidal instability in the disk [14]. Tidal interaction with the secondary will impose an elliptical deformation to the disc [15] when it expands to the 3:1 resonance region during the outburst. The precession of the eccentric accretion disk results in the light-curve modulations seen in those pSHs. In contrast, the nSHs are believed to be the retrograde precession of a tilted disk [16,17].
A prominent property of the CV population is the 2–3 H orbital period gap [18]. In binary evolution theories, angular-momentum loss (AML) can drive the orbital contraction of CVs. Magnetic braking is the dominant driving mechanism of AML for long-period CVs, leading to a typical mass-transfer rate of M ˙ 10 9 10 8 M yr 1 [19], while GW radiation is the dominant AML mechanism for those short-period CVs, and it induces a mass-transfer rate of M ˙ 5 × 10 11 M yr 1 [20].
The spectra of CV systems usually show H α emission, which is thought to be related to the optically thin outer regions of the disks [21]. High-inclination CV systems even exhibit obvious double-peaked profiles due to Doppler broadening. However, during outburst, DNe tend to show narrow Balmer emission lines with broad absorption wings, which can be explained by a hot, optically thick disk with a relatively cool and optically thin outer region [22]. Sarty and Wu [23] adopted a discriminant function and principal-component analysis to study the ratios of Balmer emission lines, and they found that the discriminant function can separate DNe from other subclasses.
Based on the well-sampled light curves from several telescopes like Kepler [24] and the Transiting Exoplanet Survey Satellite (TESS; Ricker et al. [25]), light variations intrinsic to CVs have been examined [13,26,27], which helps improve our understanding of accretion instability. TMTS can also provide well-sampled light curves for CVs; it is a multitube telescope system consisting of four 40 cm optical telescopes, and it has a field of view (FoV) of up to about 18 deg 2 [28]. This facility has discovered/monitored over 1100 short-period variable sources during the first two-year monitoring of the Large Sky Area Multi-Object Fiber Spectroscopic Telescope (LAMOST; Cui et al. [29], Zhao et al. [30]) skyfields, including eclipsing binaries, pulsating stars, cataclysmic variables, and so on [31,32,33,34,35,36]. This paper aims to release the light curves of CVs and the candidates identified in the first 3 yr, and it presents the analysis of their periodicities, light-curve features, and spectroscopic properties.

2. Observations and Data Analysis

2.1. TMTS CV Sample

In the first 3 yr survey, TMTS covered a total of 6977 deg 2 (449 LAMOST/TMTS plates with more than 100 visits), and it produced 19,099,266 uninterrupted light curves with at least 100 valid measurements for about 20 million sources. After cross-matching the CV catalog that contains 5478 CVs and CV candidates from the SIMBAD database [37] and other works in the literature [38,39,40,41], we obtained the light curves for a total of 57 CVs and 5 CV candidates. Additionally, this work includes two new CV candidates that were first discovered through TMTS—TMTS J04405040+6820355 and TMTS J06183036+5105550. Among the 64 CV samples, 57 have been included in the International Variable Star Index (VSX) [42], with classifications recorded as 29 DNe, 12 NLs, 11 IPs, and 5 AMs.
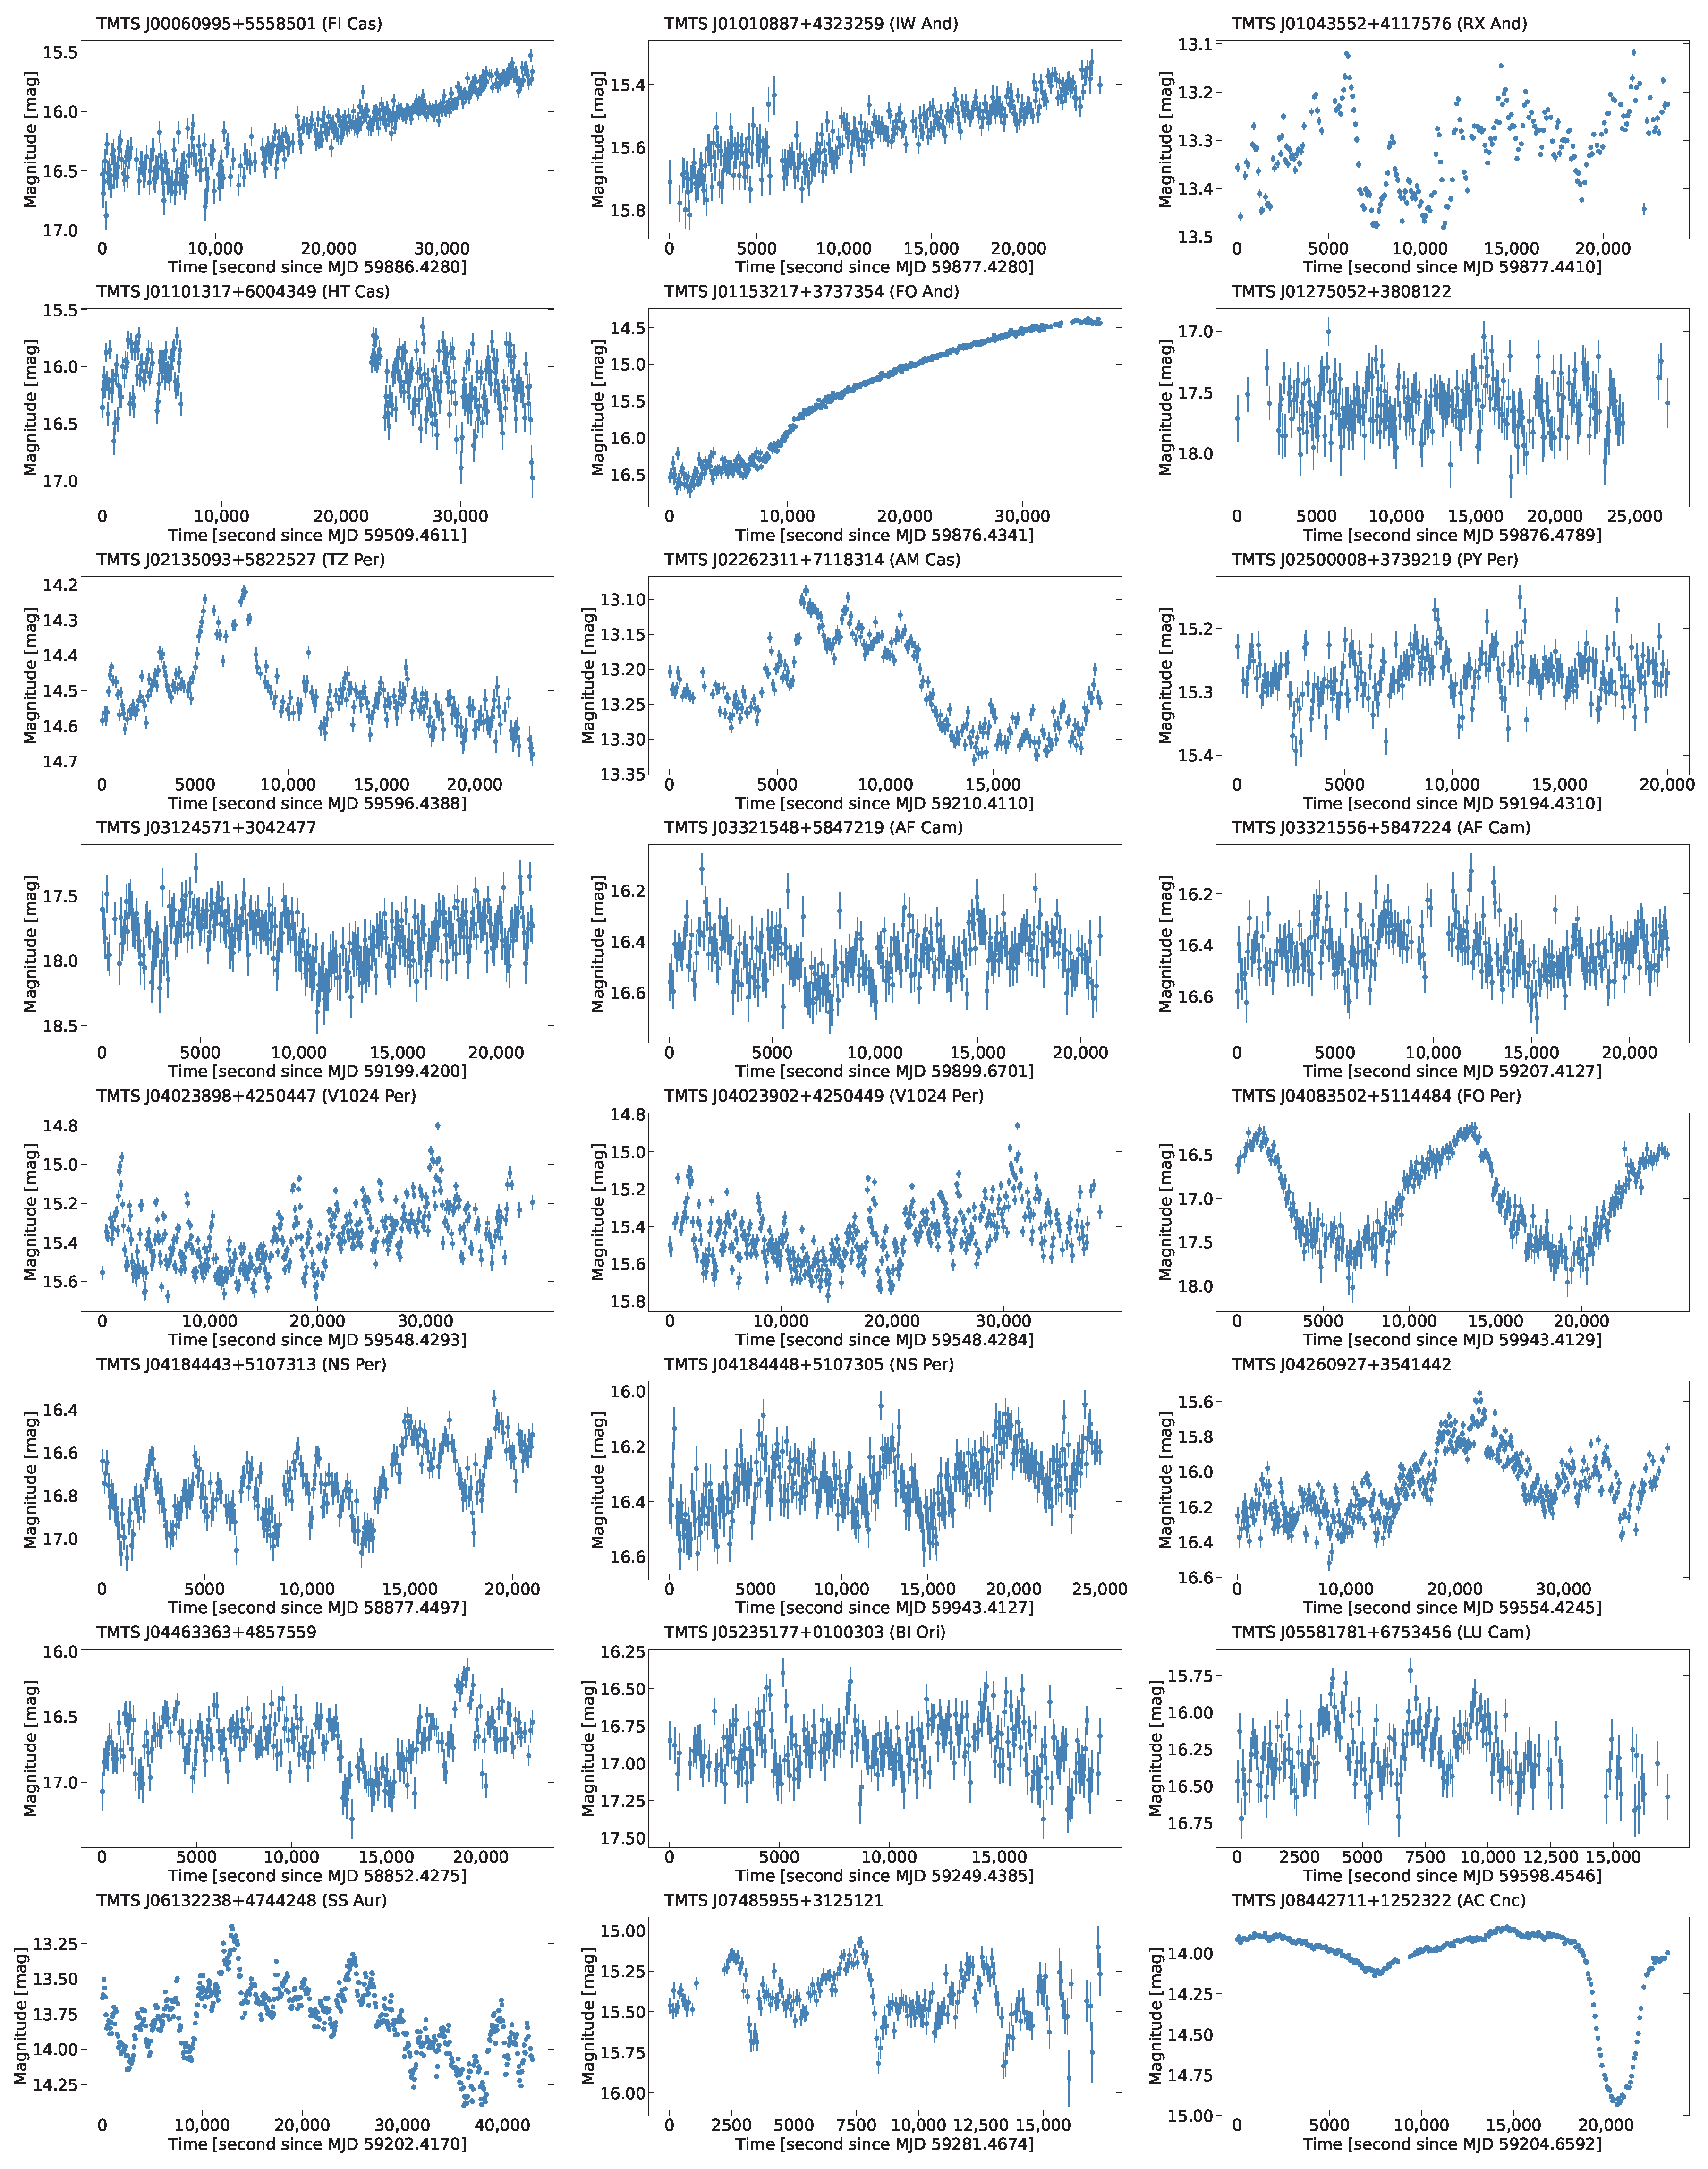
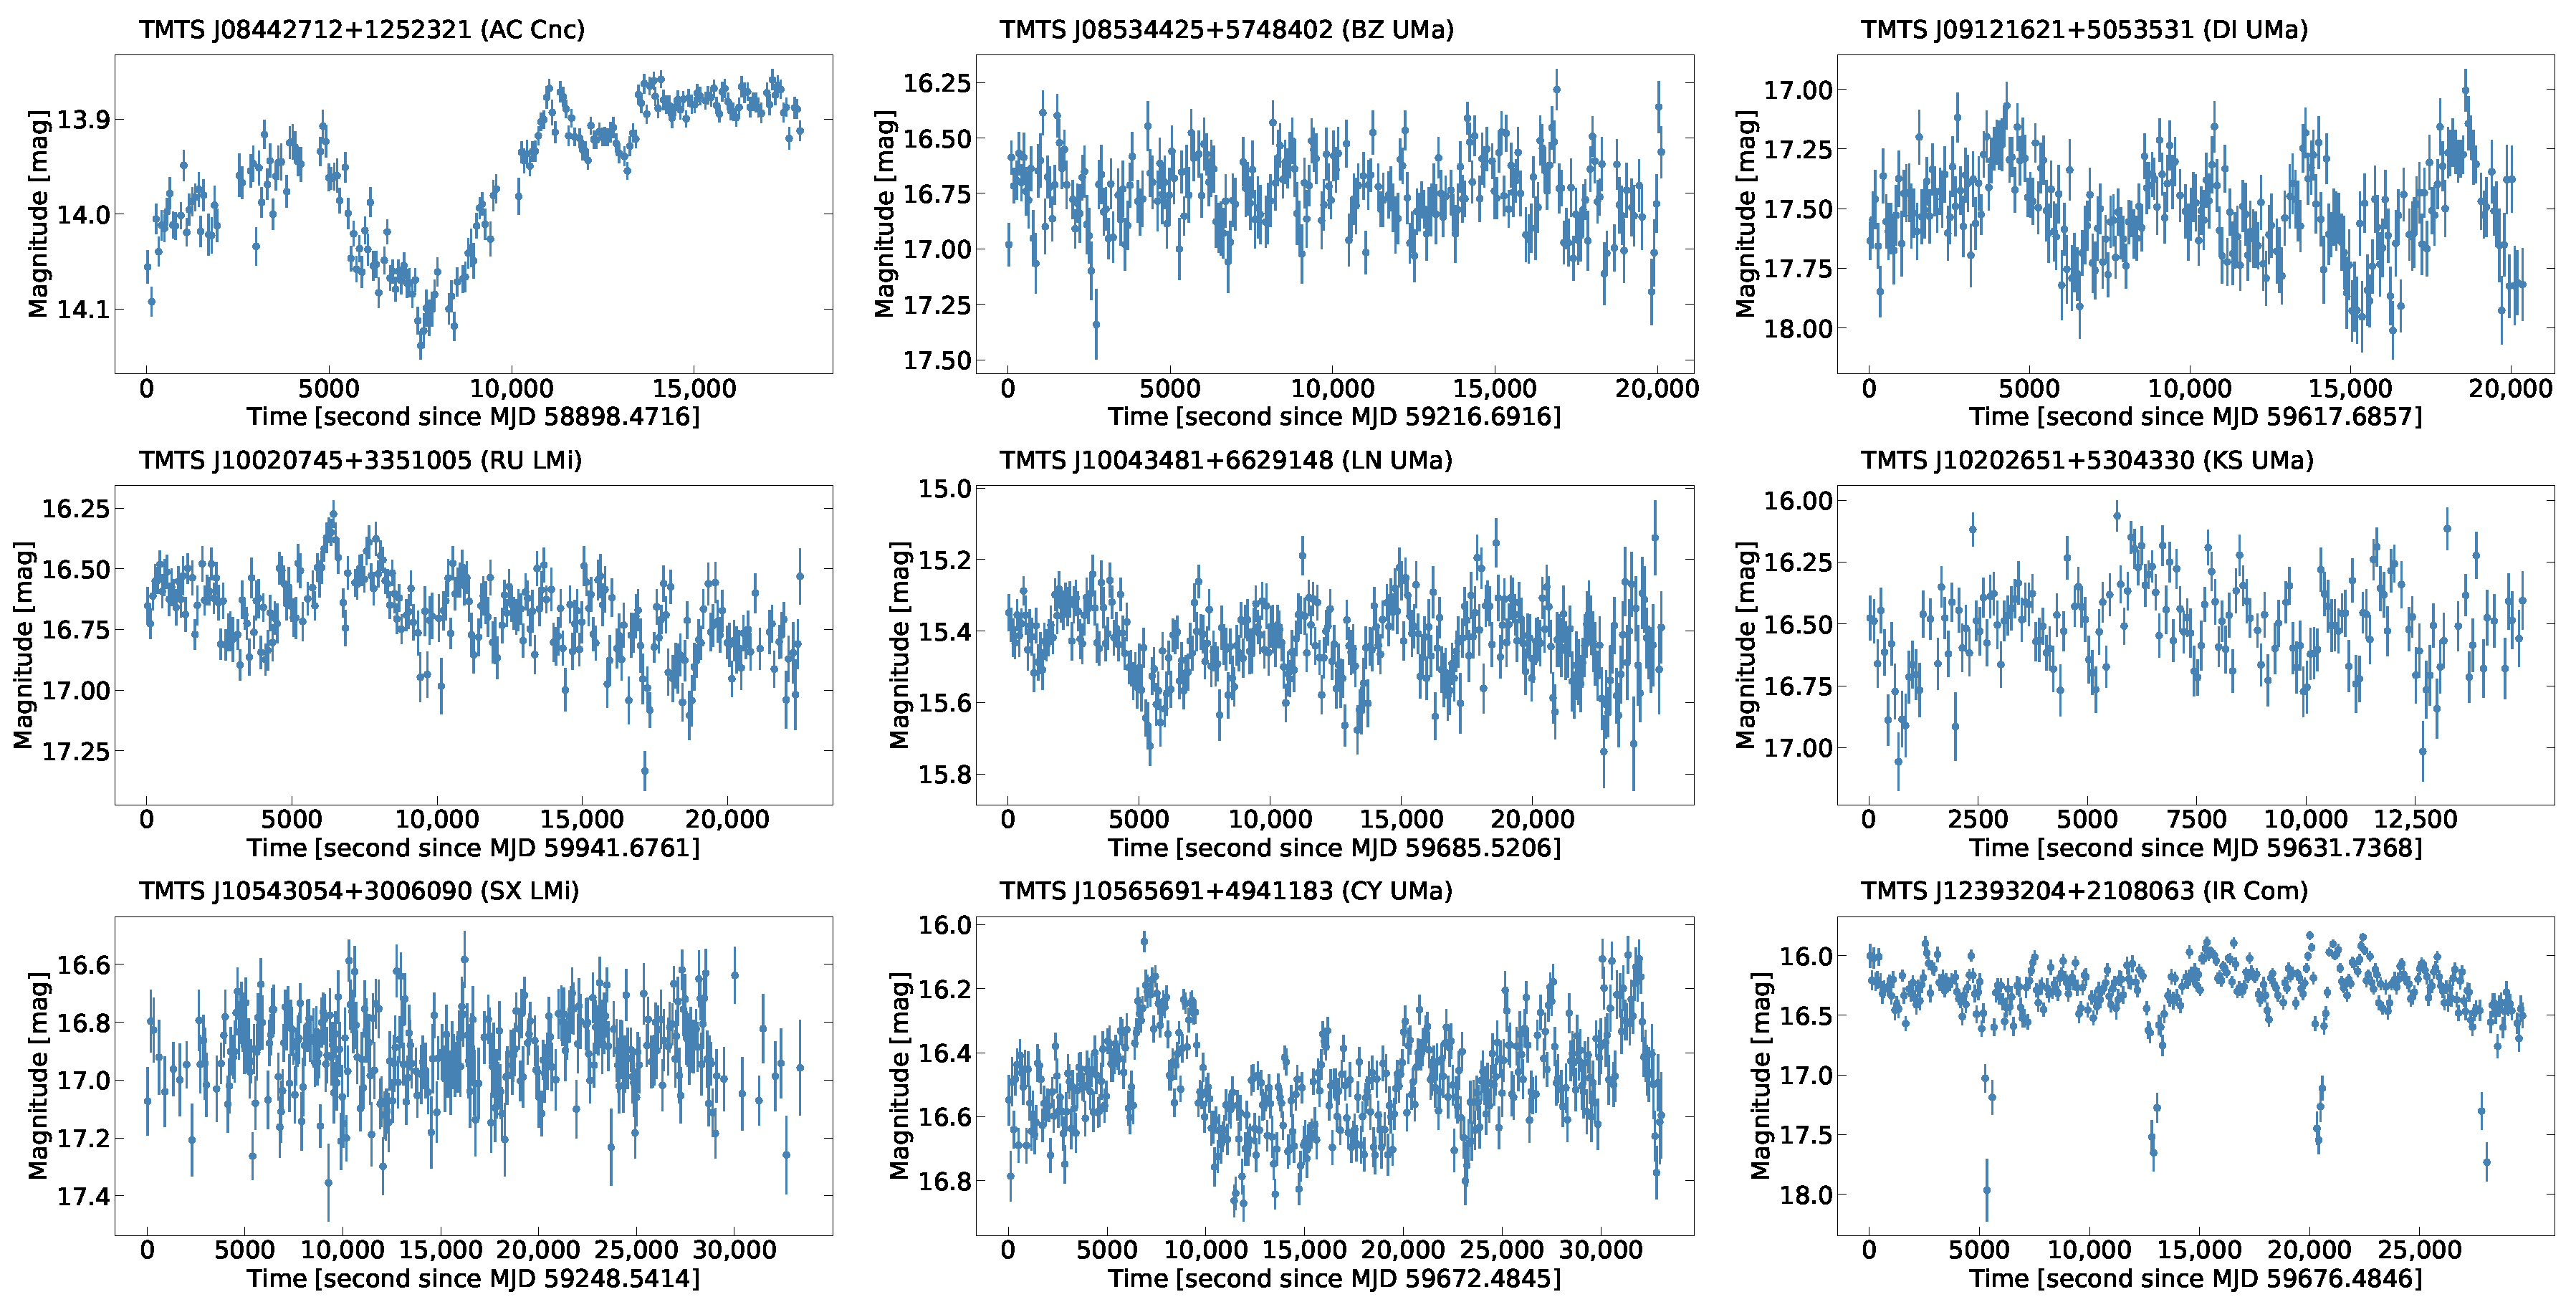
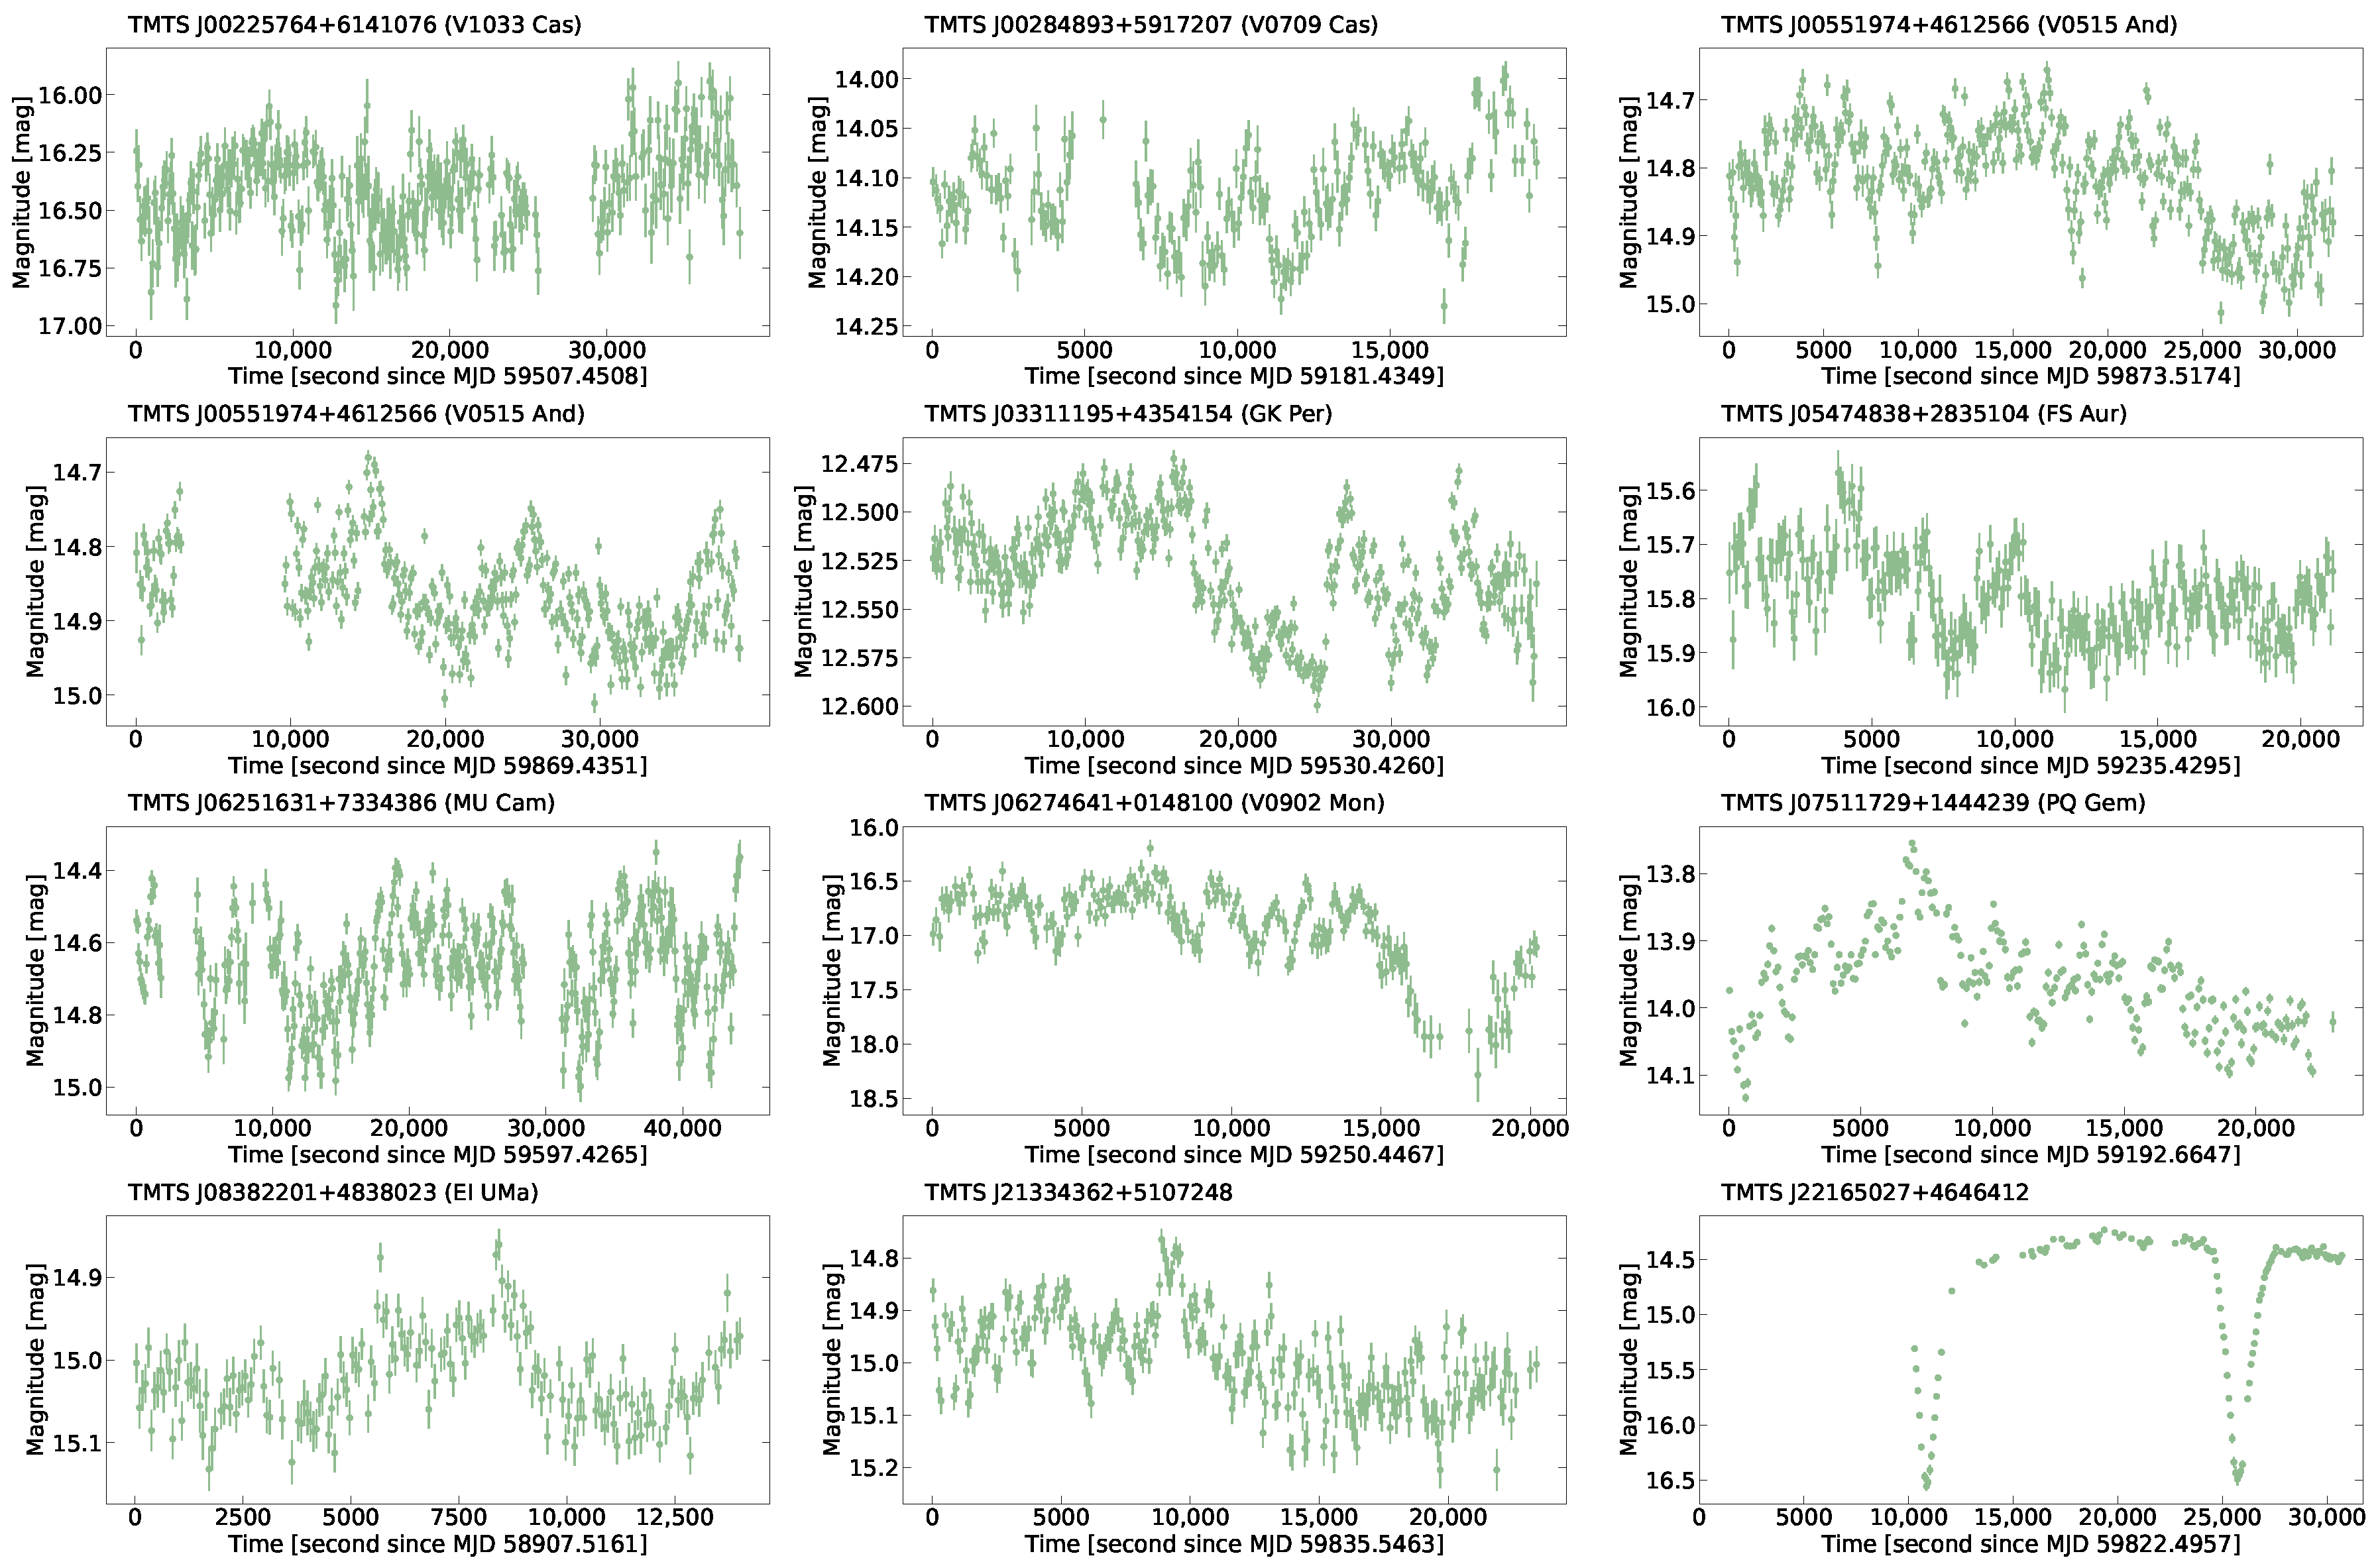
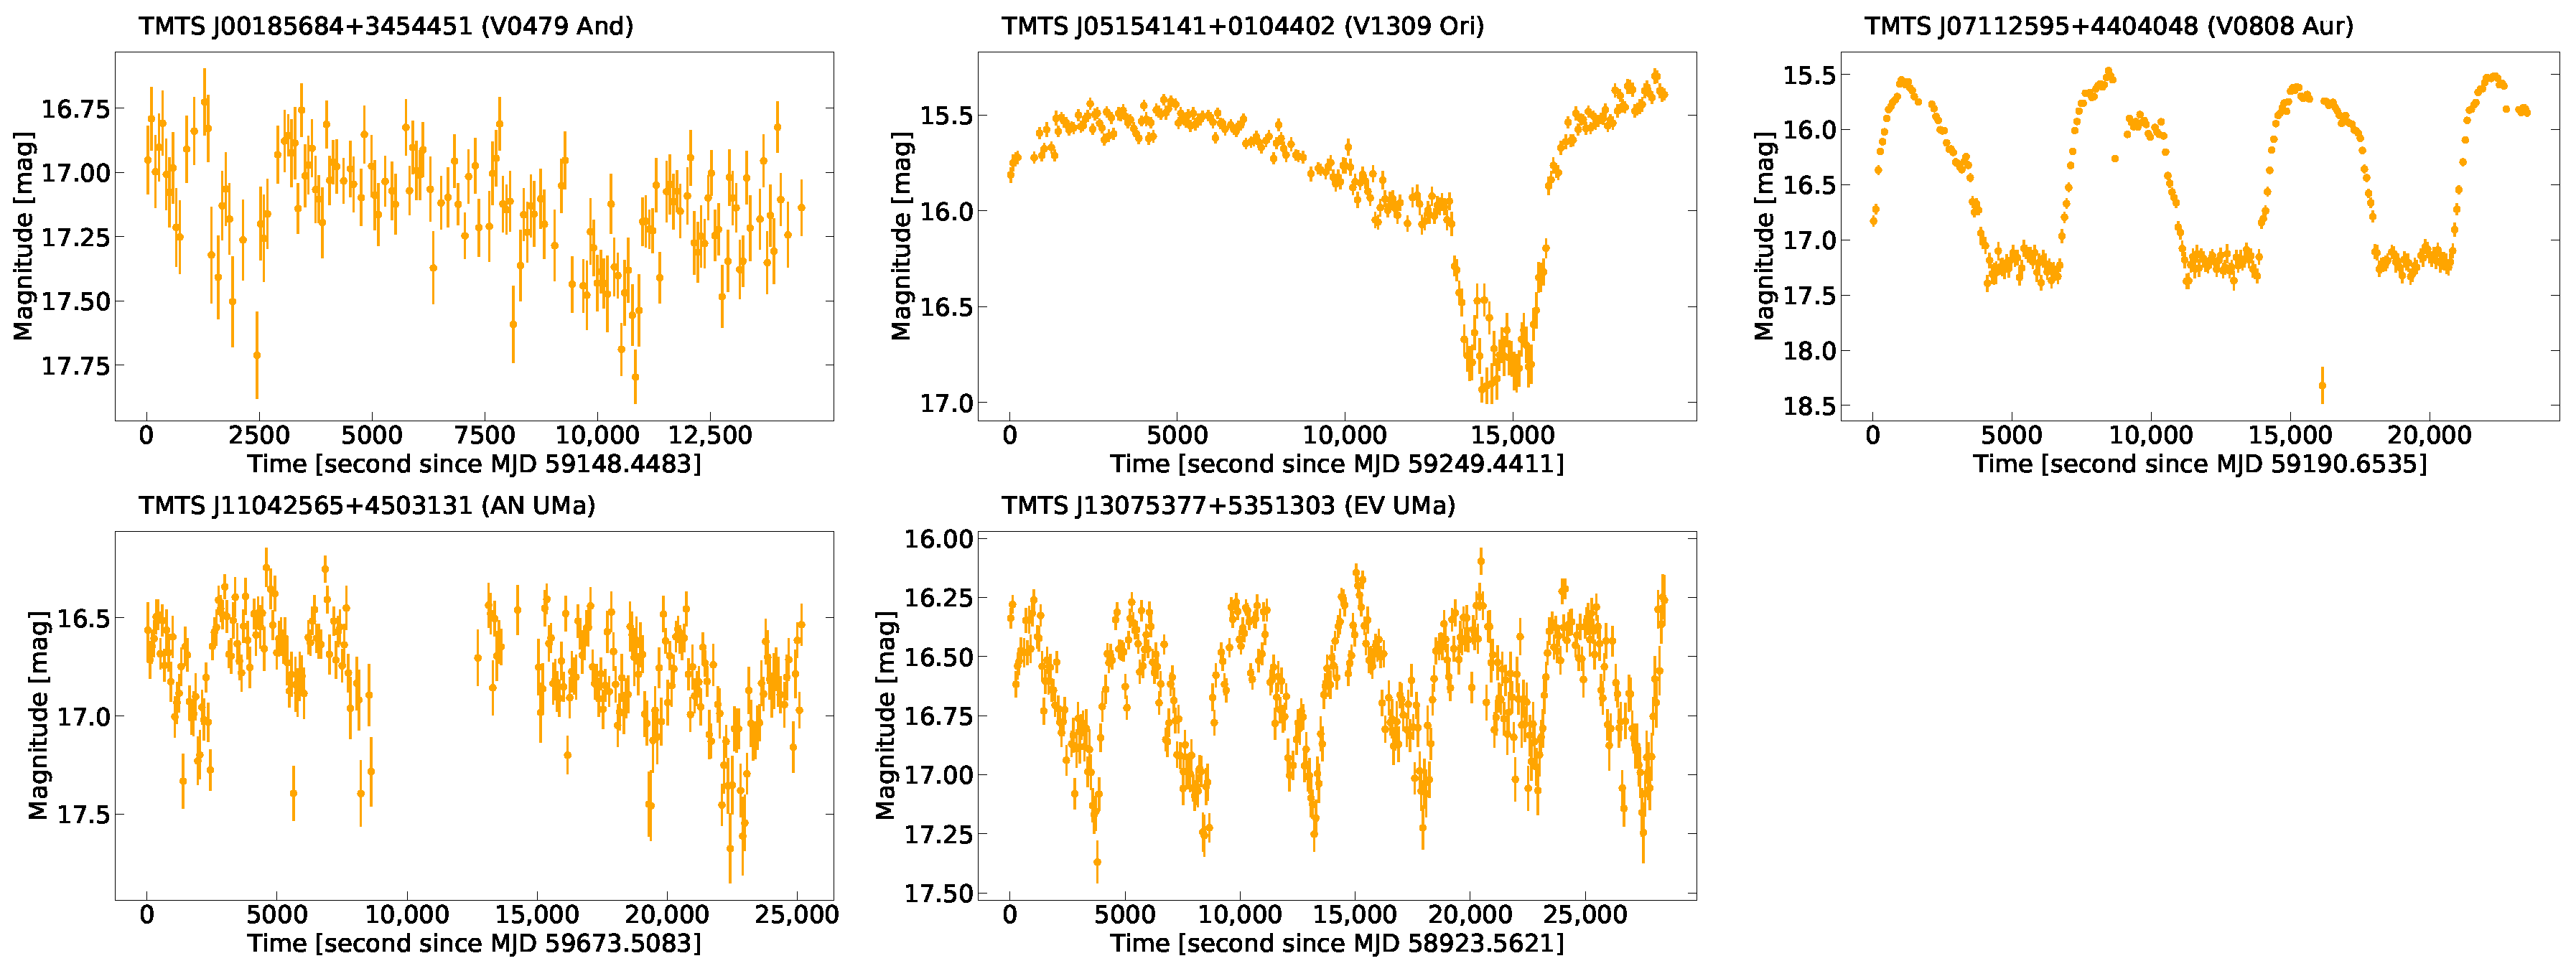
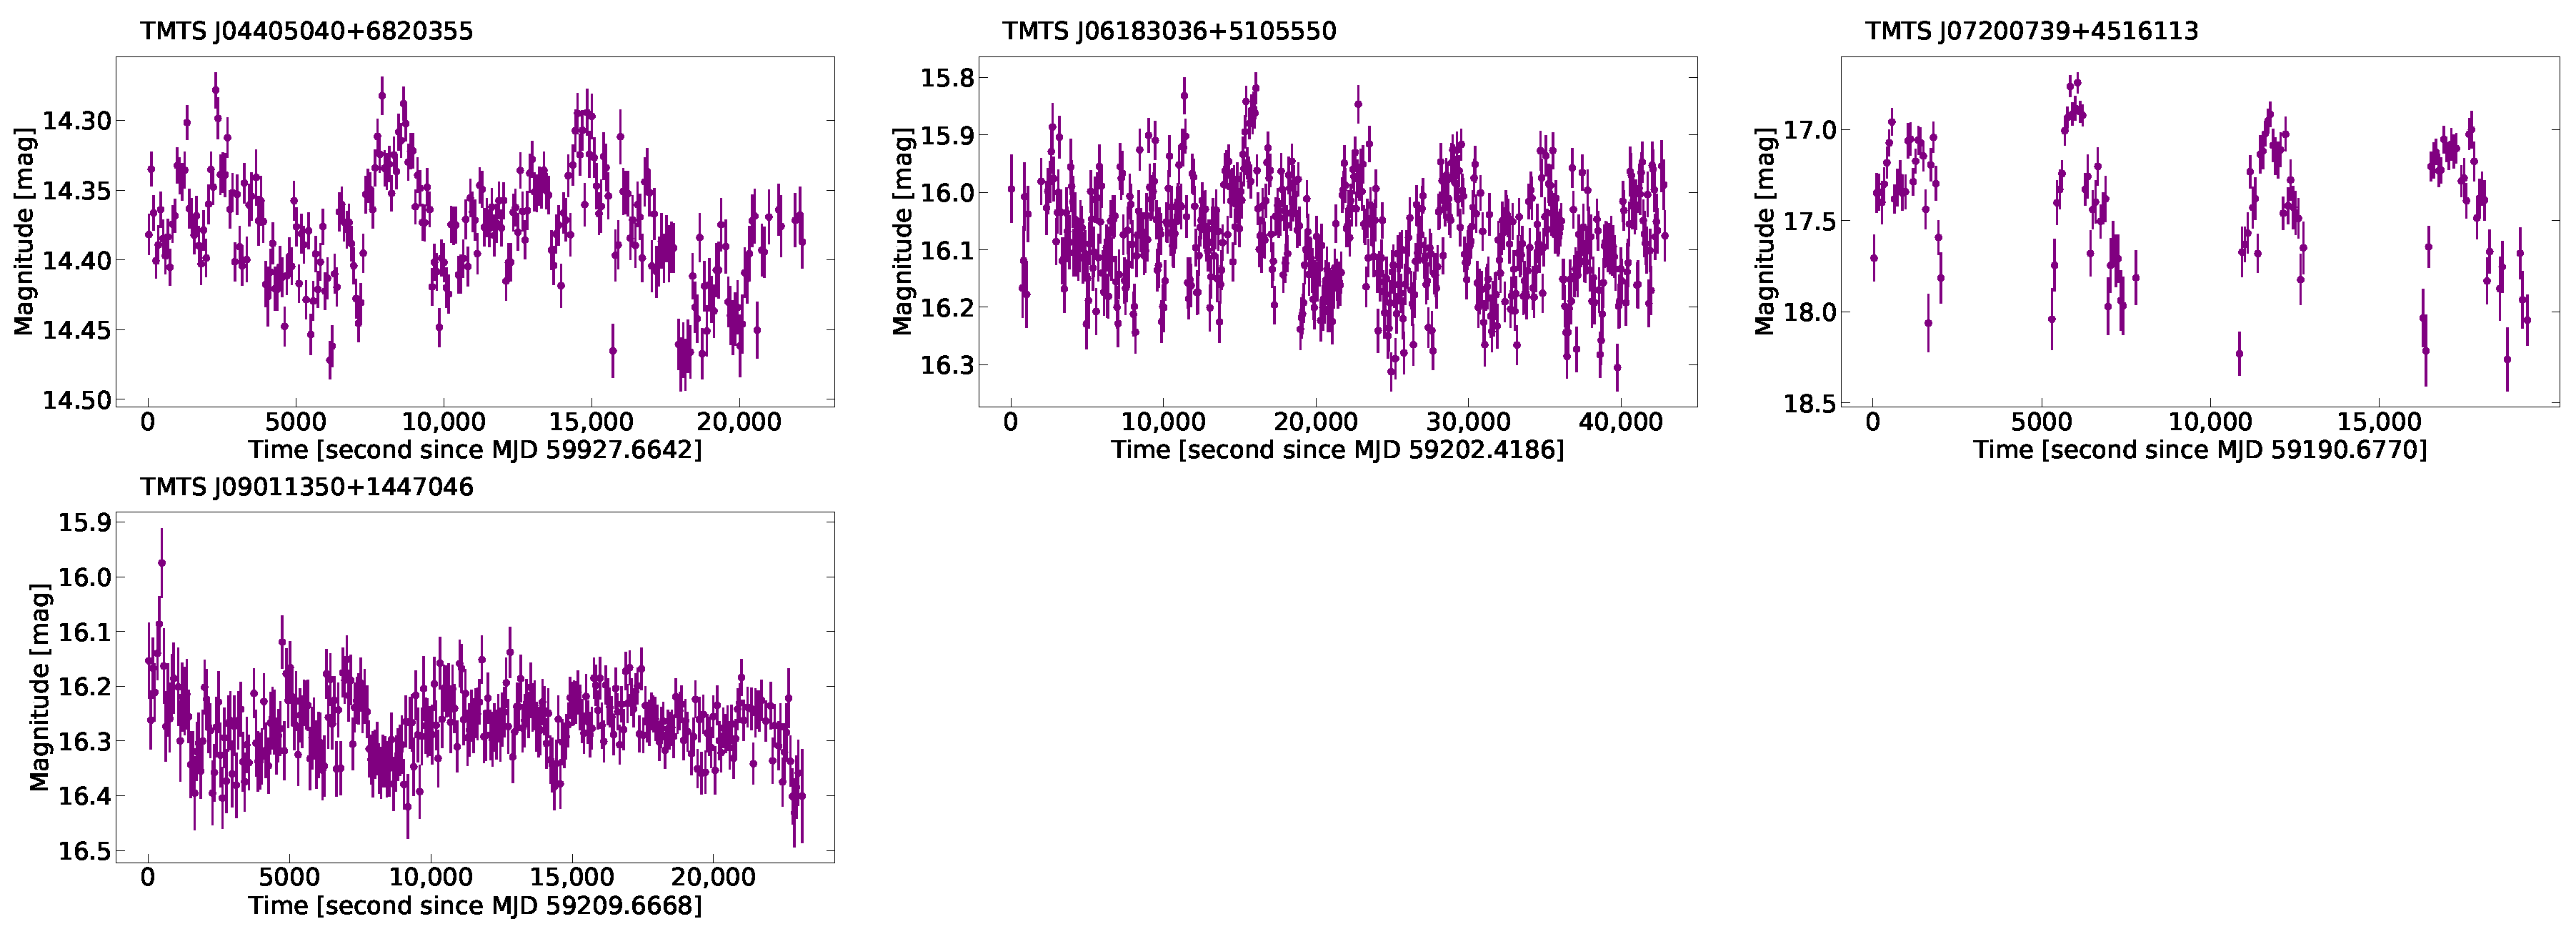
Note that most of the samples were uninterruptedly observed within single nights except for five sources that were monitored on two separate nights. The procedures of TMTS photometry and calibration are described by Lin et al. [31]. Uninterrupted light curves of the 64 CVs are shown in Figure A1, Figure A2, Figure A3, Figure A4 and Figure A5. These light curves typically span 4–12 h, with a cadence of about 1 min. For those known CVs, we also labeled the IAU-sanctioned names.
Benefiting from our observation strategy, among the 64 samples, spectra of 27 are available from the LAMOST DR7. We obtained spectra of an additional 29 objects with the Xinglong 2.16 m telescope (XLT) and the Lick 3 m Shane telescope (LST). Nevertheless, spectroscopic data are still absent for seven objects of our collected samples. Figure A6 shows the spectra of our 57 CV samples. Here, we give brief introductions to some candidates listed in Table 1. TMTS J03394099+4148057 was identified as an NL candidate [43] with a radial-velocity period of 3.54 h [44]. Our spectrum of this object revealed the presence of prominent H α   λ 6563 and He I λ 6678 and λ 7065 emission lines. TMTS J09011350+1447046 is a CV candidate that was first discovered by Szkody et al. [45], and its LAMOST spectrum exhibits a broad, moderately strong H α emission [41]. TMTS J07200739+4516113 was initially discovered by Denisenko [46], and it has been suggested to be polar, according to the helium emission features seen in the LAMOST spectra [41] or its large amplitude of light variation [35]. Owing to the lack of detailed analysis and constraints on the accretion structure, we tentatively treat it as a CV candidate in this work.

2.2. Light-Curve Analysis

2.2.1. Periodic Variations

We searched for periodic variations in the TMTS light curves using the Lomb–Scargle periodogram (LSP; Lomb [55], Scargle [56]). The frequency range was set to 2 / T f f nyq , where T is the time span of each light curve, and f nyp is the Nyquist frequency, estimated as half of the average sampling rate. The method adopted to compute the LSP for the TMTS light curves was already described in detail by Lin et al. [31]. The false-alarm probability (FAP) was estimated as
FAP = 1 [ 1 exp ( z ) ] N eff ,
where z is the LSP power, and N eff is the effective number of independent frequencies. N eff is approximated as f nyp T [57]. We adopted a significance threshold of FAP = 0.001 throughout this work.
From the TMTS LSPs of CV samples, we determined the photometric period corresponding to the maximum LSP power, P pho , if the maximum LSP power was higher than the threshold (see Table 1). Then, we used a compound model of fourth-order Fourier series with a period equal to P pho plus a second-order polynomial to fit all TMTS light curves (see Equation (7) of Lin et al. [31]). The peak-to-peak amplitudes obtained from the fourth-order Fourier series are listed in Table 1.

2.2.2. Light-Curve Features

With the minute-cadence photometry from TMTS, we can characterize the uninterrupted light curves of these CVs. Here, all short-timescale light-curve features were classified into four distinguishable types, as follows.
  • Eclipse. Thanks to densely sampled photometry, the TMTS light curves allow us to characterize the detailed profiles of eclipses for the eclipsing CVs. In our CV samples, the eclipse depth ranges from a few tenths of magnitude to more than 2.0 mag. The emergence of an eclipse provides direct evidence supporting the notion that the CV system has an orbital inclination approaching 90 ° .
  • Low-amplitude periodic variation. With the amplitude distribution of noneclipse CV systems (see Figure 1), 20 CV samples presented periodic modulation amplitude of about 0.1–0.4 mag, while 2 CV samples exhibited a significantly higher modulation amplitude. Low-amplitude periodic variations here are defined as periodic variations with an amplitude lower than 0.4 mag, which are typically caused by the hump/superhump of CVs and are thus tightly related to their orbital periods.
  • High-amplitude periodic variation. In contrast, high-amplitude periodic variations represent modulations with an abnormally high amplitude. Here, we roughly define them as periodic variations with an amplitude larger than 0.4 mag.
  • Rapid periodic variation. Since the quasi-periodic oscillations of DNe and rotation modulations of IPs are difficult to distinguish with the single-night light curves, here, the rapid periodic variations represent all periodic or quasi-periodic variations below 20 min, significantly shorter than the periodic variations induced via orbital modulations.

2.3. Spectroscopic Analysis

With the spectra collected from LAMOST, LST, and XLT, we further performed a spectroscopic study of our CV samples. (Note that the CV candidates are not included in this study.) We selected those CVs with better determinations of subtypes and orbital periods from our 64 CV samples, excluding 7 candidates and 3 sources without an orbital period. Only spectra with a signal-to-noise ratio (SNR) > 10 and variation coefficient (VC) < 1 are included in our analysis, where VC is defined as the ratio of the standard deviation to the mean value of the SNR. VC is used to evaluate the quality of the spectrum, which is acceptable when VC < 1 [58]. In addition, only those spectra showing emission features were included in the analysis since we are interested in the emitting process in the CVs. Finally, 44 CVs were included in the spectroscopic analysis.
The equivalent width (EW) of H α emission, EW H α , was calculated by integrating the flux excesses above the continuum:
EW = F λ F c F c d λ ,
where F λ represents the emission flux at wavelength λ , and F c denotes the continuum flux. F λ is the flux in the wavelength range of 6480–6640 Å. Such a wide range can include the entire broadened profile of H α emission. The continuum flux was obtained by linearly fitting the spectral ranges 6480–6510 Å and 6620–6640 Å, and no emission component emerged over these ranges in our spectra. Additionally, the full width at half-maximum intensity (FWHM) is the wavelength interval between halves of the maximum flux in the emission lines.
We used Monte Carlo simulations to estimate the uncertainties of EW H α and FWHM H α . The flux of the spectra was randomly sampled according to the uncertainty at each wavelength. After repeating the simulation 100 times, the standard deviations of the measured EW H α and FWHM H α were taken as the corresponding uncertainties. The typical uncertainties for the two quantities are both ∼1 Å.

3. Individual Systems

The minute-cadence observations from TMTS enabled us to study the short-timescale light variations of all these CV samples, including the newly discovered ones (see Table 1). In particular, the TMTS data reveal new photometric periods for some known CVs, together with the observations from TESS and the Zwicky Transient Facility (ZTF; Bellm et al. [59], Masci et al. [60]).

3.1. Newly Discovered CVs and CV Candidates

3.1.1. TMTS J04405040+6820355

TMTS J04405040+6820355 (hereafter J0440) shows a significant light-variation period of P 1 = 110.0 ± 1.1 min in the TMTS light curve obtained on 14 December 2022 (UTC dates are used throughout this paper); see Figure 2. Broad H α emission is superimposed on a blue continuum in the spectrum obtained with the Xinglong 2.16 m telescope on 2 October 2023 (Figure 2). Given the location of J0440 in the Gaia color-magnitude diagram ( M abs , G = 5.4 mag and G Bp Rp = 0.13 mag), we infer that J0440 is a new CV candidate (see also Lin et al. [35]).
The five-year light curves provided via ZTF failed to reveal any outburst for this source; along with the presence of H β absorption, this implies that it might be an NL with an optically thick disk.

3.1.2. TMTS J06183036+5105550

TMTS J06183036+5105550 (hereafter J0618) is a new CV discovered via TMTS and reported in the catalog of TMTS short-period variable stars [35]. Its spectrum shows a faint He II emission line around 4686 Å. According to the Swift/XRT observation conducted on 29 October 2022, this source has an X-ray luminosity of ∼ 10 31 erg s 1 . Two periodicities, P 1 = 107.4 ± 0.4 min and P 2 = 11.165 ± 0.004 min, are revealed via the TMTS light curve. These clues favor the classification of this object as an intermediate polar candidate.
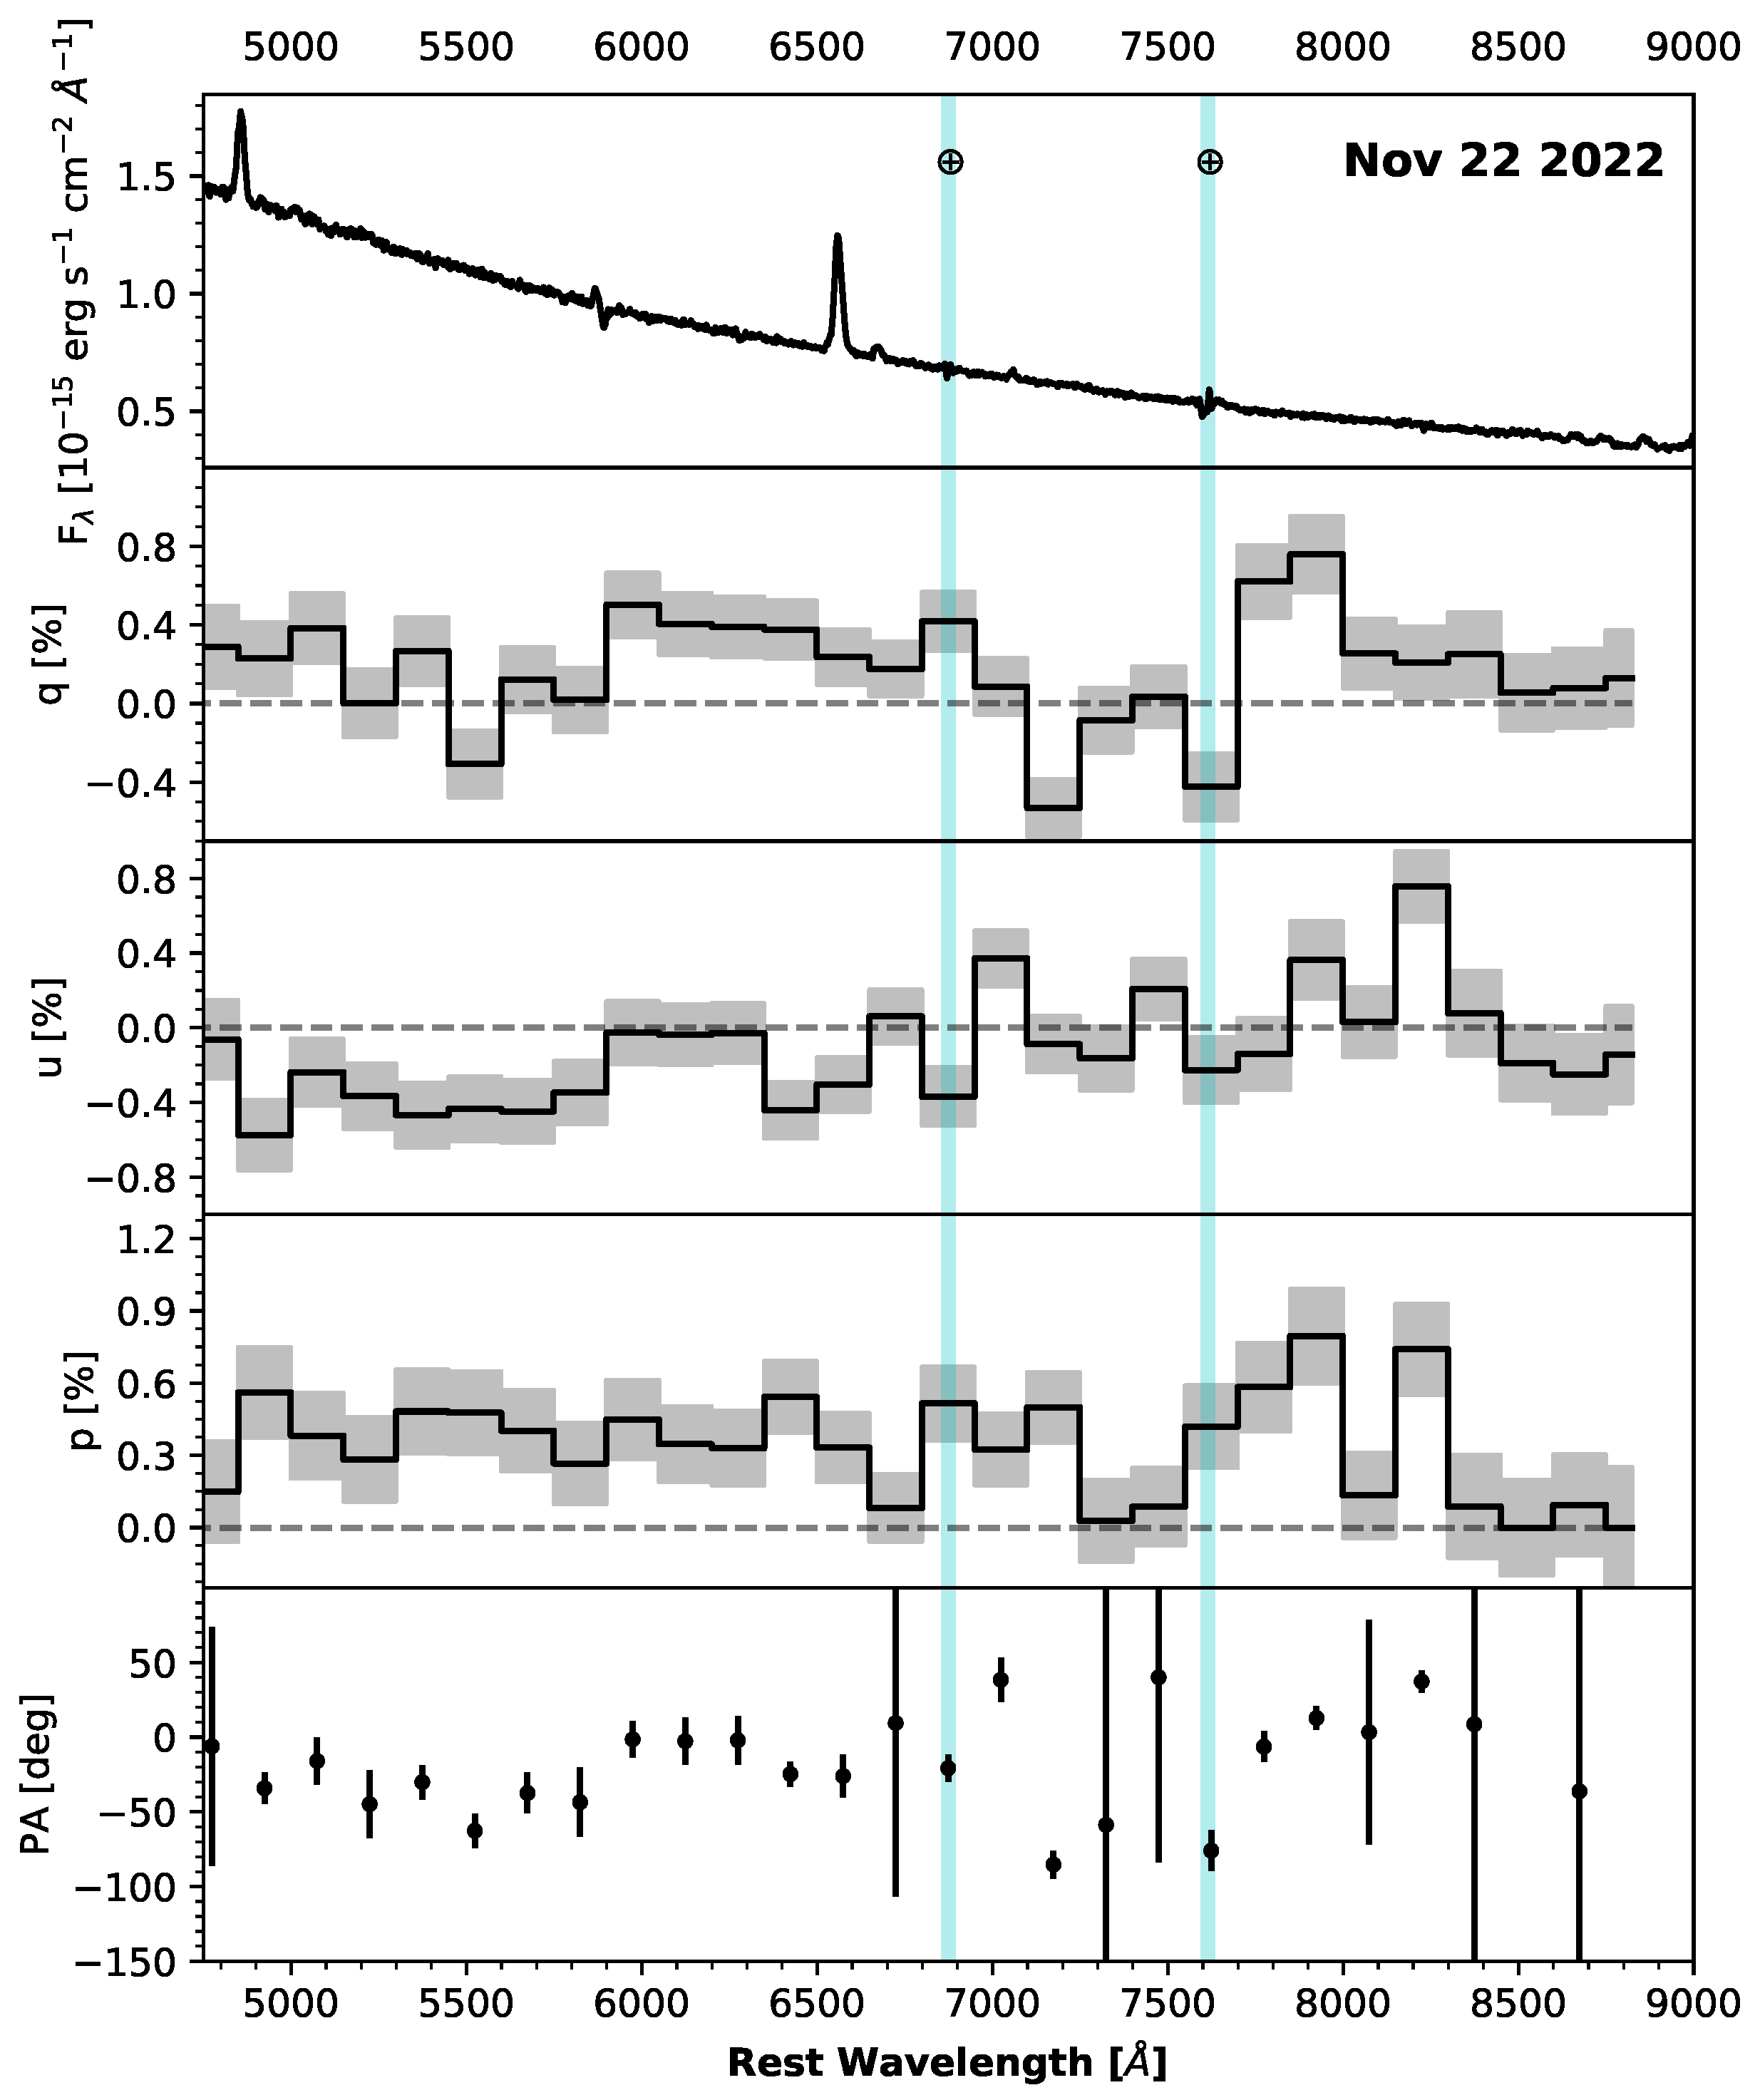
We further explored the properties of this source by conducting a polarization observation on 22 November 2022 with the Kast double spectrograph on the Shane 3 m telescope at Lick Observatory, USA. The spectropolarimetric results are shown in Figure 3, where q = Q / I and u = U / I are the normalized Stokes parameters. Q and U describe the differences of fluxes when the electric vector oscillates in two perpendicular directions, and I is the total flux. The observed polarization, p, is calculated as p obs = q 2 + u 2 , and the polarization angle is calculated through PA obs = ( 1 / 2 ) arctan ( u / q ) . Since electromagnetic waves passing through interstellar dust will become polarized, the galactic interstellar polarization (ISP) is also taken into account when computing the intrinsic polarization from the CV system. Following the procedure described by Patra et al. [61], the ISP of J0618 was removed by subtracting the observed polarization from the intrinsically unpolarized star within the 1 of this object.
As seen in Figure 3, a linear polarization of ∼0.6% was detected for J0618, comparable to the 0.8 % linear polarization reported for intermediate polar RE 0751+14 in the R band [62]. The values of the polarization angle are noisy for some points, but in general, they are not randomly scattered. In the case of magnetic CVs, material from the companion star is accreted onto the magnetic poles of the WD, leading to cyclotron radiation [63]. The higher harmonics of the fundamental frequency will generate linear polarization [7]. Unlike polars, polarized light from IPs will be diluted due to the emission from the accretion disk, WD, and so on. This leads to the fact that polarized emission is detected only in a few IP systems [64]. With all the above observational evidence, we suggest that J0618 is an intermediate polar.

3.2. New Light-Variation Features from Known CVs

3.2.1. SDSS J013855.86+242939.2

SDSS J013855.86+242939.2 (TMTS J01385585+2429393, hereafter J0138) is a relatively poorly studied CV identified by cross-matching SDSS WD candidates with LAMOST spectra [65]. Hou et al. [43] classified it as a magnetic CV according to the comparable strength of H β and He II λ 4686 lines. Nevertheless, they also emphasized that this classification was based only on the characteristic lines and may not be accurate. From ZTF r-band observations, the brightness of this CV can change from ∼15 mag to ∼18 mag. The brightness variation of this CV resembles that of magnetic CVs [66,67].
During the TMTS observations, this source is at its high-luminosity state, with the TMTS L-band magnitude being ∼15.4 mag. As shown in Figure 4, some flickering can be seen in its phase-folded light curve. A new photometric period, P 1 = 179.0 ± 2.3 min, was revealed via the LSP. If the period is its orbital period, J0138 is a CV located at the period-gap boundary. However, the TESS observations of this object (TIC 353851691) did not detect any significant periodic signal above 2 day 1 , while the ZTF r-band and g-band LSP only present some daily aliases. Hence, the physical origin of this photometric period needs further observations and analysis.

3.2.2. TMTS J03471387+1611083

TMTS J03471387+1611083 (also LAMOST J034713.84+161108.2, hereafter J0347) was first classified as an RR Lyrae star in the Catalina Survey [68], and then it was identified as a CV candidate with LAMOST spectroscopic observations [69]. Following the instructions from [35], the Gaia absolute magnitude M abs , G = 6.22 mag and dereddened G Bp Rp = 0.11 mag support that J0347 is a CV, rather than an RR Lyrae variable. The TMTS light curve reveals a periodically occurring hump feature, which could be caused by a bright spot on the accretion disk. The TMTS LSP (bottom-left panel of Figure 5) presents two periodic signals, namely P 1 = 97.7 ± 0.8 min and P 2 = 155.0 ± 2.1 min . For comparison, we also checked the light curve of J0347 from TESS observations and computed the corresponding LSP (see the left panels of Figure 5). Two periodic signals, P 3 = 101.064 ± 0.004 min and P 4 = 2.444 ± 0.003 days, were also revealed from the TESS LSP (middle-right panel of Figure 5). Without an accurate determination of the orbital period, the origin of P 1 and P 3 could not be determined reliably; a further study of J0347 is expected.

3.2.3. FO Per

TMTS J04083502+5114484 (FO Per) was first discovered by Morgenroth [70], and then classified as a DN with spectroscopic observations [71]. Sheets et al. [72] determined its orbital period as 211.2 min or 247.8 min by measuring the radial velocities of H α emission. Sheets et al. [72] suggested a 4.13 hr orbital period since the period is consistent with those of nova-like variables. However, this estimate is not conclusive, as the orbital periods of many DNe also fall into this range.
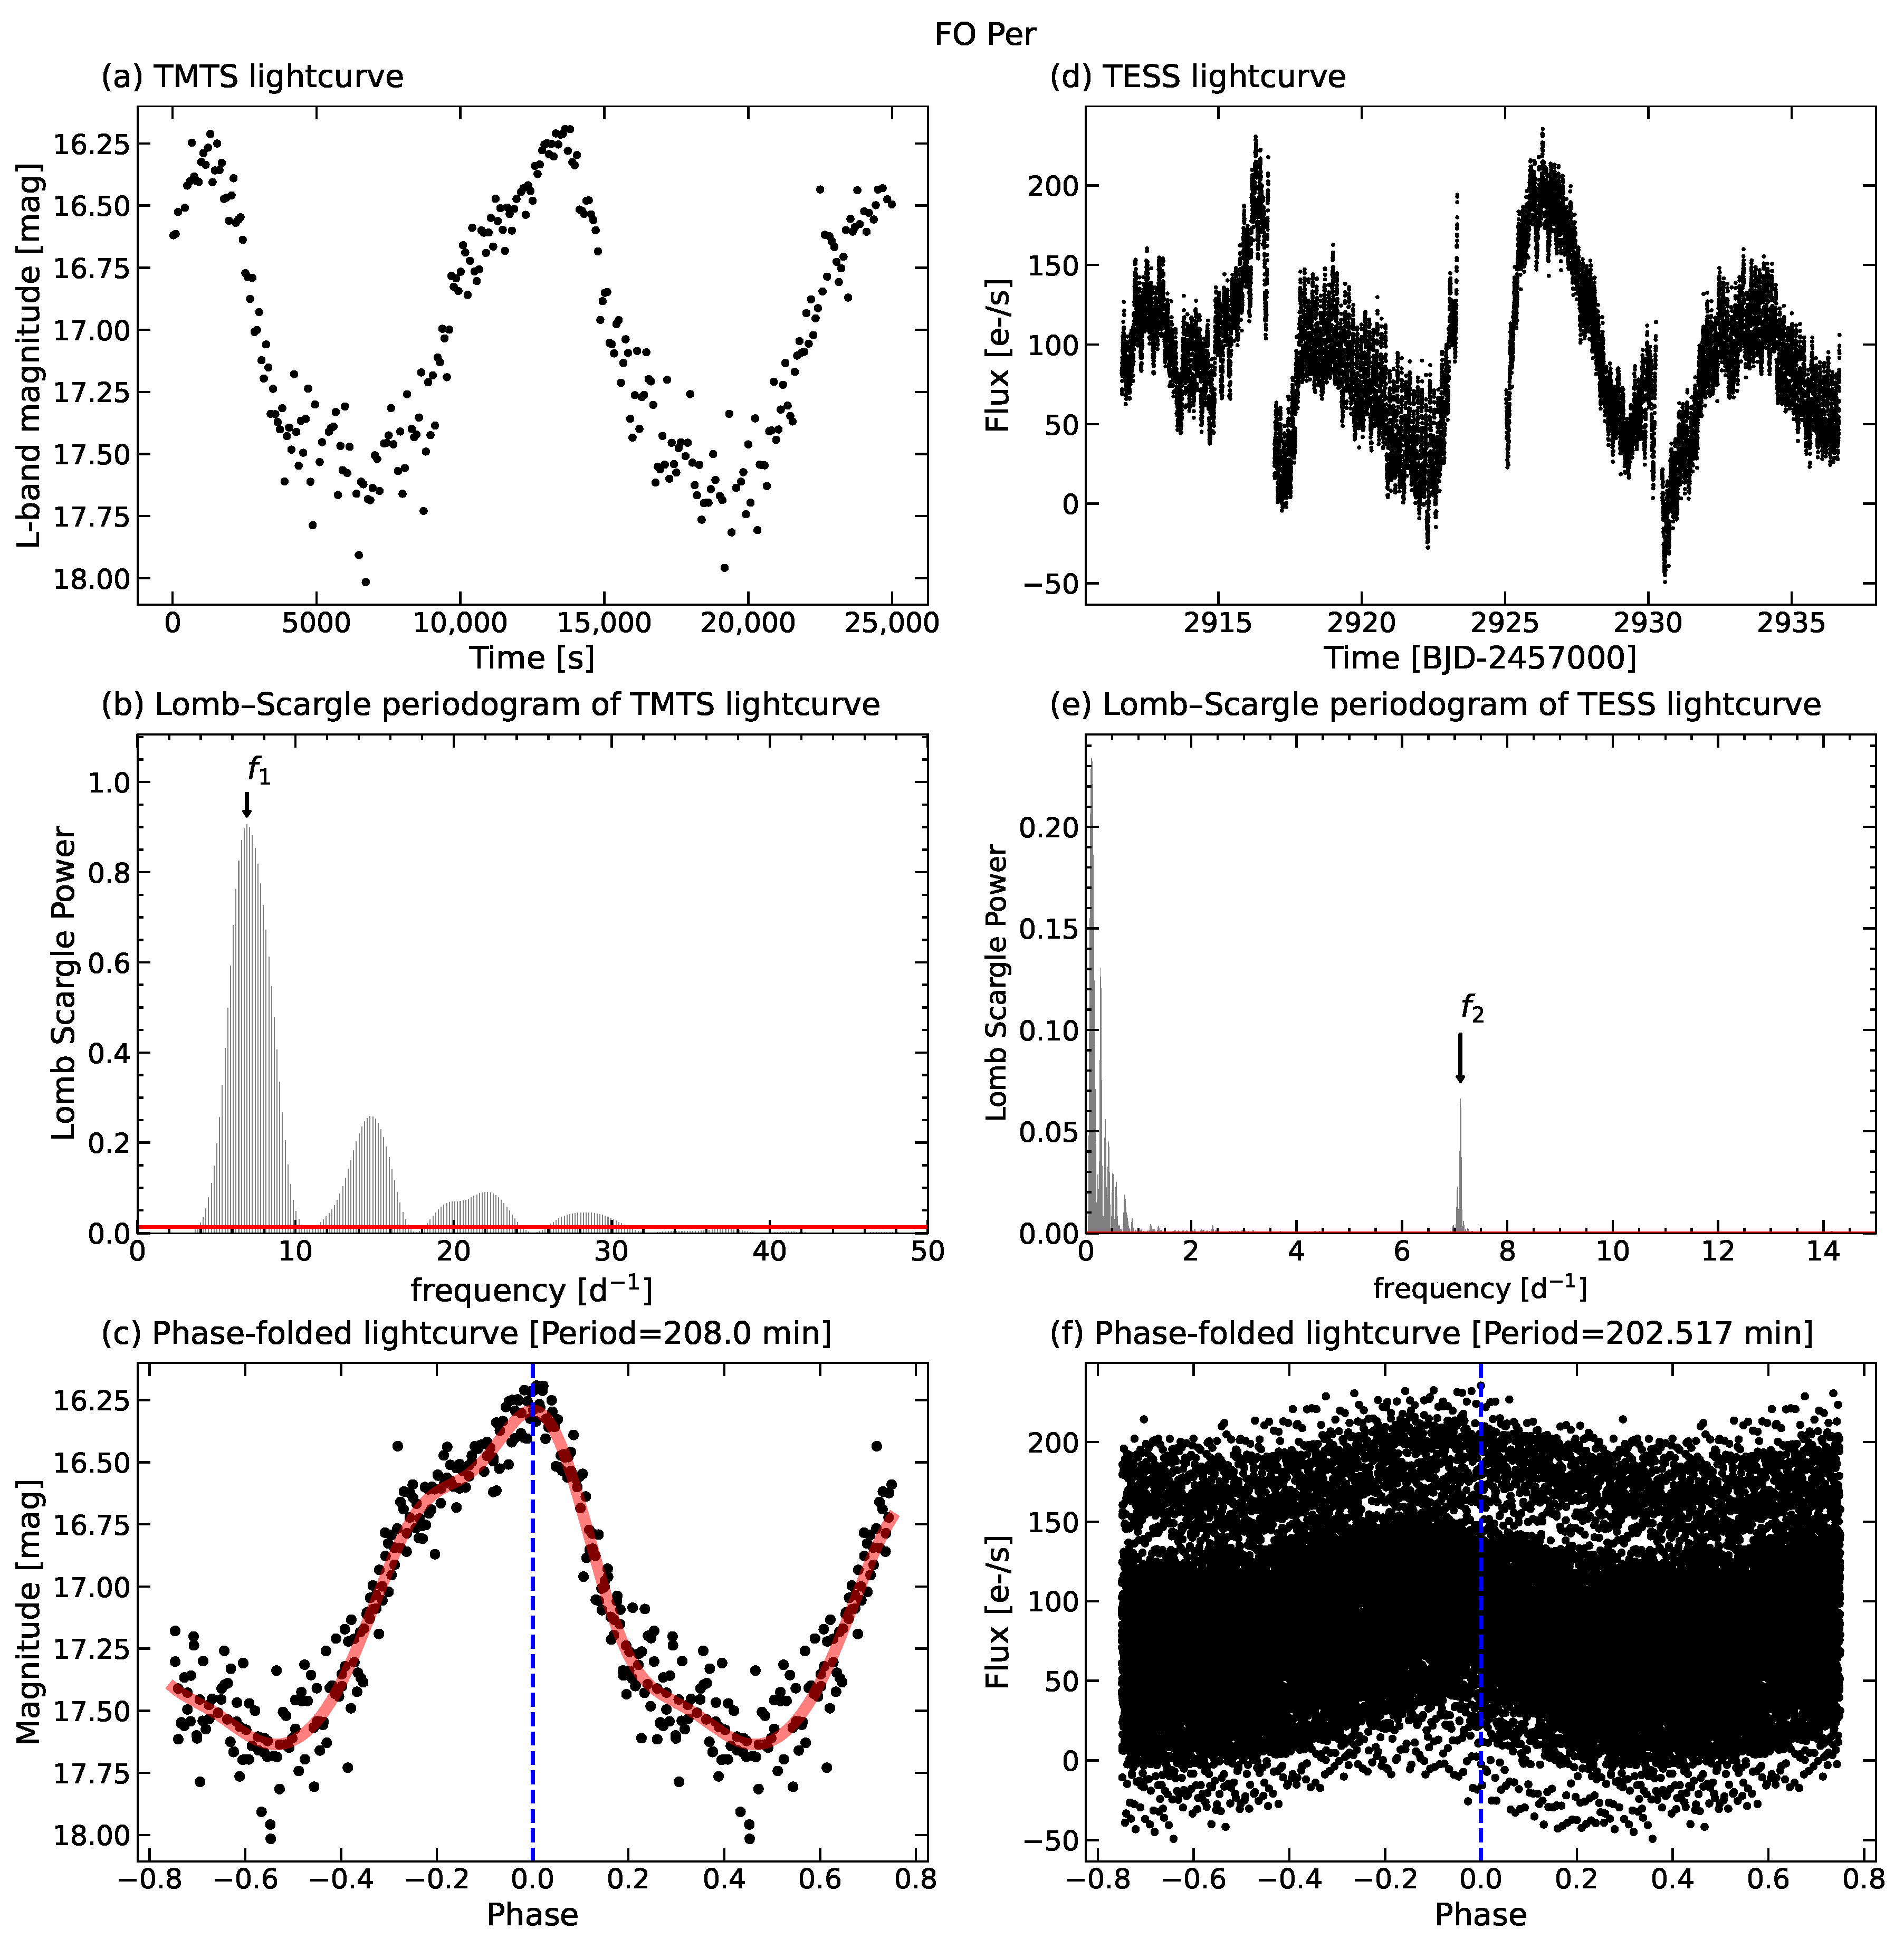
In the periodograms shown in Figure 6, a photometric period of P 1 = 208.0 ± 1.4 min is detected from the TMTS observation, while another period P 2 = 202.517 ± 0.002 min is detected from the TESS observation. Both photometric periods roughly agree with the presence of a shorter orbital period suggested by Sheets et al. [72], implying that the orbital period of FO Per is more likely 211.2 min.
From the ZTF r-band light curve, the brightness of TMTS J04083502+5114484 can vary from 13.5 mag to 17 mag. The ZTF light curve also indicates that FO Per was going into outburst during the TMTS observation, and this CV system then reached ∼13.5 mag ten days later. It is worth noting that the light-variation amplitude of this DN can reach ∼1.5 mag, much larger than that of other DNe in our samples, and thus, it is possibly caused by a different physical process.

3.2.4. SS Aur

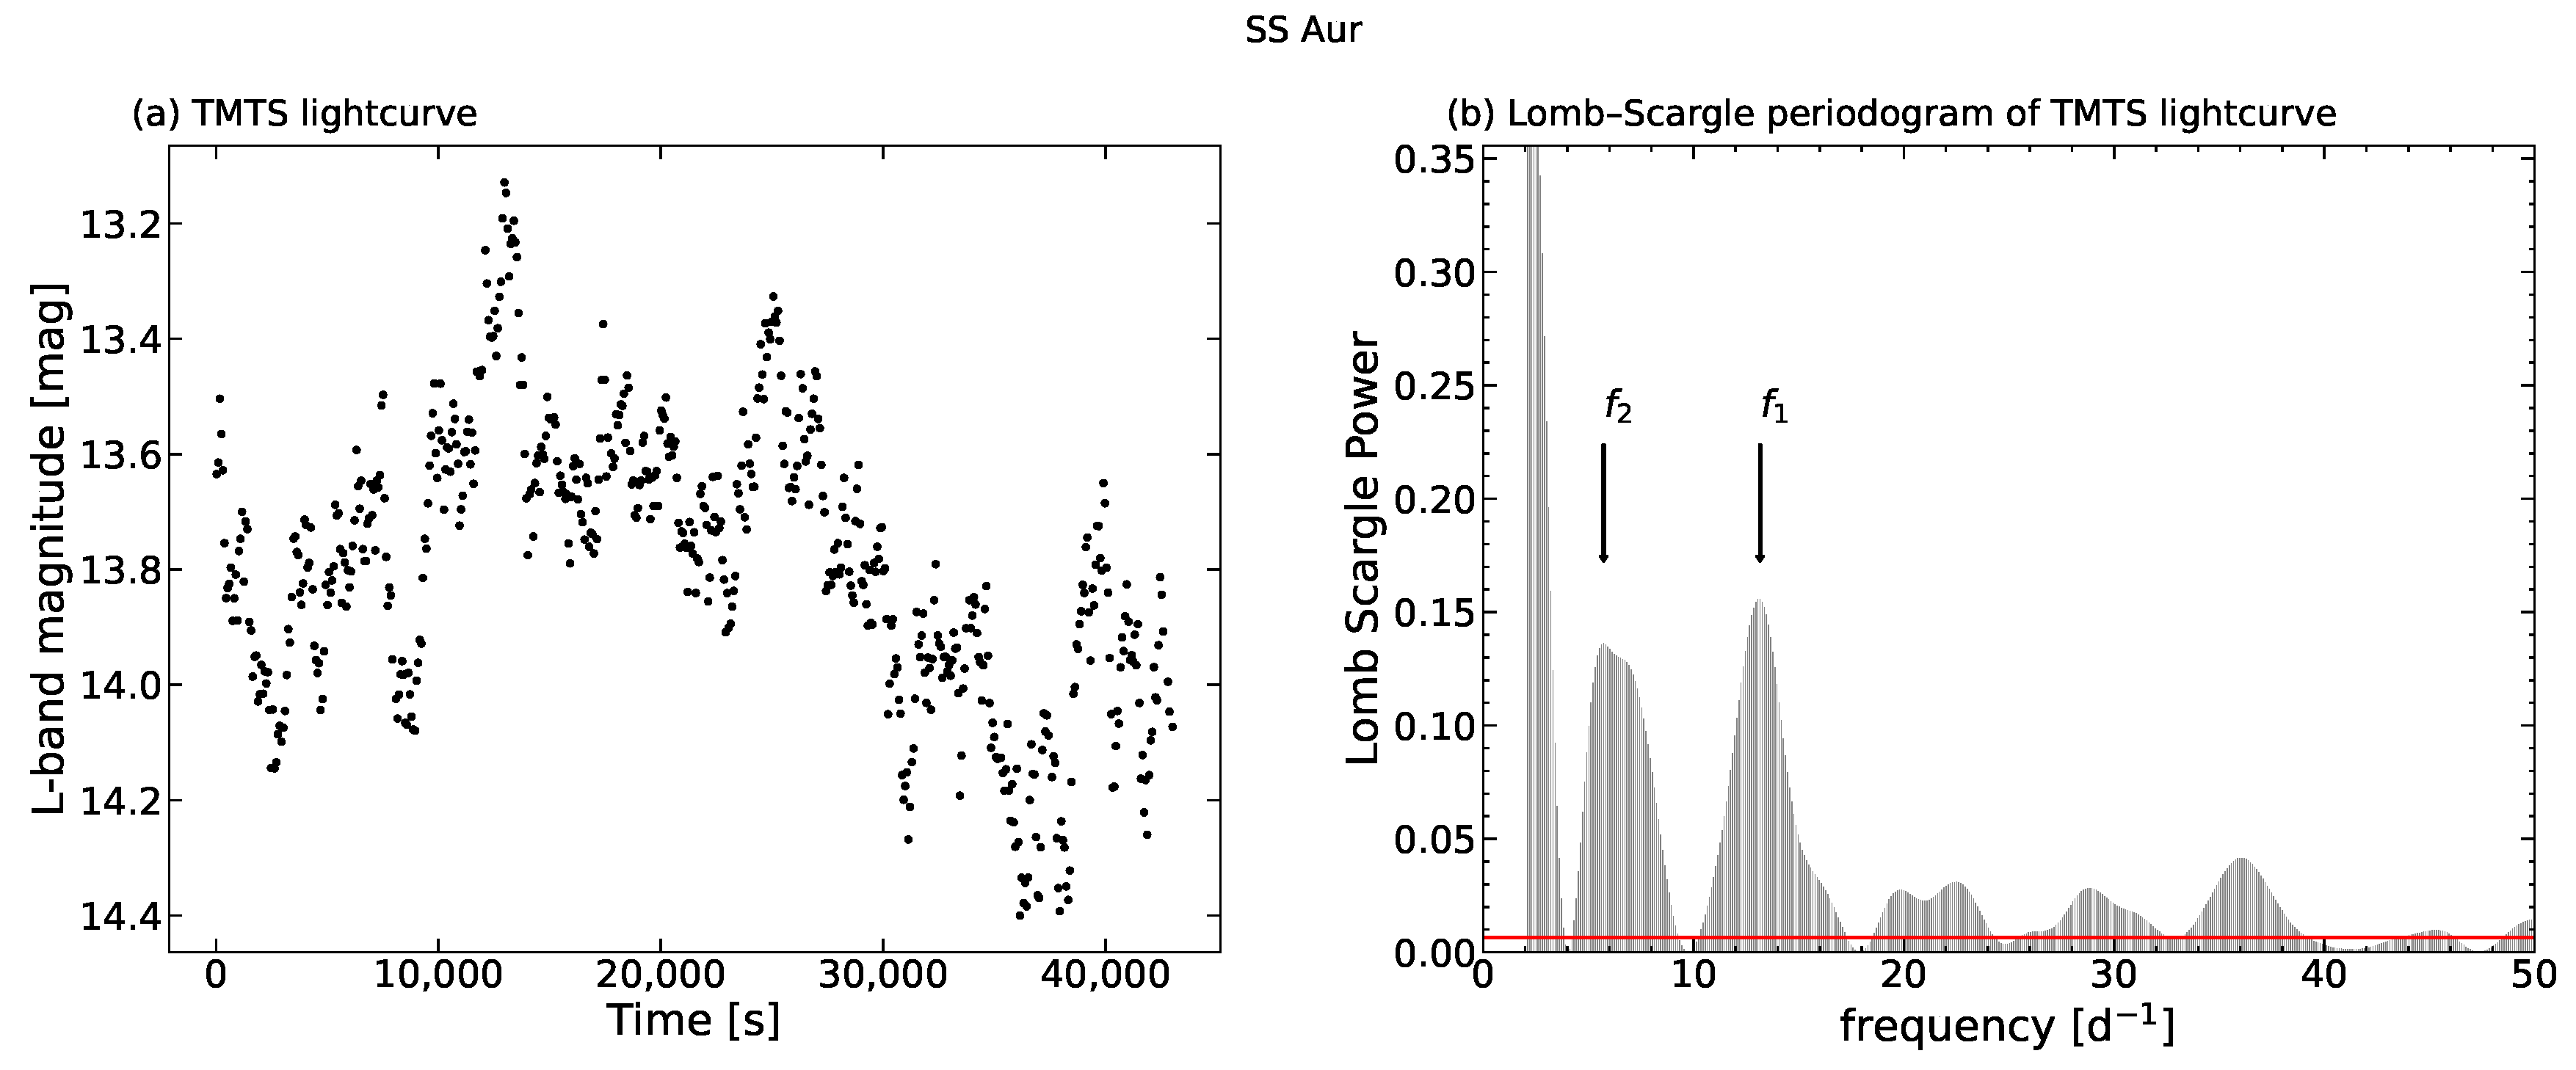
TMTS J06132238+4744248 (SS Aur) is a DN with an orbital period of 262.23 ± 0.15 min derived from radial velocities [73,74,75]. Two periods can be resolved in the periodogram of its TMTS light curve, namely P 1 = 108.535 ± 0.015 min and P 2 = 255.83 ± 0.08 min (see Figure 7). Among these two periods, P 2 is likely a negative superhump. If so, the period excess is ϵ = 0.024 , consistent with the relation between period excess and negative superhump period given by Bruch [13].

3.2.5. V378 Peg

TMTS J23400423+3017476 (V378 Peg) is an NL that was discovered by the Palomar–Green survey [76] and first classified as a CV by Koen and Orosz [77]. The orbital period of V378 Peg derived from radial velocities is P orb = 199.55 ± 0.06 min [78]. Negative superhumps (∼3.2 h) of V378 Peg were detected by both Ringwald et al. [78] and Kozhevnikov [79]. From our TMTS light curve, we detected a period of P 1 = 122.4 ± 0.2 min, which is shown in Figure 8. Following VanderPlas [57], we calculated the LSP of a window function of the TMTS light curve, but we did not find any fake spikes at the location of P 1 . This period is unlikely to be a superhump, owing to the large difference with P orb . Although we do not exactly know its physical origin, it reflects the complexity of disk oscillations in CVs.

3.2.6. Possible QPOs

DNe sometimes exhibit quasi-periodic fluctuations with a period ranging from a few tens to a few thousands of seconds [80]. Among them, the rapid oscillations, with a timescale of a few dozen seconds, are called dwarf nova oscillations (DNOs), while the oscillations with a longer period ranging from a few hundred to a few thousand seconds are regarded as quasi-periodic oscillations (QPOs). Owing to timing resolution, TMTS cannot detect any DNOs; instead, some possible QPOs were detected from the uninterrupted light curves of TMTS.
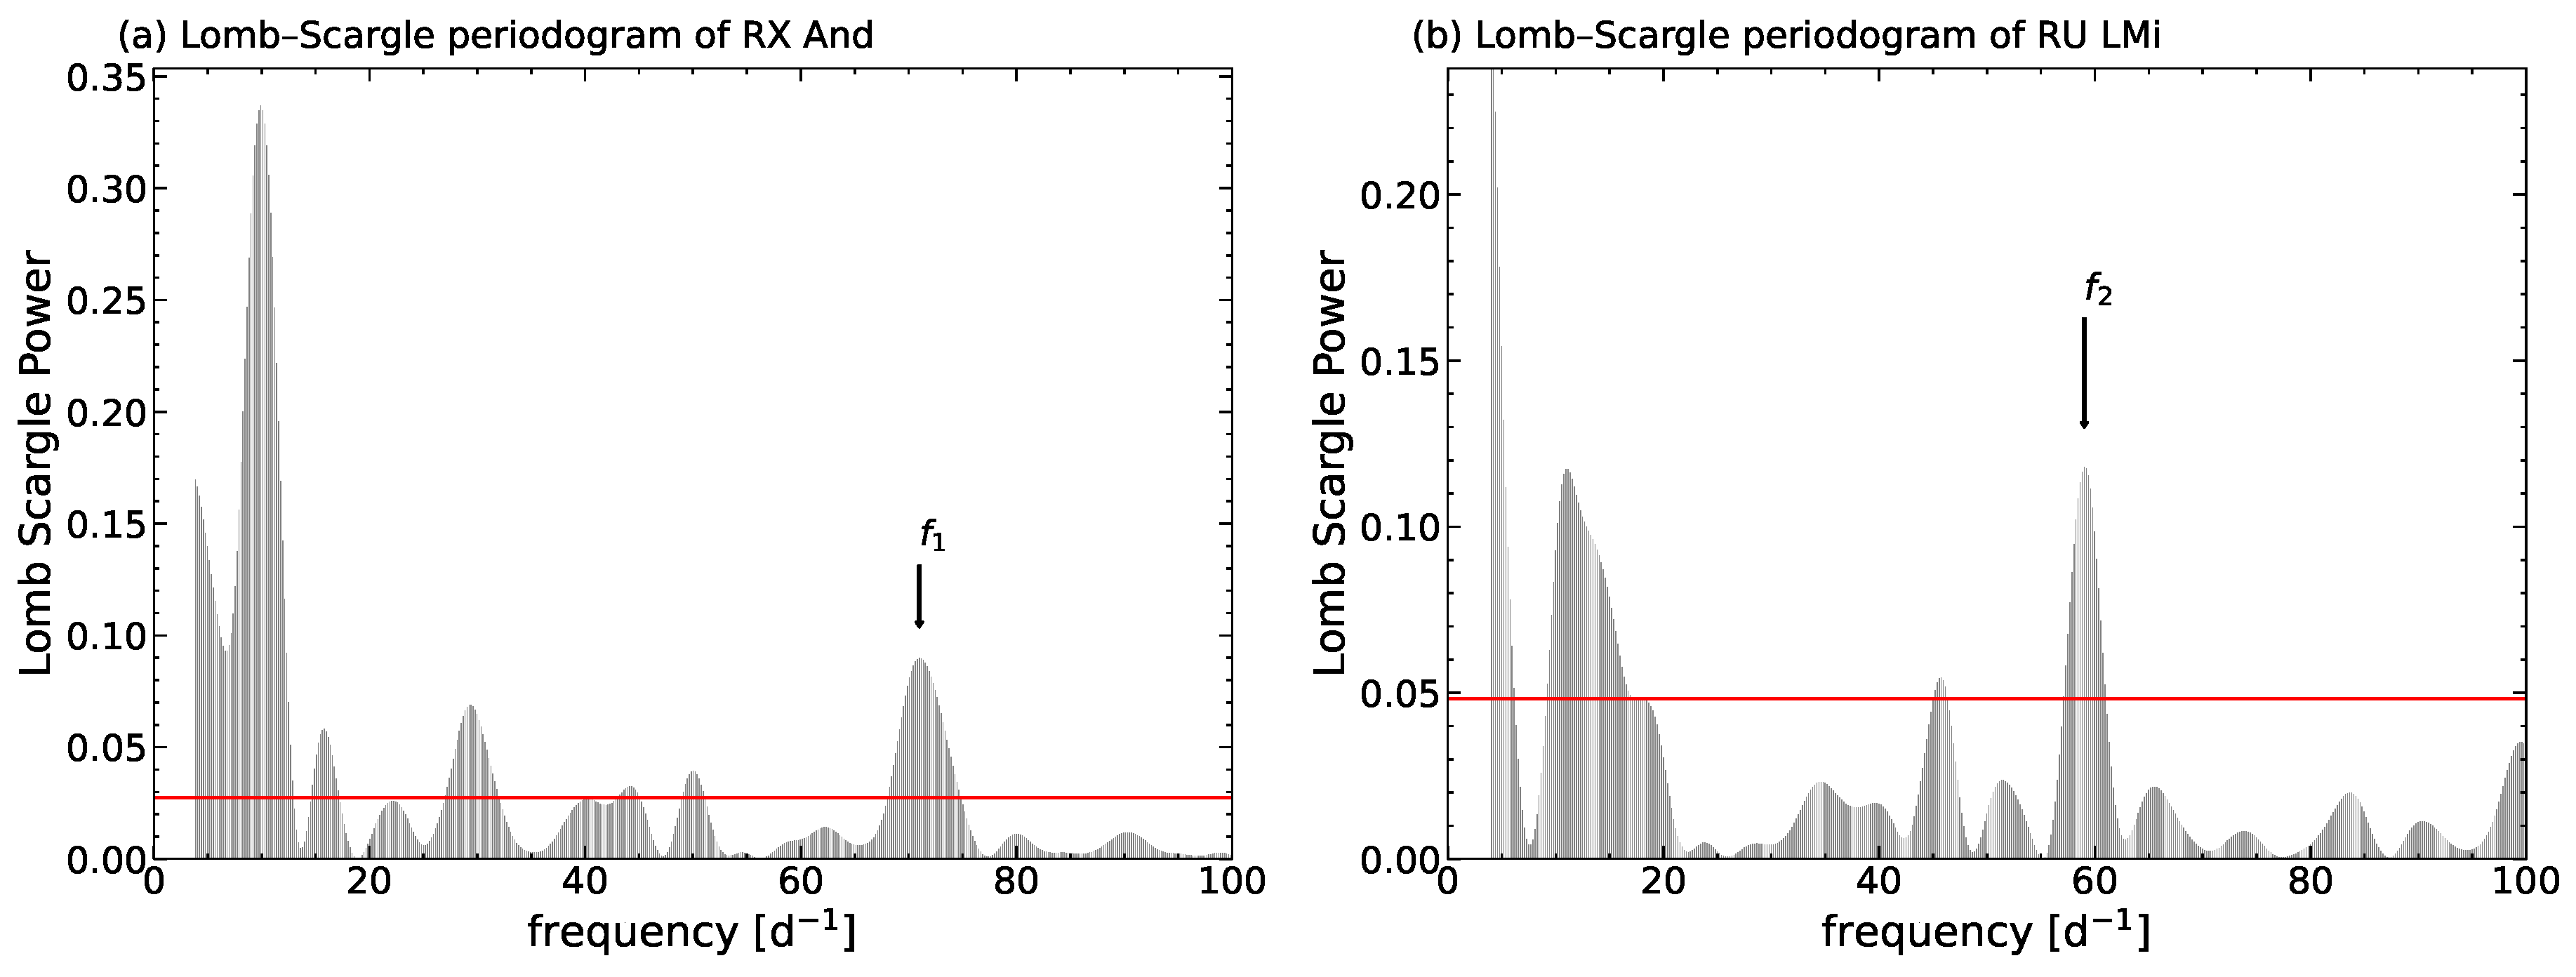
TMTS J01043552+4117576 (RX And) is a Z Cam-type DN with an orbital period of 5.08 h [81]. A periodicity of 35.7 s (DNO) was found in previous light curves [82], while Warner et al. [83] proposed that there was weak evidence of a 1000 s oscillation. In the upper panel of Figure 9, the LSP of the TMTS observations presents a period signal P 1 = 20.285 ± 0.006 min, within the typical timescale of QPOs.
TMTS J10020745+3351005 (RU LMi) was initially identified as a CV by Wagner et al. [84]. With photometric observations, Howell et al. [85] reported an orbital period of 355 min, while the spectrum of this object was consistent with those of typical DNs [86]. In the lower panel of Figure 9, a period signal of P 2 = 24.40 ± 0.07 min was detected via TMTS, which is also within the typical timescale of QPOs.

4. Discussion

4.1. Statistical Properties of  EW and FWHM for Nonmagnetic CVs

As introduced in Section 2.3, we collected the spectra of 44 CVs, for which the EW and FWHM of H α emission were measured. Since the accretion in magnetic CVs is governed by magnetic fields, their accretion geometries are essentially different from those of nonmagnetic systems in which the radiation of accretion disks dominates the emission [10,87]. Here, we focus on the spectroscopic properties of the 28 nonmagnetic CVs.
According to the period gap [18], the CVs can be divided into two groups: short-period CVs with P orb < 2.15 h and long-period CVs with P orb > 3.18 h. Adopting the orbital periods provided from the VSX shows that the 28 nonmagnetic CVs consist of 19 long-period systems (10 DNe and 9 NLs) and 9 short-period ones (9 DNe).
Because the sample of nonmagnetic CVs from the TMTS observations is relatively small, spectral data from the SDSS were also included in double-checking the robustness of the distribution trend. The SDSS CVs were cross-matched with the VSX catalog to collect their identification information, such as the subtype and orbital period. Then, the SDSS spectra of those nonmagnetic CVs (DNe and NLs) were analyzed with the same criteria as described in Section 2.3.
The spectra of DNe in the outburst state usually show narrow Balmer emission lines superposed on broad absorption wings. We adopted a composite model, a positive Gaussian function for the emission feature plus a negative one for the absorption, to fit such a profile. We found that the emission components during the outburst tend to have a small EW (typically, EW H α < 10 Å). For example, the EW H α of SDSS J105550.08+095620.4 is 8.54 Å during the outburst, while its EW H α was reported to be 70 Å in quiescence [88]. The significant difference in EW between the outburst and quiescent states prevented us from performing a reasonable comparison of the emission strengths of DNe. We thus excluded the DNe in the outburst state from our statistical study.
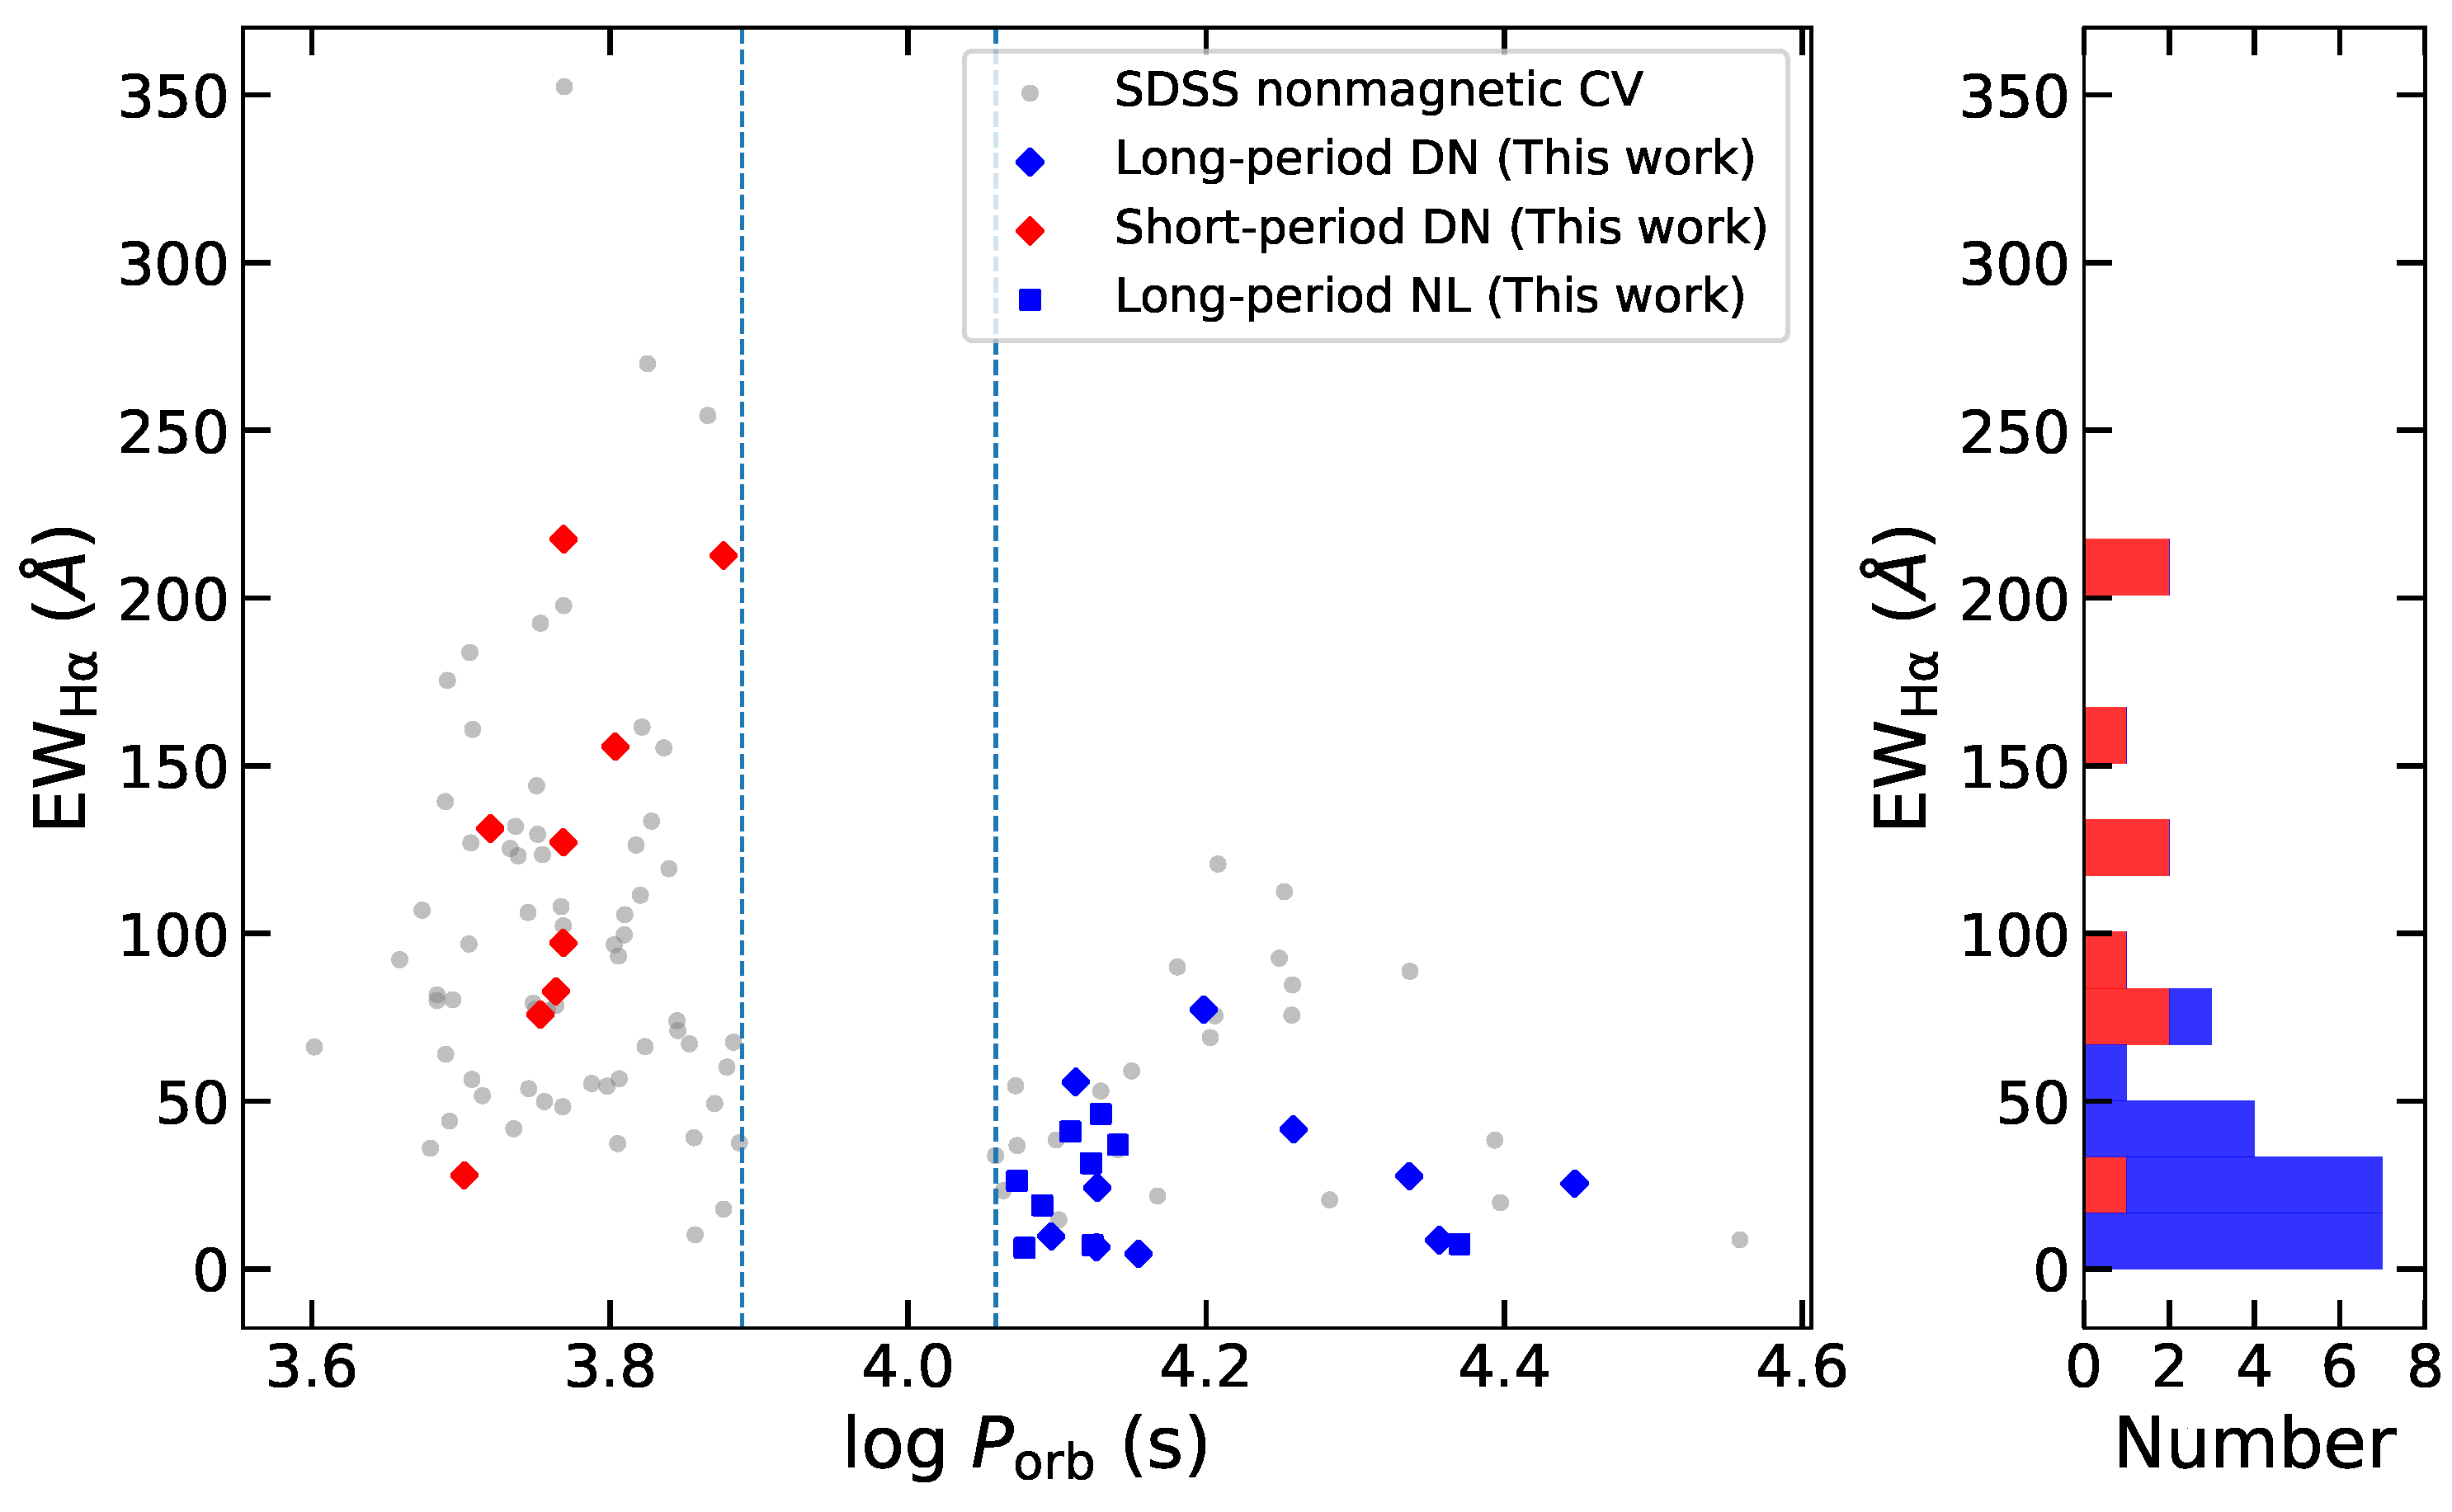
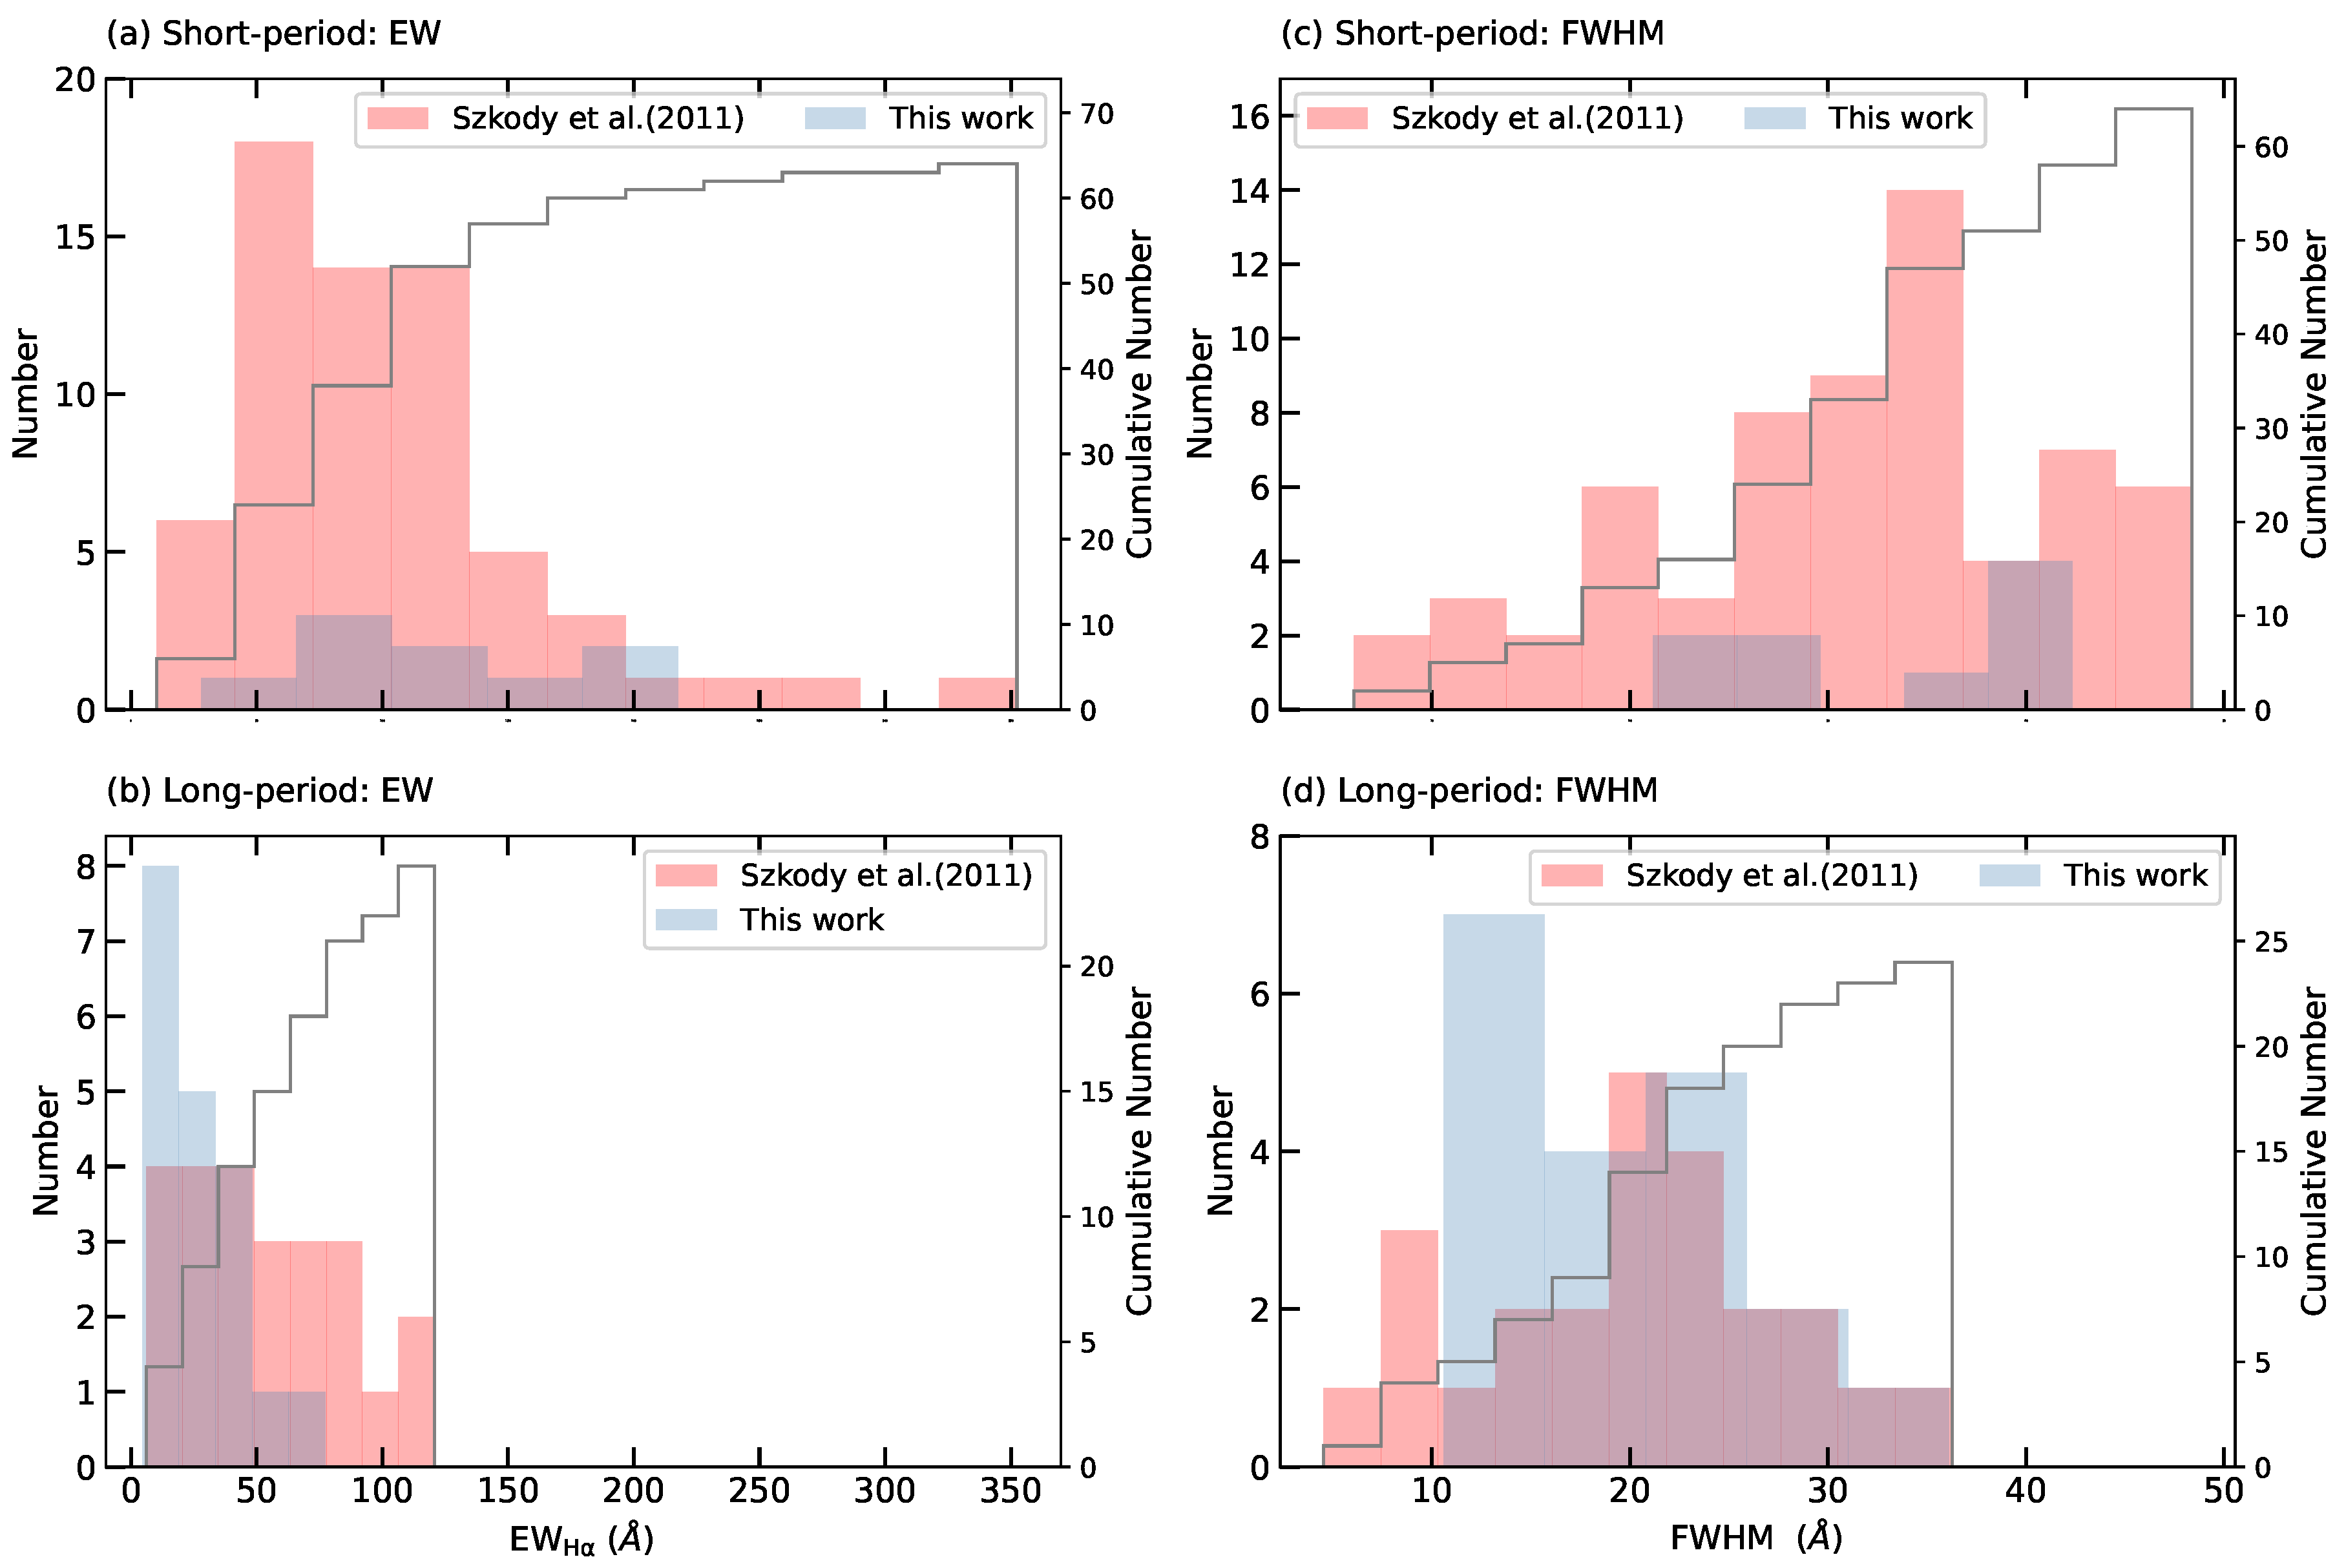
For the TMTS sample, the distributions of EW H α are shown in Figure 10, in which the nonmagnetic CVs with shorter orbital periods tend to have a wider feasible range of EW H α than those with longer periods. The mean EW H α values of CVs in the two subclasses are 125 Å and 26 Å, respectively. A similar trend can be seen from the FWHM H α distributions (see the blue columns in Figure 11).
The EW/FWHM distributions for 64 short-period CVs and 24 long-period CVs obtained from SDSS observations are appended to Figure 11 (the red columns; see also Table 2). The distribution trend yielded from the SDSS spectra is consistent with that revealed in the TMTS CV samples. To quantify the difference in H α strength between the long-period and short-period nonmagnetic CVs, we performed the two-sample Kolmogorov–Smirnov test (K-S test) for the SDSS EW H α distributions and obtained a p-value of 0.003, suggesting that the EW H α distributions above/below the period gap are quite different. Similarly, the p-value obtained for the SDSS FWHM H α distribution is 0.00005.
As shown in Figure 11, the EW and FWHM of the short-period nonmagnetic CVs are systematically larger than those of long-period systems. In particular, Figure 10 demonstrates that only short-period systems exhibit large EW H α (e.g., ≳130 Å) in their spectra. We supposed that the accretion disks in short-period nonmagnetic CVs tend to have smaller radii, which means that the H α emission regions are potentially closer to the accretors and thus suffer from a more intense Kepler broadening. In Figure 10, the H α strength among long-period sources does not show a correlation with P orb , which is a clue to the possible transformation of the accretion process that occurs when CVs go through the period gap.
Although the evolutionary path of CVs has been well understood [89], there are still some challenges in interpreting the large spread of CV orbital period distribution and the presence of more massive WDs in CVs [90,91]. These facts suggest that our understanding of CV evolution is incomplete. The distributions of H α strength presented here shed light on the CV evolution.
Since nonmagnetic CVs in the TMTS CV samples present the same EW H α and FWHM H α tendency as those from the SDSS sample, the effect of selection bias on the above conclusion is unlikely to be significant. Note that the SDSS CV sample should be more homogeneous since it includes faint sources and covers a wide color range [92,93]. However, the statistical conclusions in this work will require further verification with a more complete sample in the future.

4.2. The Implications of TMTS Light Curves

In Section 2.2.2, we highlighted several CV samples showing abnormally large-amplitude periodic variations. The polar EV UMa exhibits a large-amplitude orbital modulation, which can be explained by a heavily beamed cyclotron emission from the accretion column. The change in the angle between the line of sight and magnetic polar within an orbital period leads to large-amplitude photometric variations in the light curves [94,95]. Differing from most DNe in our samples, the dwarf nova FO Per presents a large-amplitude orbital modulation comparable to the polars.
Since the periodic variations could be related to the specific accretion state of CVs (e.g., pre-outburst state), the high-cadence survey observations are crucial to uninterruptedly record the light variations corresponding to the short-duration states in CVs (e.g., state transition). Furthermore, the high-cadence observations from TMTS can easily capture the rapid periodic variations (i.e., spin modulations) from IPs. For example, two spin frequencies for V1033 Cas ( P pho = 9.372 ± 0.005 min) and MU Cam ( P pho = 19.785 ± 0.009 min) were also revealed through the TMTS data (see Figure 12).

5. Conclusions

We have presented well-sampled light curves and spectra of 64 CVs or CV candidates observed/discovered during the first 3 years of the TMTS survey. By performing periodogram analysis, we identified two new CV candidates (TMTS J04405040+6820355 and TMTS J06183036+5105550) and nine new photometric periods for seven known CVs from the TMTS light curves. The properties of the two new CVs and the physical origins of new periods were discussed. TMTS J04405040+6820355 is inferred to be a new DN candidate, while TMTS J06183036+5105550 could be a new IP, as indicated by a linear polarization of ∼0.6%.
The short-timescale features from our high-cadence light curves can be classified into four types: eclipse, low-amplitude periodic variation, high-amplitude periodic variation, and rapid periodic variation. We attempted to explore the various short-timescale variations in CVs with these features.
With the CV spectra from LAMOST, XLT, and SDSS, we found that there are significant differencs in the distribution of H α emissions (i.e., EW H α and FWHM H α ) between nonmagnetic CVs located above and below the period gap, implying that the accretion nature of CVs should be tightly related to their evolutionary stages.

Author Contributions

Conceptualization and methodology, Q.L., J.L. (Jie Lin), and X.W.; data analysis, Q.L.; resources, Y.S., G.X., J.M., J.L. (Jialian Liu), S.Y., A.V.F., T.G.B., Y.Y., K.C.P., Y.C., Z.C., L.C., F.G., X.J., G.L., W.L. (Wenxiong Li), W.L. (Weili Lin), C.M., X.M., H.P., Q.X., D.X. and J.Z.; writing—original draft preparation, Q.L.; writing—review and editing, J.L. (Jie Lin), X.W., Z.D. and A.V.F. All authors have read and agreed to the published version of the manuscript.

Funding

This work was supported by the National Natural Science Foundation of China (NSFC grants 12288102 and 12033003), the Ma Huateng Foundation, and the New Cornerstone Science Foundation through the XPLORER PRIZE. J.L. is supported by the Cyrus Chun Ying Tang Foundations. Z.-B.D. acknowledges support from the CAS Light of West China Program, the Yunnan Youth Talent Project, the Yunnan Fundamental Research Projects (grant No. 2016FB007, No. 202201AT070180). A.V.F.’s team at U.C. Berkeley received support from the Christopher R. Redlich Fund, Gary and Cynthia Bengier, Clark and Sharon Winslow, Sanford Robertson, Alan Eustace, Briggs and Kathleen Wood, and many other donors. Y.-Z. Cai is supported by the NSFC (Grant No. 12303054), the Yunnan Fundamental Research Projects (Grant No. 202401AU070063) and the International Centre of Supernovae, Yunnan Key Laboratory (No. 202302AN360001).

Data Availability Statement

The study’s catalogs are all available in this paper. The TMTS photometric data, Xinglong 2.16 m telescope spectra, and Lick 3 m Shane telescope spectra can be obtained by contacting the corresponding authors.

Acknowledgments

This work includes the data from LAMOST (the Large Sky Area Multi-Object Fiber Spectroscopic Telescope), which is a National Major Scientific Project built by the Chinese Academy of Sciences. Funding for the project was provided by the National Development and Reform Commission. This work made use of data from the publicly available SDSS 12 data release. Funding for the Sloan Digital Sky Survey IV was provided by the Alfred P. Sloan Foundation, the U.S. Department of Energy Office of Science, and participating institutions. SDSS IV acknowledges support and resources from the Center for High Performance Computing at the University of Utah. The SDSS website is www.sdss4.org (accessed on 22 August 2024). This paper includes data collected through the TESS mission, obtained from the MAST data archive at the Space Telescope Science Institute (STScI). Funding for the TESS mission is provided by the NASA Explorer Program. STScI is operated by the Association of Universities for Research in Astronomy, Inc., under NASA contract NAS 5–26555. We also used data from the European Space Agency (ESA) mission Gaia (https://www.cosmos.esa.int/gaia (accessed on 22 August 2024)), processed by the Gaia Data Processing and Analysis Consortium (DPAC, https://www.cosmos.esa.int/web/gaia/dpac (accessed on 22 August 2024)). Funding for the DPAC was provided by national institutions, in particular the institutions participating in the Gaia Multilateral Agreement. This work made use of observations obtained with the Samuel Oschin 48-inch telescope and the 60-inch telescope at Palomar Observatory as part of the Zwicky Transient Facility project. ZTF is supported by the U.S. National Science Foundation (NSF) under grants AST-1440341 and AST-2034437 and collaboration including current partners Caltech, IPAC, the Weizmann Institute for Science, the Oskar Klein Center at Stockholm University, the University of Maryland, Deutsches Elektronen-Synchrotron and Humboldt University, the TANGO Consortium of Taiwan, the University of Wisconsin at Milwaukee, Trinity College Dublin, Lawrence Livermore National Laboratories, IN2P3, University of Warwick, Ruhr University Bochum, and Northwestern University, and former partners the University of Washington, Los Alamos National Laboratories, and Lawrence Berkeley National Laboratories. Operations are conducted by COO, IPAC, and UW. This research made use of the International Variable Star Index (VSX; Watson et al. [42]) database, operated at AAVSO, Cambridge, MA, USA.

Conflicts of Interest

The authors declare no conflicts of interest.

Appendix A

Figure A1. Light curves of DNe presented in this work. The start time of each observation can be found in Table 1.
Universe 10 00337 g0a1aUniverse 10 00337 g0a1b
Figure A2. Light curves of NLs presented in this work. The start time of each observation can be found in Table 1.
Universe 10 00337 g0a2
Figure A3. Light curves of IPs presented in this work. The start time of each observation can be found in Table 1.
Universe 10 00337 g0a3
Figure A4. Light curves of AMs presented in this work. The start time of each observation can be found in Table 1.
Universe 10 00337 g0a4
Figure A5. Light curves of CV candidates presented in this work. The start time of each observation can be found in Table 1.
Universe 10 00337 g0a5aUniverse 10 00337 g0a5b
Figure A6. Spectra of 53 cataclysmic variables mentioned in Section 2.3. The spectra taken with the Xinglong 2.16 m telescope, LAMOST, and Lick 3 m Shane telescope are shown in black, blue, and magenta colors, respectively. Some spectral characteristics are indicated with vertical dashed lines in different colors. The corresponding TMTS names are labeled on the right of each spectrum.
Universe 10 00337 g0a6aUniverse 10 00337 g0a6b

References

  1. Maoz, D.; Mannucci, F.; Nelemans, G. Observational Clues to the Progenitors of Type Ia Supernovae. Annu. Rev. Astron. Astrophys. 2014, 52, 107–170. [Google Scholar] [CrossRef]
  2. Liu, Z.W.; Röpke, F.K.; Han, Z. Type Ia Supernova Explosions in Binary Systems: A Review. Res. Astron. Astrophys. 2023, 23, 082001. [Google Scholar] [CrossRef]
  3. Nelemans, G.; Portegies Zwart, S.F.; Verbunt, F.; Yungelson, L.R. Population synthesis for double white dwarfs. II. Semi-detached systems: AM CVn stars. Astron. Astrophys. 2001, 368, 939–949. [Google Scholar] [CrossRef]
  4. Podsiadlowski, P.; Han, Z.; Rappaport, S. Cataclysmic variables with evolved secondaries and the progenitors of AM CVn stars. Mon. Not. R. Astron. Soc. 2003, 340, 1214–1228. [Google Scholar] [CrossRef]
  5. Luo, J.; Chen, L.S.; Duan, H.Z.; Gong, Y.G.; Hu, S.; Ji, J.; Liu, Q.; Mei, J.; Milyukov, V.; Sazhin, M.; et al. TianQin: A space-borne gravitational wave detector. Class. Quantum Gravity 2016, 33, 035010. [Google Scholar] [CrossRef]
  6. Amaro-Seoane, P.; Audley, H.; Babak, S.; Baker, J.; Barausse, E.; Bender, P.; Berti, E.; Binetruy, P.; Born, M.; Bortoluzzi, D.; et al. Laser Interferometer Space Antenna. arXiv 2017, arXiv:1702.00786. [Google Scholar] [CrossRef]
  7. Warner, B. Cataclysmic Variable Stars; Cambridge Astrophysics Series; Cambridge University Press: Cambridge, UK, 1995; Volume 28. [Google Scholar]
  8. Khangale, Z.N.; Woudt, P.A.; Potter, S.B.; Warner, B.; Kilkenny, D.; van der Heyden, K. A spectroscopic analysis of the eclipsing nova-like EC 21178-5417—Discovery of spiral density structures. Mon. Not. R. Astron. Soc. 2020, 495, 637–649. [Google Scholar] [CrossRef]
  9. Bridge, C.M.; Hakala, P.; Cropper, M.; Ramsay, G. Accretion stream mapping with ‘genetically modified fireflies’. Mon. Not. R. Astron. Soc. 2004, 351, 1423–1429. [Google Scholar] [CrossRef]
  10. Kennedy, M.R.; Garnavich, P.M.; Littlefield, C.; Marsh, T.R.; Callanan, P.; Breton, R.P.; Augusteijn, T.; Wagner, R.M.; Ashley, R.P.; Neric, M. Optical spectra of FO Aquarii during low and high accretion rates. Mon. Not. R. Astron. Soc. 2020, 495, 4445–4462. [Google Scholar] [CrossRef]
  11. Wu, K. Accretion onto Magnetic White Dwarfs. Space Sci. Rev. 2000, 93, 611–649. [Google Scholar] [CrossRef]
  12. Busschaert, C.; Falize, É.; Michaut, C.; Bonnet-Bidaud, J.M.; Mouchet, M. Quasi-periodic oscillations in accreting magnetic white dwarfs. II. The asset of numerical modelling for interpreting observations. Astron. Astrophys. 2015, 579, A25. [Google Scholar] [CrossRef]
  13. Bruch, A. TESS light curves of cataclysmic variables—II—Superhumps in old novae and novalike variables. Mon. Not. R. Astron. Soc. 2023, 519, 352–376. [Google Scholar] [CrossRef]
  14. Osaki, Y. Dwarf-Nova Outbursts. Publ. Astron. Soc. Pac. 1996, 108, 39. [Google Scholar] [CrossRef]
  15. Whitehurst, R.; King, A. Superhumps, resonances and accretion discs. Mon. Not. R. Astron. Soc. 1991, 249, 25–35. [Google Scholar] [CrossRef]
  16. Wood, M.A.; Thomas, D.M.; Simpson, J.C. SPH simulations of negative (nodal) superhumps: A parametric study. Mon. Not. R. Astron. Soc. 2009, 398, 2110–2121. [Google Scholar] [CrossRef]
  17. Thomas, D.M.; Wood, M.A. The Emergence of Negative Superhumps in Cataclysmic Variables: Smoothed Particle Hydrodynamics Simulations. Astrophys. J. 2015, 803, 55. [Google Scholar] [CrossRef]
  18. Knigge, C. The donor stars of cataclysmic variables. Mon. Not. R. Astron. Soc. 2006, 373, 484–502. [Google Scholar] [CrossRef]
  19. Spruit, H.C.; Ritter, H. Stellar activity and the period gap in cataclysmic variables. Astron. Astrophys. 1983, 124, 267–272. [Google Scholar]
  20. Patterson, J. The evolution of cataclysmic and low-mass X-ray binaries. Astrophys. J. Suppl. Ser. 1984, 54, 443–493. [Google Scholar] [CrossRef]
  21. Williams, R.E. Emission lines from the accretion disks of cataclysmic variables. Astrophys. J. 1980, 235, 939–944. [Google Scholar] [CrossRef]
  22. Cheng, F.H.; Lin, D.N.C. Spectral Evolution of Accretion Disks of Dwarf Novae. II. Radiative Transfer Models. Astrophys. J. 1989, 337, 432. [Google Scholar] [CrossRef]
  23. Sarty, G.E.; Wu, K. Multivariate Characterization of Hydrogen Balmer Emission in Cataclysmic Variables. Publ. Astron. Soc. Aust. 2006, 23, 106–118. [Google Scholar] [CrossRef]
  24. Koch, D.G.; Borucki, W.J.; Basri, G.; Batalha, N.M.; Brown, T.M.; Caldwell, D.; Christensen-Dalsgaard, J.; Cochran, W.D.; DeVore, E.; Dunham, E.W.; et al. Kepler Mission Design, Realized Photometric Performance, and Early Science. Astrophys. J. Lett. 2010, 713, L79–L86. [Google Scholar] [CrossRef]
  25. Ricker, G.R.; Winn, J.N.; Vanderspek, R.; Latham, D.W.; Bakos, G.Á.; Bean, J.L.; Berta-Thompson, Z.K.; Brown, T.M.; Buchhave, L.; Butler, N.R.; et al. Transiting Exoplanet Survey Satellite (TESS). J. Astron. Telesc. Instrum. Syst. 2015, 1, 014003. [Google Scholar] [CrossRef]
  26. Otulakowska-Hypka, M.; Olech, A.; Patterson, J. Statistical analysis of properties of dwarf novae outbursts. Mon. Not. R. Astron. Soc. 2016, 460, 2526–2541. [Google Scholar] [CrossRef]
  27. Bruch, A. Flickering around the outburst cycle in Kepler dwarf novae. Mon. Not. R. Astron. Soc. 2022, 509, 4669–4678. [Google Scholar] [CrossRef]
  28. Zhang, J.C.; Wang, X.F.; Mo, J.; Xi, G.B.; Lin, J.; Jiang, X.J.; Zhang, X.M.; Li, W.X.; Yan, S.Y.; Chen, Z.H.; et al. The Tsinghua University-Ma Huateng Telescopes for Survey: Overview and Performance of the System. Publ. Astron. Soc. Pac. 2020, 132, 125001. [Google Scholar] [CrossRef]
  29. Cui, X.Q.; Zhao, Y.H.; Chu, Y.Q.; Li, G.P.; Li, Q.; Zhang, L.P.; Su, H.J.; Yao, Z.Q.; Wang, Y.N.; Xing, X.Z.; et al. The Large Sky Area Multi-Object Fiber Spectroscopic Telescope (LAMOST). Res. Astron. Astrophys. 2012, 12, 1197–1242. [Google Scholar] [CrossRef]
  30. Zhao, G.; Zhao, Y.H.; Chu, Y.Q.; Jing, Y.P.; Deng, L.C. LAMOST spectral survey—An overview. Res. Astron. Astrophys. 2012, 12, 723–734. [Google Scholar] [CrossRef]
  31. Lin, J.; Wang, X.; Mo, J.; Xi, G.; Zhang, J.; Jiang, X.; Shi, J.; Zhang, X.; Zhang, X.; Wei, Z.; et al. Minute-cadence observations of the LAMOST fields with the TMTS: I. Methodology of detecting short-period variables and results from the first-year survey. Mon. Not. R. Astron. Soc. 2022, 509, 2362–2376. [Google Scholar] [CrossRef]
  32. Liu, Q.; Lin, J.; Wang, X.; Gu, S.; Shi, J.; Zhang, L.; Xi, G.; Mo, J.; Cai, Y.; Chen, L.; et al. Minute-cadence observations of the LAMOST fields with the TMTS—III. Statistical study of the flare stars from the first two years. Mon. Not. R. Astron. Soc. 2023, 523, 2193–2208. [Google Scholar] [CrossRef]
  33. Lin, J.; Wu, C.; Xiong, H.; Wang, X.; Németh, P.; Han, Z.; Li, J.; Elias-Rosa, N.; Salmaso, I.; Filippenko, A.V.; et al. A seven-Earth-radius helium-burning star inside a 20.5-min detached binary. Nat. Astron. 2024, 8, 491–503. [Google Scholar] [CrossRef]
  34. Lin, J.; Wu, C.; Wang, X.; Németh, P.; Xiong, H.; Wu, T.; Filippenko, A.V.; Cai, Y.; Brink, T.G.; Yan, S.; et al. An 18.9 min blue large-amplitude pulsator crossing the ‘Hertzsprung gap’ of hot subdwarfs. Nat. Astron. 2023, 7, 223–233. [Google Scholar] [CrossRef]
  35. Lin, J.; Wang, X.; Mo, J.; Xi, G.; Filippenko, A.V.; Yan, S.; Brink, T.G.; Yang, Y.; Wu, C.; Németh, P.; et al. Minute-cadence observations of the LAMOST fields with the TMTS: II. Catalogues of short-period variable stars from the first 2-yr surveys. Mon. Not. R. Astron. Soc. 2023, 523, 2172–2192. [Google Scholar] [CrossRef]
  36. Guo, F.; Lin, J.; Wang, X.; Chen, X.; Li, T.; Chen, L.; Xia, Q.; Mo, J.; Xi, G.; Zhang, J.; et al. Minute-cadence observations of the LAMOST Fields with the TMTS—V. Machine learning classification of TMTS catalogues of periodic variable stars. Mon. Not. R. Astron. Soc. 2024, 528, 6997–7015. [Google Scholar] [CrossRef]
  37. Wenger, M.; Ochsenbein, F.; Egret, D.; Dubois, P.; Bonnarel, F.; Borde, S.; Genova, F.; Jasniewicz, G.; Laloë, S.; Lesteven, S.; et al. The SIMBAD astronomical database. The CDS reference database for astronomical objects. Astron. Astrophys. Suppl. 2000, 143, 9–22. [Google Scholar] [CrossRef]
  38. Downes, R.A.; Webbink, R.F.; Shara, M.M.; Ritter, H.; Kolb, U.; Duerbeck, H.W. A Catalog and Atlas of Cataclysmic Variables: The Living Edition. Publ. Astron. Soc. Pac. 2001, 113, 764–768. [Google Scholar] [CrossRef]
  39. Ritter, H.; Kolb, U. Catalogue of cataclysmic binaries, low-mass X-ray binaries and related objects (Seventh edition). Astron. Astrophys. 2003, 404, 301–303. [Google Scholar] [CrossRef]
  40. Szkody, P.; Anderson, S.F.; Brooks, K.; Gänsicke, B.T.; Kronberg, M.; Riecken, T.; Ross, N.P.; Schmidt, G.D.; Schneider, D.P.; Agüeros, M.A.; et al. Cataclysmic Variables from the Sloan Digital Sky Survey. VIII. The Final Year (2007–2008). Astron. J. 2011, 142, 181. [Google Scholar] [CrossRef]
  41. Sun, Y.; Cheng, Z.; Ye, S.; Ding, R.; Peng, Y.; Zhang, J.; Huo, Z.; Cui, W.; Wang, X.; Shi, J.; et al. A Catalog of 323 Cataclysmic Variables from LAMOST DR6. Astrophys. J. Suppl. Ser. 2021, 257, 65. [Google Scholar] [CrossRef]
  42. Watson, C.L.; Henden, A.A.; Price, A. The International Variable Star Index (VSX). Soc. Astron. Sci. Annu. Symp. 2006, 25, 47. [Google Scholar]
  43. Hou, W.; Luo, A.l.; Li, Y.B.; Qin, L. Spectroscopically Identified Cataclysmic Variables from the LAMOST Survey. I. The Sample. Astron. J. 2020, 159, 43. [Google Scholar] [CrossRef]
  44. Thorstensen, J.R. Follow-up Studies of Five Cataclysmic Variable Candidates Discovered by LAMOST. Astron. J. 2020, 160, 151. [Google Scholar] [CrossRef]
  45. Szkody, P.; Anderson, S.F.; Hayden, M.; Kronberg, M.; McGurk, R.; Riecken, T.; Schmidt, G.D.; West, A.A.; Gänsicke, B.T.; Nebot Gomez-Moran, A.; et al. Cataclysmic Variables from SDSS. VII. The Seventh Year (2006). Astron. J. 2009, 137, 4011–4019. [Google Scholar] [CrossRef]
  46. Denisenko, D. MASTER OT J072007.30+451611.6: Cataclysmic Variable with an Extreme Hot Spot. Astron. Telegr. 2018, 11626, 1. [Google Scholar]
  47. Drake, A.J.; Graham, M.J.; Djorgovski, S.G.; Catelan, M.; Mahabal, A.A.; Torrealba, G.; García-Álvarez, D.; Donalek, C.; Prieto, J.L.; Williams, R.; et al. The Catalina Surveys Periodic Variable Star Catalog. Astrophys. J. Suppl. Ser. 2014, 213, 9. [Google Scholar] [CrossRef]
  48. Osborne, J.P.; Page, K.L.; Henden, A.A.; Ness, J.-U.; Bode, M.F.; Schwarz, G.J.; Starrfield, S.; Drake, J.J.; Kuulkers, E.; Beardmore, A.P. Swift observations of the March 2011 outburst of the cataclysmic variable NSV 1436: A probable dwarf nova. Astron. Astrophys. 2011, 533, A41. [Google Scholar] [CrossRef]
  49. Denisenko, D.; Podvorotny, P.; Balanutsa, P.; Shurpakov, S.; Tiurina, N.; Gorbovskoy, E.; Lipunov, V.; Kornilov, V.; Belinski, A.; Shatskiy, N.; et al. One very bright and one bright OT detected by MASTER. Astron. Telegr. 2012, 4441, 1. [Google Scholar]
  50. Kato, T.; Hambsch, F.J.; Monard, B.; Vanmunster, T.; Maeda, Y.; Miller, I.; Itoh, H.; Kiyota, S.; Isogai, K.; Kimura, M.; et al. Survey of period variations of superhumps in SU UMa-type dwarf novae. VIII. The eighth year (2015–2016). Publ. Astron. Soc. Jpn. 2016, 68, 65. [Google Scholar] [CrossRef]
  51. Kozhevnikov, V.P. An extensive photometric study of the recently discovered intermediate polar V515 And (XSS J00564+4548). Mon. Not. R. Astron. Soc. 2012, 422, 1518–1526. [Google Scholar] [CrossRef]
  52. Witham, A.R.; Knigge, C.; Aungwerojwit, A.; Drew, J.E.; Gänsicke, B.T.; Greimel, R.; Groot, P.J.; Roelofs, G.H.A.; Steeghs, D.; Woudt, P.A. Newly discovered cataclysmic variables from the INT/WFC photometric Hα survey of the northern Galactic plane. Mon. Not. R. Astron. Soc. 2007, 382, 1158–1168. [Google Scholar] [CrossRef]
  53. Yakin, D.G.; Suleimanov, V.F.; Vlasyuk, V.V.; Spiridonova, O.I. HBHA 4705-03: A new cataclysmic variable. Astron. Lett. 2013, 39, 38–53. [Google Scholar] [CrossRef]
  54. Thorne, K.; Garnavich, P.; Mohrig, K. The Polar CSS 081231:071126+440405 at a Low Accretion Rate. Inf. Bull. Var. Stars 2010, 5923, 1. [Google Scholar] [CrossRef]
  55. Lomb, N.R. Least-Squares Frequency Analysis of Unequally Spaced Data. Astrophys. Space Sci. 1976, 39, 447–462. [Google Scholar] [CrossRef]
  56. Scargle, J.D. Studies in astronomical time series analysis. II. Statistical aspects of spectral analysis of unevenly spaced data. Astrophys. J. 1982, 263, 835–853. [Google Scholar] [CrossRef]
  57. VanderPlas, J.T. Understanding the Lomb-Scargle Periodogram. Astrophys. J. Suppl. Ser. 2018, 236, 16. [Google Scholar] [CrossRef]
  58. Long, L.; Zhang, L.Y.; Bi, S.L.; Shi, J.; Lu, H.P.; Han, X.L.; Wang, H.; Prabhakar, M. Chromospheric Activity of Periodic Variable Stars Based on the LAMOST Low- and Medium-resolution Spectral Survey. Astrophys. J. Suppl. Ser. 2021, 253, 51. [Google Scholar] [CrossRef]
  59. Bellm, E.C.; Kulkarni, S.R.; Graham, M.J.; Dekany, R.; Smith, R.M.; Riddle, R.; Masci, F.J.; Helou, G.; Prince, T.A.; Adams, S.M.; et al. The Zwicky Transient Facility: System Overview, Performance, and First Results. Publ. Astron. Soc. Pac. 2019, 131, 018002. [Google Scholar] [CrossRef]
  60. Masci, F.J.; Laher, R.R.; Rusholme, B.; Shupe, D.L.; Groom, S.; Surace, J.; Jackson, E.; Monkewitz, S.; Beck, R.; Flynn, D.; et al. The Zwicky Transient Facility: Data Processing, Products, and Archive. Publ. Astron. Soc. Pac. 2019, 131, 018003. [Google Scholar] [CrossRef]
  61. Patra, K.C.; Yang, Y.; Brink, T.G.; Höflich, P.; Wang, L.; Filippenko, A.V.; Kasen, D.; Baade, D.; Foley, R.J.; Maund, J.R.; et al. Spectropolarimetry of the Type Ia SN 2019ein rules out significant global asphericity of the ejecta. Mon. Not. R. Astron. Soc. 2022, 509, 4058–4070. [Google Scholar] [CrossRef]
  62. Piirola, V.; Hakala, P.; Coyne, G.V. The Discovery of Variable Polarization over the 13.9 Minute Spin Period of the Intermediate Polar RE 0751+14. Astrophys. J. Lett. 1993, 410, L107. [Google Scholar] [CrossRef]
  63. Butters, O.W.; Katajainen, S.; Norton, A.J.; Lehto, H.J.; Piirola, V. Circular polarization survey of intermediate polars I. Northern targets in the range 17 h < RA < 23 h. Astron. Astrophys. 2009, 496, 891–902. [Google Scholar] [CrossRef]
  64. Potter, S.B.; Romero-Colmenero, E.; Kotze, M.; Zietsman, E.; Butters, O.W.; Pekeur, N.; Buckley, D.A.H. On the spin modulated circular polarization from the intermediate polars NY Lup and IGR J15094-6649. Mon. Not. R. Astron. Soc. 2012, 420, 2596–2602. [Google Scholar] [CrossRef]
  65. Gentile Fusillo, N.P.; Rebassa-Mansergas, A.; Gänsicke, B.T.; Liu, X.W.; Ren, J.J.; Koester, D.; Zhan, Y.; Hou, Y.; Wang, Y.; Yang, M. An independent test of the photometric selection of white dwarf candidates using LAMOST DR3. Mon. Not. R. Astron. Soc. 2015, 452, 765–773. [Google Scholar] [CrossRef]
  66. Kafka, S.; Honeycutt, R.K.; Howell, S.B.; Harrison, T.E. A Multiwavelength Study of AM Herculis during the 2002–2004 Low States. Astron. J. 2005, 130, 2852–2865. [Google Scholar] [CrossRef]
  67. Covington, A.E.; Shaw, A.W.; Mukai, K.; Littlefield, C.; Heinke, C.O.; Plotkin, R.M.; Barrett, D.; Boardman, J.; Boyd, D.; Brincat, S.M.; et al. Investigating the Low-flux States in Six Intermediate Polars. Astrophys. J. 2022, 928, 164. [Google Scholar] [CrossRef]
  68. Drake, A.J.; Catelan, M.; Djorgovski, S.G.; Torrealba, G.; Graham, M.J.; Mahabal, A.; Prieto, J.L.; Donalek, C.; Williams, R.; Larson, S.; et al. Evidence for a Milky Way Tidal Stream Reaching Beyond 100 kpc. Astrophys. J 2013, 765, 154. [Google Scholar] [CrossRef]
  69. Hou, W.; Luo, A.L.; Dong, Y.Q.; Chen, X.L.; Bai, Z.R. Spectroscopically Identified Cataclysmic Variables from the LAMOST Survey. II. Period Estimates. Astron. J. 2023, 165, 148. [Google Scholar] [CrossRef]
  70. Morgenroth, O. 50 neue Veränderliche. Astron. Nachrichten 1939, 268, 273–276. [Google Scholar] [CrossRef]
  71. Bruch, A. Spectroscopy of poorly known northern dwarf novae. Part I. Astron. Astrophys. Suppl. Ser. 1989, 78, 145–159. [Google Scholar]
  72. Sheets, H.A.; Thorstensen, J.R.; Peters, C.J.; Kapusta, A.B.; Taylor, C.J. Spectroscopy of Nine Cataclysmic Variable Stars. Publ. Astron. Soc. Pac. 2007, 119, 494–507. [Google Scholar] [CrossRef]
  73. Kraft, R.P.; Luyten, W.J. Binary Stars among Cataclysmic Variables.VI. on the Mean Absolute Magnitude of U Geminorum Variables. Astrophys. J. 1965, 142, 1041. [Google Scholar] [CrossRef]
  74. Shafter, A.W.; Harkness, R.P. Spectroscopic orbits for the dwarf novae X Leonis and SS Aurigae. Astron. J. 1986, 92, 658–663. [Google Scholar] [CrossRef]
  75. Godon, P.; Sion, E.M. White Dwarf Photospheric Abundances in Cataclysmic Variables. I. SS Aurigae and TU Mensae. Astrophys. J. 2021, 908, 173. [Google Scholar] [CrossRef]
  76. Green, R.F.; Schmidt, M.; Liebert, J. The Palomar-Green Catalog of Ultraviolet-Excess Stellar Objects. Astrophys. J. Suppl. Ser. 1986, 61, 305. [Google Scholar] [CrossRef]
  77. Koen, C.; Orosz, J. PG 2337+300: A new cataclysmic variable. IBVS 1997, 4539, 1. Available online: https://ibvs.konkoly.hu/pub/ibvs/4501/4539.pdf (accessed on 22 August 2024).
  78. Ringwald, F.A.; Velasco, K.; Roveto, J.J.; Meyers, M.E. The orbital period and negative superhumps of the nova-like cataclysmic variable V378 Pegasi. New Astron. 2012, 17, 433–437. [Google Scholar] [CrossRef]
  79. Kozhevnikov, V.P. Detection of superhumps in the cataclysmic variable V378 Peg (PG 2337+300). New Astron. 2012, 17, 38–42. [Google Scholar] [CrossRef]
  80. Scepi, N.; Begelman, M.C.; Dexter, J. QPOs in compact binaries from small-scale eruptions in an inner magnetized disc. Mon. Not. R. Astron. Soc. 2021, 500, 1547–1556. [Google Scholar] [CrossRef]
  81. Kraft, R.P. Binary Stars among Cataclysmic Variables. I. U Geminorum Stars (dwarf Novae). Astrophys. J. 1962, 135, 408. [Google Scholar] [CrossRef]
  82. Szkody, P. Observed pulsations in dwarf novae at maximum. Astrophys. J. 1976, 207, 190–194. [Google Scholar] [CrossRef]
  83. Warner, B.; Woudt, P.A.; Pretorius, M.L. Dwarf nova oscillations and quasi-periodic oscillations in cataclysmic variables—III. A new kind of dwarf nova oscillation, and further examples of the similarities to X-ray binaries. Mon. Not. R. Astron. Soc. 2003, 344, 1193–1209. [Google Scholar] [CrossRef]
  84. Wagner, R.M.; Sion, E.M.; Liebert, J.; Starrfield, S.G. Hot Subluminous Stars and Blue Objects in the Case Low-Dispersion Northern Sky Survey. I. Astrophys. J. 1988, 328, 213. [Google Scholar] [CrossRef]
  85. Howell, S.B.; Szkody, P.; Kreidl, T.J.; Mason, K.O.; Puchnarewicz, E.M. CCD Time-Resolved Photometry of Faint Cataclysmic Variables. III. Publ. Astron. Soc. Pac. 1990, 102, 758. [Google Scholar] [CrossRef]
  86. Howell, S.B.; Liebert, J.; Wagner, R.M. Spectroscopy of Faint Cataclysmic Variables III. Inf. Bull. Var. Stars 1994, 4074, 1. [Google Scholar]
  87. Cropper, M. The Polars. Space Sci. Rev. 1990, 54, 195–295. [Google Scholar] [CrossRef]
  88. Thorstensen, J.R.; Alper, E.H.; Weil, K.E. A Trip to the Cataclysmic Binary Zoo: Detailed Follow-up of 35 Recently Discovered Systems. Astron. J. 2016, 152, 226. [Google Scholar] [CrossRef]
  89. Knigge, C.; Baraffe, I.; Patterson, J. The Evolution of Cataclysmic Variables as Revealed by Their Donor Stars. Astrophys. J. Suppl. Ser. 2011, 194, 28. [Google Scholar] [CrossRef]
  90. Pala, A.F.; Gänsicke, B.T.; Townsley, D.; Boyd, D.; Cook, M.J.; De Martino, D.; Godon, P.; Haislip, J.B.; Henden, A.A.; Hubeny, I.; et al. Effective temperatures of cataclysmic-variable white dwarfs as a probe of their evolution. Mon. Not. R. Astron. Soc. 2017, 466, 2855–2878. [Google Scholar] [CrossRef]
  91. Pala, A.F.; Gänsicke, B.T.; Belloni, D.; Parsons, S.G.; Marsh, T.R.; Schreiber, M.R.; Breedt, E.; Knigge, C.; Sion, E.M.; Szkody, P.; et al. Constraining the evolution of cataclysmic variables via the masses and accretion rates of their underlying white dwarfs. Mon. Not. R. Astron. Soc. 2022, 510, 6110–6132. [Google Scholar] [CrossRef]
  92. Gänsicke, B.T.; Dillon, M.; Southworth, J.; Thorstensen, J.R.; Rodríguez-Gil, P.; Aungwerojwit, A.; Marsh, T.R.; Szkody, P.; Barros, S.C.C.; Casares, J.; et al. SDSS unveils a population of intrinsically faint cataclysmic variables at the minimum orbital period. Mon. Not. R. Astron. Soc. 2009, 397, 2170–2188. [Google Scholar] [CrossRef]
  93. Zorotovic, M.; Schreiber, M.R.; Gänsicke, B.T. Post common envelope binaries from SDSS. XI. The white dwarf mass distributions of CVs and pre-CVs. Astron. Astrophys. 2011, 536, A42. [Google Scholar] [CrossRef]
  94. Gänsicke, B.T.; Fischer, A.; Silvotti, R.; de Martino, D. A model for the optical high state light curve of AM Herculis. Astron. Astrophys. 2001, 372, 557–562. [Google Scholar] [CrossRef]
  95. Littlefield, C.; Garnavich, P.; Magno, K.; Murison, M.; Deal, S.; McClelland, C.; Rose, B. High-Amplitude, Rapid Photometric Variation of the New Polar MASTER OT J132104.04+560957.8. Inf. Bull. Var. Stars 2015, 6129, 1. [Google Scholar] [CrossRef]
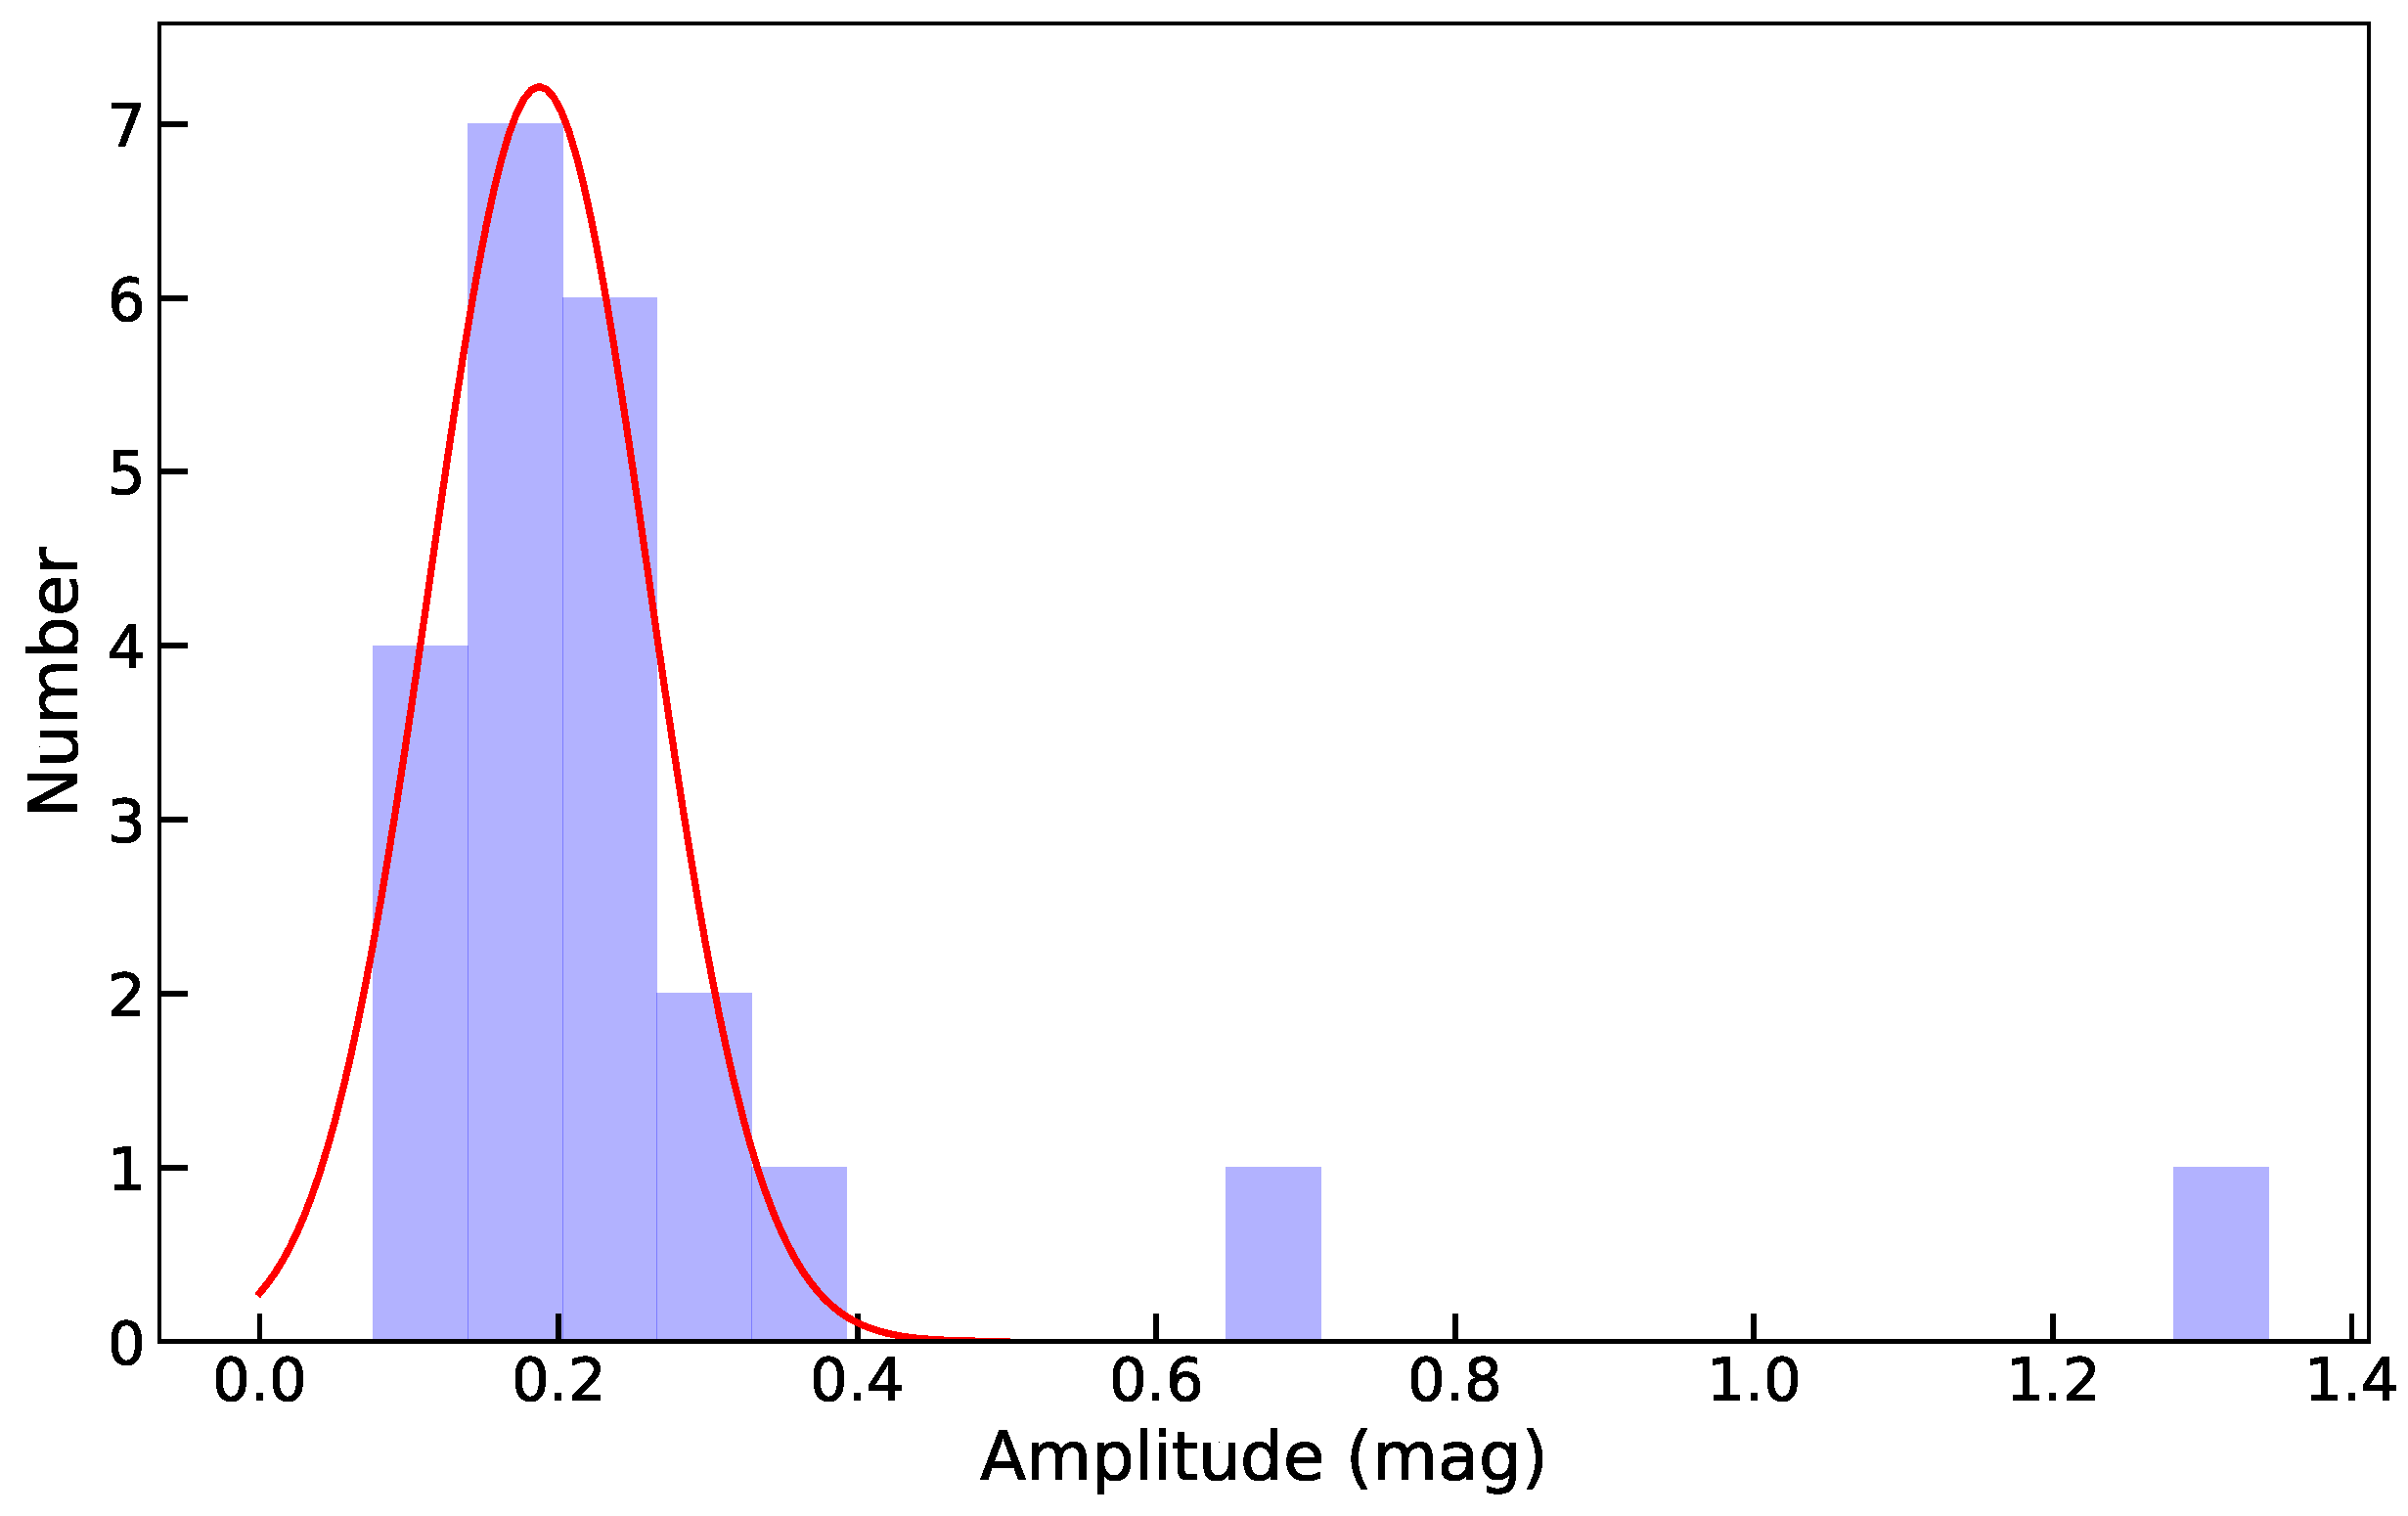
Figure 1. Distribution of the amplitude of periodic variations from noneclipse CVs. The red line represents a Gaussian fit.
Universe 10 00337 g001
Figure 2. (a) TMTS light curve of TMTS J04405040+6820355; (b) Lomb–Scargle periodogram of TMTS J04405040+6820355, the horizontal red line represents the 0.1% significance level; (c) phase-folded TMTS light curve with P 1 = 110.0 min, with the red line representing the best-fit model of fourth-order Fourier series; (d) the XLT spectrum of TMTS J04405040+6820355.
Universe 10 00337 g002
Figure 3. Spectropolarimetry of TMTS J06183036+5105550 obtained with the Lick/Shane 3 m telescope on 22 November 2022. The cyan vertical bands represent the regions of telluric correction. The top panel presents the total-flux spectrum. The panels below the total-flux spectrum represent the polarimetry after the ISP correction. The gray-shaded area indicates the associated 1 σ uncertainty.
Universe 10 00337 g003
Figure 4. (a) TMTS light curve of SDSS J013855.86+242939.2; (b) Lomb–Scargle periodogram of SDSS J013855.86+242939.2, the horizontal red line represents the 0.1% significance level; (c) phase-folded light curve with a period of 179.0 min. The red line represents the best-fit model of fourth-order Fourier series.
Universe 10 00337 g004
Figure 5. (a) TESS light curve of TMTS J03471387+1611083; (b) TMTS light curve of TMTS J03471387+1611083; (c) Lomb–Scargle periodogram of the TMTS light curve in (b), the horizontal red line represents the 0.1% significance level; (d) Lomb–Scargle periodogram of the TESS light curve in (a), the horizontal red line represents the 0.1% significance level; (e) phase-folded light curve with P 3 = 101.064 min.
Universe 10 00337 g005
Figure 6. (a) TMTS light curve of FO Per; (b) Lomb–Scargle periodogram of the TMTS light curve; (c) phase-folded TMTS light curve with P 1 = 208.0 min, with the red line representing the best-fit model of fourth-order Fourier series; (d) TESS light curve of FO Per; (e) Lomb–Scargle periodogram of the TESS light curve in (d), the horizontal red line represents the 0.1% significance level; (f) phase-folded TESS light curve with P 2 = 202.517 min.
Universe 10 00337 g006
Figure 7. (a) TMTS light curve of SS Aur; (b) Lomb–Scargle periodogram of the TMTS light curve, the horizontal red line represents the 0.1% significance level.
Universe 10 00337 g007
Figure 8. (a) TMTS light curve of V378 Peg; (b) Lomb–Scargle periodogram of the TMTS light curve, the horizontal red line represents the 0.1% significance level; (c) phase-folded TMTS light curve with P 1 = 122.4 min (a second-order polynomial was subtracted to detrend), with the red line representing the best-fit model of fourth-order Fourier series.
Universe 10 00337 g008
Figure 9. (a) Lomb–Scargle periodogram of RX And; (b) Lomb–Scargle periodogram of RU LMi. The horizontal red lines represent the 0.1% significance level.
Universe 10 00337 g009
Figure 10. Distribution of EW H α measured for the nonmagnetic CV sample as a function of log P orb . Diamond and square points represent the DNe and NLs in this catalog, respectively, while red and blue colors indicate short-period and long-period subclasses. Gray circle points represent the sources from Szkody et al. [40]. The two vertical blue dashed lines mark the period gap ( 2.15 h P orb 3.18 h ; see Knigge [18]).
Universe 10 00337 g010
Figure 11. Histogram distribution of EW (a,b) and FWHM (c,d) of H α emission in spectra of nonmagnetic CVs. Panels (a,c): distribution of short-period nonmagnetic CVs. Panels (b,d): distribution of long-period nonmagnetic CVs. The red columns represent the nonmagnetic CVs from Szkody et al. [40], while the blue columns represent the nonmagnetic CVs from our sample. The gray lines show the cumulative distributions of the SDSS nonmagnetic CV sample.
Universe 10 00337 g011
Figure 12. (a) Lomb–Scargle periodogram of V1033 Cas; (b) Lomb–Scargle periodogram of MU Cam; f 1 and f 2 indicate the spin frequencies of the two sources, respectively. The horizontal red lines represent the 0.1% significance level.
Universe 10 00337 g012
Table 1. Catalog of cataclysmic variables from the TMTS observations.
NameStart Time
(MJD)
P pho
(min)
Amplitude
(mag)
FeatureVSX NameReference
Dwarf novae
TMTS J00060995+555850159886.42805 FI Cas1
TMTS J01010887+4323259 59877.42796 IW And1
TMTS J01043552+4117576 59877.44097 145.0 ± 0.3                       0.165 L,RRX And1
TMTS J01101317+6004349 59509.46110 HT Cas1
TMTS J01153217+3737354 59876.43408 FO And1
TMTS J01275052+3808122 59876.47894 1RXS J0127+38             1
TMTS J02135093+5822527 59596.43877 TZ Per1
TMTS J02262311+7118314 59210.41097 AM Cas1
TMTS J02500008+3739219 59194.43101 PY Per1
TMTS J03124571+3042477 59199.42001 CRTS J0312+302
TMTS J03321548+5847219 * 59899.67009 AF Cam1
- 59207.41269 --
TMTS J04023898+4250447 * 59548.42925 V1024 Per3
- 59548.42836 --
TMTS J04083502+5114484 59943.41288 208.00 ± 1.45 1.344 HFO Per1
TMTS J04184443+5107313 * 58877.44968 NS Per1
- 59943.41273 110.98 ± 1.33 0.177 L--
TMTS J04260927+3541442 59554.42448 MASTER OT J0426+354
TMTS J04463363+4857559 58852.42751 ASASSN-15rs5
TMTS J05235177+0100303 59249.43854 135.83 ± 3.39 0.213 LBI Ori1
TMTS J05581781+6753456 59598.45463 46.4 ± 0.4 0.300 LLU Cam1
TMTS J06132238+4744248 59202.41699 SS Aur1
TMTS J07485955+3125121 59281.46741 82.1 ± 0.8 0.429 ESDSS J0748+315
TMTS J08442711+1252322 * 59204.65922 EAC Cnc1
- 58898.47159 E-1
TMTS J08534425+5748402 59216.69161 BZ UMa1
TMTS J09121621+5053531 59617.68575 77.9 ± 0.9 0.339 LDI UMa1
TMTS J10020745+3351005 59941.67607 RRU LMi1
TMTS J10043481+6629148 59685.52063 133.76 ± 2.06 0.167 LLN UMa1
TMTS J10202651+5304330 59631.73682 KS UMa1
TMTS J10543054+3006090 59248.54145 SX LMi1
TMTS J10565691+4941183 59672.48447 193.12 ± 1.55 0.295 LCY UMa1
TMTS J12393204+2108063 59676.48460 EIR Com1
Intermediate polars
TMTS J00225764+6141076 59507.45075 9.372 ± 0.005 0.239 R,LV1033 Cas1
TMTS J00284893+5917207 59181.43487 V709 Cas1
TMTS J00551974+4612566 * 59873.51739 V515 And6
- 59869.43510 203.1 ± 0.9 0.112 L--
TMTS J03311195+4354154 59530.42598 GK Per1
TMTS J05474838+2835104 59235.42950 FS Aur1
TMTS J06251631+7334386 59597.42651 19.785 ± 0.009 0.209 R,LMU Cam1
TMTS J06274641+0148100 59250.44675 EV902 Mon7
TMTS J07511729+1444239 59192.66469 PQ Gem1
TMTS J08382201+4838023 58907.51608 EI UMa1
TMTS J21334362+5107248 59835.54625 1RXS J2133+511
TMTS J22165027+4646412 59822.49572 EHBHA 4705-038
Nova-like variables
TMTS J01385585+2429393 59931.42144 SDSS J0138+249
TMTS J05064797+8319233 59155.69393 85.8 ± 0.3 0.327 EV1024 Cep1
TMTS J05572400+7241528 59597.42662 188.40 ± 2.08 0.265 LLS Cam1
TMTS J06293373+7104361 59597.42655 BZ Cam1
TMTS J07565314+0858318 59636.46295 95.0 ± 0.4 0.300 ESDSS J0756+0810
TMTS J08021533+4010463 58863.60606 55.8 ± 0.5 0.090 LSDSS J0802+401
TMTS J08125687+1911572 59640.46993 ENS Cnc1
TMTS J08223605+5105242 59182.64784 EBH Lyn1
TMTS J09030895+4117467 58941.48244 BP Lyn1
TMTS J09201115+3356421 59207.67148 110.3 ± 0.4 0.125 LBK Lyn1
TMTS J10481806+5218295 59665.50191 191.52 ± 1.18 0.146 LLY UMa1
TMTS J23400423+3017476 59846.49587 122.4 ± 0.2 0.151 LV378 Peg1
Polars
TMTS J00185684+3454451 59148.44826 V479 And1
TMTS J05154141+0104402 59249.44113 EV1309 Ori1
TMTS J07112595+4404048 59190.65350 118.56 ± 0.13                   1.743 EV808 Aur11
TMTS J11042565+4503131 59673.50834 EAN UMa1
TMTS J13075377+5351303 58923.56208 79.6 ± 0.2 0.681 HEV UMa1
Candidates
TMTS J02461608+6217029 59529.43927 109.7 ± 0.4 0.156 LV495 Casnew
TMTS J03394099+4148057 59544.42431 189.5 ± 0.7 0.212 LNone9
TMTS J03471387+1611083 59883.58651 97.7 ± 0.8 0.262 LMLS_J0347+16new
TMTS J04405040+6820355 59927.66419 110.0 ± 1.1 0.262 LNonenew
TMTS J06183036+5105550 59202.41861 107.4 ± 0.4 0.139 LNone12
TMTS J07200739+4516113 59190.67704 90.9 ± 1.0 > 1 HMASTER OT J0720+4513
TMTS J09011350+1447046 59209.66682 89.57 ± 1.31 0.076 LSDSS J0901+1414
Note: Column (1), TMTS designation; column (2), the time when the TMTS observation started; column (3), photometric period corresponding to the maximum power in the LSP of the TMTS observation; column (4), peak-to-peak amplitude obtained from the best-fitting model of fourth-order Fourier series; column (5), light-curve feature defined in Section 2.2.2 (E, Eclipse; R, Rapid periodic variation; L, Low-amplitude periodic variation; H, High-amplitude periodic variation); column (6), name in VSX; column (7), reference of the corresponding source. The * symbol indicates that the source was observed on two separate nights. References: (1) Downes et al. [38]; (2) Drake et al. [47]; (3) Osborne, J. P. et al. [48]; (4) Denisenko et al. [49]; (5) Kato et al. [50]; (6) Kozhevnikov [51]; (7) Witham et al. [52]; (8) Yakin et al. [53]; (9) Hou et al. [43]; (10) Szkody et al. [40]; (11) Thorne et al. [54]; (12) Lin et al. [31]; (13) Denisenko [46]; (14) Szkody et al. [45].
Table 2. Summary of the statistics of the distributions for the short-period and long-period nonmagnetic CVs from our sample and Szkody et al. [40]. The subscripts “mean” and “std” respectively represent the mean values and standard deviations of EW/FWHM for short-period and long-period classes.
Class EW mean EW std FWHM mean FWHM std
(Å) (Å) (Å) (Å)
Short-period (Szkody et al. [40])101.1960.8630.9610.16
Long-period (Szkody et al. [40])53.0732.7019.908.07
Short-period (this work)125.3359.3033.557.26
Long-period (this work)26.4719.3319.476.96
Disclaimer/Publisher’s Note: The statements, opinions and data contained in all publications are solely those of the individual author(s) and contributor(s) and not of MDPI and/or the editor(s). MDPI and/or the editor(s) disclaim responsibility for any injury to people or property resulting from any ideas, methods, instructions or products referred to in the content.