Article

The Mass Profile of NGC 3268 from Its Stellar Kinematics

by
Juan Pablo Caso
1,2,3,*,
Bruno Javier De Bórtoli
1,2,3 and
Tom Richtler
4
1
Facultad de Ciencias Astronómicas y Geofísicas, Universidad Nacional de La Plata, Paseo del Bosque S/N, La Plata B1900FWA, Argentina
2
Instituto de Astrofísica de La Plata (CCT La Plata—CONICET, UNLP), Paseo del Bosque S/N, La Plata B1900FWA, Argentina
3
Consejo Nacional de Investigaciones Científicas y Técnicas, Godoy Cruz 2290, Ciudad Autónoma de Buenos Aires C1425FQB, Argentina
4
Departamento de Astronomía, Universidad de Concepción, Concepción 4070386, Chile
*
Author to whom correspondence should be addressed.
Universe 2025, 11(10), 344; https://doi.org/10.3390/universe11100344
Submission received: 11 September 2025 / Revised: 8 October 2025 / Accepted: 11 October 2025 / Published: 16 October 2025
(This article belongs to the Section Galaxies and Clusters)

Abstract

The mass profile of the central galaxy of the Antlia cluster, NGC 3268, is studied through a spherical Jeans analysis, combined with a Bayesian approach. The prior distributions are derived from dark matter simulations. The observational dataset consists of Gemini/GMOS multi-object spectra observed from several programmes, supplemented with the kinematics of a small sample of globular clusters from the literature. An NFW mass profile and several options of constant anisotropy are considered. The analysis indicates a moderately massive halo, with a virial mass of (1.4 – 4.3)   ×   10 13 M , depending on the assumed anisotropy. A comparison with the kinematics of the galaxy population from the Antlia cluster suggests that a fraction of galaxies is not yet virialised and may currently be infalling into the cluster.

1. Introduction

In the ruling paradigm, gravitational instabilities at early epochs led to the formation of the large-scale structure of the Universe, with massive clusters of galaxies inhabiting nodes, connected by filaments and sheets, where less massive systems reside [1]. Massive ellipticals (Es) are thought to have undergone two distinct formation phases [2,3]. The first corresponds to a burst of star formation at high redshift, lasting less than 1 Gyr [4], which resulted in a population of compact objects commonly referred to as red nuggets [5]. The second phase involves accretion and merger processes, which are responsible for building up the stellar and dark matter halos of massive Es, observed in the local Universe [6,7,8]. Although the influence of the environment on the physical processes experienced by galaxies is scarcely novel, e.g., [9], in recent years, the evidence has suggested that the influence of groups and clusters of galaxies extends beyond their virial radius [10,11].
Although the standard Λ CDM cosmological framework [12,13] remains the dominant paradigm in the community, owing to its success in explaining the cosmic microwave background, large-scale structure formation, and galaxy cluster dynamics, alternative theories of gravity are still actively explored. For instance, Modified Newtonian Dynamics (MONDs) proposes a modification of Newton’s second law at very low accelerations, which can naturally reproduce galaxy rotation curves [14,15]. Conversely, Modified Gravity (MOG or Scalar-Tensor-Vector Gravity) introduces additional gravitational fields to account for galactic and cluster dynamics without invoking dark matter [16]. These models underscore the ongoing debate regarding the true nature of dark matter and gravity. Nevertheless, Λ CDM remains the baseline scenario adopted in most astrophysical and cosmological studies, and the present work is developed within this framework.
Kinematical studies indicate that bright ellipticals in dense environments are embedded within massive dark matter haloes, e.g., [17,18,19], although the kinematical complexity in the cores of galaxy clusters may bias these results [20]. This view is further supported by the typical populations of their globular cluster systems (GCSs), which often comprise thousands of members, e.g., [21] (and the references therein), suggesting an extensive history of accretion and mergers. Hence, addressing the total mass of nearby structures is relevant for improving our understanding of the build-up of massive Es but also for disentangling the role of the environment in the evolution of galaxies in the surroundings of groups and clusters of galaxies.
The Antlia cluster, located at ≈35 Mpc [22], is among the nearest galaxy clusters, but it has been less extensively studied than others. It is described in the literature as dynamically young, with X-ray observations indicating a non-cool core [23,24]. Initial censuses of Antlia galaxy population were conducted by Hopp and Materne [25] and Ferguson and Sandage [26] and actualised in recent years by Smith Castelli et al. [27,28], with extensions to adjacent regions by Calderón et al. [29,30,31]. The total population is about 300 galaxies, including two confirmed compact ellipticals [32,33]. It comprises two subgroups dominated by the giant Es NGC 3258 and NGC 3268, both hosting rich GCSs [34,35,36], though some SBF distances might place NGC 3258 in the foreground [22].

2. Materials and Methods

2.1. Photometric Data

The photometric dataset consists of FORS1–VLT images in the V and I bands (programme 71.B-0122(A), PI: B. Dirsch). These images correspond to a single field containing NGC 3268, as well as NGC 3267 and FS90-175. The field of view is 6.8 × 6.8 arcmin2, with a pixel scale of 0.2 arcsec. The V and I images result from the combination of five single exposures of 300 s and 700 s each, respectively. In addition, a short 10 s exposure in I was used to avoid saturation in the central region of the galaxy. For further details on these images, see Bassino et al. [35].
In order to derive the surface brightness profile of NGC 3268 without contamination from its companions, an iterative fitting process was applied. First, the profile of the giant gE was obtained using the task ELLIPSE within iraf, after masking all bright objects in the field. Then, a model galaxy generated with the task BMODEL was subtracted from the original image. This second image, free of the extended light from NGC 3268, was used to fit the luminosity profiles of NGC 3267 and FS90-175, and their respective models were subtracted from the original image. The resulting image, containing only the extended light of NGC 3268, was used to derive its surface brightness profile, which was then subtracted from the original image to repeat the process. The final surface brightness profiles result from three iterations. These profiles were calibrated, applying the equations from Bassino et al. [35], and the extinction corrections were obtained from Schlafly and Finkbeiner [37]. The parameters corresponding to the profile in the I band, used to derive the stellar masses, are provided in Appendix A in Table A1.

Surface Brightness and Colour Profiles

The surface brightness profile of NGC 3268 in the I band, corrected for extinction, is shown in the top panel of Figure 1 as a function of the equivalent radius ( r eq ). The contamination level is estimated by fitting the outer profile at r eq > 175 arcsec and is represented in Figure 1 by a horizontal dotted line. The filled symbols denote the surface brightness profile of the galaxy, corrected by contamination. The analysis reveals that the luminosity distribution is best reproduced by a three-component model, which has already been suggested by Huang et al. [38]. A model with fewer components results in systematic deviations in the residuals. The Sérsic law is chosen to fit the luminosity profile for each component, which follows the relation
I ( r eq ) = I 0 · e x p r eq r 0 1 / n
where I 0 is the central surface brightness, r 0 is a scale parameter, and n is the Sérsic index characterising the shape of the profile, with n = 1 corresponding to an exponential profile and n = 4 describing a de Vaucouleurs law. In terms of surface brightness, and considering μ 0 as the central surface brightness, it yields the expression
μ ( r eq ) = μ 0 + 1.0857 r eq r 0 1 / n
The three fitted components are represented in Figure 1 by dashed curves, and their sum is represented by the dotted version. The residuals from the model are displayed in the bottom panel of Figure 1, and Table 1 lists the parameters of the three components.
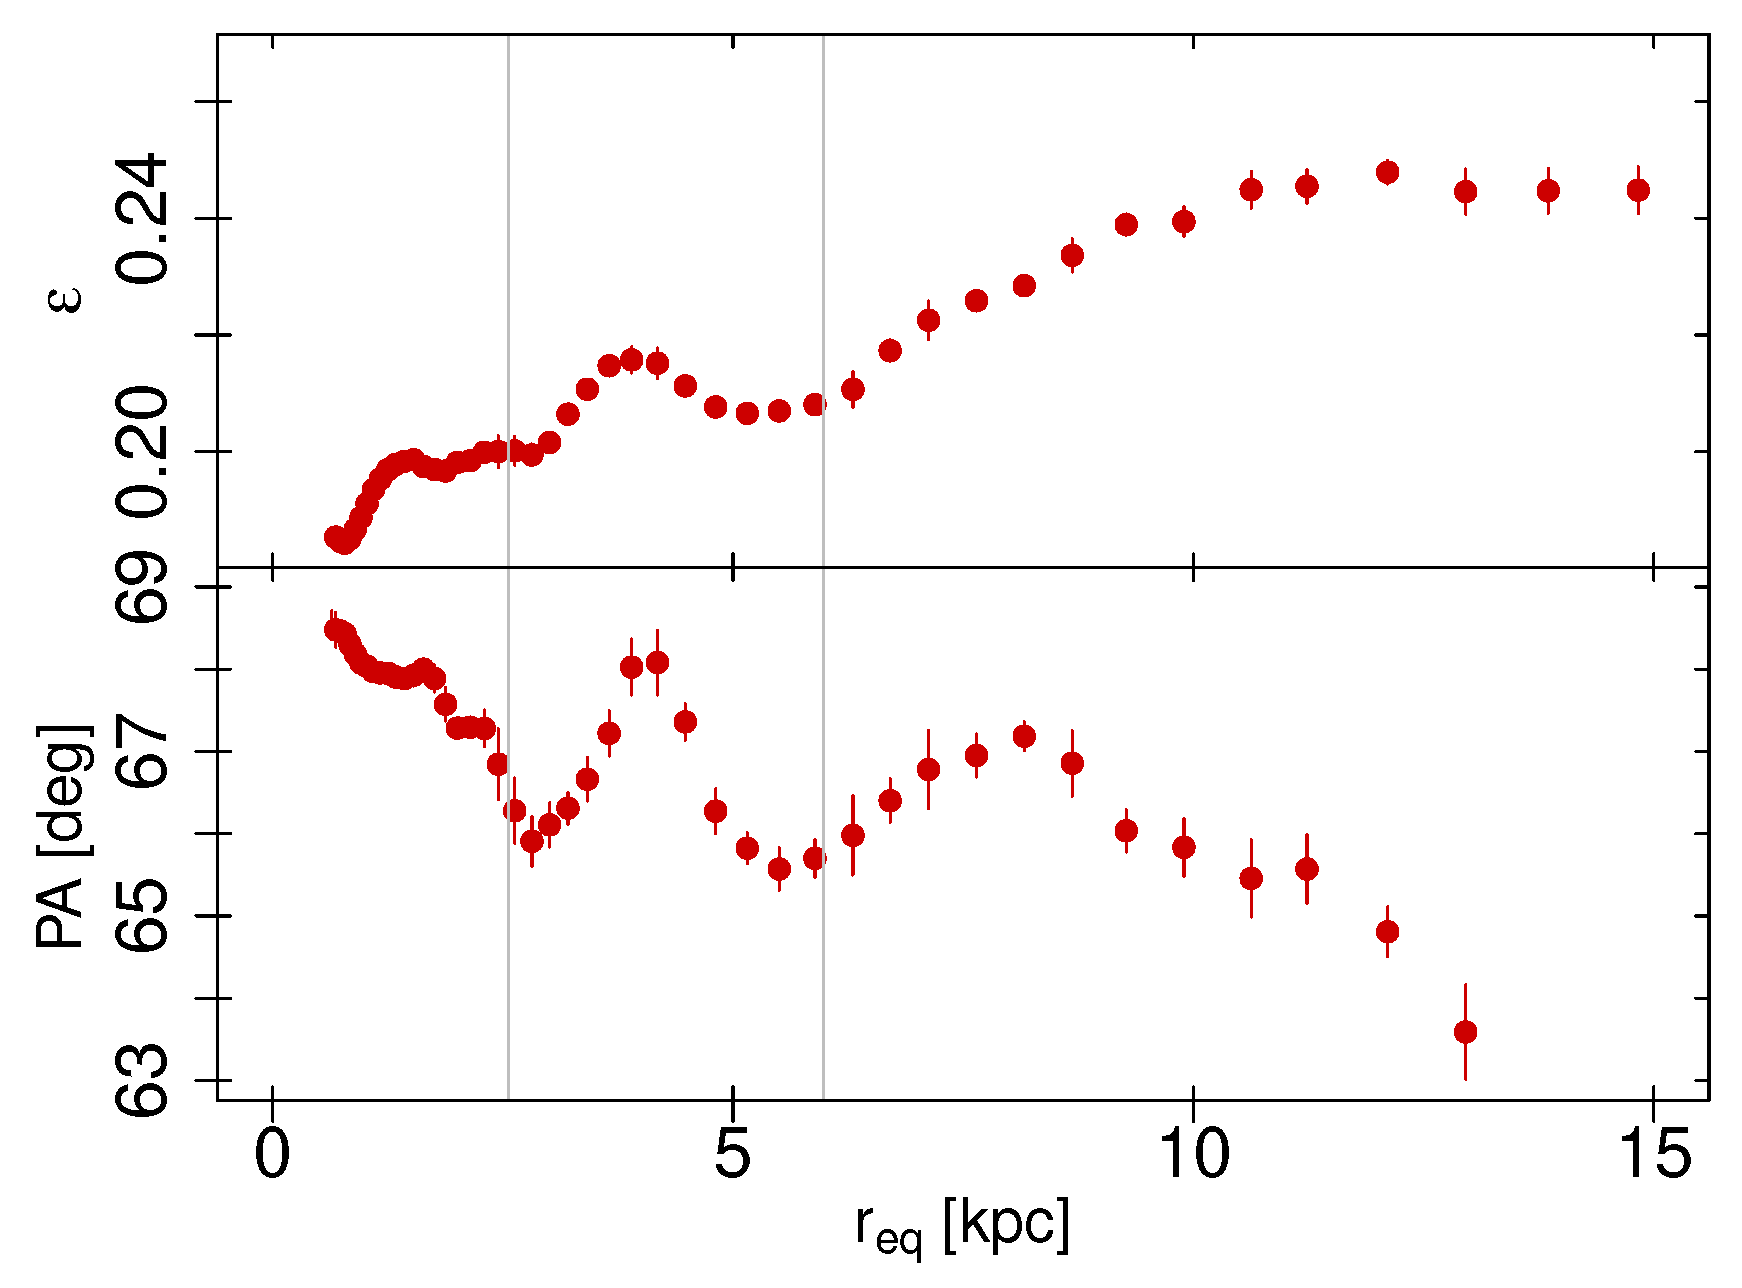
Figure 2 displays the radial profiles of the parameters derived from ELLIPSE for NGC 3268 in the I band, together with its colour profile, as functions of r eq . The top panel shows the isophotal ellipticity ( ϵ ), and the bottom panel illustrates the position angle (PA, measured from north to east). Both parameters vary with radius, indicating that different galaxy components dominate the surface brightness profile at distinct r eq ranges. Vertical grey lines mark r eq 15 and ≈35 arcsec, corresponding to the radii where the surface brightness of the different components displayed in Figure 2 becomes significant.

2.2. Spectroscopic Data

The spectroscopic dataset consists of GEMINI–GMOS slit spectra, obtained as part of multi-object masks designed to study the galaxy and GC populations around NGC 3268. The raw data are publicly available in the Gemini Science Archive (programmes GS-2011A-Q-35 and GS-2013A-Q-37). The B600_G5303 grating, blazed at 5000 Å was employed, with small shifts in the central wavelengths applied to fill the CCD gaps. The slit width is 1 arcsec, yielding a full width at half maximum (FWHM) of 4.6 Å. The wavelength coverage typically spans ≈ 4000–7200 Å, depending on the position of the slit. The total exposure time amounts to 3.5 h, with seeing conditions ranging 0.6–0.9 arcsec. Each scientific exposure is accompanied by calibration flats and CuAr arc spectra to correct for small variations due to telescope flexure. Flux standard stars were also observed on the same nights and with identical instrumental configurations to ensure accurate flux calibration. Data reduction was carried out using the GEMINI.GMOS package (Version 1.15) within iraf, following standard procedures. Further details of the reduction process are provided in Caso et al. [39].

2.2.1. Sky Subtraction

The mask design includes two slits covering the inner 25 arcsec of the galaxy. The remaining slits, located on the main body of NGC 3268, are centred on point sources previously analysed by Caso et al. [40]. Each slit typically encompasses 5–10 arcsec of the galaxy’s main body for subtraction, which serves as the scientific target in the present work. To minimise contamination from the central point source, only the slit sections located at distances greater than twice the seeing value were extracted for analysis. The spectral range adopted for the analysis is 4800–6000 Å, chosen to avoid the low signal-to-noise ratio at the blue end of the spectra and strong atmospheric features beyond the upper limit. This interval contains several prominent absorption lines that are particularly suitable for the aims of this study.
The resulting spectra include contributions from both the galaxy and the sky, which must be subtracted. For this purpose, the procedure described in Norris et al. [41] was followed, using a dataset with similar characteristics. First, the local background for the point sources was estimated from the number of counts in an annulus surrounding each target. This was performed on the VIMOS image in the V filter, whose spectral coverage is similar to the range indicated above. For each spectral pixel, the number of counts was normalised by the extent of the extracted region and compared with the number of counts measured for the local background from the photometry. As shown by Norris et al. [41], these quantities correlate, and a linear fit can be employed to extrapolate the number of counts to large galactocentric distances, where the galaxy contribution is negligible. For instance, the left panel of Figure 3 illustrates this correlation for 5300 Å. Applying this procedure to all spectral pixels yields a spectrum representing only the sky contribution. The χ 2 values for the individual fits attain high confidence, p > 0.95 , except for wavelengths around 5576 Å, where a strong sky emission line, typically saturated in our GMOS observations, must be masked at a later stage. The right panel of Figure 3 displays the sky spectrum for the mask observed during 2011 in black, compared with the spectra extracted from three slits.

2.2.2. Definite Extraction and Kinematics Measurement

Although a signal-to-noise ratio (S/N) of approximately 5 is acceptable for measuring line-of-sight velocities ( V LOS ), estimating velocity dispersions ( σ LOS ) requires S / N 10 [42]. To fulfil this criterion, the two slits covering the inner 25 arcsec of NGC 3268 are spatially rebinned to achieve S / N 20 at 5000 Å. Considering the typical seeing during the observations, the minimum spatial bin is set at 0.5 arcsec. The slits placed at larger galactocentric distances do not individually meet the S / N criterion; hence, they are stacked according to similar galactocentric distances to achieve the required S / N . For this purpose, the V LOS of individual slits was measured using the fxcor task within iraf, and small shifts were applied to correct for differences in V LOS (see Section 3.1) that could otherwise lead to artificial line broadening and a spurious increase in σ LOS .
The mean V LOS and σ LOS for these rebinned spectra were measured using the penalised Pixel Fitting code [43,44,45] (ppxf). A subset of the E-MILES single stellar population models [46,47] was selected as templates for ppxf fitting, considering old populations (8 and 10 Gyr) with metallicities in the range [ M / H ] = 0.4 to 0.2 . The results are listed in Table 2.

2.3. Other Kinematical Sources

Caso et al. [40] present 23 spectroscopically confirmed GCs in NGC 3268. The sample extends to ≈47 kpc from the galaxy centre (≈4.6 arcmin at the distance of Antlia), with typical uncertainties of ≈20–40 km s 1 . The weighted mean velocity for this sample is 2720 ± 40 km s−1, and the corresponding velocity dispersion is 220 ± 15 km s−1. The adjusted weighted Fisher–Pearson estimator for the kurtosis excess [48] yields 0.09 ± 0.14 , with the uncertainty estimated under the assumption of normality.
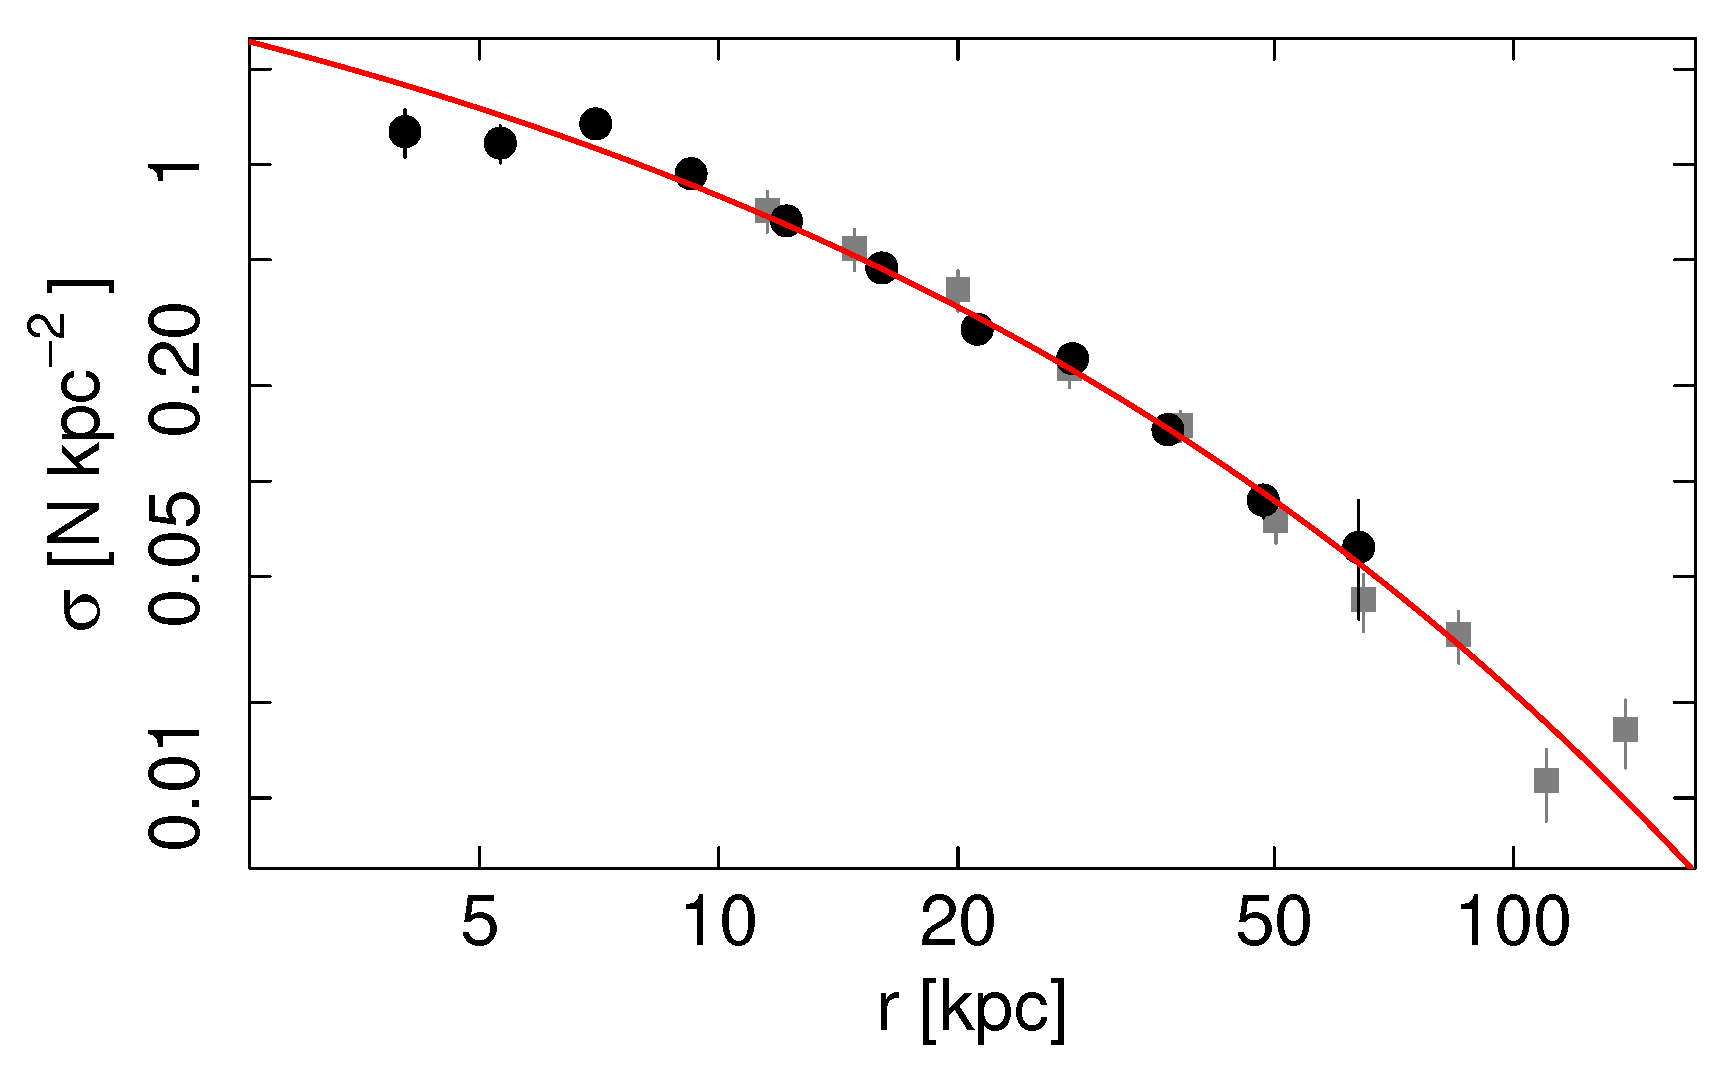
The projected density distribution of GC candidates is presented in Figure 4, based on the photometric catalogues of Caso et al. [36]. Only GC candidates brighter than I 0 = 24 mag were considered in order to ensure high completeness; see Figure 2 and Figure 3 in [36]. The black circles in Figure 4 were derived from deep FORS1–VLT photometry, whereas the grey squares were obtained from shallower MOSAIC–CTIO photometry, corrected by a multiplicative factor derived from the globular cluster luminosity function of NGC 3268. A Sérsic profile was fitted to the radial distribution and is shown as a red line in the figure. The best-fitting parameters are n GCs = 2.9 , I 0 , GCs = 16 kpc−2, and r 0 , GCs = 0.39 kpc. The density counts at galactocentric distances below 5 kpc are not included in the profile fitting due to the increasing incompleteness that typically affects the photometry of extragalactic GCS in the central region of galaxies with high surface brightnesses when observed with ground-based telescopes, e.g., [49].

2.4. Dark Matter Haloes from a Numerical Simulation

The cosmological dark matter simulation MDPL2, part of the Multidark project [50] (publicly available through the official project database https://www.cosmosim.org/), was also used. This simulation spans a periodic cubic volume with a side length of 1 h 1 Gpc . It consists of 3840 3 particles, each with a mass of 1.51 × 10 9 h 1 M , and adopts the cosmological parameters of Planck Collaboration et al. [51]. The dataset corresponds to the catalogue of dark matter haloes identified with the rockstar halo finder [52] in the snapshot at z = 0 , representing the local Universe. Each halo is assumed to host a unique galaxy, with the main halo associated with the central galaxy of the system, while satellite haloes host the satellite galaxies.
In addition to the properties listed in the catalogue, an r band luminosity was assigned to each halo by means of a halo occupation distribution (HOD) method [53,54], following the prescription described in Caso [55]. Briefly, the galaxy luminosity functions fitted by Lan et al. [56], which distinguish between central and satellite galaxies, were adopted. An intrinsic scatter of 0.20 in the stellar-to-halo mass relation was assumed when assigning M r magnitudes, in accordance with Girelli et al. [57]. The morphological type of the galaxy hosted by each halo was randomly selected as either early- or late-type, based on the environmental distributions observed by McNaught-Roberts et al. [58]. Further details on the procedure are provided in Caso [55].

2.5. Dynamic Modelling

2.5.1. Spherical Jeans Analysis

Under the assumption that NGC 3268 behaves as a non-rotating system (see Section 3.1) with spherical symmetry, the second velocity moments are related by the Jeans equation, e.g., [59,60], resulting in
d j ( r ) σ r 2 ( r ) d r + 2 β r j ( r ) σ r 2 ( r ) = j ( r ) G M ( r ) r 2
with j ( r ) representing the three-dimensional density of the tracer population, β is the anisotropy parameter, σ r ( r ) is the radial component of the velocity dispersion at the spatial galactocentric distance r, and M ( r ) is the enclosed total mass. In the case of the fourth-order moments, if a distribution function of the form f ( E , L ) = f 0 ( E ) L 2 β with constant anisotropy parameter is assumed, then the Jeans equations are reduced to one of the forms (Łokas [59]; see Richardson and Fairbairn [61]):
d j ( r ) V r 4 ¯ ( r ) d r + 2 β r j ( r ) V r 4 ¯ ( r ) = 3 j ( r ) σ r 2 G M ( r ) r 2
with V r 4 ¯ ( r ) being the radial component of the fourth-order moment of the velocity.
The need for direct comparison with observations requires the projection of the velocity moments. The integration with the line-of-sight results, inverting the order of integration, yields the solutions
σ LOS 2 ( R ) = 2 G n ( R ) R K ( R , r ) j ( r ) M ( r ) d r r
with n ( R ) being the projected density of the tracer population, and R being the projected radius. The kernels K ( R , r ) vary for different values of constant anisotropy, as indicated in the Appendix from Mamon and Łokas [62].
V LOS 4 ¯ ( R ) = 2 n ( R ) R d u G M ( u ) j ( u ) r 2 β 2 R u d s G M ( s ) s s 2 β K 4 ( R , s )
with analogue kernels K 4 ( R , s ) , presented in Appendix A from Caso [55] for constant anisotropy, ranging 1 / 2 β 1 / 2 .
M ( r ) is defined as the sum of M and the mass obtained from integrating the dark matter density profile. The analysis aims to determine, for a given model, the set of parameters that maximises the likelihood of reproducing the dataset by means of the cumulative probability of the χ 2 distribution, with the corresponding percentile calculated from the expression
χ 2 = j σ LOS , j obs σ LOS , j pred e σ LOS , j obs 2
where σ LOS , j obs represents the measurements of the velocity dispersion in the line-of-sight, as already presented in Section 2.2, and e σ LOS , j obs corresponds to the associated error. In the case of σ LOS , j p r e d , it symbolises the value predicted by the model for a specific set of parameters, and fixed anisotropy β .
For the GC sample, the set of parameters is determined by maximising the product of the individual probabilities for each object. These probabilities are obtained from the convolution of the observational V LOS distribution and the predicted distribution at R gal . The observational distribution is modelled as a Gaussian centred on the measured V LOS with a dispersion equal to the measurement error. The predicted distribution is centred on the mean V LOS of the galaxy, 2750 km s−1, which does not significantly differ from the mean V LOS of the GCs sample. It is expressed in terms of Gauss–Hermite polynomials [63], with the terms describing asymmetric deviations from the normal distribution vanishing under the assumption of spherical symmetry.
f ( w ) = 1 2 π σ exp 1 2 w 2 1 + h 4 24 ( 4 w 4 12 w 2 + 3 )
plus higher-order terms, which are assumed to be negligible in this approach, w = ( V LOS V 0 ) / σ LOS , and h 4 is related to the fourth-order moment of the velocity in the line-of-sight by h 4 = ( V LOS 4 ¯ / σ LOS 4 3 ) / ( 8 6 ) , with σ LOS and V LOS 4 ¯ arising from the Jeans analysis for each pair of parameters, r and c .

2.5.2. Bayesian Treatment and Prior Distribution

This work employs a Bayesian approach to estimate the mass profile of the galaxy. The components of the observational dataset D kin have already been described, both for the GC sample and for the galaxy kinematical data. The Bayesian analysis, therefore, aims to determine the probability p r , c | D kin , I prior , where r and c are the parameters of the model adopted to describe the dark matter halo, which, in the case of spherical symmetry, usually correspond to a scale radius and either a density or a concentration parameter. The information not contained in the dataset, which shapes the prior distribution, is represented by I prior . According to Bayes’ theorem,
p r , c | D kin , I prior = p r , c | I prior · p D kin | r , c , I prior p D kin | I prior
with p D kin | I prior assumed to be a normalisation factor, which is not calculated. The factor p r , c | I p r i o r represents the prior distribution for a specific set of parameters. The second factor in the equation includes both the probability obtained from the σ LOS profile of the stellar population of NGC 3268 and that from the V LOS distribution of GCs, and this can be factorised as
p D kin | r , c , I prior = p G a l | r , c , I prior · p G C s | r , c , I prior
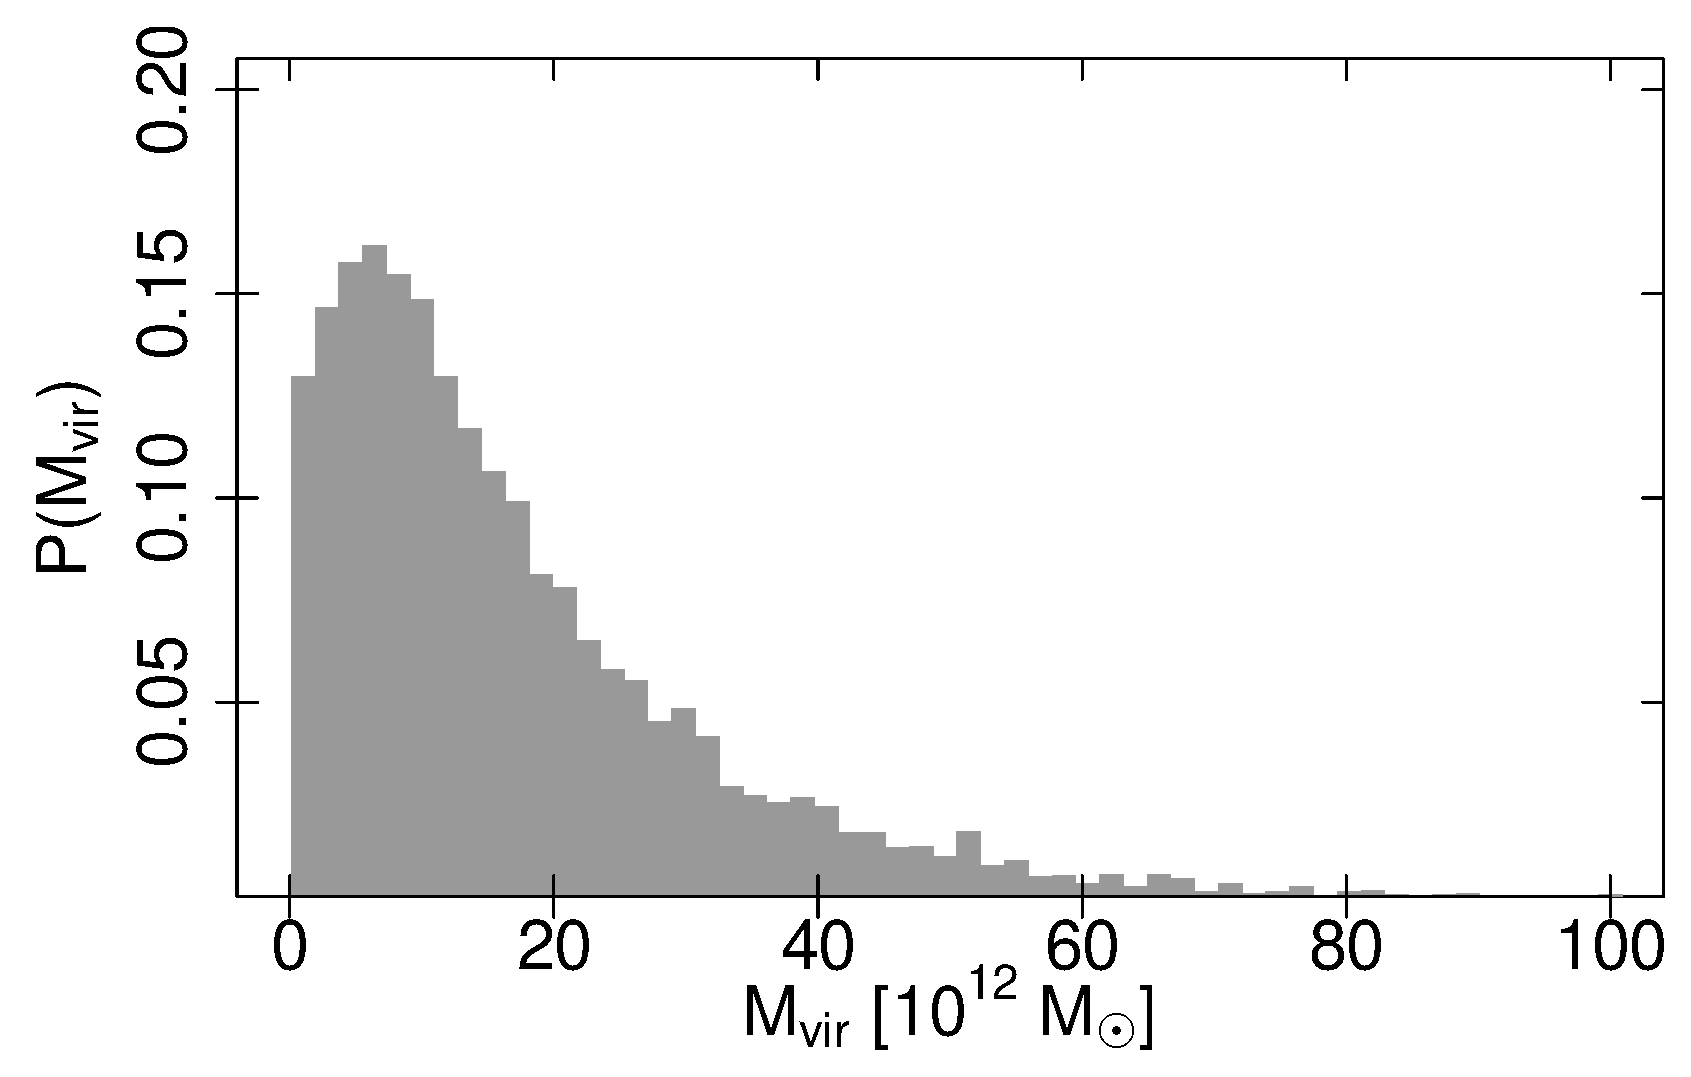
The information contained in I prior was assembled from central haloes in the MDPL2 simulation, whose galaxies have absolute magnitudes in the r band that are consistent with those of NGC 3268 and are classified as early-type galaxies (see Section 2.4). The total apparent R band magnitude of NGC 3268 is taken from Calderón et al. [31] and converted to the r band using the expected magnitudes in both filters for SSPs with solar metallicity and an age of 10 Gyr, derived from the MILES database. From this magnitude and the distance presented in Section 1 (corresponding to a distance modulus of m M = 32.74 ± 0.14 mag), we obtain the distribution of absolute magnitudes ( M r ), which is used to statistically select haloes from the MDPL2 simulation on the basis of their M r assigned through the HOD method. Figure 5 shows the distribution of virial masses ( M vir ) obtained for the NGC 3268 analogues in the MDPL2 simulation, with the 95th percentile at M vir = 6.1 × 10 13 M . This probability corresponds to p ( M vir | I prior ) , which is related to p ( r , c | I prior ) through the expression
p ( r , c | I prior ) = p ( r , c | M vir ) · p ( M vir | I prior )

3. Results

3.1. Kinematics of the Stellar Population in NGC 3268

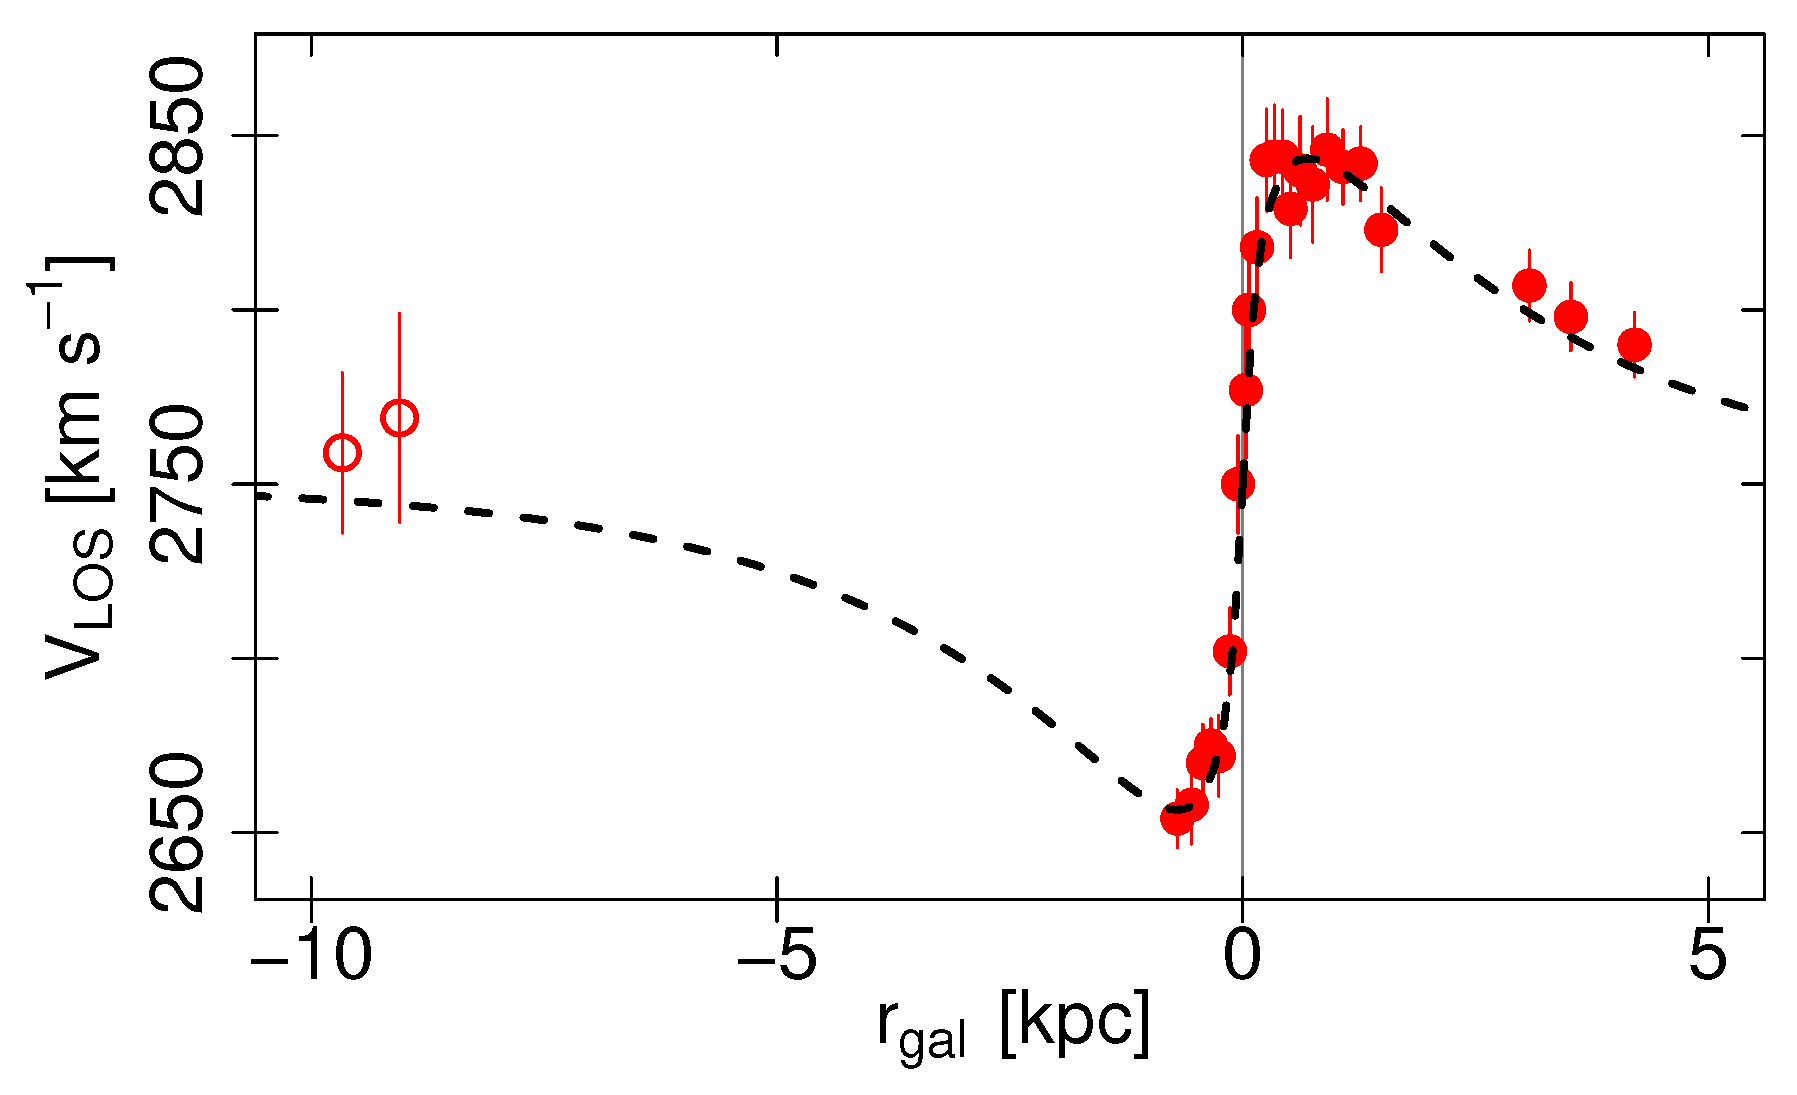
Figure 6 shows the V LOS as a function of r gal , expressed in kiloparsecs, for the photometric major axis of NGC 3268, based on the two innermost slits (filled symbols) and a few other slits aligned with this direction (open symbols). Considering the distance assumed in Section 1, the scale is 170 pc arcsec−1. The rotation curve is fitted through a function of the form
V LOS ( r gal ) = V sys + V 0 · r gal r gal + r c · e x p r gal r t
which is represented in the figure by a dashed curve. This function includes a factor that modulates the initial rise in V LOS , together with an exponential decline at large galactocentric radii, in order to reproduce the fading of the rotational component. The parameter V sys = 2750 ± 20 km s−1 represents the systemic velocity of NGC 3268, while the rotation curve reaches a maximum amplitude of Δ V LOS 90 km s−1 at a galactocentric radius of ≈740 pc.
The σ LOS profile of the stellar population in NGC 3268 is shown in Figure 7 as a function of galactocentric distance. Filled symbols denote σ LOS values for bins corresponding to the two innermost slits, whereas open symbols represent measurements obtained by stacking slits with similar galactocentric radii. Emsellem et al. [64] introduced λ R as a kinematic classifier that quantifies the importance of the rotational support for two-dimensional stellar kinematics, acting as a luminosity-weighted proxy for the projected angular momentum. For long-slit data, the parameter can be adapted following the prescription of Coccato et al. [65] and Salinas et al. [66]. From the measurements listed in Table 2 and the surface brightness profile described in Section 2.1, we obtain λ R = 0.16 within 0.25 r eff . A fair comparison requires estimating λ R out to r eff . Assuming that σ LOS remains at a minimum of 190 km s−1 up to r eff , and that V LOS follows Equation (12), we obtain λ R = 0.12 . This result indicates mild rotation in NGC 3268, although we assume that spherical Jeans modelling can still be applied in this case.

3.2. Stellar Population Synthesis

If no spatial binning is applied, the two innermost slits of NGC 3268 provide an S / N that is high enough to derive stellar population parameters through full spectral fitting with ppxf. The S / N level also enables us to extend the spectral range towards shorter wavelengths, down to 4500 Å, which is particularly relevant for accurately constraining stellar ages. As in the kinematic analysis, the E-MILES stellar population models [47] are employed as templates, adopting a Salpeter initial mass function (IMF), which has been shown to be appropriate for representing the IMF in massive elliptical galaxies, e.g., [67,68].
For the inner 10 arcsec, the weighted mean age and metallicity are 10 Gyr and [ M / H ] = 0.01 , respectively, with the latter decreasing to [ M / H ] = 0.18 at galactocentric distances of 17–27 arcsec. The mass-to-light ratios derived with ppxf in the r band ( M / L r ) are 5.8 and 4.1, respectively. The weights assigned by the algorithm to the set of single stellar populations are displayed in Figure 8 for both slits. These results are consistent with the colour profile presented by Huang et al. [38], which indicates colours typical of old populations with sub-solar metallicities, except in the innermost 10 arcsec, where the colours appear redder.

3.3. Kinematical Fitting of the Data

The dark matter density profile is represented by an NFW profile [69], which is commonly adopted in the literature to model dark matter haloes. We are aware that results of the kinematical fitting may depend on the adopted model, but large-scale studies of massive ETGs have proven that models producing cored haloes do not improve the goodness of fit, e.g., [18,70]. Furthermore, analysis of the dark matter density slope in the innermost regions of massive ETGs are consistent with the expectations from an NFW profile [71,72]. It is characterised by two parameters: a scale radius ( r s ) and a concentration parameter ( c vir ), defined as the ratio between the virial ( r vir ) and the scale radius [73]. In this formulation, the mean density within r vir is equal to Δ vir ( Ω m ) times the mean matter density ( ρ m ). For Ω m = 0.307 , and when using the approximation given by Bryan and Norman [74], it yields Δ vir 333 .
Following Equation (9), the joint probability for each pair of parameters ( r s , c vir ) is obtained as the product of Equations (10) and (11). Although more sophisticated treatments of orbital anisotropy have been proposed in the literature [62], in this work, we restrict the analysis to solutions with a constant anisotropy parameter β . For massive ellipticals in the SAURON project [75], β values are within one effective radius range from ≈−0.2 to ≈+0.2 (see their Table 2).
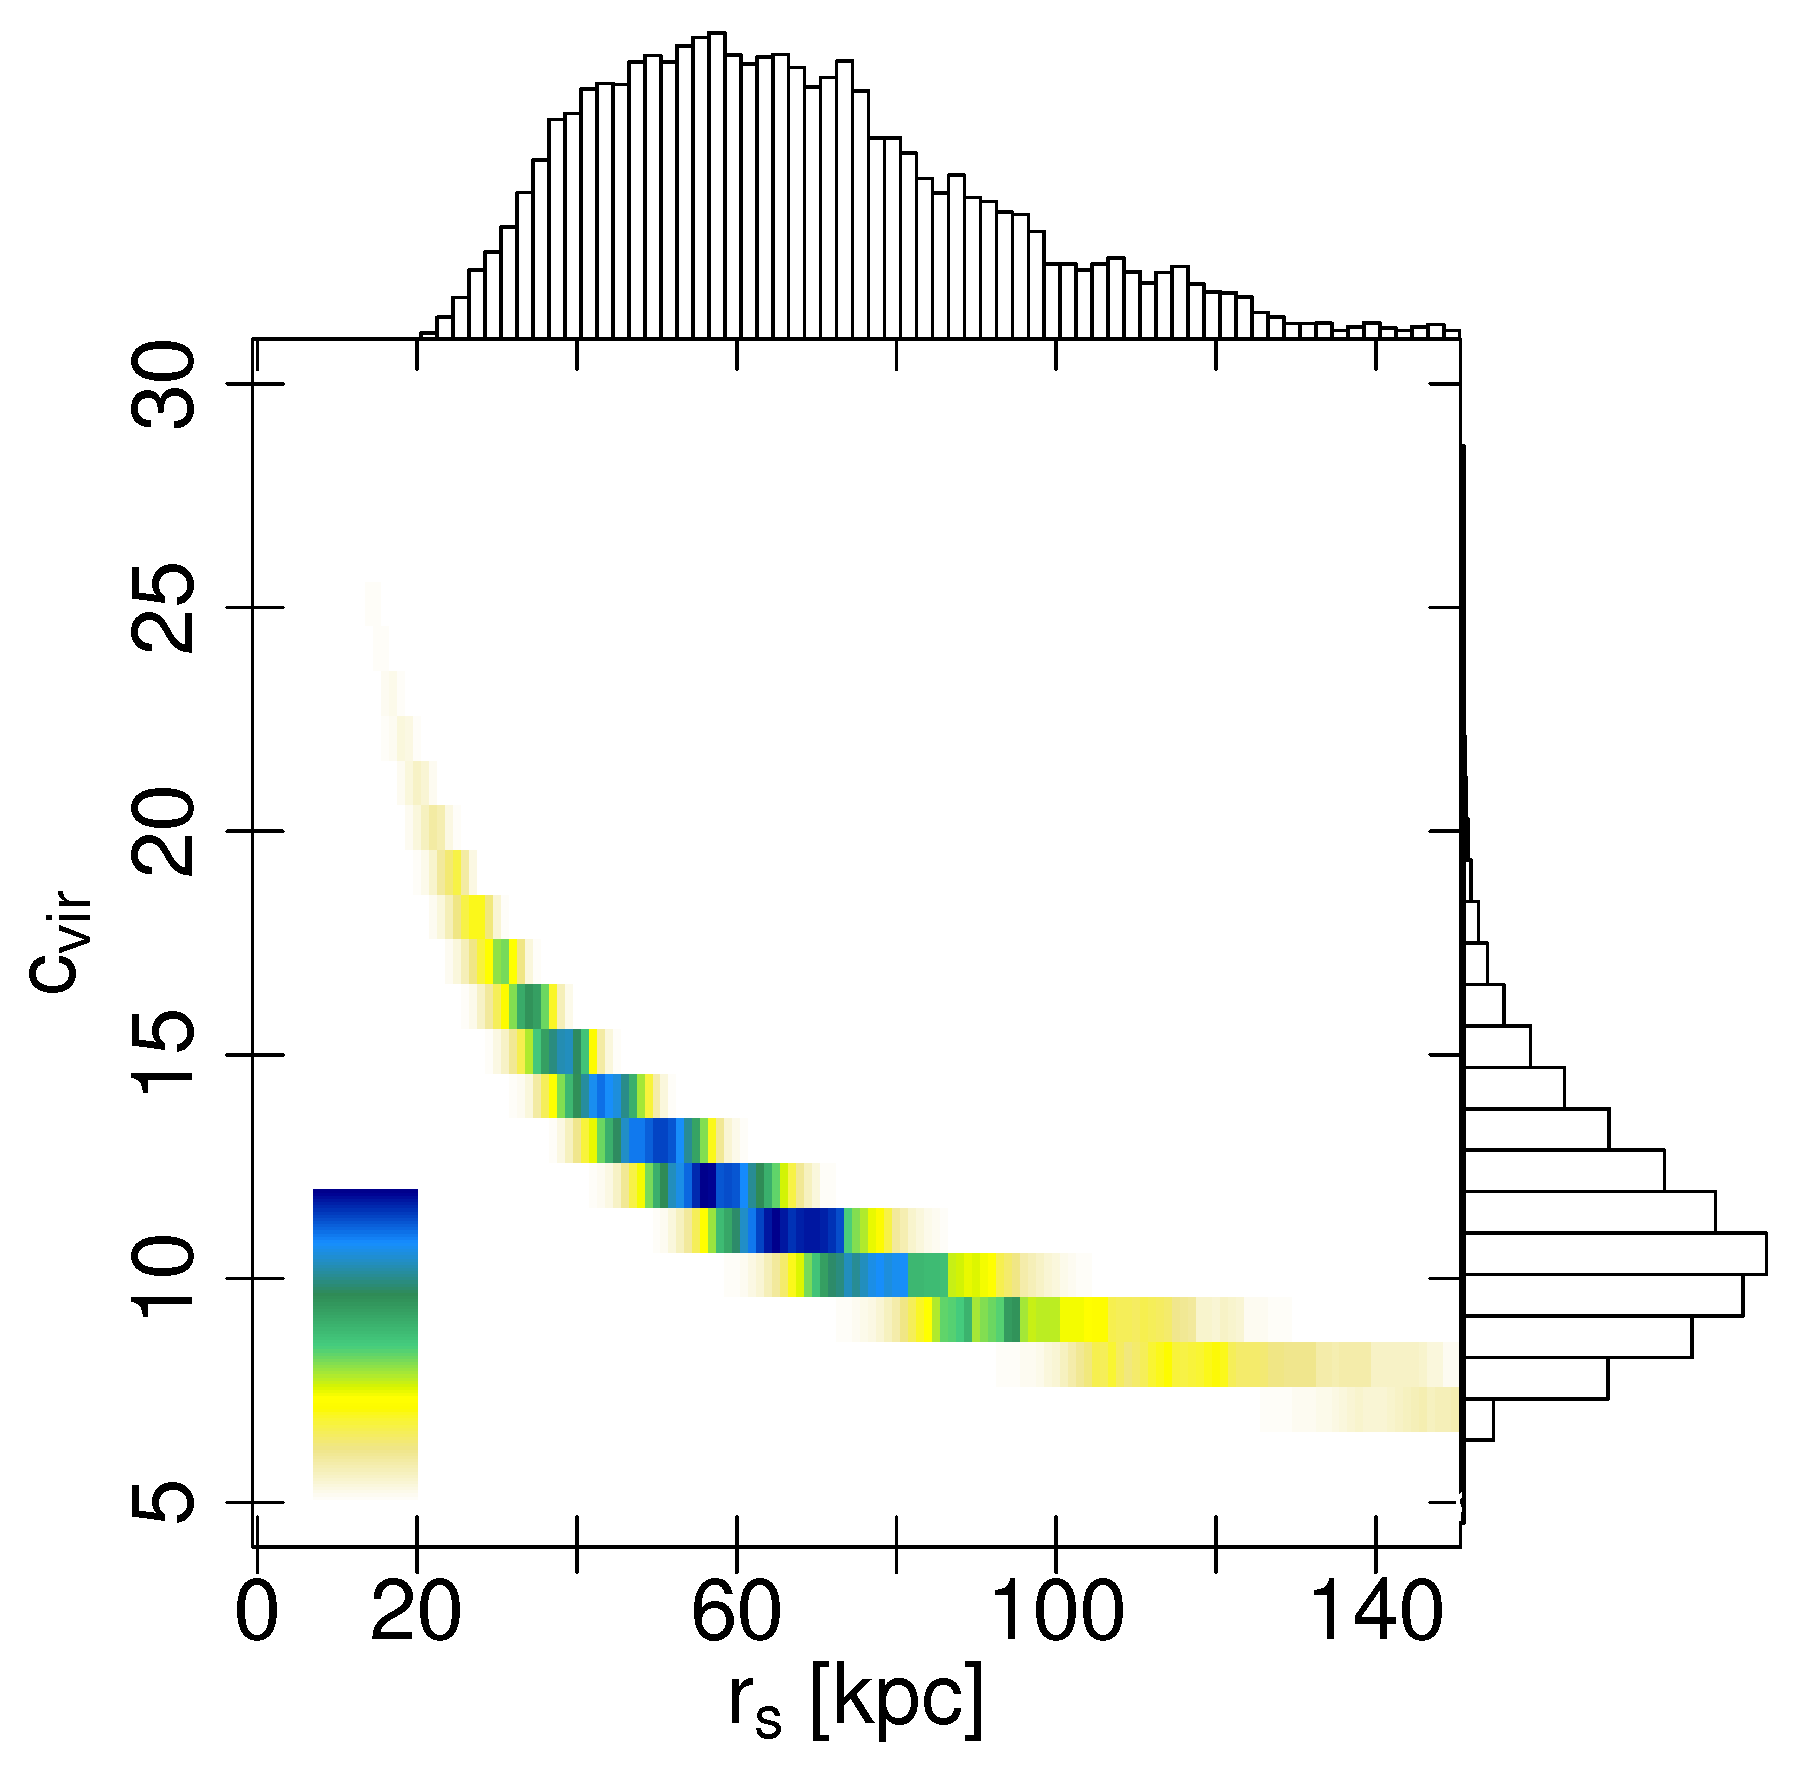
From this, Figure 9 displays the probability distributions for the parameters ( r s , c vir ) in the isotropic case (i.e., β = 0 ), adopting the prior distribution described in Section 2.5.2. The parameter grid is sampled with steps of Δ c vir = 1 and Δ r s = 1 kpc, covering a broad range of M vir . The colour gradient, from light yellow to dark blue, traces increasing joint probability, combining the results from both the stellar population and GC datasets. The side histograms show the marginal distributions of c vir and r s . The maximum likelihood solution is found at r s = 67 ± 14 kpc and c vir = 11 ± 1.7 , corresponding to a halo mass of M vir = 2.2 ± 0.4 × 10 13 M . The mean values from the marginal distributions indicate a slightly more massive halo, with r s = 69.4 ± 11 kpc and c vir = 11.7 ± 1.1 , and dispersions of σ r s = 27.7 ± 1.9 kpc and σ c vir = 2.7 ± 0.4 . For the M vir distribution, the mean and standard deviation are 1.6 ± 0.5 × 10 13 M and 1.0 ± 0.2 × 10 13 M , respectively. Uncertainties were estimated from the parameter dispersions obtained from 100 Monte Carlo realisations of artificial samples, generated to mimic the observational dataset and its uncertainties, and these were analysed using the same procedure applied to the observational data.
A set of models with mild constant anisotropies, ranging from β = 0.2 to β = 0.2 , was also explored. The resulting trends are consistent, indicating increasingly massive haloes for higher values of β . The most probable solutions correspond to virial masses in the range M vir = ( 1.4 ± 0.3 4.3 ± 0.6 ) × 10 13 M , associated with larger-scale radii ( r s ) and lower concentrations ( c vir ).
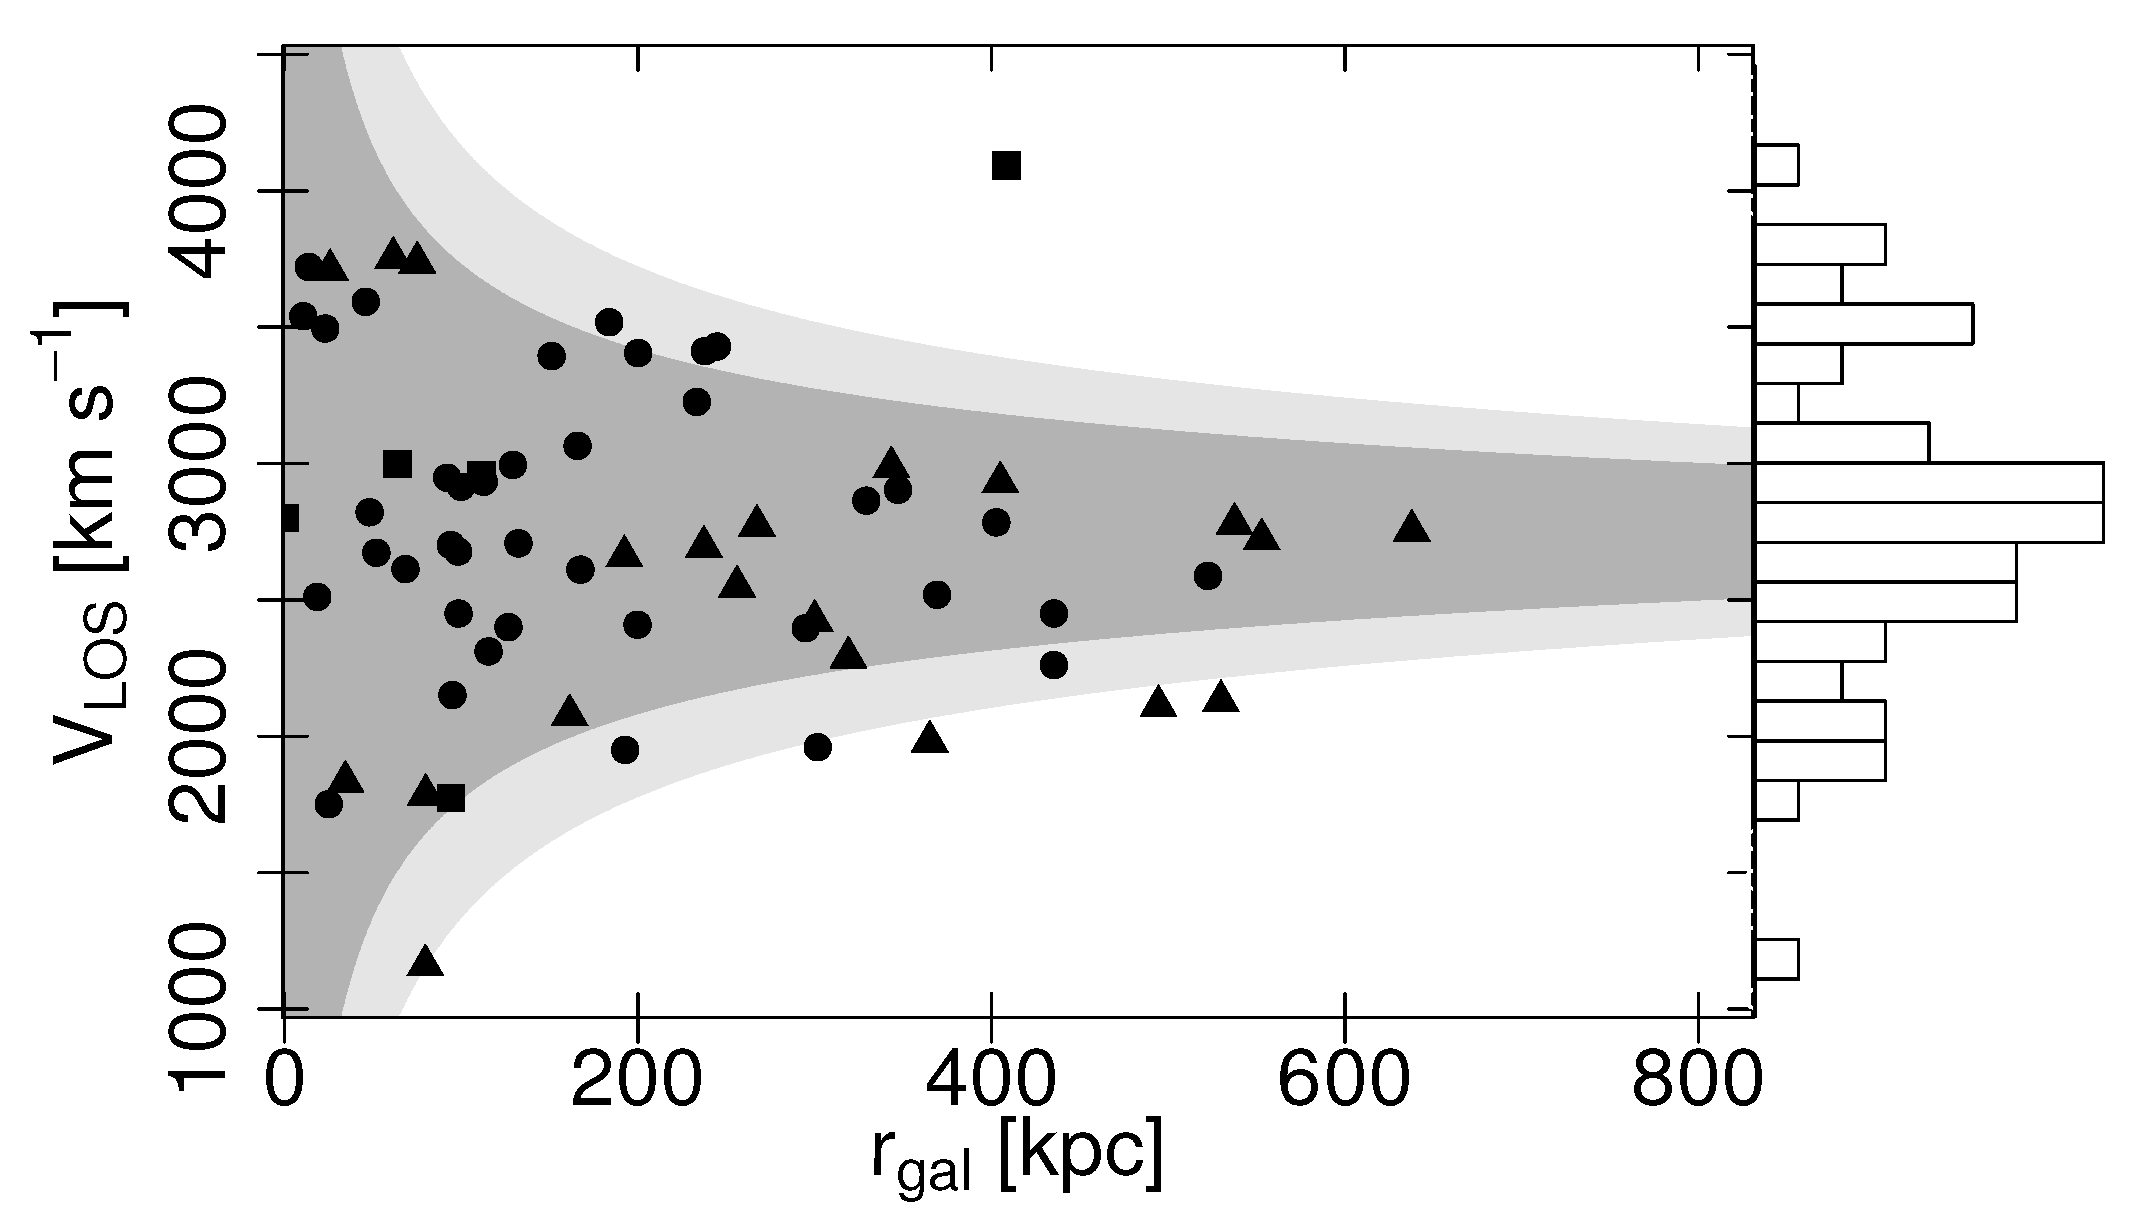
Even though the galaxy population of the Antlia cluster was not used as a tracer, it is instructive to compare the expected σ LOS profile from the most likely NFW parameters with the V LOS distribution of the galaxy sample listed in Caso and Richtler [76]. First, a Sérsic profile is fitted to the projected radial distribution of galaxies, using the photometric catalogue from Calderón et al. [31]. Probable background objects, late-type galaxies, and galaxies within 10 arcmin of NGC 3258—the other dominant gE in the cluster—are excluded. The resulting parameters are n gal = 2.6 , I 0 , gal = 0.4 arcmin−2 and r 0 , gal = 2.9 arcmin. Next, the expected σ LOS at the galactocentric distance corresponding to the median of the spectroscopic sample (≈170 kpc) was calculated. For this, the NFW parameters that maximise the probability were adopted, yielding 270 and 345 km s−1 for the isotropic case and β = 0.2 , respectively. Figure 10 shows the V LOS for early-type galaxies as a function of projected distance from NGC 3268 ( r gal ). Spirals and galaxies projected within 10 arcmin of NGC 3258 are excluded. Circles, triangles, and squares correspond to dwarf, lenticular, and elliptical galaxies, respectively. The dark grey region is bounded by the caustic curves calculated using the infall model of Praton and Schneider [77], assuming Ω 0 = 0.3 , which is the expected σ LOS for the isotropic case, and r vir = 740 kpc derived from the NFW parameters. The wider light grey region represents the analogous case for mild radial anisotropy, with r vir = 930 kpc. In both cases, the caustic curves reasonably trace the distribution of early-type galaxies in Antlia, although there appears to be an excess of galaxies with large peculiar velocities compared to the V LOS of NGC 3268. This is also evident in the side panel, which presents the histogram of V LOS for the galaxy sample.

4. Discussion

The total mass of the Antlia cluster can be estimated using several methods. The galaxy NGC 3268 hosts a large population of GCs, of the order of thousands [35,36], reflecting a rich history of merger events, which is in line with the two-stage scenario for the build-up of GCSs in galaxy clusters, e.g., [3,78]. In this context, several studies have analysed the mean ratio between the mass in GCs and the halo mass, η M = M GCS / M vir , finding η M 3–4 × 10 5 [79,80,81]. Assuming an average M for GCs associated with galaxies of similar luminosity to NGC 3268 of 2 × 10 5 M [82], the halo mass estimated from the total GC population ranges (2.4–5.5) × 10 13 M . This is slightly higher than the M vir obtained in Section 3.3 for the isotropic case, but the difference is within the uncertainties. For cases with mild radial anisotropy, the results are consistent with the mass range inferred from the GCS population.
By means of X-ray observations with ASCA for NGC 3268, Nakazawa et al. [83] estimated a mass of 2.1 × 10 13 M within 275 kpc, under the assumption of isothermality. For the parameters that maximise the probability in Section 3.3, the mass enclosed within the outer galactocentric distance considered by Nakazawa et al. [83] is 1.1 × 10 13 M in the isotropic case and ranges from ( 0.8 1.8 ) × 10 13 M for mild anisotropies, significantly lower than the estimate of Nakazawa et al. [83]. More recently, Wong et al. [23] derived r 200 900 kpc from the X-ray temperature of the cluster and the scaling relation of Sun et al. [84]. Using the definition of r vir adopted in Section 3.3, this r 200 translates into r vir 760 kpc, which is in very good agreement with the value obtained for the most probable set of parameters, r vir 740 kpc.
Applying a mass estimator to the population of early-type galaxies within 18 arcmin of NGC 3268, Caso and Richtler [76] derived a total mass of the subgroup centred on this galaxy of ( 5 8 ) × 10 13 M . This value is more than twice the virial mass obtained in this work for the isotropic case, although it partially overlaps with the estimates for mild radial anisotropy. It should be noted, however, that the large substructure identified by Caso and Richtler [76] in the core of the Antlia cluster might bias the mass towards higher values. In this context, Calderón et al. [31] fitted a linear relation to the colour–magnitude diagram of the early-type population and found that galaxies with large peculiar velocities relative to the V LOS of NGC 3268 are typically bluer. This suggests that such galaxies may have evolved in low-density environments, e.g., [85,86], and are therefore unlikely to be fully virialised within the cluster potential.
Hence, the comparison with estimates and scaling relations from the literature agrees with the results of this paper, favouring some degree of radial anisotropy to yield a more massive halo.

5. Conclusions

This paper aimed to derive the parameters of the NFW profile that provided the best fit for the kinematical dataset, confirmed by velocities and dispersions in the line-of-sight of the diffuse stellar population, as well as velocities for a small sample of confirmed GCs. The use of Bayesian statistics based on prior distributions derived from dark matter simulations, plus the Gauss–Hermite series of velocity distribution in the line-of-sight, emerges as an alternative method to constrain the parameters of the mass profile when the number of halo tracers is limited.
Several constant-anisotropy models were assumed, and the most likely NFW halo was selected in each case, yielding a moderately massive halo with a virial mass ranging from 1.4 ± 0.3 to 4.3 ± 0.6 × 10 13 M . Further comparison with observational evidence from various sources in the literature suggests that NGC 3268 may lie at the upper end of this range, which implies some degree of radial anisotropy for the galaxy.

Author Contributions

Conceptualization, J.P.C. and B.J.D.B.; methodology, J.P.C.; software, J.P.C.; formal analysis, J.P.C. and B.J.D.B.; investigation, J.P.C. and B.J.D.B.; resources, T.R. and J.P.C.; data curation, J.P.C.; writing—original draft preparation, J.P.C. and B.J.D.B.; writing—review and editing, T.R.; project administration, J.P.C.; funding acquisition, J.P.C. All authors have read and agreed to the published version of the manuscript.

Funding

This work was funded with grants from Consejo Nacional de Investigaciones Científicas y Técnicas de la República Argentina (PIP 112-2020010-1567) and Universidad Nacional de La Plata (PPID 11/G183 2023-2026, Argentina). TR was funded by Agencia Nacional de Investigación y Desarrollo (ANID, Chile) via Nucleo Milenio TITANs (NCN 2023-002). This work is based on observations obtained at the international Gemini Observatory, a program of NSF’s NOIRLab, which is managed by the Association of Universities for Research in Astronomy (AURA) under a cooperative agreement with the National Science Foundation on behalf of the Gemini Observatory partnership: the National Science Foundation (United States), National Research Council (Canada), Agencia Nacional de Investigación y Desarrollo (Chile), Ministerio de Ciencia, Tecnología e Innovación (Argentina), Ministério da Ciência, Tecnologia, Inovações e Comunicações (Brazil), and Korea Astronomy and Space Science Institute (Republic of Korea). This research has made use of the NASA/IPAC Extragalactic Database (NED), which is operated by the Jet Propulsion Laboratory, California Institute of Technology, under contract with the National Aeronautics and Space Administration.

Institutional Review Board Statement

Not applicable.

Informed Consent Statement

Not applicable.

Data Availability Statement

The results from the kinematical analysis are included in the article; data from the literature is appropriately cited.

Conflicts of Interest

The authors declare no conflicts of interest.

Appendix A. Surface Brightness Profile of NGC 3268

Table A1. Parameters of the surface brightness profile of NGC 3268 in the I filter, fitted by means of the task ELLIPSE within iraf. The first column corresponds to the major semi-axis of the ellipses, and the second column shows the surface brightness profile of the galaxy, corrected by absorption according to Schlafly and Finkbeiner [37], but without sky subtraction. The last two columns indicate the ellipticity and position angle of the corresponding ellipses.
r gal μ I 0 ϵ PA
(arcsec) (mag arcsec−2) (deg)
0.39 15.86 ± 0.01 0.187 ± 0.029 69.4 ± 2.8
0.74 16.02 ± 0.01 0.185 ± 0.012 69.1 ± 1.1
1.11 16.19 ± 0.01 0.182 ± 0.004 69.2 ± 0.6
1.46 16.39 ± 0.01 0.183 ± 0.014 69.0 ± 1.8
1.83 16.63 ± 0.01 0.182 ± 0.014 68.9 ± 1.7
2.22 16.71 ± 0.01 0.177 ± 0.007 68.7 ± 1.6
2.59 16.91 ± 0.01 0.177 ± 0.003 68.9 ± 0.5
2.96 16.99 ± 0.01 0.181 ± 0.002 69.0 ± 0.4
3.33 17.18 ± 0.01 0.184 ± 0.002 69.1 ± 0.4
3.68 17.39 ± 0.01 0.185 ± 0.002 69.0 ± 0.4
4.01 17.49 ± 0.02 0.186 ± 0.002 68.9 ± 0.4
4.38 17.60 ± 0.02 0.188 ± 0.002 68.4 ± 0.4
4.75 17.71 ± 0.02 0.186 ± 0.003 68.4 ± 0.4
5.08 17.83 ± 0.02 0.185 ± 0.003 68.4 ± 0.5
5.44 17.94 ± 0.02 0.185 ± 0.003 68.9 ± 0.4
5.82 18.04 ± 0.02 0.187 ± 0.002 68.6 ± 0.4
6.23 18.15 ± 0.02 0.188 ± 0.003 68.1 ± 0.5
6.66 18.26 ± 0.02 0.187 ± 0.003 67.6 ± 0.5
7.13 18.36 ± 0.02 0.189 ± 0.003 67.6 ± 0.5
7.63 18.46 ± 0.02 0.192 ± 0.003 67.9 ± 0.5
8.16 18.63 ± 0.03 0.195 ± 0.001 68.1 ± 0.1
8.73 18.70 ± 0.03 0.195 ± 0.001 68.0 ± 0.1
9.35 18.81 ± 0.03 0.196 ± 0.001 68.1 ± 0.1
10.00 18.91 ± 0.03 0.196 ± 0.001 68.0 ± 0.1
10.70 19.02 ± 0.03 0.195 ± 0.001 68.1 ± 0.1
11.45 19.13 ± 0.03 0.194 ± 0.001 68.0 ± 0.1
12.25 19.24 ± 0.04 0.193 ± 0.001 67.7 ± 0.2
13.11 19.35 ± 0.04 0.193 ± 0.001 67.4 ± 0.1
14.03 19.45 ± 0.04 0.193 ± 0.001 67.7 ± 0.1
15.01 19.56 ± 0.04 0.193 ± 0.002 67.7 ± 0.4
16.06 19.67 ± 0.04 0.192 ± 0.002 67.2 ± 0.4
17.18 19.77 ± 0.05 0.192 ± 0.002 66.5 ± 0.4
18.38 19.89 ± 0.05 0.192 ± 0.002 66.2 ± 0.3
19.67 20.00 ± 0.05 0.194 ± 0.001 66.6 ± 0.2
21.05 20.10 ± 0.05 0.198 ± 0.001 66.7 ± 0.2
22.52 20.20 ± 0.06 0.201 ± 0.002 67.1 ± 0.3
24.10 20.30 ± 0.06 0.203 ± 0.002 67.5 ± 0.3
25.79 20.41 ± 0.06 0.203 ± 0.002 68.3 ± 0.3
27.59 20.52 ± 0.06 0.201 ± 0.002 68.4 ± 0.4
29.52 20.65 ± 0.07 0.200 ± 0.001 67.8 ± 0.2
31.59 20.76 ± 0.07 0.197 ± 0.001 66.7 ± 0.2
33.80 20.88 ± 0.08 0.197 ± 0.001 66.1 ± 0.1
36.17 21.00 ± 0.08 0.197 ± 0.001 65.9 ± 0.1
38.70 21.11 ± 0.08 0.198 ± 0.001 66.0 ± 0.2
41.41 21.21 ± 0.09 0.202 ± 0.002 66.4 ± 0.3
44.30 21.31 ± 0.09 0.212 ± 0.001 66.9 ± 0.2
47.41 21.39 ± 0.10 0.218 ± 0.006 67.2 ± 0.9
50.72 21.52 ± 0.10 0.224 ± 0.001 67.0 ± 0.2
54.27 21.61 ± 0.11 0.227 ± 0.001 67.1 ± 0.2
58.07 21.71 ± 0.11 0.234 ± 0.002 66.7 ± 0.4
62.14 21.82 ± 0.12 0.239 ± 0.002 66.5 ± 0.2
66.49 21.93 ± 0.12 0.243 ± 0.002 65.8 ± 0.3
71.14 22.03 ± 0.13 0.245 ± 0.002 65.6 ± 0.3
76.12 22.14 ± 0.13 0.25 ± 0.002 65.2 ± 0.3
81.45 22.25 ± 0.14 0.25 ± 0.002 64.9 ± 0.2
87.15 22.36 ± 0.15 0.251 ± 0.003 64.6 ± 0.4
93.25 22.50 ± 0.16 0.247 ± 0.002 64.3 ± 0.4
99.78 22.62 ± 0.16 0.248 ± 0.002 64.4 ± 0.5
106.8 22.72 ± 0.17
114.2 22.81 ± 0.18
122.2 22.93 ± 0.19
130.8 23.02 ± 0.19
139.9 23.29 ± 0.22
149.7 23.21 ± 0.21
150.0 23.76 ± 0.27
160.5 23.87 ± 0.28
171.7 23.89 ± 0.28
183.8 23.92 ± 0.31
196.6 23.82 ± 0.27
210.4 23.83 ± 0.26
225.1 23.85 ± 0.27
240.9 23.80 ± 0.25
257.6 23.89 ± 0.27
275.6 23.92 ± 0.25
295.0 23.85 ± 0.26

References

  1. Bond, J.R.; Kofman, L.; Pogosyan, D. How filaments of galaxies are woven into the cosmic web. Nature 1996, 380, 603–606. [Google Scholar] [CrossRef]
  2. Oser, L.; Ostriker, J.P.; Naab, T.; Johansson, P.H.; Burkert, A. The Two Phases of Galaxy Formation. Astrophys. J. 2010, 725, 2312–2323. [Google Scholar] [CrossRef]
  3. Forbes, D.A.; Spitler, L.R.; Strader, J.; Romanowsky, A.J.; Brodie, J.P.; Foster, C. Evidence for two phases of galaxy formation from radial trends in the globular cluster system of NGC 1407. Mon. Not. R. Astron. Soc. 2011, 413, 2943–2949. [Google Scholar] [CrossRef]
  4. Nanayakkara, T.; Glazebrook, K.; Schreiber, C.; Chittenden, H.; Brammer, G.; Esdaile, J.; Jacobs, C.; Kacprzak, G.G.; Kawinwanichakij, L.; Kimmig, L.C.; et al. The Formation Histories of Massive and Quiescent Galaxies in the 3 < z < 4.5 Universe. Astrophys. J. 2025, 981, 78. [Google Scholar] [CrossRef]
  5. Damjanov, I.; McCarthy, P.J.; Abraham, R.G.; Glazebrook, K.; Yan, H.; Mentuch, E.; Le Borgne, D.; Savaglio, S.; Crampton, D.; Murowinski, R.; et al. Red Nuggets at z ~1.5: Compact Passive Galaxies and the Formation of the Kormendy Relation. Astrophys. J. 2009, 695, 101–115. [Google Scholar] [CrossRef]
  6. van Dokkum, P.G.; Whitaker, K.E.; Brammer, G.; Franx, M.; Kriek, M.; Labbé, I.; Marchesini, D.; Quadri, R.; Bezanson, R.; Illingworth, G.D.; et al. The Growth of Massive Galaxies Since z = 2. Astrophys. J. 2010, 709, 1018–1041. [Google Scholar] [CrossRef]
  7. Schawinski, K.; Urry, C.M.; Simmons, B.D.; Fortson, L.; Kaviraj, S.; Keel, W.C.; Lintott, C.J.; Masters, K.L.; Nichol, R.C.; Sarzi, M.; et al. The green valley is a red herring: Galaxy Zoo reveals two evolutionary pathways towards quenching of star formation in early- and late-type galaxies. Mon. Not. R. Astron. Soc. 2014, 440, 889–907. [Google Scholar] [CrossRef]
  8. Pulsoni, C.; Gerhard, O.; Arnaboldi, M.; Pillepich, A.; Rodriguez-Gomez, V.; Nelson, D.; Hernquist, L.; Springel, V. The stellar halos of ETGs in the IllustrisTNG simulations. II. Accretion, merger history, and dark halo connection. Astron. Astrophys. 2021, 647, A95. [Google Scholar] [CrossRef]
  9. Baldry, I.K.; Balogh, M.L.; Bower, R.G.; Glazebrook, K.; Nichol, R.C.; Bamford, S.P.; Budavari, T. Galaxy bimodality versus stellar mass and environment. Mon. Not. R. Astron. Soc. 2006, 373, 469–483. [Google Scholar] [CrossRef]
  10. Bahé, Y.M.; McCarthy, I.G.; Balogh, M.L.; Font, A.S. Why does the environmental influence on group and cluster galaxies extend beyond the virial radius? Mon. Not. R. Astron. Soc. 2013, 430, 3017–3031. [Google Scholar] [CrossRef]
  11. Lacerna, I.; Rodriguez, F.; Montero-Dorta, A.D.; O’Mill, A.L.; Cora, S.A.; Artale, M.C.; Ruiz, A.N.; Hough, T.; Vega-Martínez, C.A. On the environmental influence of groups and clusters of galaxies beyond the virial radius: Galactic conformity at few Mpc scales. Mon. Not. R. Astron. Soc. 2022, 513, 2271–2284. [Google Scholar] [CrossRef]
  12. Peebles, P.J.E.; Ratra, B. The cosmological constant and dark energy. Rev. Mod. Phys. 2003, 75, 559–606. [Google Scholar] [CrossRef]
  13. Planck Collaboration; Aghanim, N.; Akrami, Y.; Ashdown, M.; Aumont, J.; Baccigalupi, C.; Ballardini, M.; Banday, A.J.; Barreiro, R.B.; Bartolo, N.; et al. Planck 2018 results. VI. Cosmological parameters. Astron. Astrophys. 2020, 641, A6. [Google Scholar] [CrossRef]
  14. Milgrom, M. A modification of the Newtonian dynamics - Implications for galaxies. Astrophys. J. 1983, 270, 371–383. [Google Scholar] [CrossRef]
  15. Hodson, A.O.; Zhao, H. Generalizing MOND to explain the missing mass in galaxy clusters. Astron. Astrophys. 2017, 598, A127. [Google Scholar] [CrossRef]
  16. Moffat, J.W.; Rahvar, S. The MOG weak field approximation and observational test of galaxy rotation curves. Mon. Not. R. Astron. Soc. 2013, 436, 1439–1451. [Google Scholar] [CrossRef]
  17. Napolitano, N.R.; Romanowsky, A.J.; Capaccioli, M.; Douglas, N.G.; Arnaboldi, M.; Coccato, L.; Gerhard, O.; Kuijken, K.; Merrifield, M.R.; Bamford, S.P.; et al. The PN.S Elliptical Galaxy Survey: A standard ΛCDM halo around NGC 4374? Mon. Not. R. Astron. Soc. 2011, 411, 2035–2053. [Google Scholar] [CrossRef]
  18. Schuberth, Y.; Richtler, T.; Hilker, M.; Salinas, R.; Dirsch, B.; Larsen, S.S. Dynamics of the NGC 4636 globular cluster system. II. Improved constraints from a large sample of globular cluster velocities. Astron. Astrophys. 2012, 544, A115. [Google Scholar] [CrossRef]
  19. Longobardi, A.; Peng, E.W.; Côté, P.; Mihos, J.C.; Ferrarese, L.; Puzia, T.H.; Lançon, A.; Zhang, H.X.; Muñoz, R.P.; Blakeslee, J.P.; et al. The Next Generation Virgo Cluster Survey (NGVS). XXXI. The Kinematics of Intracluster Globular Clusters in the Core of the Virgo Cluster. Astrophys. J. 2018, 864, 36. [Google Scholar] [CrossRef]
  20. Hilker, M.; Richtler, T.; Barbosa, C.E.; Arnaboldi, M.; Coccato, L.; Mendes de Oliveira, C. The Hydra I cluster core. II. Kinematic complexity in a rising velocity dispersion profile around the cD galaxy NGC 3311. Astron. Astrophys. 2018, 619, A70. [Google Scholar] [CrossRef]
  21. Harris, W.E.; Harris, G.L.; Hudson, M.J. Dark Matter Halos in Galaxies and Globular Cluster Populations. II. Metallicity and Morphology. Astrophys. J. 2015, 806, 36. [Google Scholar] [CrossRef]
  22. Tully, R.B.; Courtois, H.M.; Dolphin, A.E.; Fisher, J.R.; Héraudeau, P.; Jacobs, B.A.; Karachentsev, I.D.; Makarov, D.; Makarova, L.; Mitronova, S.; et al. Cosmicflows-2: The Data. Astron. J. 2013, 146, 86. [Google Scholar] [CrossRef]
  23. Wong, K.W.; Irwin, J.A.; Wik, D.R.; Sun, M.; Sarazin, C.L.; Fujita, Y.; Reiprich, T.H. Suzaku X-ray Observations of the Nearest Non-Cool Core Cluster, Antlia: Dynamically Young but with Remarkably Relaxed Outskirts. Astron. J. 2016, 829, 49. [Google Scholar] [CrossRef]
  24. Gargiulo, I.D.; García, F.; Combi, J.A.; Caso, J.P.; Bassino, L.P. XMM-Newton observations of NGC 3268 in the Antlia Galaxy Cluster: Characterization of a hidden group of galaxies at z ≈ 0.41. Mon. Not. R. Astron. Soc. 2018, 479, 240–250. [Google Scholar] [CrossRef]
  25. Hopp, U.; Materne, J. The Antlia cluster of galaxies and its environment: The Hydra I-Centaurus supercluster. Astron. Astrophys. Suppl. Ser. 1985, 61, 93–106. [Google Scholar]
  26. Ferguson, H.C.; Sandage, A. Population Studies in Groups and Clusters of Galaxies. III. A Catalog of Galaxies in Five Nearby Galaxies. Astron. J. 1990, 100, 1–31. [Google Scholar] [CrossRef]
  27. Smith Castelli, A.V.; Bassino, L.P.; Richtler, T.; Cellone, S.A.; Aruta, C.; Infante, L. Galaxy populations in the Antlia cluster—I. Photometric properties of early-type galaxies. Mon. Not. R. Astron. Soc. 2008, 386, 2311–2322. [Google Scholar] [CrossRef]
  28. Smith Castelli, A.V.; Cellone, S.A.; Faifer, F.R.; Bassino, L.P.; Richtler, T.; Romero, G.A.; Calderón, J.P.; Caso, J.P. Galaxy populations in the Antlia cluster—III. Properties of faint early-type galaxies. Mon. Not. R. Astron. Soc. 2012, 419, 2472–2488. [Google Scholar] [CrossRef]
  29. Calderón, J.P.; Bassino, L.P.; Cellone, S.A.; Richtler, T.; Caso, J.P.; Gómez, M. Early-type galaxies in the Antlia Cluster: A deep look into scaling relations. Mon. Not. R. Astron. Soc. 2015, 451, 791–803. [Google Scholar] [CrossRef]
  30. Calderón, J.P.; Bassino, L.P.; Cellone, S.A.; Gómez, M. Early-type galaxies in the Antlia cluster: Catalogue and isophotal analysis. Mon. Not. R. Astron. Soc. 2018, 477, 1760–1771. [Google Scholar] [CrossRef]
  31. Calderón, J.P.; Bassino, L.P.; Cellone, S.A.; Gómez, M.; Caso, J.P. Early-type galaxies in the Antlia cluster: Global properties. Mon. Not. R. Astron. Soc. 2020, 497, 1791–1806. [Google Scholar] [CrossRef]
  32. Smith Castelli, A.V.; Faifer, F.R.; Richtler, T.; Bassino, L.P. Galaxy populations in the Antlia cluster—II. Compact elliptical galaxy candidates. Mon. Not. R. Astron. Soc. 2008, 391, 685–699. [Google Scholar] [CrossRef]
  33. Caso, J.P.; Vega Neme, L.; De Bórtoli, B.J.; Bassino, L.P.; Richtler, T.; Smith Castelli, A. Compact ellipticals in the Antlia cluster of galaxies. Astron. Astrophys. 2024, 691, A307. [Google Scholar] [CrossRef]
  34. Dirsch, B.; Richtler, T.; Bassino, L.P. The globular cluster systems of NGC 3258 and NGC 3268 in the Antlia cluster. Astron. Astrophys. 2003, 408, 929–939. [Google Scholar] [CrossRef]
  35. Bassino, L.P.; Richtler, T.; Dirsch, B. VLT photometry in the Antlia cluster: The giant ellipticals NGC3258 and NGC3268 and their globular cluster systems. Mon. Not. R. Astron. Soc. 2008, 386, 1145–1156. [Google Scholar] [CrossRef]
  36. Caso, J.P.; Bassino, L.P.; Gómez, M. Globular cluster systems as tracers of the evolutionary history in NGC 3258 and NGC 3268. Mon. Not. R. Astron. Soc. 2017, 470, 3227–3238. [Google Scholar] [CrossRef]
  37. Schlafly, E.F.; Finkbeiner, D.P. Measuring Reddening with Sloan Digital Sky Survey Stellar Spectra and Recalibrating SFD. Astrophys. J. 2011, 737, 103. [Google Scholar] [CrossRef]
  38. Huang, S.; Ho, L.C.; Peng, C.Y.; Li, Z.Y.; Barth, A.J. The Carnegie-Irvine Galaxy Survey. III. The Three-component Structure of Nearby Elliptical Galaxies. Astrophys. J. 2013, 766, 47. [Google Scholar] [CrossRef]
  39. Caso, J.P.; Bassino, L.P.; Richtler, T.; Smith Castelli, A.V.; Faifer, F.R. Ultracompact dwarfs around NGC 3258 in the Antlia cluster. Mon. Not. R. Astron. Soc. 2013, 430, 1088–1101. [Google Scholar] [CrossRef]
  40. Caso, J.P.; Bassino, L.P.; Richtler, T.; Calderón, J.P.; Smith Castelli, A.V. Ultracompact dwarfs around NGC 3268. Mon. Not. R. Astron. Soc. 2014, 442, 891–899. [Google Scholar] [CrossRef]
  41. Norris, M.A.; Sharples, R.M.; Bridges, T.; Gebhardt, K.; Forbes, D.A.; Proctor, R.; Faifer, F.R.; Forte, J.C.; Beasley, M.A.; Zepf, S.E.; et al. Gemini/GMOS spectroscopy of the spheroid and globular cluster system of NGC 3923. Mon. Not. R. Astron. Soc. 2008, 385, 40–52. [Google Scholar] [CrossRef]
  42. Lane, R.R.; Salinas, R.; Richtler, T. Dark matter deprivation in the field elliptical galaxy NGC 7507. Astrophys. J. 2015, 574, A93. [Google Scholar] [CrossRef]
  43. Cappellari, M.; Emsellem, E. Parametric Recovery of Line-of-Sight Velocity Distributions from Absorption-Line Spectra of Galaxies via Penalized Likelihood. Publ. Astron. Soc. Pac. 2004, 116, 138–147. [Google Scholar] [CrossRef]
  44. Cappellari, M. Improving the full spectrum fitting method: Accurate convolution with Gauss-Hermite functions. Mon. Not. R. Astron. Soc. 2017, 466, 798–811. [Google Scholar] [CrossRef]
  45. Cappellari, M. Full spectrum fitting with photometry in PPXF: Stellar population versus dynamical masses, non-parametric star formation history and metallicity for 3200 LEGA-C galaxies at redshift z ≈ 0.8. Mon. Not. R. Astron. Soc. 2023, 526, 3273–3300. [Google Scholar] [CrossRef]
  46. Vazdekis, A.; Sánchez-Blázquez, P.; Falcón-Barroso, J.; Cenarro, A.J.; Beasley, M.A.; Cardiel, N.; Gorgas, J.; Peletier, R.F. Evolutionary stellar population synthesis with MILES - I. The base models and a new line index system. Mon. Not. R. Astron. Soc. 2010, 404, 1639–1671. [Google Scholar] [CrossRef]
  47. Vazdekis, A.; Koleva, M.; Ricciardelli, E.; Röck, B.; Falcón-Barroso, J. UV-extended E-MILES stellar population models: Young components in massive early-type galaxies. Mon. Not. R. Astron. Soc. 2016, 463, 3409–3436. [Google Scholar] [CrossRef]
  48. Joanes, D.N.; Gill, C.A. Comparing measures of sample skewness and kurtosis. J. R. Stat. Soc. Ser. D (The Stat.) 1998, 47, 183–189. [Google Scholar] [CrossRef]
  49. Lim, S.; Peng, E.W.; Côté, P.; Ferrarese, L.; Roediger, J.C.; Liu, C.; Spengler, C.; Sola, E.; Duc, P.A.; Sales, L.V.; et al. The Next Generation Virgo Cluster Survey (NGVS). XXVII. The Size and Structure of Globular Cluster Systems and Their Connection to Dark Matter Halos. Astrophys. J. 2024, 966, 168. [Google Scholar] [CrossRef]
  50. Klypin, A.; Yepes, G.; Gottlöber, S.; Prada, F.; Heß, S. MultiDark simulations: The story of dark matter halo concentrations and density profiles. Mon. Not. R. Astron. Soc. 2016, 457, 4340–4359. [Google Scholar] [CrossRef]
  51. Ade, P.A.R. et al. [Planck Collaboration] Planck 2013 results. XVI. Cosmological parameters. Astron. Astrophys. 2014, 571, A16. [Google Scholar] [CrossRef]
  52. Behroozi, P.S.; Wechsler, R.H.; Wu, H.Y. The ROCKSTAR Phase-space Temporal Halo Finder and the Velocity Offsets of Cluster Cores. Astrophys. J. 2013, 762, 109. [Google Scholar] [CrossRef]
  53. Vale, A.; Ostriker, J.P. The non-parametric model for linking galaxy luminosity with halo/subhalo mass. Mon. Not. R. Astron. Soc. 2006, 371, 1173–1187. [Google Scholar] [CrossRef]
  54. Conroy, C.; Wechsler, R.H.; Kravtsov, A.V. Modeling Luminosity-dependent Galaxy Clustering through Cosmic Time. Astrophys. J. 2006, 647, 201–214. [Google Scholar] [CrossRef]
  55. Caso, J.P. The mass profile of NGC 3377 from a Bayesian approach. Mon. Not. R. Astron. Soc. 2022, 511, 5314–5327. [Google Scholar] [CrossRef]
  56. Lan, T.W.; Ménard, B.; Mo, H. The galaxy luminosity function in groups and clusters: The faint-end upturn and the connection to the field luminosity function. Mon. Not. R. Astron. Soc. 2016, 459, 3998–4019. [Google Scholar] [CrossRef]
  57. Girelli, G.; Pozzetti, L.; Bolzonella, M.; Giocoli, C.; Marulli, F.; Baldi, M. The stellar-to-halo mass relation over the past 12 Gyr. I. Standard ΛCDM model. Astron. Astrophys. 2020, 634, A135. [Google Scholar] [CrossRef]
  58. McNaught-Roberts, T.; Norberg, P.; Baugh, C.; Lacey, C.; Loveday, J.; Peacock, J.; Baldry, I.; Bland-Hawthorn, J.; Brough, S.; Driver, S.P.; et al. Galaxy And Mass Assembly (GAMA): The dependence of the galaxy luminosity function on environment, redshift and colour. Mon. Not. R. Astron. Soc. 2014, 445, 2125–2145. [Google Scholar] [CrossRef]
  59. Łokas, E.L. Dark matter distribution in dwarf spheroidal galaxies. Mon. Not. R. Astron. Soc. 2002, 333, 697–708. [Google Scholar] [CrossRef]
  60. Binney, J.; Tremaine, S. Galactic Dynamics, 2nd ed.; Princeton University Press: Princeton, NJ, USA, 2008. [Google Scholar]
  61. Richardson, T.; Fairbairn, M. Analytical solutions to the mass-anisotropy degeneracy with higher order Jeans analysis: A general method. Mon. Not. R. Astron. Soc. 2013, 432, 3361–3380. [Google Scholar] [CrossRef]
  62. Mamon, G.A.; Łokas, E.L. Dark matter in elliptical galaxies—II. Estimating the mass within the virial radius. Mon. Not. R. Astron. Soc. 2005, 363, 705–722. [Google Scholar] [CrossRef]
  63. van der Marel, R.P.; Franx, M. A New Method for the Identification of Non-Gaussian Line Profiles in Elliptical Galaxies. Astrophys. J. 1993, 407, 525. [Google Scholar] [CrossRef]
  64. Emsellem, E.; Cappellari, M.; Krajnović, D.; van de Ven, G.; Bacon, R.; Bureau, M.; Davies, R.L.; de Zeeuw, P.T.; Falcón-Barroso, J.; Kuntschner, H.; et al. The SAURON project—IX. A kinematic classification for early-type galaxies. Mon. Not. R. Astron. Soc. 2007, 379, 401–417. [Google Scholar] [CrossRef]
  65. Coccato, L.; Gerhard, O.; Arnaboldi, M.; Das, P.; Douglas, N.G.; Kuijken, K.; Merrifield, M.R.; Napolitano, N.R.; Noordermeer, E.; Romanowsky, A.J.; et al. Kinematic properties of early-type galaxy haloes using planetary nebulae*. Mon. Not. R. Astron. Soc. 2009, 394, 1249–1283. [Google Scholar] [CrossRef]
  66. Salinas, R.; Richtler, T.; Bassino, L.P.; Romanowsky, A.J.; Schuberth, Y. Kinematic properties of the field elliptical NGC 7507. Astron. Astrophys. 2012, 538, A87. [Google Scholar] [CrossRef]
  67. Shetty, S.; Cappellari, M. Salpeter Normalization of the Stellar Initial Mass Function for Massive Galaxies at z ~1. Astrophys. J. Lett. 2014, 786, L10. [Google Scholar] [CrossRef]
  68. Li, H.; Ge, J.; Mao, S.; Cappellari, M.; Long, R.J.; Li, R.; Emsellem, E.; Dutton, A.A.; Li, C.; Bundy, K.; et al. SDSS-IV MaNGA: Variation of the Stellar Initial Mass Function in Spiral and Early-type Galaxies. Astrophys. J. 2017, 838, 77. [Google Scholar] [CrossRef]
  69. Navarro, J.F.; Frenk, C.S.; White, S.D.M. A Universal Density Profile from Hierarchical Clustering. Astrophys. J. 1997, 490, 493–508. [Google Scholar] [CrossRef]
  70. Dumont, A.; Seth, A.C.; Strader, J.; Sand, D.J.; Voggel, K.; Hughes, A.K.; Crnojević, D.; Forbes, D.A.; Mateo, M.; Pearson, S. Investigating the dark matter halo of NGC 5128 using a discrete dynamical model. Astron. Astrophys. 2024, 685, A132. [Google Scholar] [CrossRef]
  71. Grillo, C. On the Average Density Profile of Dark-matter Halos in the Inner Regions of Massive Early-type Galaxies. Astrophys. J. Lett. 2012, 747, L15. [Google Scholar] [CrossRef]
  72. Veršič, T.; Thater, S.; van de Ven, G.; Watkins, L.L.; Jethwa, P.; Leaman, R.; Zocchi, A. Total mass slopes and enclosed mass constrained by globular cluster system dynamics. Astron. Astrophys. 2024, 681, A46. [Google Scholar] [CrossRef]
  73. Bullock, J.S.; Kolatt, T.S.; Sigad, Y.; Somerville, R.S.; Kravtsov, A.V.; Klypin, A.A.; Primack, J.R.; Dekel, A. Profiles of dark haloes: Evolution, scatter and environment. Mon. Not. R. Astron. Soc. 2001, 321, 559–575. [Google Scholar] [CrossRef]
  74. Bryan, G.L.; Norman, M.L. Statistical Properties of X-Ray Clusters: Analytic and Numerical Comparisons. Astrophys. J. 1998, 495, 80–99. [Google Scholar] [CrossRef]
  75. Cappellari, M.; Emsellem, E.; Bacon, R.; Bureau, M.; Davies, R.L.; De Zeeuw, P.T.; Falcón-Barroso, J.; Krajnović, D.; Kuntschner, H.; McDermid, R.M.; et al. The SAURON project—X. The orbital anisotropy of elliptical and lenticular galaxies: Revisiting the (V/σ, ε) diagram with integral-field stellar kinematics. Mon. Not. R. Astron. Soc. 2007, 379, 418–444. [Google Scholar] [CrossRef]
  76. Caso, J.P.; Richtler, T. Deconstructing the Antlia cluster core. Astron. Astrophys. 2015, 584, A125. [Google Scholar] [CrossRef]
  77. Praton, E.A.; Schneider, S.E. Infall-related Observational Effects around Clusters: Large-Scale Structure, Transverse Motions, and Redshift-Space Artifacts. Astrophys. J. 1994, 422, 46. [Google Scholar] [CrossRef]
  78. Ramos-Almendares, F.; Sales, L.V.; Abadi, M.G.; Doppel, J.E.; Muriel, H.; Peng, E.W. Simulating the spatial distribution and kinematics of globular clusters within galaxy clusters in illustris. Mon. Not. R. Astron. Soc. 2020, 493, 5357–5368. [Google Scholar] [CrossRef]
  79. Forbes, D.A.; Alabi, A.; Romanowsky, A.J.; Brodie, J.P.; Strader, J.; Usher, C.; Pota, V. The SLUGGS survey: Globular clusters and the dark matter content of early-type galaxies. Mon. Not. R. Astron. Soc. 2016, 458, L44–L48. [Google Scholar] [CrossRef]
  80. Hudson, M.J.; Harris, G.L.; Harris, W.E. Dark Matter Halos in Galaxies and Globular Cluster Populations. Astrophys. J. 2014, 787, L5. [Google Scholar] [CrossRef]
  81. Harris, W.E.; Blakeslee, J.P.; Harris, G.L.H. Galactic Dark Matter Halos and Globular Cluster Populations. III. Extension to Extreme Environments. Astrophys. J. 2017, 836, 67. [Google Scholar] [CrossRef]
  82. Harris, W.E.; Morningstar, W.; Gnedin, O.Y.; O’Halloran, H.; Blakeslee, J.P.; Whitmore, B.C.; Côté, P.; Geisler, D.; Peng, E.W.; Bailin, J.; et al. Globular Cluster Systems in Brightest Cluster Galaxies: A Near-universal Luminosity Function? Astrophys. J. 2014, 797, 128. [Google Scholar] [CrossRef]
  83. Nakazawa, K.; Makishima, K.; Fukazawa, Y.; Tamura, T. ASCA Observations of a Near-by Cluster in Antlia. Publ. Astron. Soc. Jpn. 2000, 52, 623–630. [Google Scholar] [CrossRef]
  84. Sun, M.; Voit, G.M.; Donahue, M.; Jones, C.; Forman, W.; Vikhlinin, A. Chandra Studies of the X-Ray Gas Properties of Galaxy Groups. Astrophys. J. 2009, 693, 1142–1172. [Google Scholar] [CrossRef]
  85. Lacerna, I.; Hernández-Toledo, H.M.; Avila-Reese, V.; Abonza-Sane, J.; del Olmo, A. Isolated elliptical galaxies in the local Universe. Astron. Astrophys. 2016, 588, A79. [Google Scholar] [CrossRef]
  86. Kinyumu, M.K.; Kimani, N.; Nyenge, R.; Obonyo, W. Properties of isolated galaxies in the Digital Survey Isolated Galaxies (DSIG) catalogue within a redshift range (0.005 < z < 0.080). Mon. Not. R. Astron. Soc. 2024, 527, 1368–1380. [Google Scholar] [CrossRef]
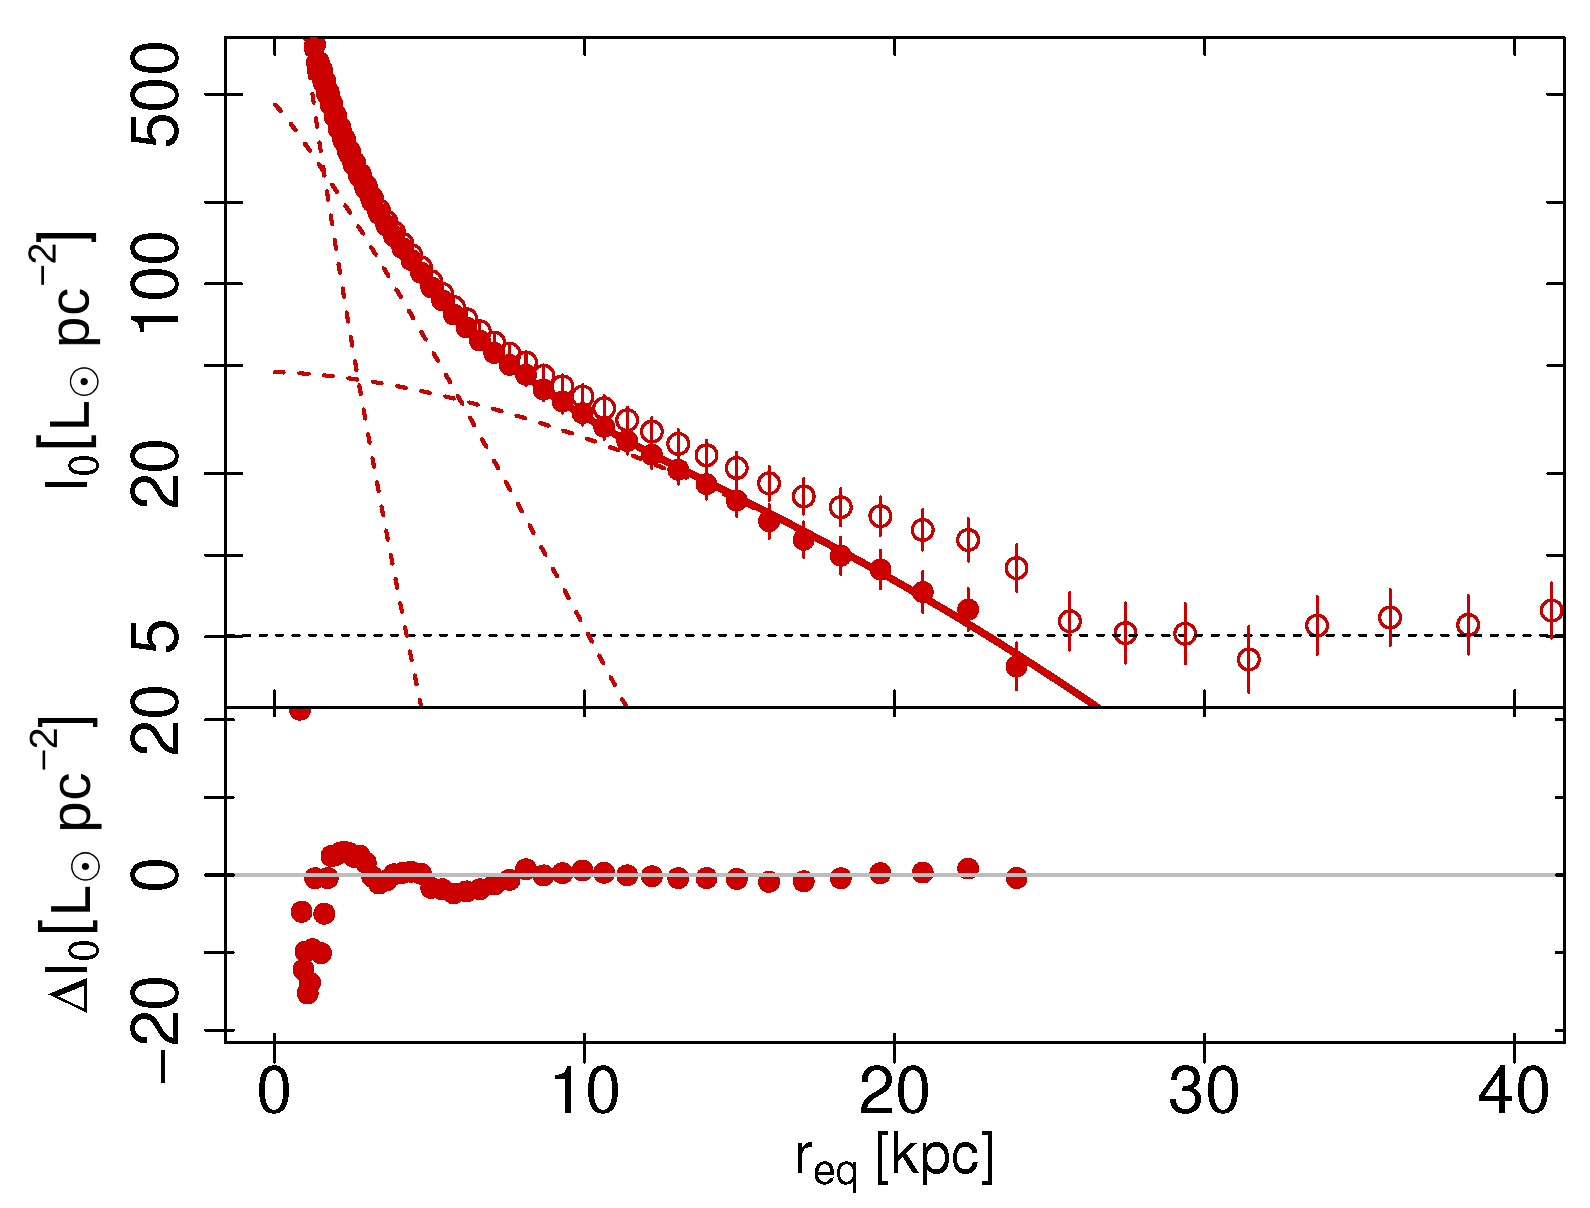
Figure 1. The top panel presents the surface brightness profile of NGC 3268 in the I band, corrected by extinction (open symbols). The horizontal dotted line represents the contamination level. The filled symbols correspond to the profile, once the contamination level is subtracted. Dashed and solid curves show the three Sérsic models and their sum, respectively. The bottom panel represents the fit residuals.
Universe 11 00344 g001
Figure 2. Isophotal parameters (ellipticity ϵ and position angle PA) derived from ELLIPSE fits to NGC 3268’s surface brightness distribution, are all shown as functions of equivalent radius ( r eq ). The panels display, from top to bottom, ϵ and PA, respectively. Vertical grey lines mark the r eq where significant variations in the isophotal parameters occur.
Universe 11 00344 g002
Figure 3. (a) For each spectrum, the blue point represents its number of counts at 5300 Å, normalised by the extension of the extracted region, as a function of the number of counts measured for the local background from the VIMOS photometry in the V filter. The solid line corresponds to a linear function fitted to them. (b) The spectra extracted from three slits in the 2011 mask (green, blue, and red curves), and the sky spectrum fitted from the data (black curve, see the text for further details).
Universe 11 00344 g003
Figure 4. Radial profile of GCs associated with NGC 3268, based on FORS1–VLT (black circles) and MOSAIC–CTIO (grey squares) photometry from Caso et al. [36]. The red solid curve shows a Sérsic law fitted to the profile.
Universe 11 00344 g004
Figure 5. Distribution of virial masses ( M vir ) for dark matter haloes from the MDPL2 simulation, which results from the constraint presented in Section 2.5.2.
Universe 11 00344 g005
Figure 6. Heliocentric V LOS as a function of galactocentric distance for the stellar component of NGC 3268. The filled symbols correspond to spatially rebinned spectra from the two innermost slits, placed on the major axis of the galaxy, while the open symbols represent the measurements from two additional slits, originally centred on point-like sources but aligned with the same direction. The dashed curve corresponds to an empirical function fitted to the rotation curve.
Universe 11 00344 g006
Figure 7. σ LOS as a function of galactocentric distance for the stellar component of NGC 3268. The filled symbols correspond to spatially rebinned spectra from the two innermost slits, placed on the major axis of the galaxy, while the open symbols represent the measurements obtained from stacking slits with similar galactocentric radii.
Universe 11 00344 g007
Figure 8. (a) Stellar population parameters derived using ppxf for the inner 10 arcsec of NGC 3268. (b) Analogue for the left panel, but for galactocentric distances of 17–27 arcsec. In both cases, the E-MILES stellar population models with a Salpeter IMF were adopted as templates. In both panels, the colour gradient represents the weights adopted by ppxf for each stellar population, ranging from dark blue to yellow for increasing values.
Universe 11 00344 g008
Figure 9. The colour map shows the joint probability distribution of the stellar population and GC data for the isotropic case ( β = 0 ), as a function of the NFW parameters: the concentration ( c vir ) and the scale radius ( r s ). The colour gradient, ranging from light yellow to dark blue, indicates increasing joint probability. The side histograms display the marginal distributions for c vir and r s .
Universe 11 00344 g009
Figure 10. V LOS for early-type galaxies as a function of projected distance from NGC 3268, excluding galaxies projected within 10 arcmin of NGC 3258. Circles, triangles, and squares correspond to dwarf, lenticular, and elliptical galaxies, respectively. The dark grey region is bounded by the caustic curves that correspond to the isotropic case ( σ LOS = 270 km s−1 and r vir = 740 kpc), and the light grey one represents the case for β = 0.2 ( σ LOS = 345 km s−1 and r vir = 930 kpc). The side panel shows the histogram of V LOS for the galaxy sample.
Universe 11 00344 g010
Table 1. Best-fit parameters for the three-component Sérsic model of the I band galaxy profile.
I 0 r 0 n
L pc 2 pc
Inner component60,200 ± 13,000 27.4 ± 9.2 0.42 ± 0.03
Intermediate component 180.0 ± 33 3700 ± 340 1.45 ± 0.09
Outer component 103.6 ± 9.5 10,600 ± 1500 1.37 ± 0.14
Table 2. Results from kinematical measurements by means of ppxf.
r gal Δ r gal V LOS σ LOS
(arcsec) (arcsec) (km s−1) (km s−1)
−4.10.7 2654 ± 25 217 ± 5.0
−3.20.7 2658 ± 33 225 ± 5.4
−2.50.5 2670 ± 33 238 ± 5.2
−2.00.5 2675 ± 23 244 ± 5.3
−1.50.5 2672 ± 35 246 ± 5.5
−0.80.5 2702 ± 37 253 ± 5.7
−0.30.5 2750 ± 42 259 ± 6.1
0.20.5 2777 ± 50 260 ± 7.7
0.90.5 2818 ± 43 245 ± 7.9
1.50.5 2843 ± 44 242 ± 8.4
2.00.5 2844 ± 45 239 ± 8.2
2.50.5 2844 ± 40 238 ± 8.2
3.00.5 2829 ± 42 224 ± 8.3
3.60.6 2840 ± 46 222 ± 8.0
4.40.9 2836 ± 49 215 ± 8.2
5.31.0 2846 ± 44 212 ± 8.3
6.31.0 2841 ± 32 208 ± 8.3
7.41.1 2842 ± 32 205 ± 8.4
8.71.2 2823 ± 36 203 ± 8.9
18.02.0 2807 ± 31 198 ± 8.9
20.02.0 2798 ± 29 195 ± 9.1
24.62.3 2790 ± 28 192 ± 10
39.06.0 2816 ± 9.0 195 ± 12
47.54.5 2829 ± 9.7 192 ± 8.8
80.05.0 2832 ± 11 187 ± 20
37.06.0 2768 ± 8.9 199 ± 12
41.05.0 2697 ± 7.7 203 ± 13
61.05.0 2696 ± 9.0 201 ± 15
Disclaimer/Publisher’s Note: The statements, opinions and data contained in all publications are solely those of the individual author(s) and contributor(s) and not of MDPI and/or the editor(s). MDPI and/or the editor(s) disclaim responsibility for any injury to people or property resulting from any ideas, methods, instructions or products referred to in the content.