Abstract
In this paper, we describe QUBIC, an experiment that will observe the polarized microwave sky with a novel approach, which combines the sensitivity of state-of-the-art bolometric detectors with the systematic effects control typical of interferometers. QUBIC’s unique features are the so-called “self-calibration”, a technique that allows us to clean the measured data from instrumental effects, and its spectral imaging power, i.e., the ability to separate the signal into various sub-bands within each frequency band. QUBIC will observe the sky in two main frequency bands: 150 GHz and 220 GHz. A technological demonstrator is currently under testing and will be deployed in Argentina during 2019, while the final instrument is expected to be installed during 2020.
1. Introduction
The Q&U Bolometric Interferometer for Cosmology (QUBIC) is an experiment based on the concept of bolometric interferometry [1] and designed to measure the B-mode polarization anisotropies of the Cosmic Microwave Background (CMB). The QUBIC design combines the sensitivity of Transition Edge Sensors (TES) bolometric detectors with the systematic effects and foreground control provided by its interferometric design.
The control of astrophysical foregrounds, in particular, is a factor of increasing importance in CMB polarization experiments, and QUBIC allows us to disentangle sub-bands in each main frequency band thanks to its spectral imaging capability, which is deeply rooted in the interferometric nature of the instrument.
QUBIC will operate from the ground observing the sky in two main spectral bands centered at 150 and 220 GHz [2] and will be deployed in Argentina, at the Alto Chorrillos site. The team is currently finalizing the laboratory tests of the technical demonstrator, a simplified version of the instrument that will be installed at the site during 2019 and will demonstrate the technical and scientific potential of our approach. The final instrument will be deployed during 2020.
2. The Instrument
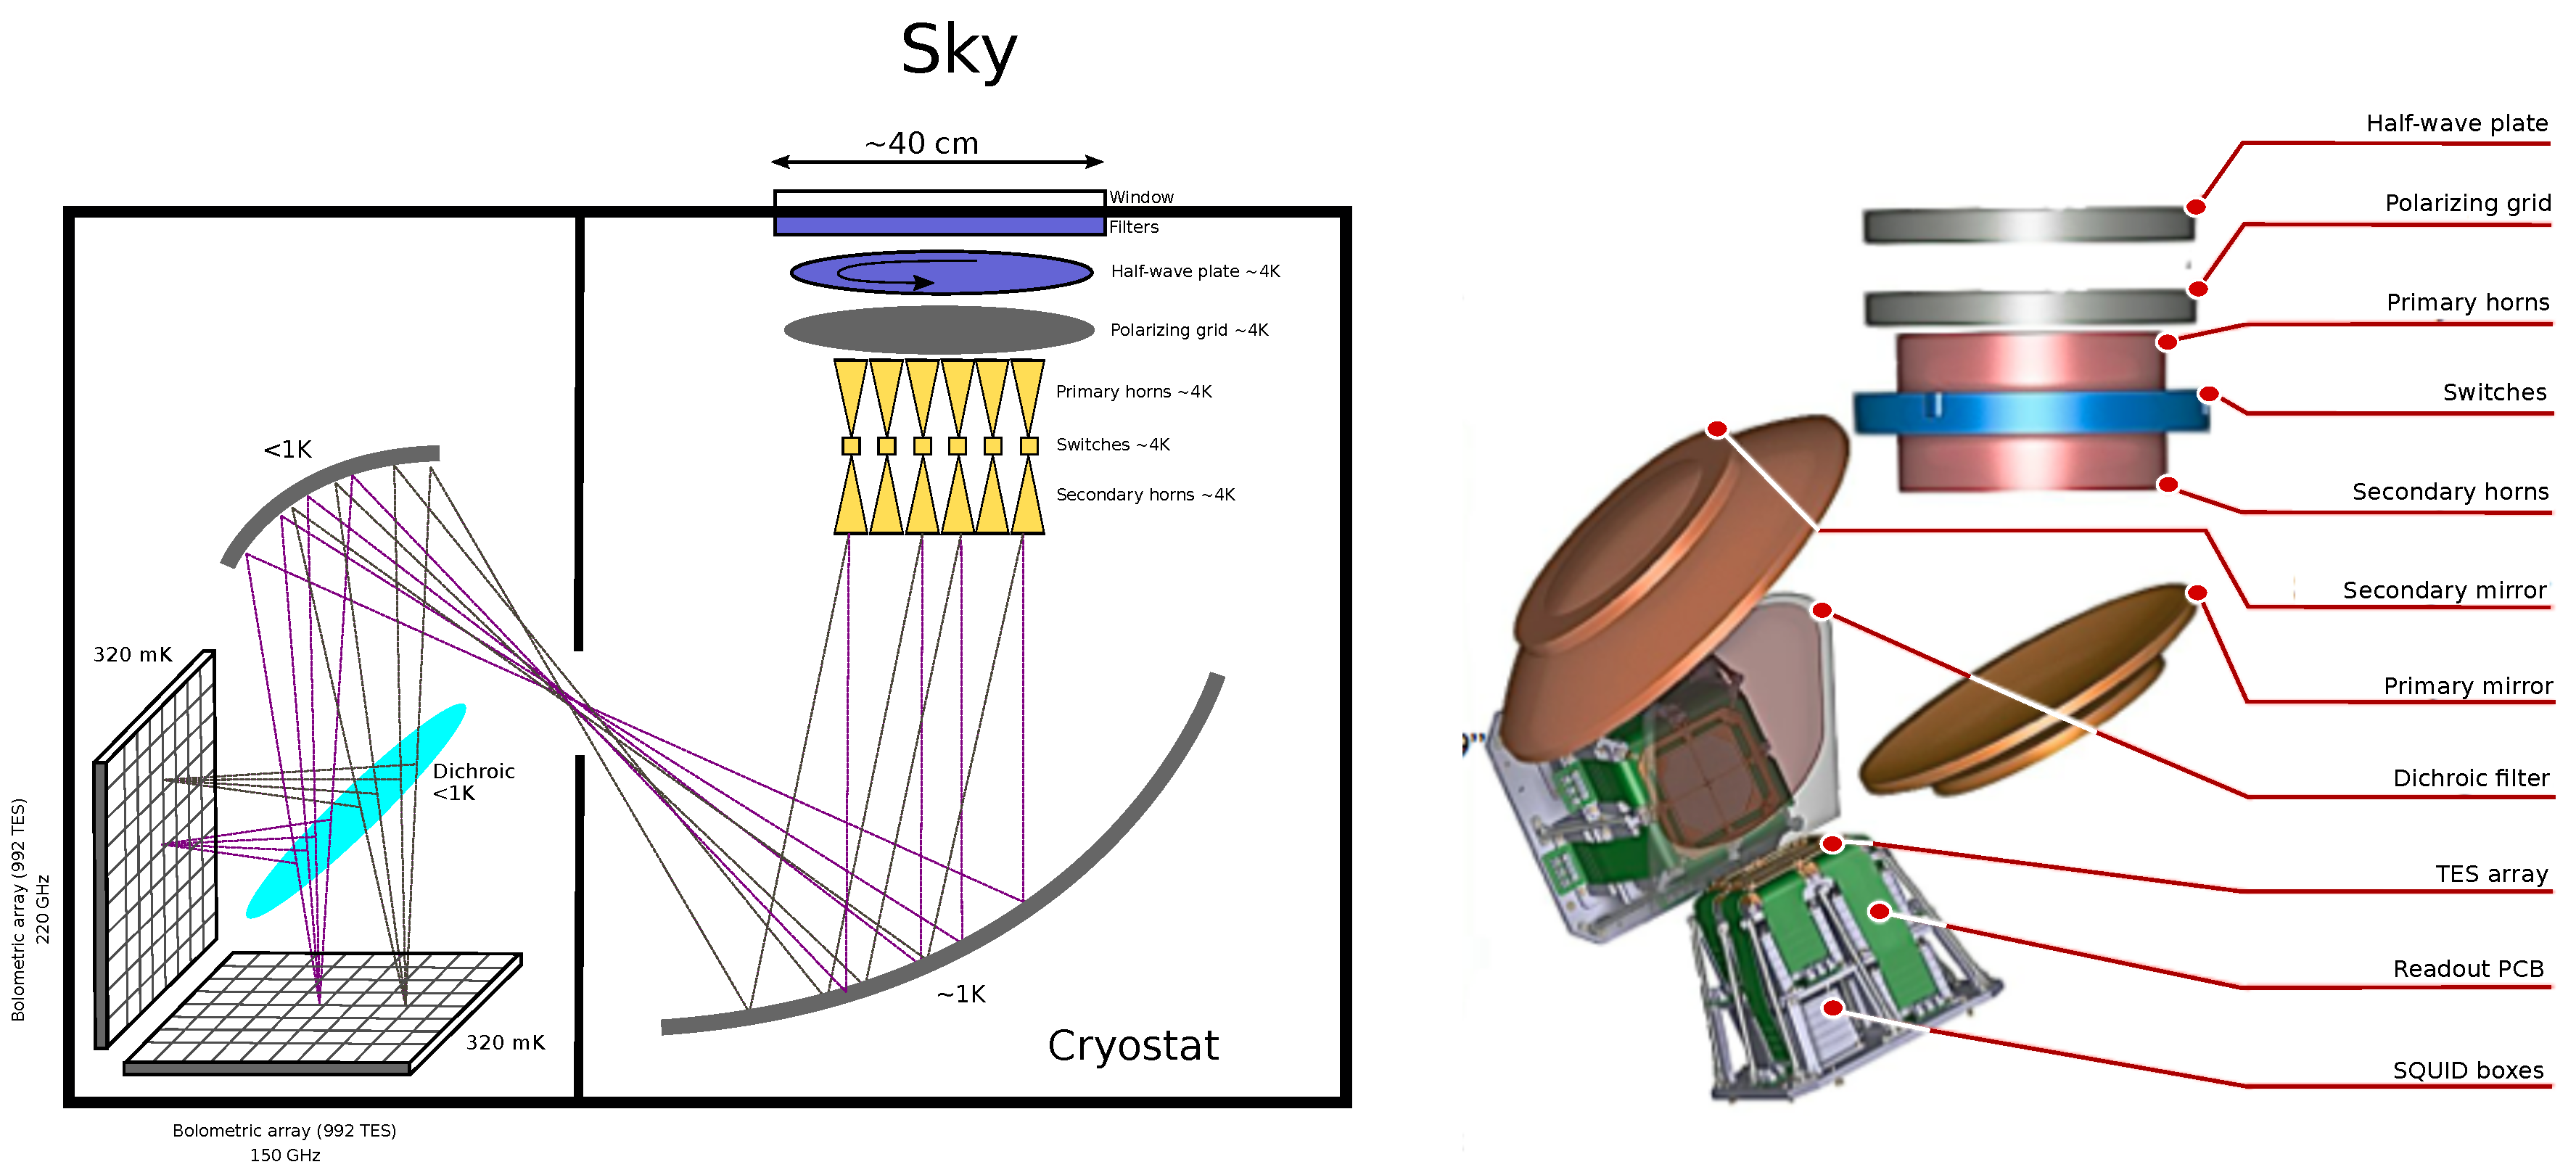
Figure 1 shows a schematics of QUBIC. The signal from the sky enters the cryostat through a High-Density Polyethylene (HDPE) window. Then, a rotating half-wave plate modulates the polarization, and a polarizing grid selects one of the two linear polarization components. An array of 400 back-to-back corrugated horns collects the radiation and re-images it onto a dual-mirror optical combiner that focuses the signal onto two orthogonal TES detectors focal planes. A dichroic filter placed between the optical combiner and the focal planes selects the two frequency bands, centered at 150 GHz and 220 GHz. The right panel of Figure 1 shows a 3D rendering of the inner part of the cryostat.

Figure 1.
(Left) Schematic of the QUBIC instrument. The window aperture is about 40 cm; the cryostat is about 1.41 m in diameter and 1.51 m in height; (right) 3D rendering of the inner part of the cryostat. TES, Transition Edge Sensor.
A key part of the instrument is an array of movable shutters placed between the primary and secondary feed-horn arrays. Each shutter acts as an RF switch (a blade that can slide into a smooth circular waveguide), which is used to exclude particular baselines when the instrument operates in calibrating mode. We call this particular calibration strategy “self-calibration”, which is a key feature of the QUBIC systematic effects control. The interested reader can find the detailed description of all instrument parts in [3] and the theory of self-calibration in [4,5].
3. Measurement, Self-Calibration, and Spectral Imaging
3.1. Signal Model and Synthetic Beam
In QUBIC, the optical combiner focuses the radiation emitted by the secondary horns onto the two focal planes so that the image that forms on the detector arrays is the result of the interference arising from the sum of the fields radiated from each of the 400 apertures.
Therefore, the signal measured at time t by a detector p on the focal plane is:
where is the frequency, is the angle of the half-wave plate at time t, and K is an overall calibration constant that takes into account the efficiency of the optical chain. The three terms in Equation (1) represent the sky signal in intensity and polarization convolved with the so-called synthetic beam.
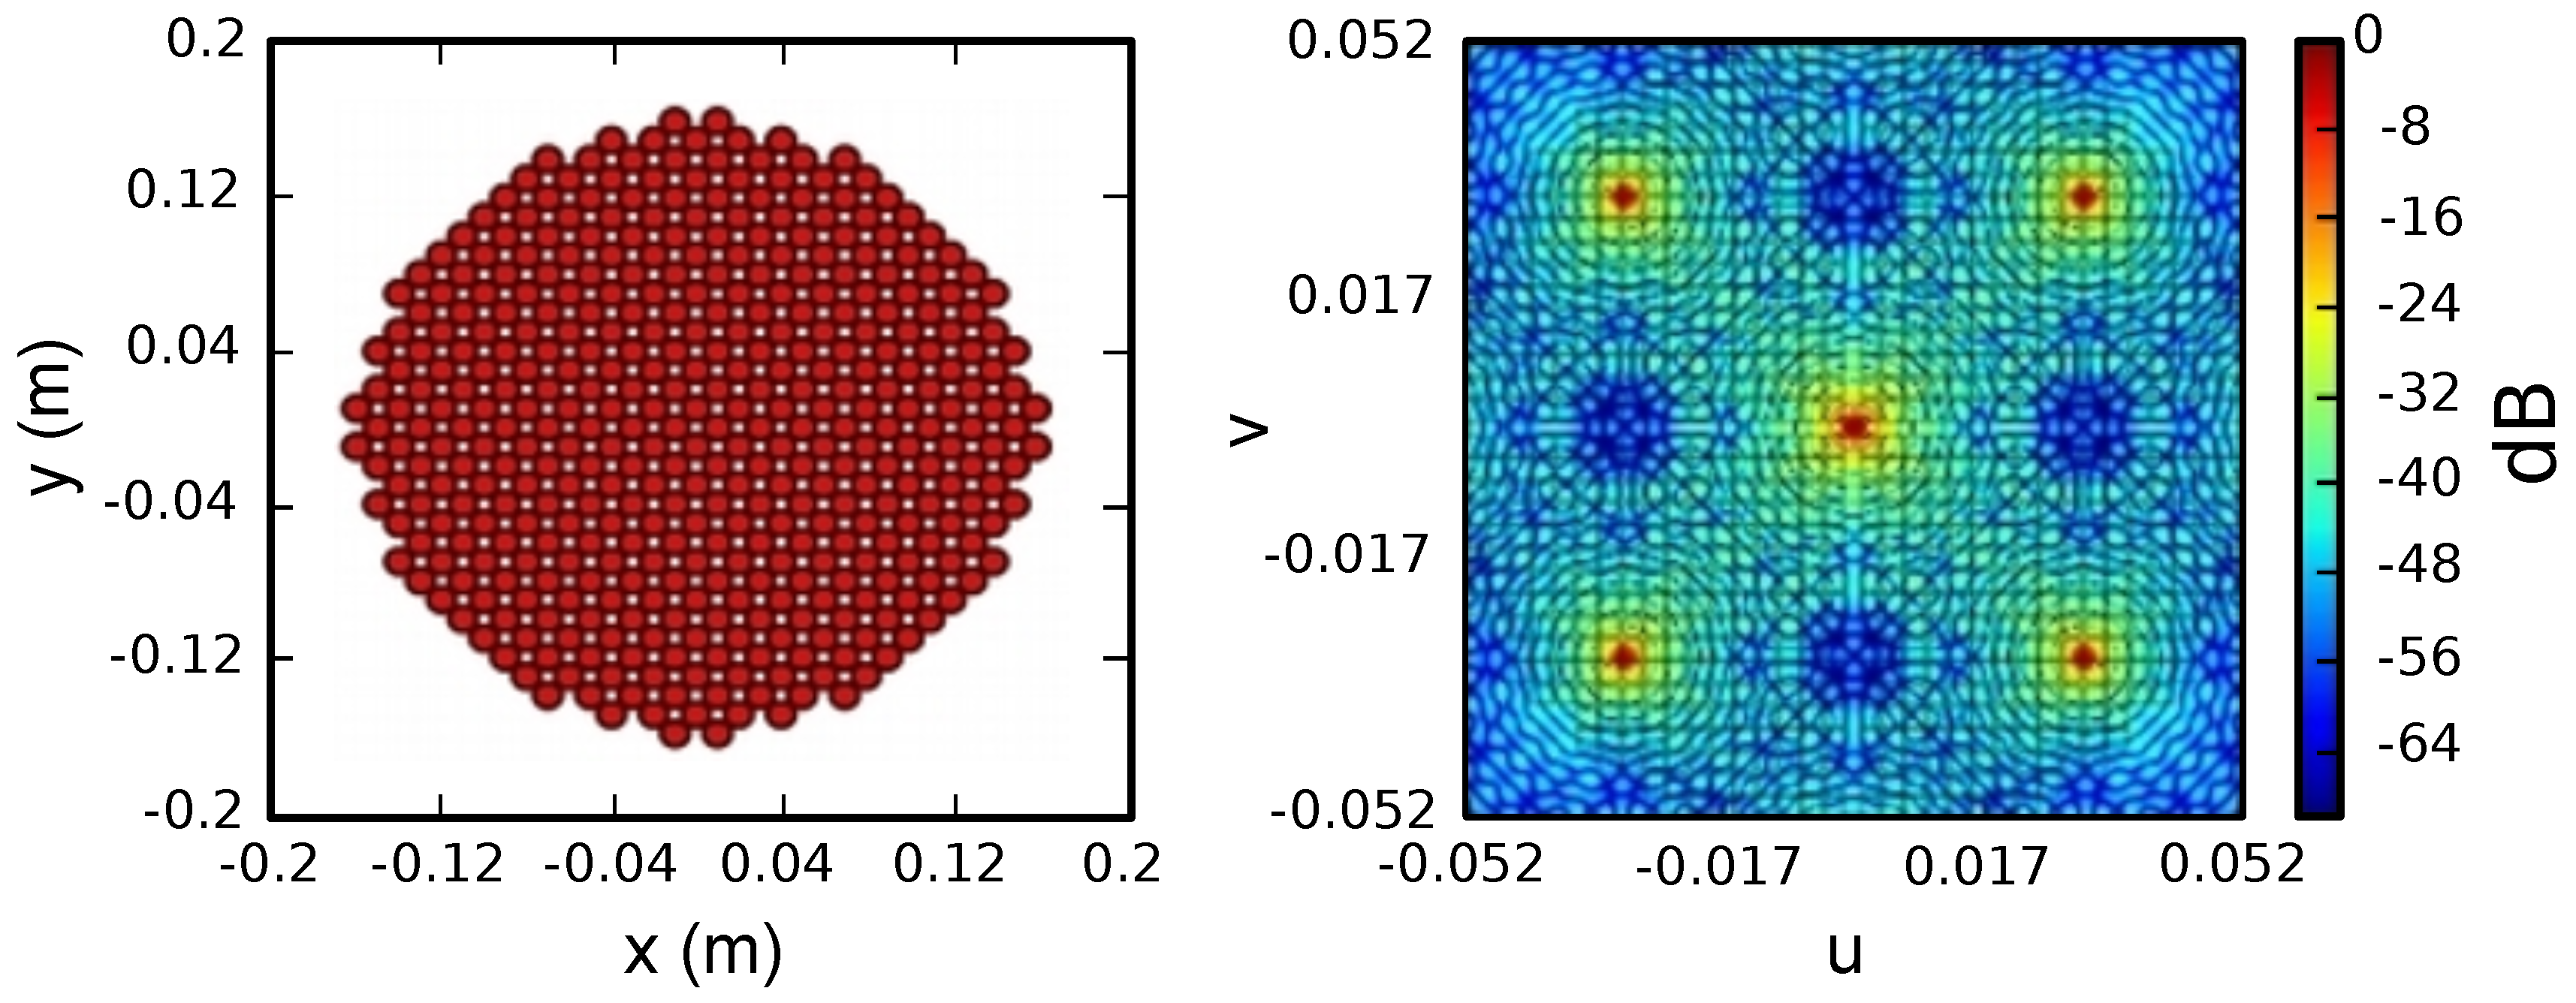
The images in Figure 2 help the reader to understand this concept qualitatively. Imagine that QUBIC observes a point source in the far field located directly along the line-of-sight with all 400 antennas open to the sky. The image formed on each of the focal planes (see the right panel of Figure 2) is an interference pattern formed by peaks and lobes. This pattern works like a beam pattern that convolves the sky signal.

Figure 2.
(Left) QUBIC aperture plane showing all 400 antennas open to the sky; (right) the interference pattern formed on each of the focal planes when the instrument is observing a point source located in the far field vertically along the instrument line-of-sight. The u and v coordinates are defined as: and , where and are the angles on the celestial sphere defining the synthetic beam.
Therefore, if X is the signal from the sky (either in intensity, I, or polarization, ), then the measured signal on the pixel p is . This means that QUBIC data can be analyzed similarly to the data obtained from a normal imager, provided that we build a window function of the synthetic pattern for each pixel.
3.2. Self-Calibration
QUBIC self-calibration is a technique derived from radio-interferometry self-calibration [4]. In QUBIC, self-calibration exploits the redundant interferometric patterns obtained when we selectively close various combinations of the 400 instrument apertures.
To understand the basic concept, see the four panels of Figure 3. The top-right plot shows the interference pattern arising from a horn configuration in which only two horns are open and all the others are closed (top-left). The panels in the bottom row show that if we open any other horn pair with the same baseline, we should ideally obtain exactly the same interference pattern. Furthermore, in [5], Bigot-Sazy et al. showed that the configuration in which only two horns are open is equivalent to the complementary arrangement in which only two horns are closed.
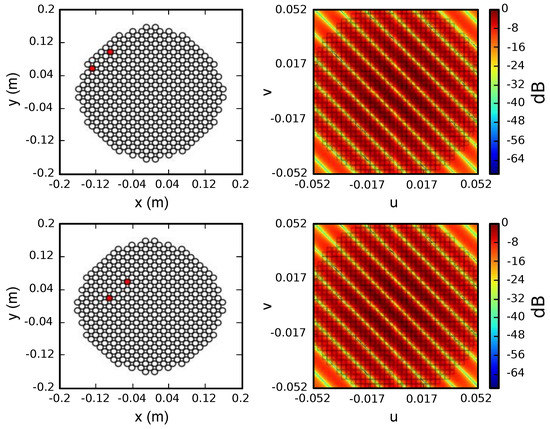
Figure 3.
Schematics of QUBIC self-calibration. The pictures in the two rows show that if we open any pair of horns with a given baseline, then we should ideally measure exactly the same interference pattern.
We can now use the fact that, for an ideal instrument, the interferometric pattern depends only on the baseline. This allows us to characterize the instrumental parameters using an observation mode called self-calibration. During self-calibration, pairs of horns are successively shut while QUBIC observes an artificial partially-polarized source (a microwave synthesizer or a Gunn oscillator) in the far field. Then, we reconstruct the signal measured by each individual pair of horns in the array and compare them.
The point now is that if the source is stable and carefully monitored, then redundant baselines correspond to the same mode of the observed field, so that a different signal between them can only be due to photon noise or instrumental systematic effects. Using a detailed parametric model of the instrument, we can fully recover the instrument parameters through a non-linear inversion process. The updated model of the instrument can then be used to reconstruct the synthetic beam and improve the map-making, thus reducing the leakage from E- to B-modes.
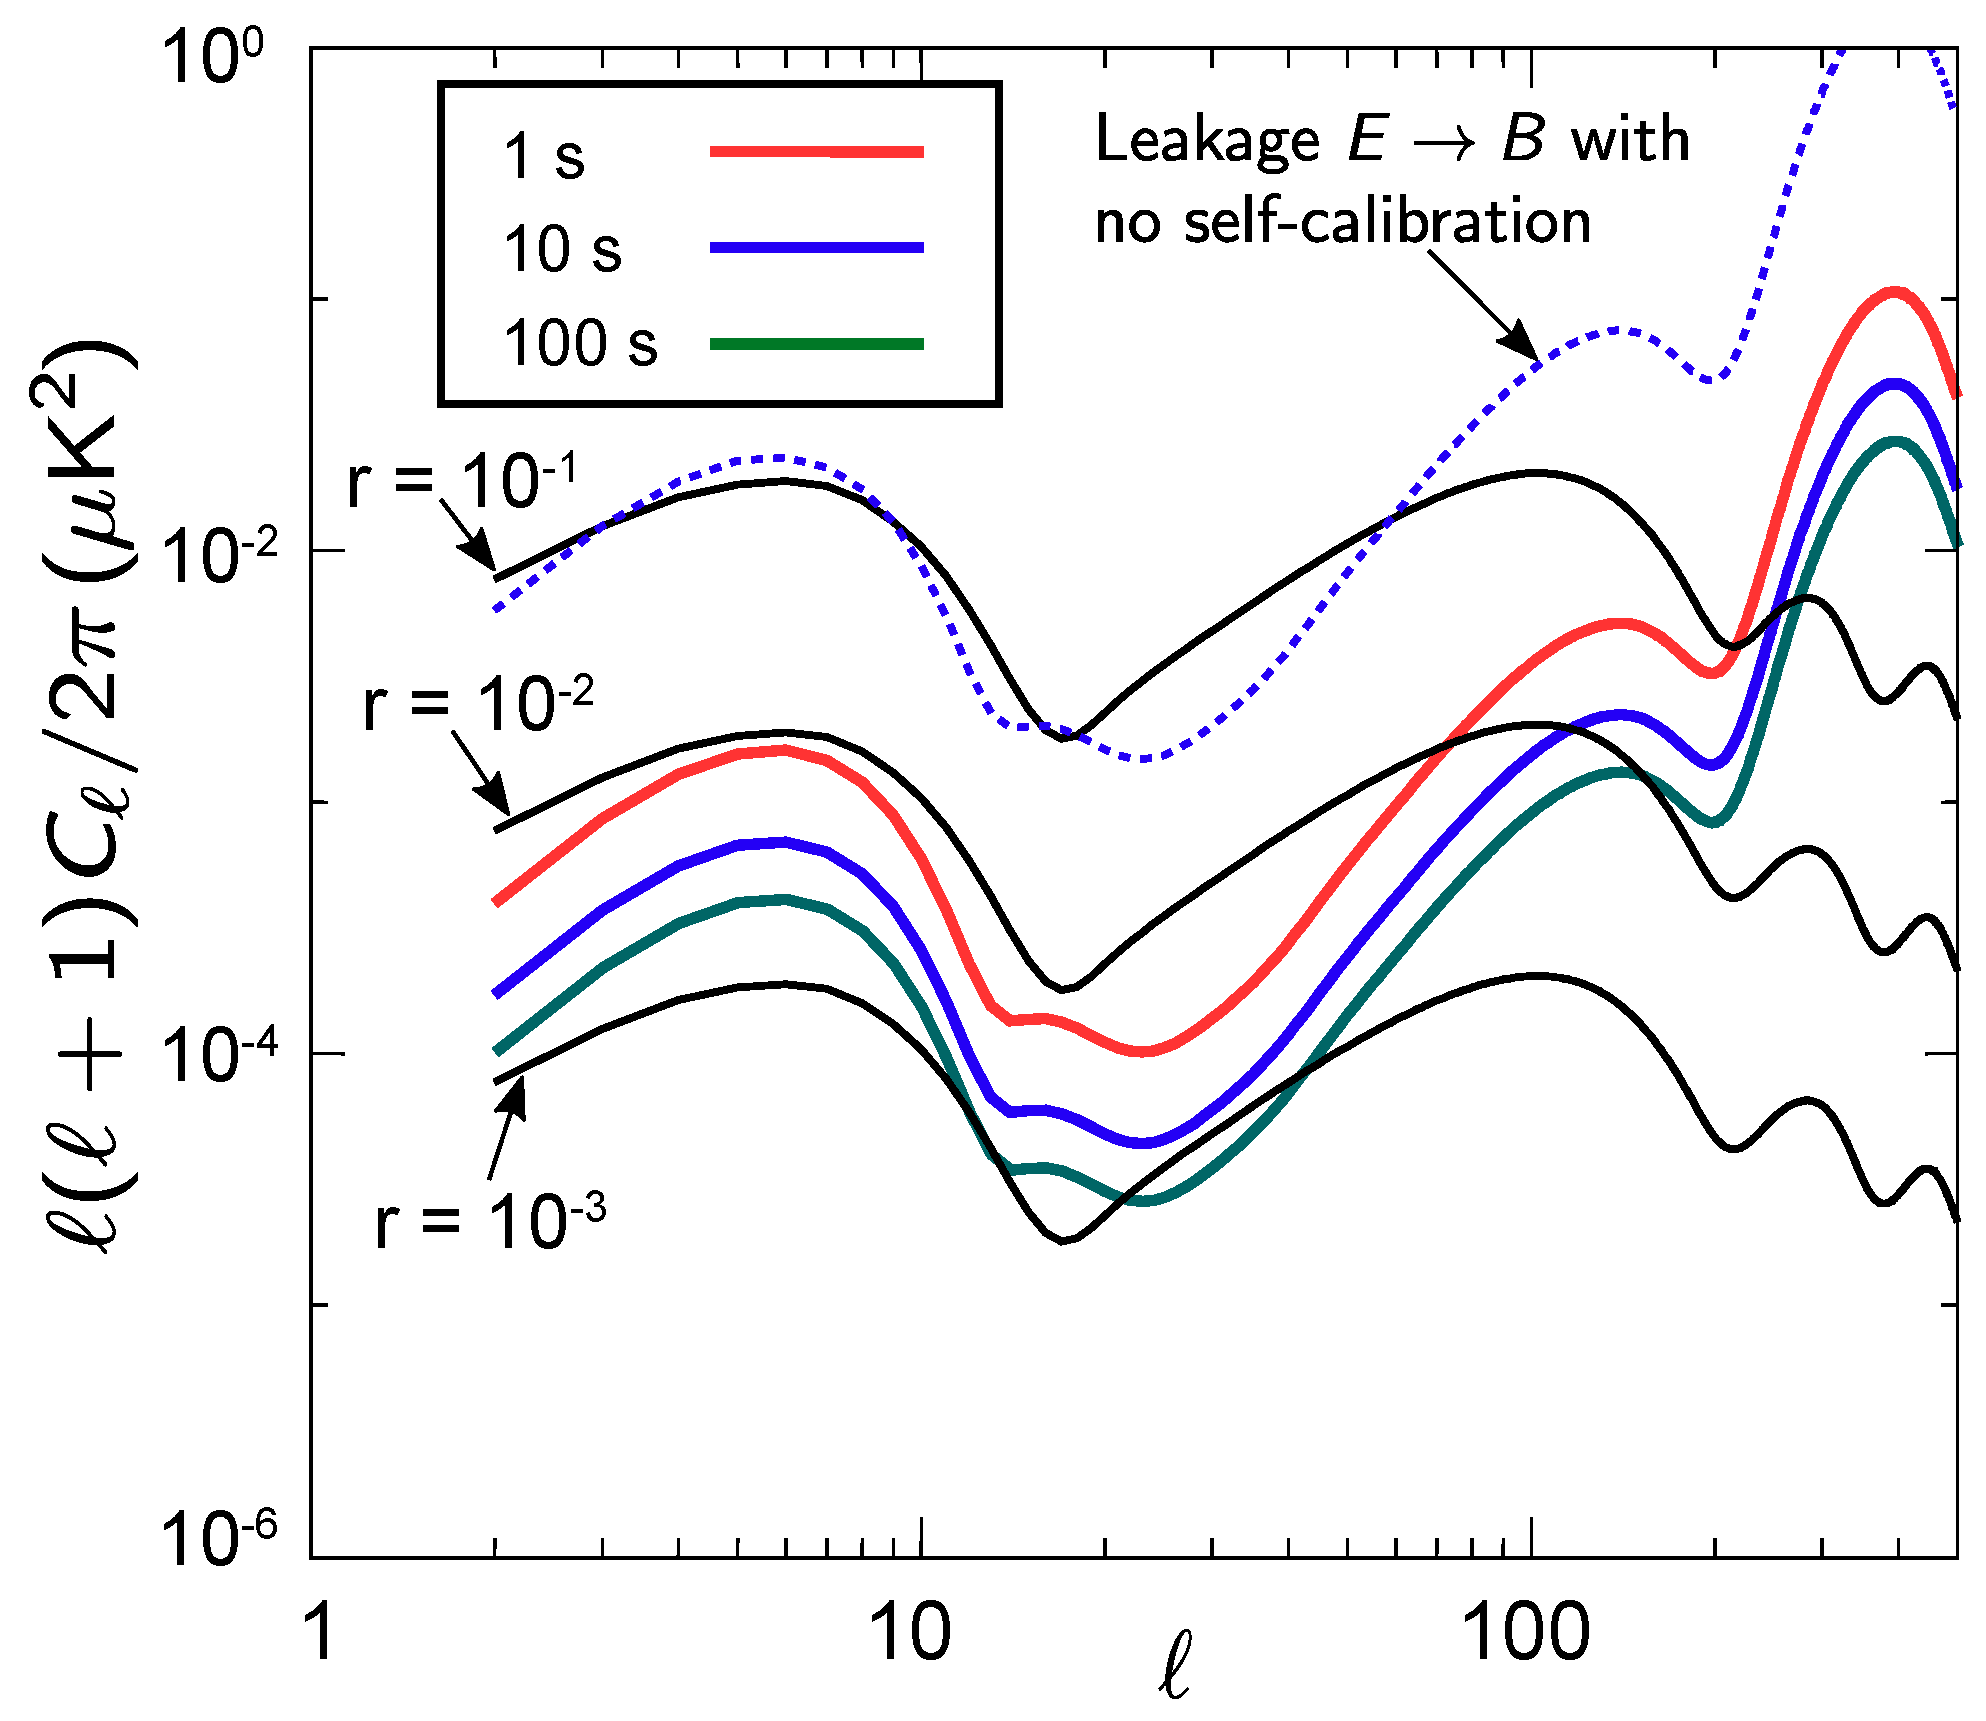
In Figure 4 (adapted from [5]), we show the improvement in the power spectrum estimation with self-calibration according to three schemes. Even with 1 s per baseline (corresponding to a full day dedicated to self-calibration), we can reduce significantly the leakage. This leakage can be further reduced by spending more time in self-calibration. The three B-mode power spectra in black solid lines are the theoretically-expected spectra for three values of the parameter r, i.e., the ratio between the amplitudes of the tensor and scalar fluctuations during inflation.
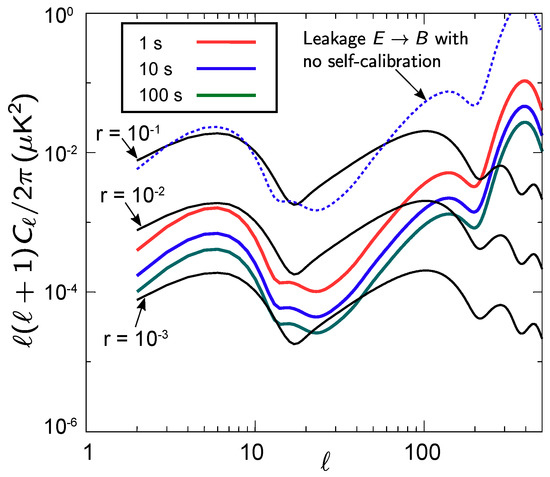
Figure 4.
Improvement in the recovery of the B-mode power spectrum as a function of the time spent in the self-calibration mode. The three curves drawn with black solid lines represent theoretical B-mode power spectra calculated for three different values of the tensor-to-scalar ratio, r.
3.3. Spectral Imaging
The interferometric nature of QUBIC provides us with another unique feature: the possibility to split the data of each main frequency band into sub-bands, thus considerably increasing the leverage in the control of astrophysical foregrounds.
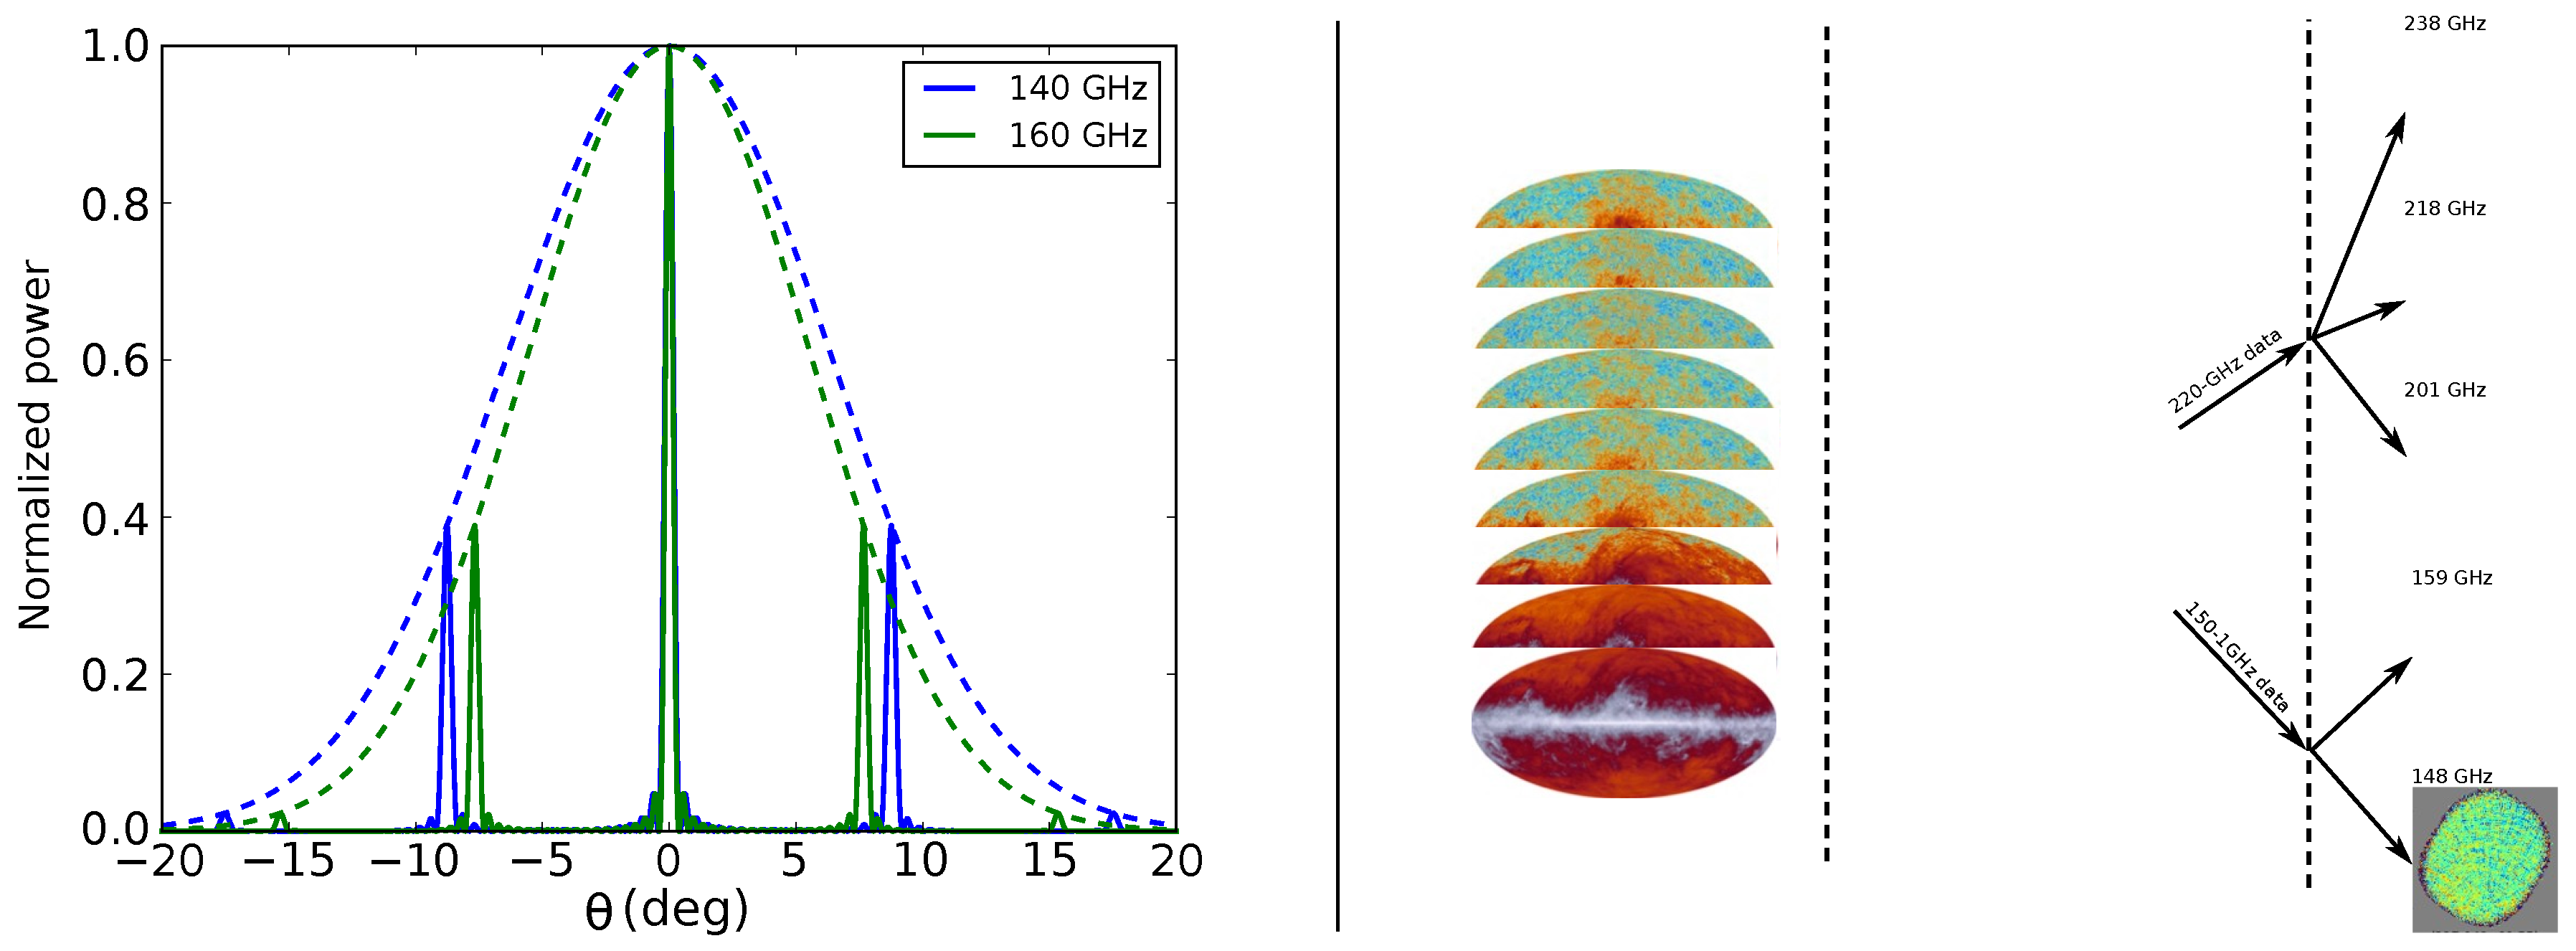
This feature is called “spectral imaging”, and its concept is explained schematically in Figure 5. The left panel of Figure 5 shows the synthetic beams (solid lines) and main feedhorn beams (dashed lines) at two monochromatic frequencies. The figure clearly shows that the sidelobe peaks are well separated, and this sensitivity of the synthetic beam to the frequency can be exploited to separate the various sub-bands in the input data.
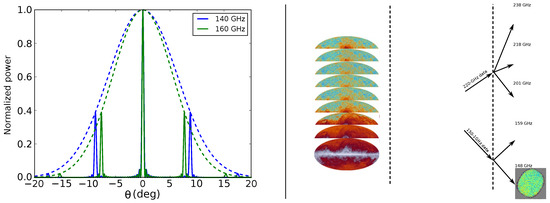
Figure 5.
(Left) Cut of the synthesized beam for two monochromatic signals. The main central peaks superimpose each other, but the first lobes are separated so that they can be resolved. The dashed lines represent the horn beams. (Right) Schematics representing the ability to resolve spectral sub-bands in each of the main QUBIC bands. The instrument first separates the wide-band sky signal into two main bands (150 and 220 GHz), then we further separate each band into sub-bands thanks to the spectral sensitivity of the synthesized beams. The Planck maps shown on the left have the only purpose of explaining the concept.
The right panel of Figure 5 shows schematically the process of sub-band separation in the data analysis. The instrument measures the wide-band sky signal and splits the two main frequency bands of 150 GHz and 220 GHz. Then, the main bands are further separated in the data analysis pipeline by exploiting the frequency sensitivity of the synthetic beam. The interested reader can find further details about the QUBIC data analysis in [1].
As spectral imaging opens new possibilities of foreground control, it also requires component separation codes that have been not been developed yet. We are currently working on a first detailed assessment of its potential and will soon submit a specific paper on spectral imaging.
4. The QUBIC Site
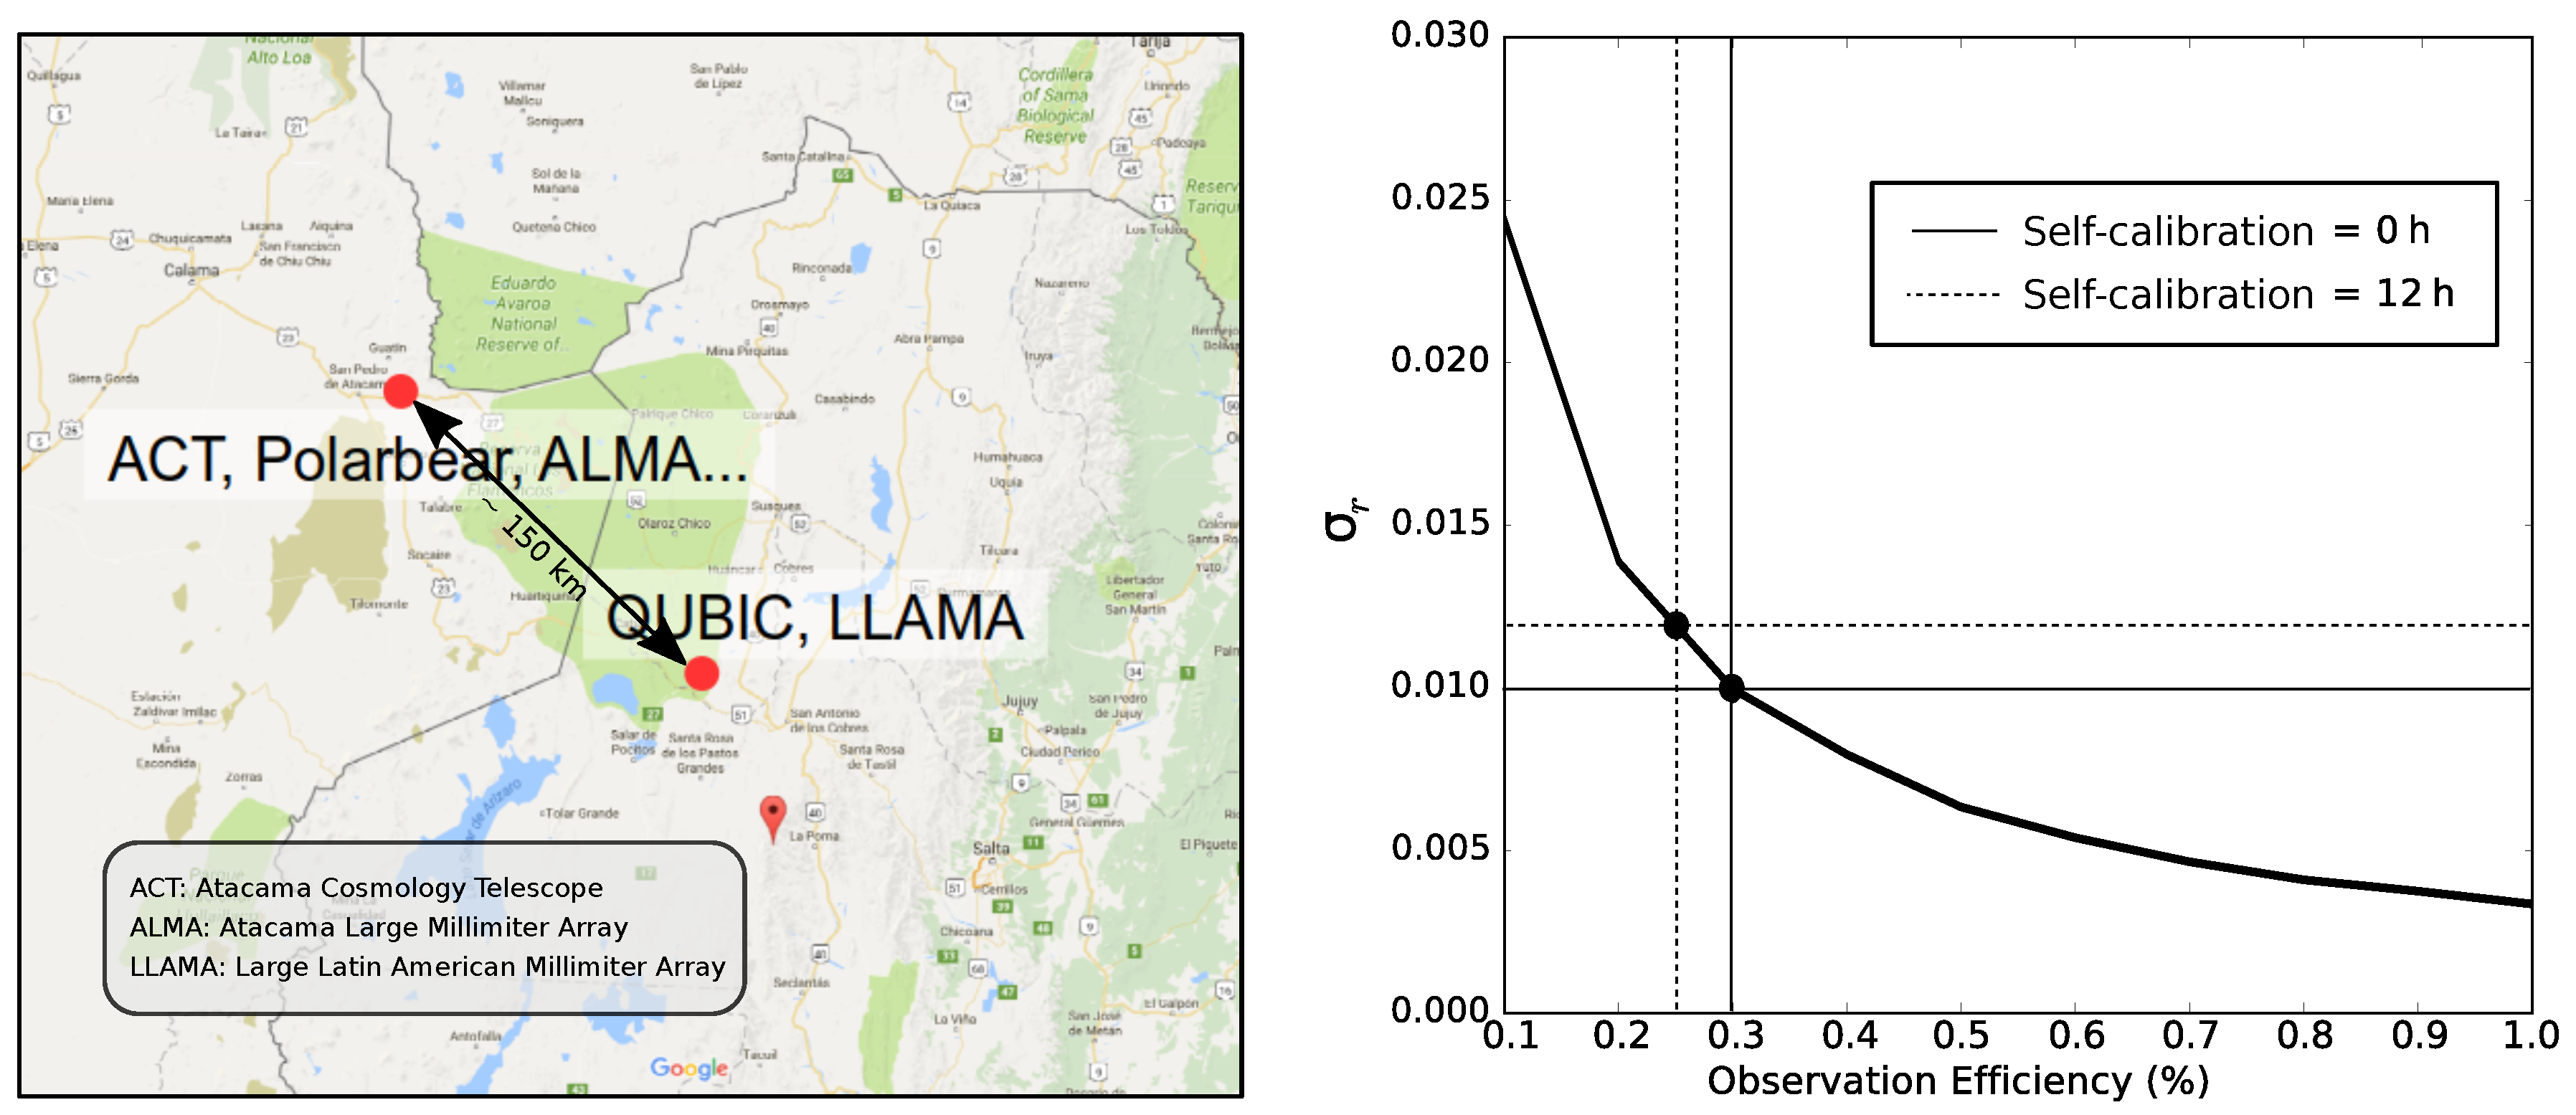
QUBIC will be deployed in Argentina, at the Alto Chorrillos mountain site (241111.7 S; 662840.8 W, altitude of 4869 m a.s.l.) near San Antonio de los Cobres, in the Salta province [6] (see the left panel of Figure 6). The zenith optical depth measured at 210 GHz, , is <0.1 for 50% of the year and <0.2 for 85% of the year. Winds are usually mild ( m/s for 50% of the year), which suggests limited turbulence.
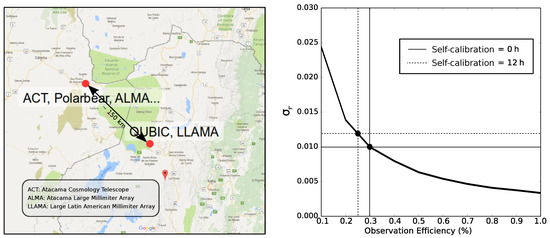
Figure 6.
(Left) Location of the QUBIC site compared to the Atacama plateau; (right) uncertainty in the tensor-to-scalar ratio, r, as a function of the fraction of usable time for two years of operations. The parameter r was computed considering noise-only simulations.
While the statistics for in Alto Chorrillos is worse than that of an Antarctic site (either South Pole or Dome C), the site access and logistics are easier. Our trade off is also justified by the following two facts: (i) the atmospheric emission is not polarized to first order, and (ii) a bolometric interferometer intrinsically rejects large-scale atmospheric gradients, which produce most of the atmospheric noise.
The right panel in Figure 6 (adapted from [3]) shows the overall site quality. In the plot, we see the uncertainty in the tensor-to-scalar ratio, r, as a function of the fraction of usable time for two years of operations. The circled point shows the estimate for the case in which zero or 12 h are spent each day in calibration mode. The plot shows that for a 30% usable time (a conservative estimate for our site), we can reach a sensitivity on r of with two years of operations.
5. Scientific Performance
In Table 1, we provide a summary of the expected sensitivity of QUBIC to the tensor-to-scalar ratio parameter, r, compared with the major ground-based experiments in the same frequency range, either running or expected to be deployed in the near future.

Table 1.
Summary of the main B-mode ground experiments operating in a frequency range similar to QUBIC. The label “fg” or “no fg” corresponds to the assumption on the foregrounds; numbers have been extracted from [7].
From the table, we see that all the experiments compete for a detection of r in the range of 10–10. The expected sensitivity, however, is not the only performance parameter to be considered in ranking various experiments. Susceptibility to systematic effects and foreground control are as important as the white noise sensitivity. In this respect, QUBIC is unique in the landscape of CMB experiments: it is based on a completely different design, is less prone to instrumental systematic effects, and allows a deeper control of foregrounds thanks to its spectral imaging capability.
6. Current Status
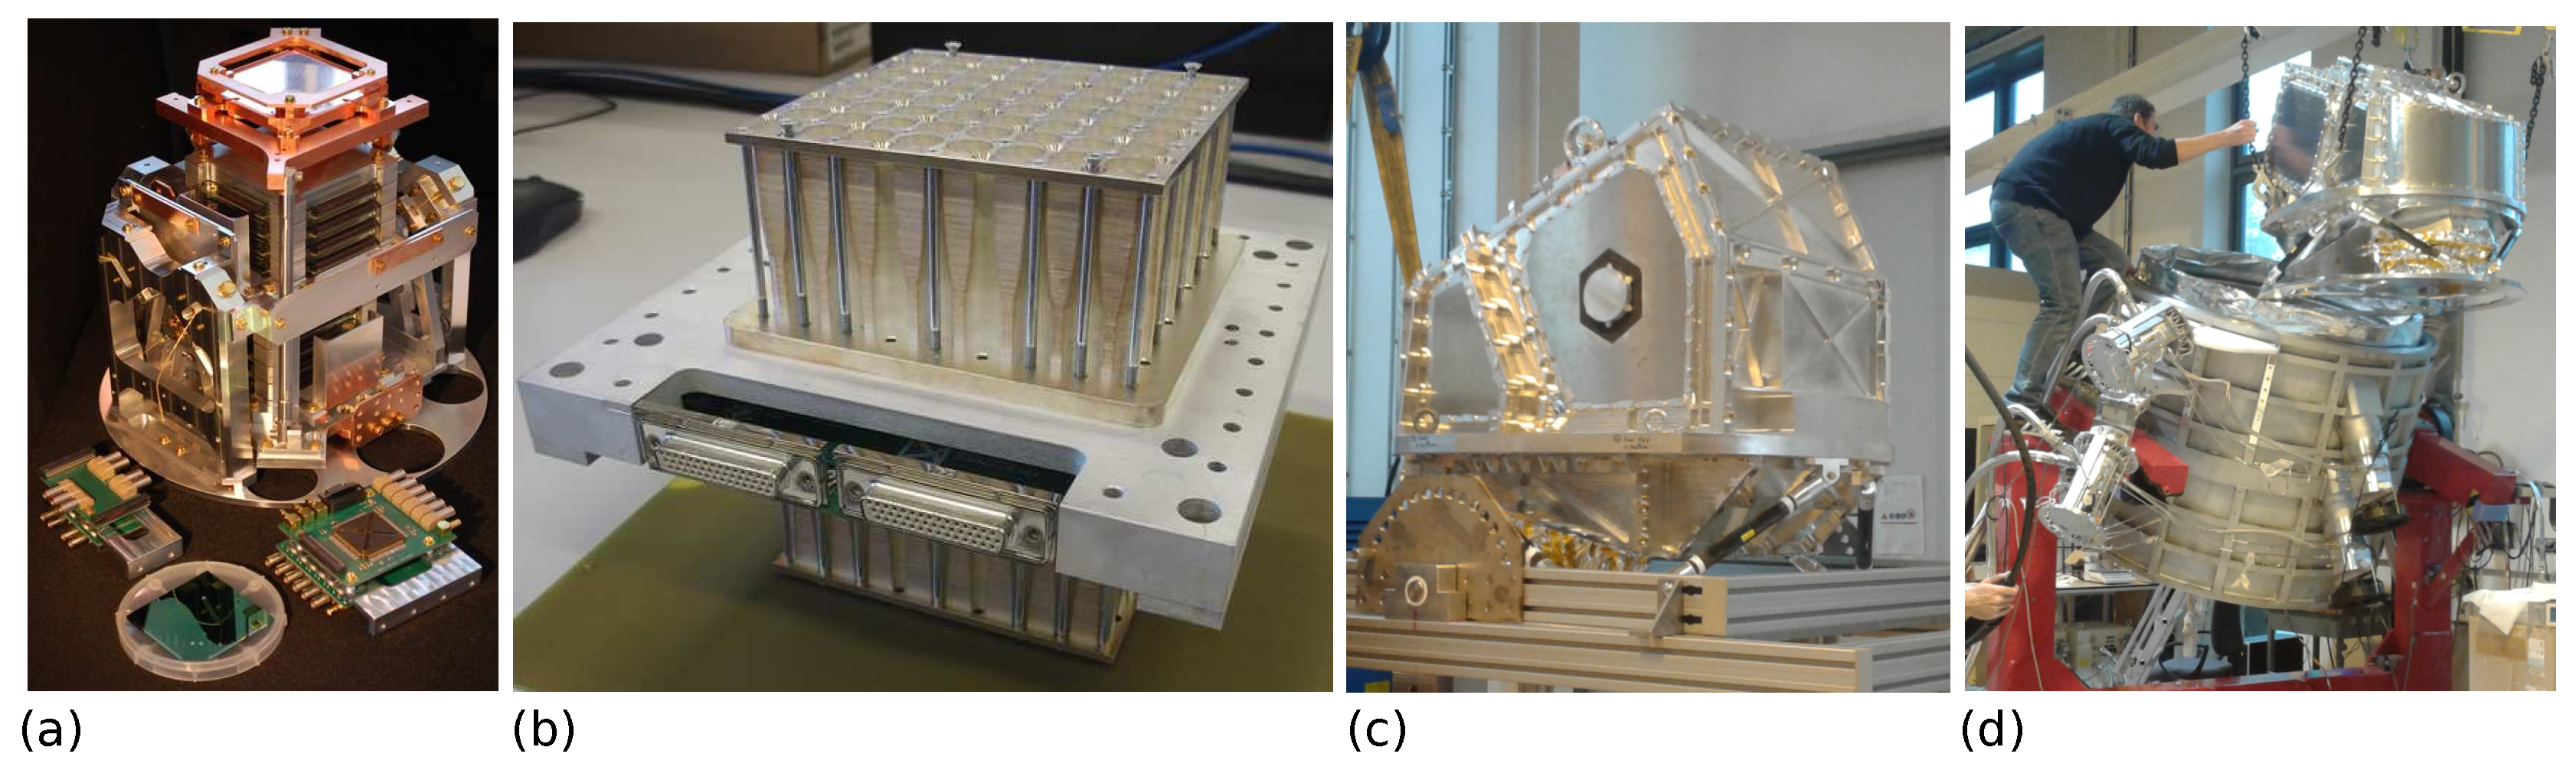
QUBIC is currently in the phase of laboratory calibration of the so-called “Technological Demonstrator” (TD). The TD has a reduced focal plane and horn array with respect to the full instrument. In particular, the TD has only one-quarter of the 150 GHz TES focal plane, an array of horns, 64 switches, and a smaller optical combiner. The TD will not produce science, but it will demonstrate the feasibility of the bolometric interferometry both in the laboratory and in the field.
In Figure 7, we show various QUBIC components. Panel (a) shows one of the two cryogenic detection chains. On top of the chain, one can see the TES focal plane. Panel (b) shows the array of the back-to-back dual-band corrugated horns interfaced with the switch array. Panels (c) and (d) show the 1 K box before and during the integration into the QUBIC cryostat.

Figure 7.
Status of the current QUBIC development. (a) The cryogenic section of the QUBIC detection chain; (b) the TD array of back-to-back horns interfaced with their switches; (c) the integrated 1 K box; (d) integration of the 1 K box in the cryostat shell.
As of November 2018, QUBIC TD is cold and being calibrated at the Laboratoire AstroParticule & Cosmologie (APC) in Paris. This testing phase will end at the beginning of Spring 2019, when QUBIC will be shipped to Argentina and installed at the site for a first-light test foreseen within 2019. In the meantime, in Europe, we will proceed to the fabrication of the final instrument missing parts: the full TES focal planes, the array of horns interfaced with the 400 switches, and the final optical combiner. The deployment of QUBIC final instrument is foreseen to be completed by 2020.
7. Conclusions
QUBIC is a new way to measure the polarization of the CMB. It combines the sensitivity of TES bolometric arrays with the control of systematic effects that are typical of interferometers. This is a key asset in CMB polarization experiments, where high sensitivity must be backed by comparable levels of systematic effects and foreground control. QUBIC responds to this challenge with the key features of self-calibration and spectral imaging, which are possible thanks to the interferometric nature of the instrument. A technological demonstrator is currently being tested in the laboratory and will soon be deployed in Argentina for a first-light test. We forecast the installation of the final instrument and the start of scientific operations during 2020, opening the way for a new generation of instruments in the field of Cosmic Microwave Background polarimetry.
Funding
QUBIC is funded by the following agencies. France: ANR (Agence Nationale de la Recherche) 2012 and 2014, DIM-ACAV (Domaine d’Interet Majeur—Astronomie et Conditions d’Apparition de la Vie), CNRS/IN2P3 (Centre national de la recherche scientifique/Institut national de physique nucléaire et de physique des particules), CNRS/INSU (Centre national de la recherche scientifique/Institut national de sciences de l’univers). Maria Salatino acknowledges the financial support of the UnivEarthS Labex program at Sorbonne Paris Cité (ANR-10-LABX-0023 and ANR-11-IDEX-0005-02. Italy: CNR/PNRA (Consiglio Nazionale delle Ricerche/Programma Nazionale Ricerche in Antartide) until 2016, INFN (Istituto Nazionale di Fisica Nucleare) since 2017. Argentina: Secretaría de Gobierno de Ciencia, Tecnología e Innovación Productiva, Comisión Nacional de Energía Atómica, Consejo Nacional de Investigaciones Científicas y Técnicas. UK: the University of Manchester team acknowledges the support of STFC (Science and Technology Facilities Council) grant ST/L000768/1. Ireland: James Murphy and David Burke acknowledge postgraduate scholarships from the Irish Research Council. Duc Hoang Thuong acknowledges the Vietnamese government for funding his scholarship at APC. Andrew May acknowledges the support of an STFC PhD Studentship.
Conflicts of Interest
The authors declare no conflicts of interest.
References
- Battistelli, E.; Baú, A.; Bennett, D.; Bergé, L.; Bernard, J.P.; de Bernardis, P.; Bounab, A.; Bréelle, É.; Bunn, E.F.; Calvo, M.; et al. QUBIC: The QU bolometric interferometer for cosmology. Astropart. Phys. 2011, 34, 705–716. [Google Scholar] [CrossRef]
- Tartari, A.; Aumont, J.; Banfi, S.; Battaglia, P.; Battistelli, E.S.; Baù, A.; Bélier, B.; Bennett, D.; Bergé, L.; Bernard, J.P.; et al. QUBIC: A Fizeau Interferometer Targeting Primordial B-Modes. J. Low Temp. Phys. 2015, 181. [Google Scholar] [CrossRef]
- Aumont, J.; Banfi, S.; Battaglia, P.; Battistelli, E.S.; Baù, A.; Bélier, B.; Bennett, D.; Bergé, L.; Bernard, J.P.; Bersanelli, M.; et al. QUBIC Technical Design Report. arXiv, 2016; arXiv:1609.04372. [Google Scholar]
- Liu, A.; Tegmark, M.; Morrison, S.; Lutomirski, A.; Zaldarriaga, M. Precision calibration of radio interferometers using redundant baselines. Mon. Not. R. Astron. Soc. 2010, 408, 1029–1050. [Google Scholar] [CrossRef]
- Bigot-Sazy, M.A.; Charlassier, R.; Hamilton, J.; Kaplan, J.; Zahariade, G. Self-calibration: An efficient method to control systematic effects in bolometric interferometry. Astron. Astrophys. 2013, 550, A59. [Google Scholar] [CrossRef]
- De Bernardis, P.; Ade, P.; Amico, G.; Auguste, D.; Aumont, J.; Banfi, S.; Barbarán, G.; Battaglia, P.; Battistelli, E.; Baù, A.; et al. QUBIC: Measuring CMB polarization from Argentina. Bol. Asoc. Argent. Astron. Plata Argent. 2018, 60, 107–114. [Google Scholar]
- Errard, J.; Feeney, S.M.; Peiris, H.V.; Jaffe, A.H. Robust forecasts on fundamental physics from the foreground-obscured, gravitationally-lensed CMB polarization. J. Cosmol. Astropart. Phys. 2016, 2016, 052. [Google Scholar] [CrossRef]
- Hui, H.; Ade, P.A.R.; Ahmed, Z.; Alexander, K.D.; Amiri, M.; Barkats, D.; Benton, S.J.; Bischoff, C.A.; Bock, J.J.; Boenish, H.; et al. BICEP3 focal plane design and detector performance. In Proceedings of the SPIE Proceedings for Millimeter, Submillimeter, and Far-Infrared Detectors and Instrumentation for Astronomy VIII, Edinburgh, UK, 28 June–1 July 2016; Volume 9914, p. 99140T-1. [Google Scholar] [CrossRef]
- Harrington, K.; Marriage, T.; Ali, A.; Appel, J.W.; Bennett, C.L.; Boone, F.; Brewer, M.; Chan, M.; Chuss, D.T.; Colazo, F.; et al. The Cosmology Large Angular Scale Surveyor. In Proceedings of the Millimeter, Submillimeter, and Far-Infrared Detectors and Instrumentation for Astronomy VIII, Edinburgh, UK, 28 June–1 July 2016; Volume 9914, p. 99141K-1. [Google Scholar] [CrossRef]
- Benson, B.A.; Ade, P.A.R.; Ahmed, Z.; Allen, S.W.; Arnold, K.; Austermann, J.E.; Bender, A.N.; Bleem, L.E.; Carlstrom, J.E.; Chang, C.L.; et al. SPT-3G: A next-generation cosmic microwave background polarization experiment on the South Pole telescope. In Proceedings of the Millimeter, Submillimeter, and Far-Infrared Detectors and Instrumentation for Astronomy VII, Montreal, QC, Canada, 22–27 June 2014; Volume 9153, p. 91531P. [Google Scholar] [CrossRef]
- Li, Y.; Austermann, J.E.; Beall, J.A.; Bruno, S.M.; Choi, S.K.; Cothard, N.F.; Crowley, K.T.; Duff, S.M.; Gallardo, P.A.; Henderson, S.W.; et al. Performance of the advanced ACTPol low frequency array. In Proceedings of the Millimeter, Submillimeter, and Far-Infrared Detectors and Instrumentation for Astronomy IX, Austin, TX, USA, 10–15 June 2018; Volume 10708, p. 107080A. [Google Scholar] [CrossRef]
- Keating, B. The POLARBEAR and Simons Array CMB Polarization Experiments. J. Low Temp. Phys. 2016, 184, 805–810. [Google Scholar] [CrossRef]

© 2019 by the authors. Licensee MDPI, Basel, Switzerland. This article is an open access article distributed under the terms and conditions of the Creative Commons Attribution (CC BY) license (http://creativecommons.org/licenses/by/4.0/).