Article

Multi-Wavelength Observations of a Failed Filament Eruption and Associated Hovered Coronal Mass Ejection

1
Key Laboratory of Solar Activity, National Astronomical Observatories, Chinese Academy of Sciences, Chaoyang District, Beijing 100012, China
2
School of Astronomy and Space Science, University of Chinese Academy of Sciences, Beijing 100049, China
*
Author to whom correspondence should be addressed.
Universe 2021, 7(11), 405; https://doi.org/10.3390/universe7110405
Submission received: 31 August 2021 / Revised: 21 October 2021 / Accepted: 24 October 2021 / Published: 28 October 2021
(This article belongs to the Special Issue Solar Coronal Loop Dynamics)

Abstract

:
Failed filament eruption remains mysterious on its initiation, magnetic environment, and erupting and failing mechanisms. We present multi-wavelength observations of a failed filament eruption and its associated hovered coronal mass ejection (hovered-CME) from limb observations of the Ahead of Solar Terrestrial Relations Observatory. On-disk observations from Solar Dynamics Observatory show the expansion of the anchored leg of an S-shaped filament during the pre-eruption phase. The main eruption starts as a sudden ejection of the erupted leg, which is followed by the appearance of EUV brightening in the S-shaped magnetic field. The brightening is spatio-temporal accompanied with hard X-ray emission enhancement, and cancellation of opposite magnetic polarities, which imply possible reconnection. After reaching the maximum displacement, the erupted material drains back to the Sun along the remaining anchored leg. The non-linear force free magnetic field extrapolation shows an S-shaped magnetic field, formed by two magnetic structures, with a strong enveloped magnetic field. The decay index at the possible apex of the filament is 0.8–1.2. Observations indicate that the failed filament eruption is triggered by tether cutting reconnection and is possibly confined by the upper magnetic field. The hovered-CME, resulting from the failed filament eruption and recording as a coronal mass ejection (CME), may cause the overestimation of the CME count.

1. Introduction

Filament eruption includes three types, such as fully, partial, and failed eruption. Failed filament eruption, which is defined as filament, displays an initially eruptive-like acceleration and then drains back toward the Sun after reaching a maximum height, has been reported by [1]. Most studies of failed filament eruption focus on two aspects. One is the triggering mechanisms and the other is the failure reasons.
It is widely believed that filament is a dense and cool plasma material that is hosted by a magnetic flux rope (MFR) or sheared magnetic field. For the MFR hosted filament, kink or torus instability are suggested as the possible trigger for the eruption ([2,3,4,5,6]). Usually, when the twist of the MFR is more than a threshold, the kink instability occurs. The minimum twist, as the minimum threshold, is reported as 2.5 π by analytical and numerical studies ([7,8]). The torus instability occurs when the gradient of the magnetic field with height (i.e., decay index) above the MFR declines at a sufficiently step rate ([5,9]). The decay index can be calculated by n = ( z / B ) B / z , ([5,10]), where B is the magnetic field strength and z is the height above the solar surface. A typical threshold of n for torus instability initiation is suggested to be in a range from 1.5 to 2 ([5,6]). More recently, based on MHD simulations, [11] reported that the threshold of n is 1.4 ± 0.1 when computed at the flux rope’s axis, and 1.1 ± 0.1 when calculated by the height of the top of the prominence. Moreover, as shown in [12], for complex magnetic configuration, decay index is not always a good indicator of a possible eruption.
On the other hand, “tether-cutting” ([13,14]) and “magnetic breakout” ([15,16]) model may be a general trigger for both type of filaments. The “tether-cutting” model suggests that the reconnection, which occurs in the sheared core region below the filament, removes stabilizing restraints (tethers) and leads the filament to erupt. Meanwhile, in the “magnetic breakout” model, the reconnection first occurs between the central arcade of a multipolar magnetic configuration and the outer anti-parallel field overarching the whole region. It removes the overarching magnetic field, which is the main constraint over the filament, and leads to the eruption of the filament. As suggested by [17], the role of “tether-cutting” is bringing the filament in an unstable equilibrium for leading to kink or torus instability. It means that “tether-cutting” is not a trigger by itself for a full eruption event.
For the eruption, MHD simulation figures out that the decay index is an important factor in deciding whether or not a kink instability can eventually develop a successful eruption ([9]). As pointed out by [18] that except the stress from the upper magnetic field, the field strength at low altitude may be another factor in deciding whether or not a full eruption can take place. By studying two failed filament eruptions, [19] suggested that the asymmetry of background coronal fields can provide a relatively stronger confinement for flux rope eruptions than the symmetric background fields do. Ref. [20] suggested that beside the confinement of coronal magnetic field, the energy released in the low corona should be another crucial element effecting a failed or successful filament eruption. Ref. [21] present a morphological study that supports that the magnetic breakout scenario and helical kink instability should be responsible for the observed eruption, which may be confined by the large-scale, closed, overlying magnetic loop arcade. By studying 16 failed filament eruptions, [22] proposed that the rotation motion during the eruption triggered by torus instability may lead to a failed eruption. By studying a limb event, [23] found that the inward magnetic tension force may result in the failed eruption.
Similar with successful filament eruption, the failed filament eruption is also associated with other coronal activities. Ref. [24] reported a failed filament eruption as a driver for vertical oscillations of coronal loops. Ref. [25] found that particles can be accelerated to non-thermal velocities where the interaction between the erupting structure and the overlying magnetic loop during a failed filament eruption. Ref. [26] presented an interesting case study that a filament hovered at the height of the first failed eruption for about 12 h and finally evolved into an eruptive one.
However, as a new phenomenon, which is recently revealed as common activity on solar surface, the nature of the failed filament eruption has not been well understood. On 25 December 2011, a failed filament eruption, associated with a C5.5 flare, occurs. The Solar Terrestrial Relations Observatory Ahead (STEREO-A) spacecraft is 107 ahead of Solar Dynamics Observatory (SDO) on its orbit during the eruption. This event is a limb event for STEREO-A and an on-disk event for SDO. As recorded by the coronal mass ejection (CME) catalog (https://cor1.gsfc.nasa.gov/dailymov/dailymov/GIF/20111225.gif) (accessed on 15 September 2021), it also associates with a CME which record by COR1. It is interesting to note that the CME is later to be found to stop upward moving with the maximum height of 2.6 R . It hovers around 2.6 R and then fades away slowly. So it is not a real coronal mass ejection, and we label it as hovered-CME in this paper. The aim of our present study is to continue the investigation of the dynamics evolution of failed filament eruption and its associated activities, and reveals the nature of it. The paper is arranged as follows: in Section 2, we describe the data and observations; limb event recorded by STEREO-A observation is presented in Section 3, and disk event recorded by other instruments are introduced in Section 4; and summary and conclusions are presented in Section 5.

2. Data and Observations

The Sun Earth Connection Coronal and Heliospheric Investigation (SECCHI) ([27]) is a suite of remote sensing instruments on board STEREO. It consists of an Extreme Ultraviolet Imager (EUVI), two white light coronagraphs (COR1 and COR2) and a Heliospheric Imager (HI). EUVI images the Sun at the chromosphere and low corona in four spectral channels (304, 171, 195, and 284 Å) out to 1.4 R with a pixel-limited spatial resolution of 1.6 arcsec ([28]). We have investigated all of the EUV channels and found that the filament is recorded clearly by 304 Å images and a coronal brightening in front of the filament is observed by a 195 Å wavelength. Therefore, the 304 and 195 Å images are selected to be presented in this paper. The temporal resolution of the 195 and 304 Å images is 5 and 10 min, respectively. The COR1 ([29]) images of the white light corona are from 1.5 to 4 R using an internally occulted coronagraph. Its pixel size is 15 arc-second with a time cadence of 5 min. The COR2 images corona from 2 to 15 R with the pixel size of 14.7 arc-second and a temporal resolution of 30 min.
The Atmospheric Imaging Assembly (AIA) on SDO provides multiple simultaneous high resolution full-disk images of the transition region and corona up to 0.5 R above the solar limb with 1.5 arcsecond spatial resolution and 12 s temporal resolution ([30]). Seven narrow UV/EUV bandpasses centered on specific lines: Fe XVIII (94 Å), Fe VIII, XXI (131 Å), Fe IX (171 Å), Fe XII, XIIV (193 Å), Fe XIV (211 Å), He II (304 Å), and Fe XVI (335 Å). The temperature diagnostics of the EUV emissions cover the range from 6 × 10 4 K to 2 × 10 7 K. In this study, we have investigated all of the UV/EUV channels with particular emphasis on 193, and 171 Å. Both bandpasses are sensitive to relatively cool coronal plasma. Moreover, the SDO/AIA 193 Å bandpass covers the similar temperature range with 195 Å, which is selected to provide the limb observation. The SDO/AIA 94 and 131 Å bandpass are sensitive to the high temperature wavelength (peak temperature response of about 6MK and 11 MK in flaring regions, respectively). In the present event, no evident hot-channel structure is observed. So, we provide an animation with 304, 171, 193 and 131 Å images to let readers to have an impression of dynamical evolution recorded in both cool and hot channels, but only emphasis on 171 and 193 Å in the text. In order to present features with a wide range of brightness regimes in one AIA image more clearly, an image analysis, which is named as Multi-scale Gaussian Normalization method (MGN method) ([31]), is used to process the AIA image. The magnetic environment of the host active region is provided by a Helioseismic and Magnetic Imager (HMI) on board SDO. We use the data cube of the Space-Weather HMI Active Region Patches (SHARPs) ([32]).
The Reuven Ramaty High Energy Solar Spectroscopic (RHESSI) provides the imaging spectroscopy in X-ray, with ∼2 arcsec angular resolution, time resolution down to tens of ms, and ∼1 keV energy resolution ([33]). We analyzed the X-ray spectrum by means of imaging spectroscopy with the Object Spectral Executive (OSPEX) ([34,35]).

3. Solar Limb Event Observed by STEREO-A

3.1. Filament Eruption in EUVI

A sequence of selected 304 Å direct (the first and third row) and 195 Å base-difference (the second and fourth row) images in Figure 1 show the evolution of the failed filament eruption. The right-bottom panel shows the height-time (red stars) and velocity-time (black stars) scatter plot, respectively. Both are deduced from the top position of the filament, which is indicated by a white arrow in the 304 Å image.
As shown in Figure 1a, at the beginning of 08:46 UT, the host region can be identified as a small brightening area on the east limb. The image recorded on 08:56 UT by 304 Å clearly shows that the filament is erupting, with one leg disconnected from the solar surface. The gradual expansion of the anchored leg can be found by comparison with Figure 1b,c. At 09:16 UT, the visible erupted filament reaches the observational maximum height of 4.8 × 10 5 km, with the maximum speed of about 400 km s 1 . From this snapshot, it cannot determine whether the filament plasma moves outside the field of view (FOV) of EUVI or not. Thus, the maximum height and velocity, deduced by EUVI observations, are the lower limit. After that, the filament material drains back to the Sun rapidly with the speed of about 400 km s 1 (Figure 1p). Furthermore, then it hovers around the height of 2.2 × 10 5 km for more than ten minutes and channels to the anchored leg with the speed of about 180 km s 1 at last. The maximum accelerated velocity deduced from the velocity-time scatter plot is about 1 km s 2 , which is about three times greater than the solar gravitational constant ( g = 0.273 km s 2 ). This suggests that the eruption failed, possible due to an inward magnetic tension force.
Figure 1g is a direct image of 195 Å. It shows that the filament is not recorded by 195 Å wavelength. As shown in Figure 1f, associated with the filament activities, the coronal disturbance, which represents the weak coronal brightening in front of the erupted filament and EUV dimming in the host region, appears in 195 Å. For the 5 min temporal resolution, these features are only recorded by two 195 Å images and move out of the EUVI FOV before 09:05 UT. The positions of the leading edge of the coronal disturbance, as indicated by black arrow in Figure 1f, are indicated by red triangles in Figure 1p.

3.2. Hovered-CME in COR1

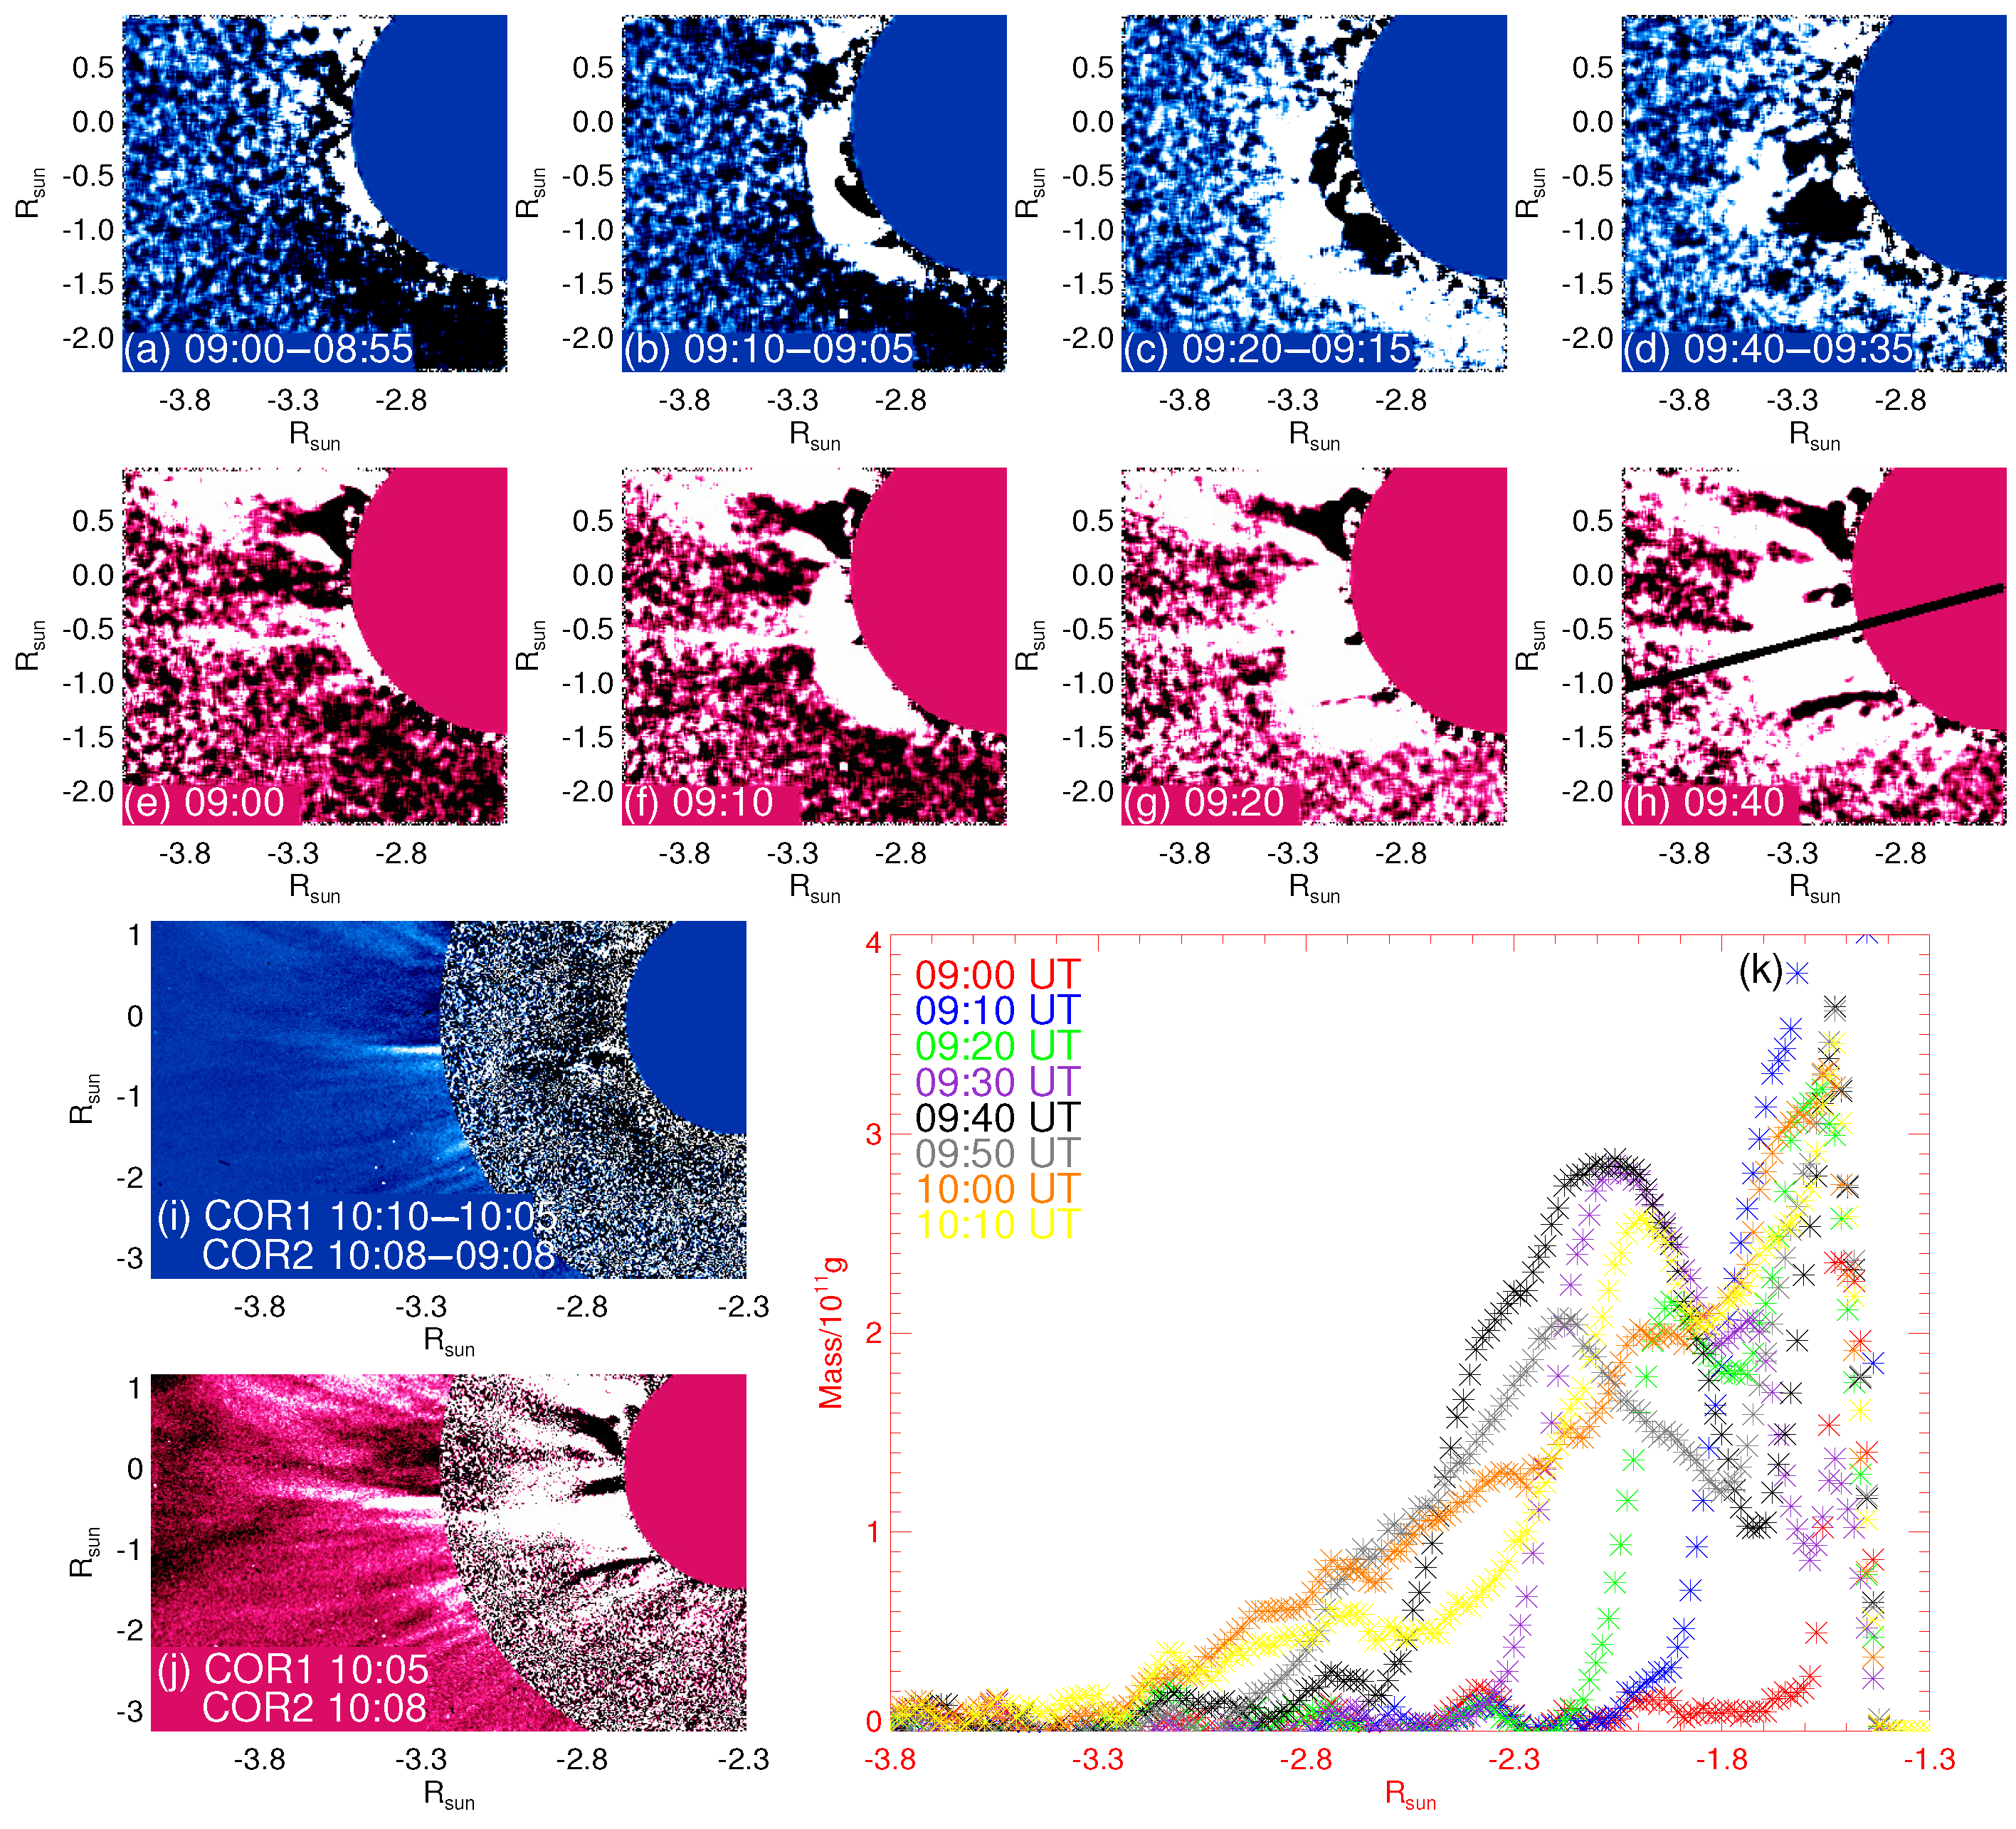
The dynamic evolution of hovered-CME is shown in Figure 2. The first and third row is a running difference brightening image. The second and forth row is the mass distribution. The unit of both axes is solar radius from the solar center. Note the change in the FOV between the top two rows and the bottom two rows. The bottom two rows are the composite image of COR1 and COR2. The hovered-CME first appears in the STEREO-A/COR1 as a small fan-shaped intensity enhancement at 09:00 UT. It expands at first with the velocity of about 400 km s 1 . Around 09:20 UT, the front limb of the fan shape arranges in a crisscross pattern. Finally, it evolves into a bunched shape, with the angular width of about 48 , and reaches its maximum height of about 2.6 R around 09:40 UT. Figure 2c,d,g,h show that the outward propagation occurs at a local part around the black line in Figure 2h during the later stage of the hovered-CME evolution. No evident brightening is presented in the running difference brightening image, which obtained between 10:10 UT and 10:05 UT, as shown in Figure 2i. It means that the hovered-CME does not propagate from then on. While Figure 2j shows that the heated coronal material still gathered there around the maximum height.
Figure 2k shows the mass profile along the black line in Figure 2h at different times. The leading edge of the hovered-CME is presented by the peak, which is far from the solar center. It shows that the leading edge of mass enhancement moves outward from 09:00 UT to 09:40 UT. After 09:40 UT, the leading edge of mass enhancement shrinks obviously with the similar maximum value. Both the running difference brightening image and mass distribution suggest that it is not a real CME, because the heated coronal material hovers around the maximum height and does not eject into the interplanetary. So, we label it as hovered-CME, which is defined as a CME that displays an initially eruptive-like acceleration and then hovers around the maximum height. In this event, it associates with a failed filament eruption and a C 5.5 flare.
The height–time (red diamond signs) and velocity–time (black diamond signs) scatter plot of the hovered-CME is shown in Figure 1p. By comparing the position of the erupted filament and hovered-CME, it is easy to find that the hovered-CME appears ahead of the filament of 0.2 R at first, and moves a little bit fast than that of filament. When the filament drops down quickly, the hovered-CME moves very slowly with the speed of about several tens kilometer per second. The escape velocity on the solar surface and around the height of 2.6 R is about 618 and 380 km s 1 . The maximum velocity of the hovered-CME is about 400 km s 1 when it first appears in the FOV of COR1. The velocity of the hovered-CME reaching the maximum height is about 90 km s 1 . Both are less than that of the escaped velocity at local position. This means that the hovered-CME cannot move out of the Sun without another driving force, since the filament drains back to the solar surface.

4. Solar Disk Observations

4.1. Failed Filament Eruption Observed by SDO

From solar disk observation, the filament eruption occurs at the heliographic location S21W20. Figure 3a is a photospheric magnetic field, with black for negative polarities and white for positive polarities. It shows that the host active region is a small active region with a area of 30 msh (millionths of the solar hemisphere), and the unsigned magnetic flux of about 4.0 × 10 21 Mx. However, the magnetic topology of this region is complex with negative and positive polarities crowed into a decay negative polarity area. In this figure, the blue contour outlines the filament profile. The filament profile shows clearly that its left foot point roots in the positive polarity and right foot point roots in the negative polarity. It is a small active region filament, with the length of 3.6 × 10 4 km. Figure 3b shows the 171 Å filtergram before eruptions, with the dotted white line indicated the limb as viewed from STEREO-A. The most distinctive feature is the S-shaped filament (positive magnetic helicity) upon the polarity inverse line (PIL). The green box in both images outlines the initial EUV brightening and its corresponding magnetic field. Figure 3c,d shows the core region of the S-shaped filament (outlined by red box in Figure 3b) of AIA 304 and 193 Å image recorded around 07:30 UT, about 75 min before Figure 3b. In both images, the S-shaped filament in Figure 3b is combined by two J-shaped filament threads. Green arrow indicates the gap between them. As shown by the animation, the visible S-shaped filament threads forms around 07:45 UT and finally evolves as the thin S-shaped filament as we shown in Figure 3b.
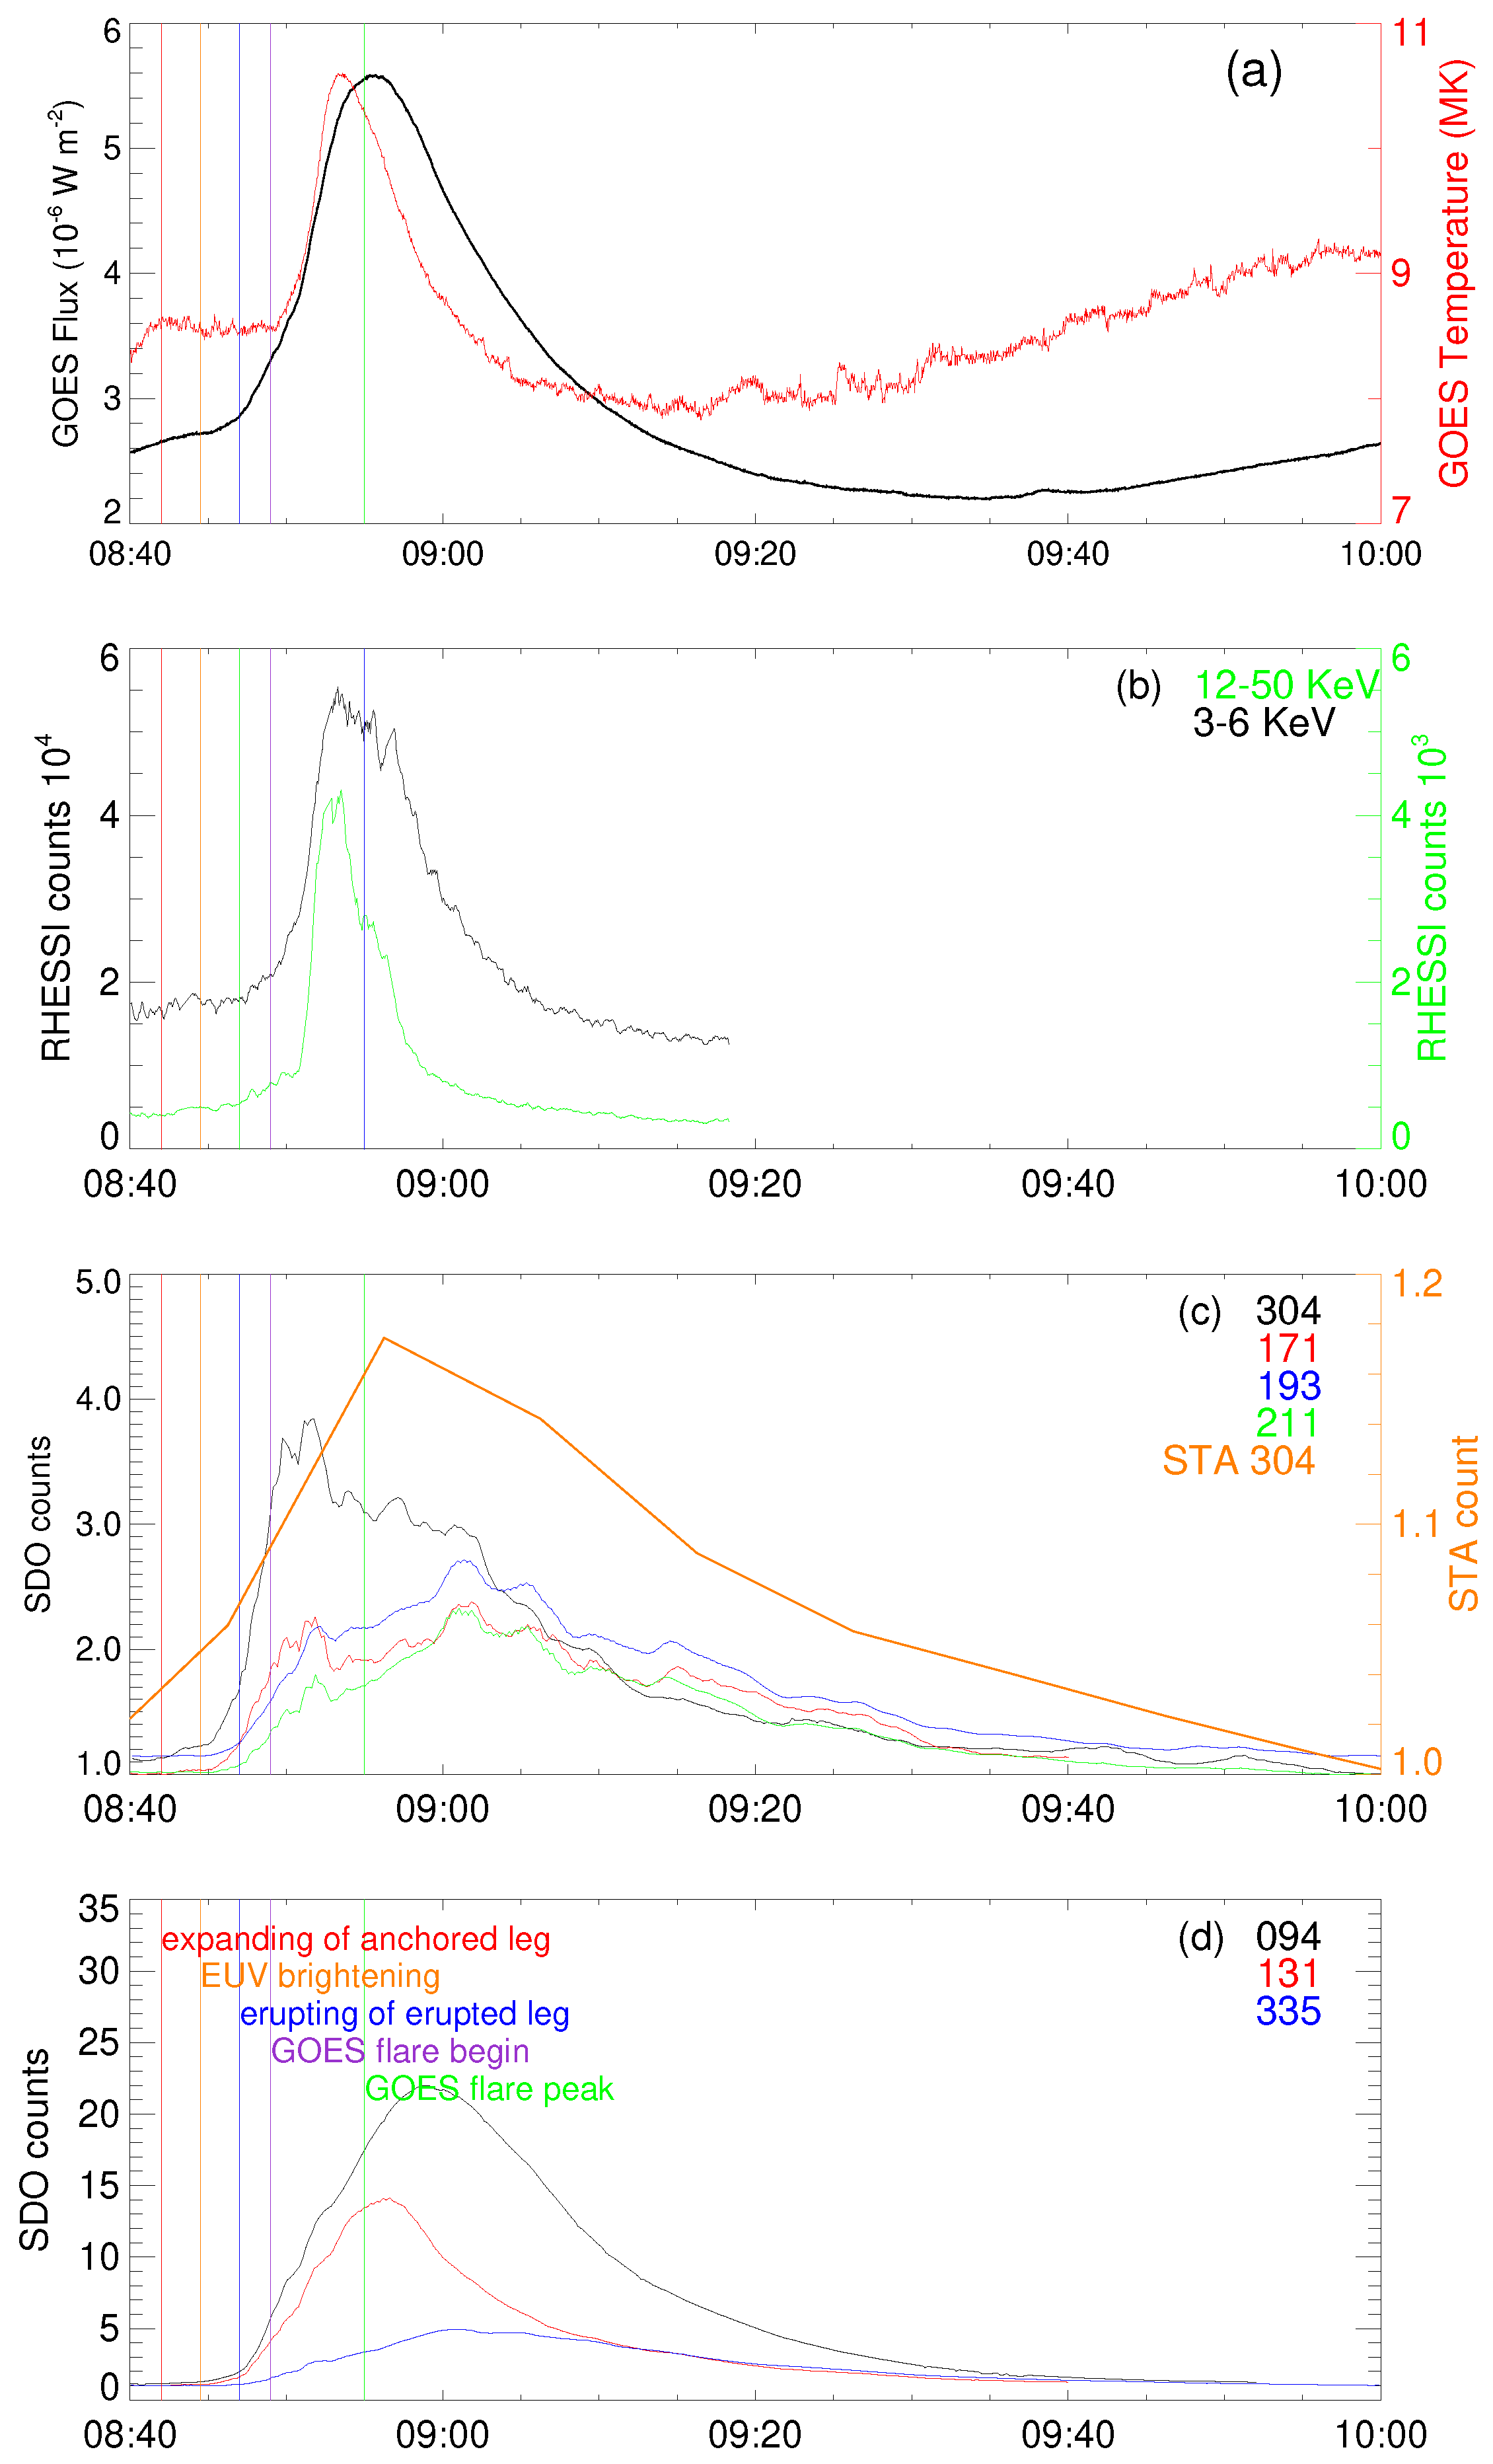
Figure 4 shows the temporal evolution of the event. Black curve in Figure 4a shows the soft X-ray flux in GOES 1–8 Å, and the red curve shows the temperature deduced from two GOES energy bands. GOES soft X-ray flux curve presents a simple temporal evolution, with monotonic increasing during the impulsive phase and monotonic decreasing during the decay phase. According to GOES flare definition, the associated C5.5 flare begins at 08:49 UT, peaks at 08:55 UT and ends at 09:01 UT. The temperature curve reaches its maximum around 08:53 UT, which is about 2 min earlier than that of the soft X-ray flux.
Ref. [36] have analyzed the spectrum of this event and found that at energies ∼9 KeV, the non-thermal contribution dominates over the thermal component. Following their results, we show the temporal profile of thermal (3–6 KeV) and non-thermal (12–50 KeV) emission recorded by RHESSI, in Figure 4b. It covers the whole process of the failed filament eruption. As shown by both curves, the X-ray emission increases slightly from 08:47 UT, while the impulsive increase begins around 08:51 UT in both low and high energy band. Both RHESSI curves reach the maximum flux around 08:53 UT, which is consistent with the GOES temperature curve.
SDO/AIA EUV/UV light curves in both cool and hot channels are shown in Figure 4c,d. The emission has been summed over the AR (Figure 3) and normalized to its preflare level. AIA 304 Å flux curve shows slight increase around 08:42 UT. Around 08:44 UT, 304, 171 and 094 Å flux show obvious increase. The 304 Å flux reaches its maximum around 08:50 UT. Meanwhile, the other cool lines also reach a small peak. The 304 Å flux decreases after this peak, while flux in other wavelengths reach their second peak around 09:02 UT. Flux curve obtained from EUVI 304 Å images is also shown in this plot, with the temporal resolution of 5 min. Flux curve obtained from hot lines of AIA shows a simple variation with one peak around 09:00 UT.
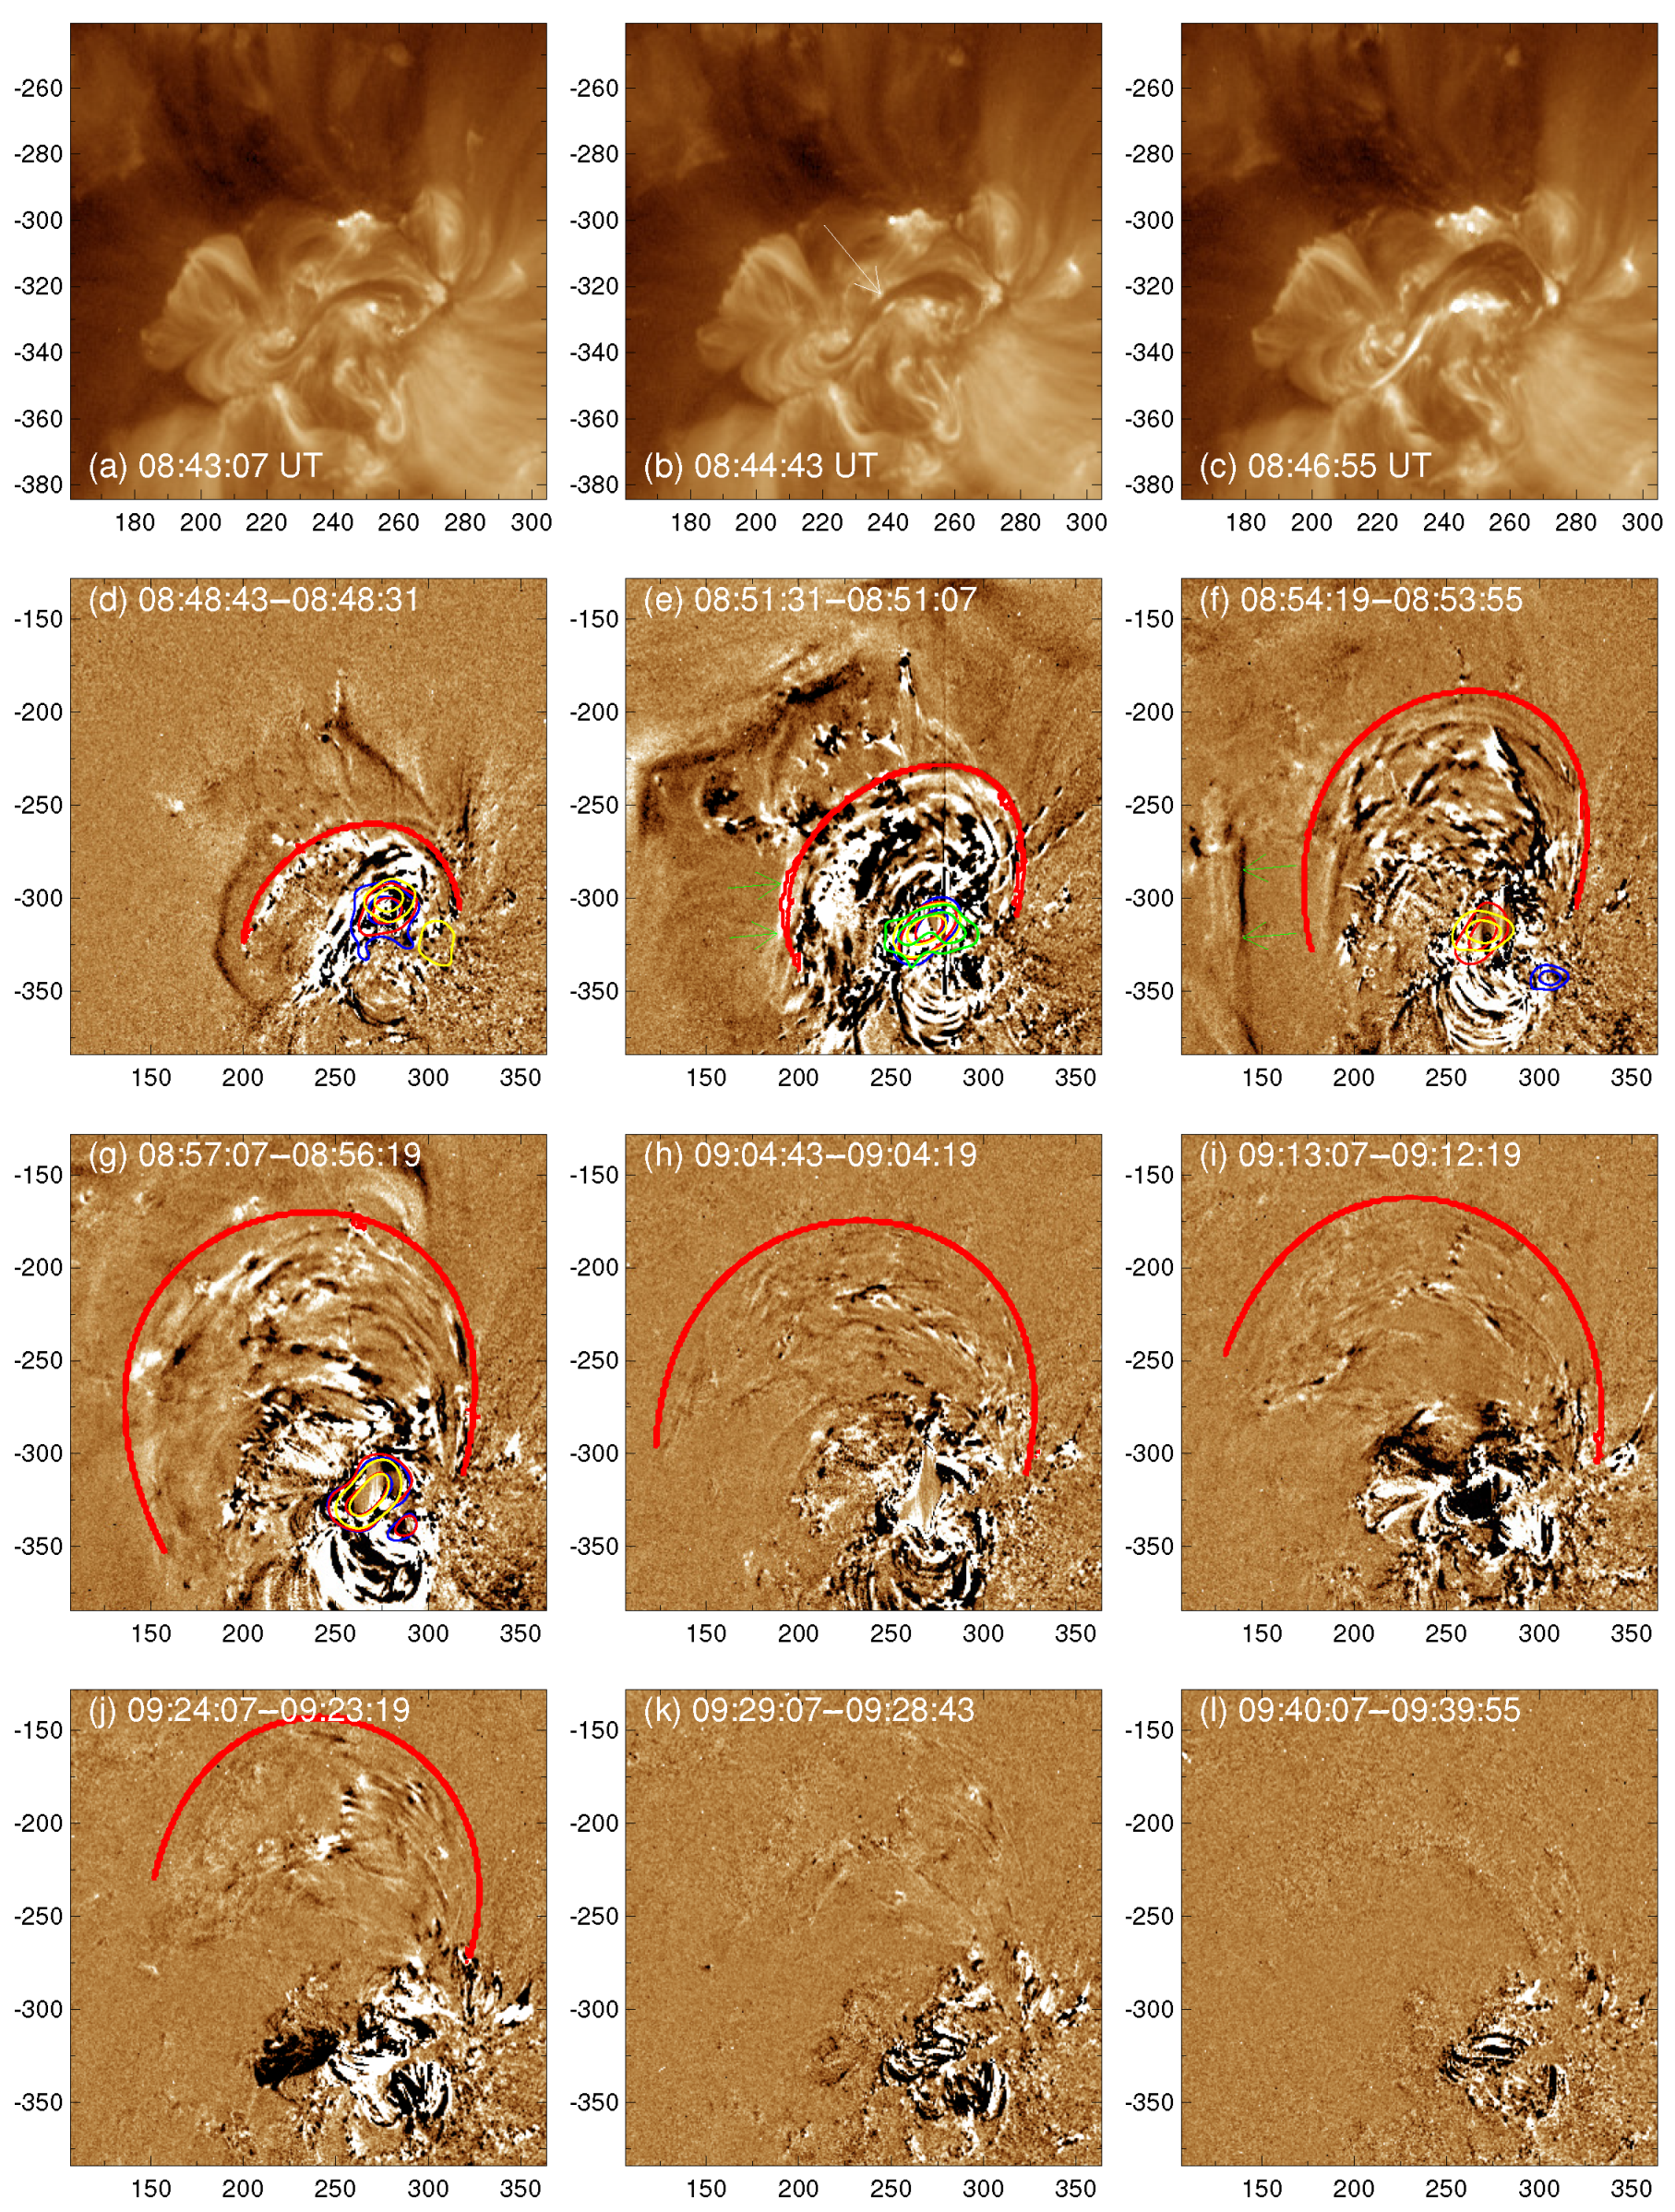
The on-disk dynamic evolution of the failed filament eruption can be seen more clear in animations. It is also shown in this paper as images recorded at key time points in Figure 5 and time-distance diagrams in Figure 6. Slit positions of these diagrams are indicated by vertical lines in Figure 3. These slits are located at three important positions of the filament: slit 1 locates near the foot point of the anchored leg which shows the gradual expansion as the precursor activity clearly; slit 2 locates at the area where the initial EUV brightening occurs; and slit 3 locates at the foot-point of the eruptive leg, which shows the eruption clearly. According to the SDO record, we will discuss the detailed evolution of the failed filament eruption in three separate phases: (1) pre-eruption phase (08:42 UT–08:47 UT); (2) eruption phase (08:47 UT–08:56 UT); and (3) decay phase (later 08:56 UT).

4.1.1. Pre-Eruption Phase (08:42–08:47 UT)

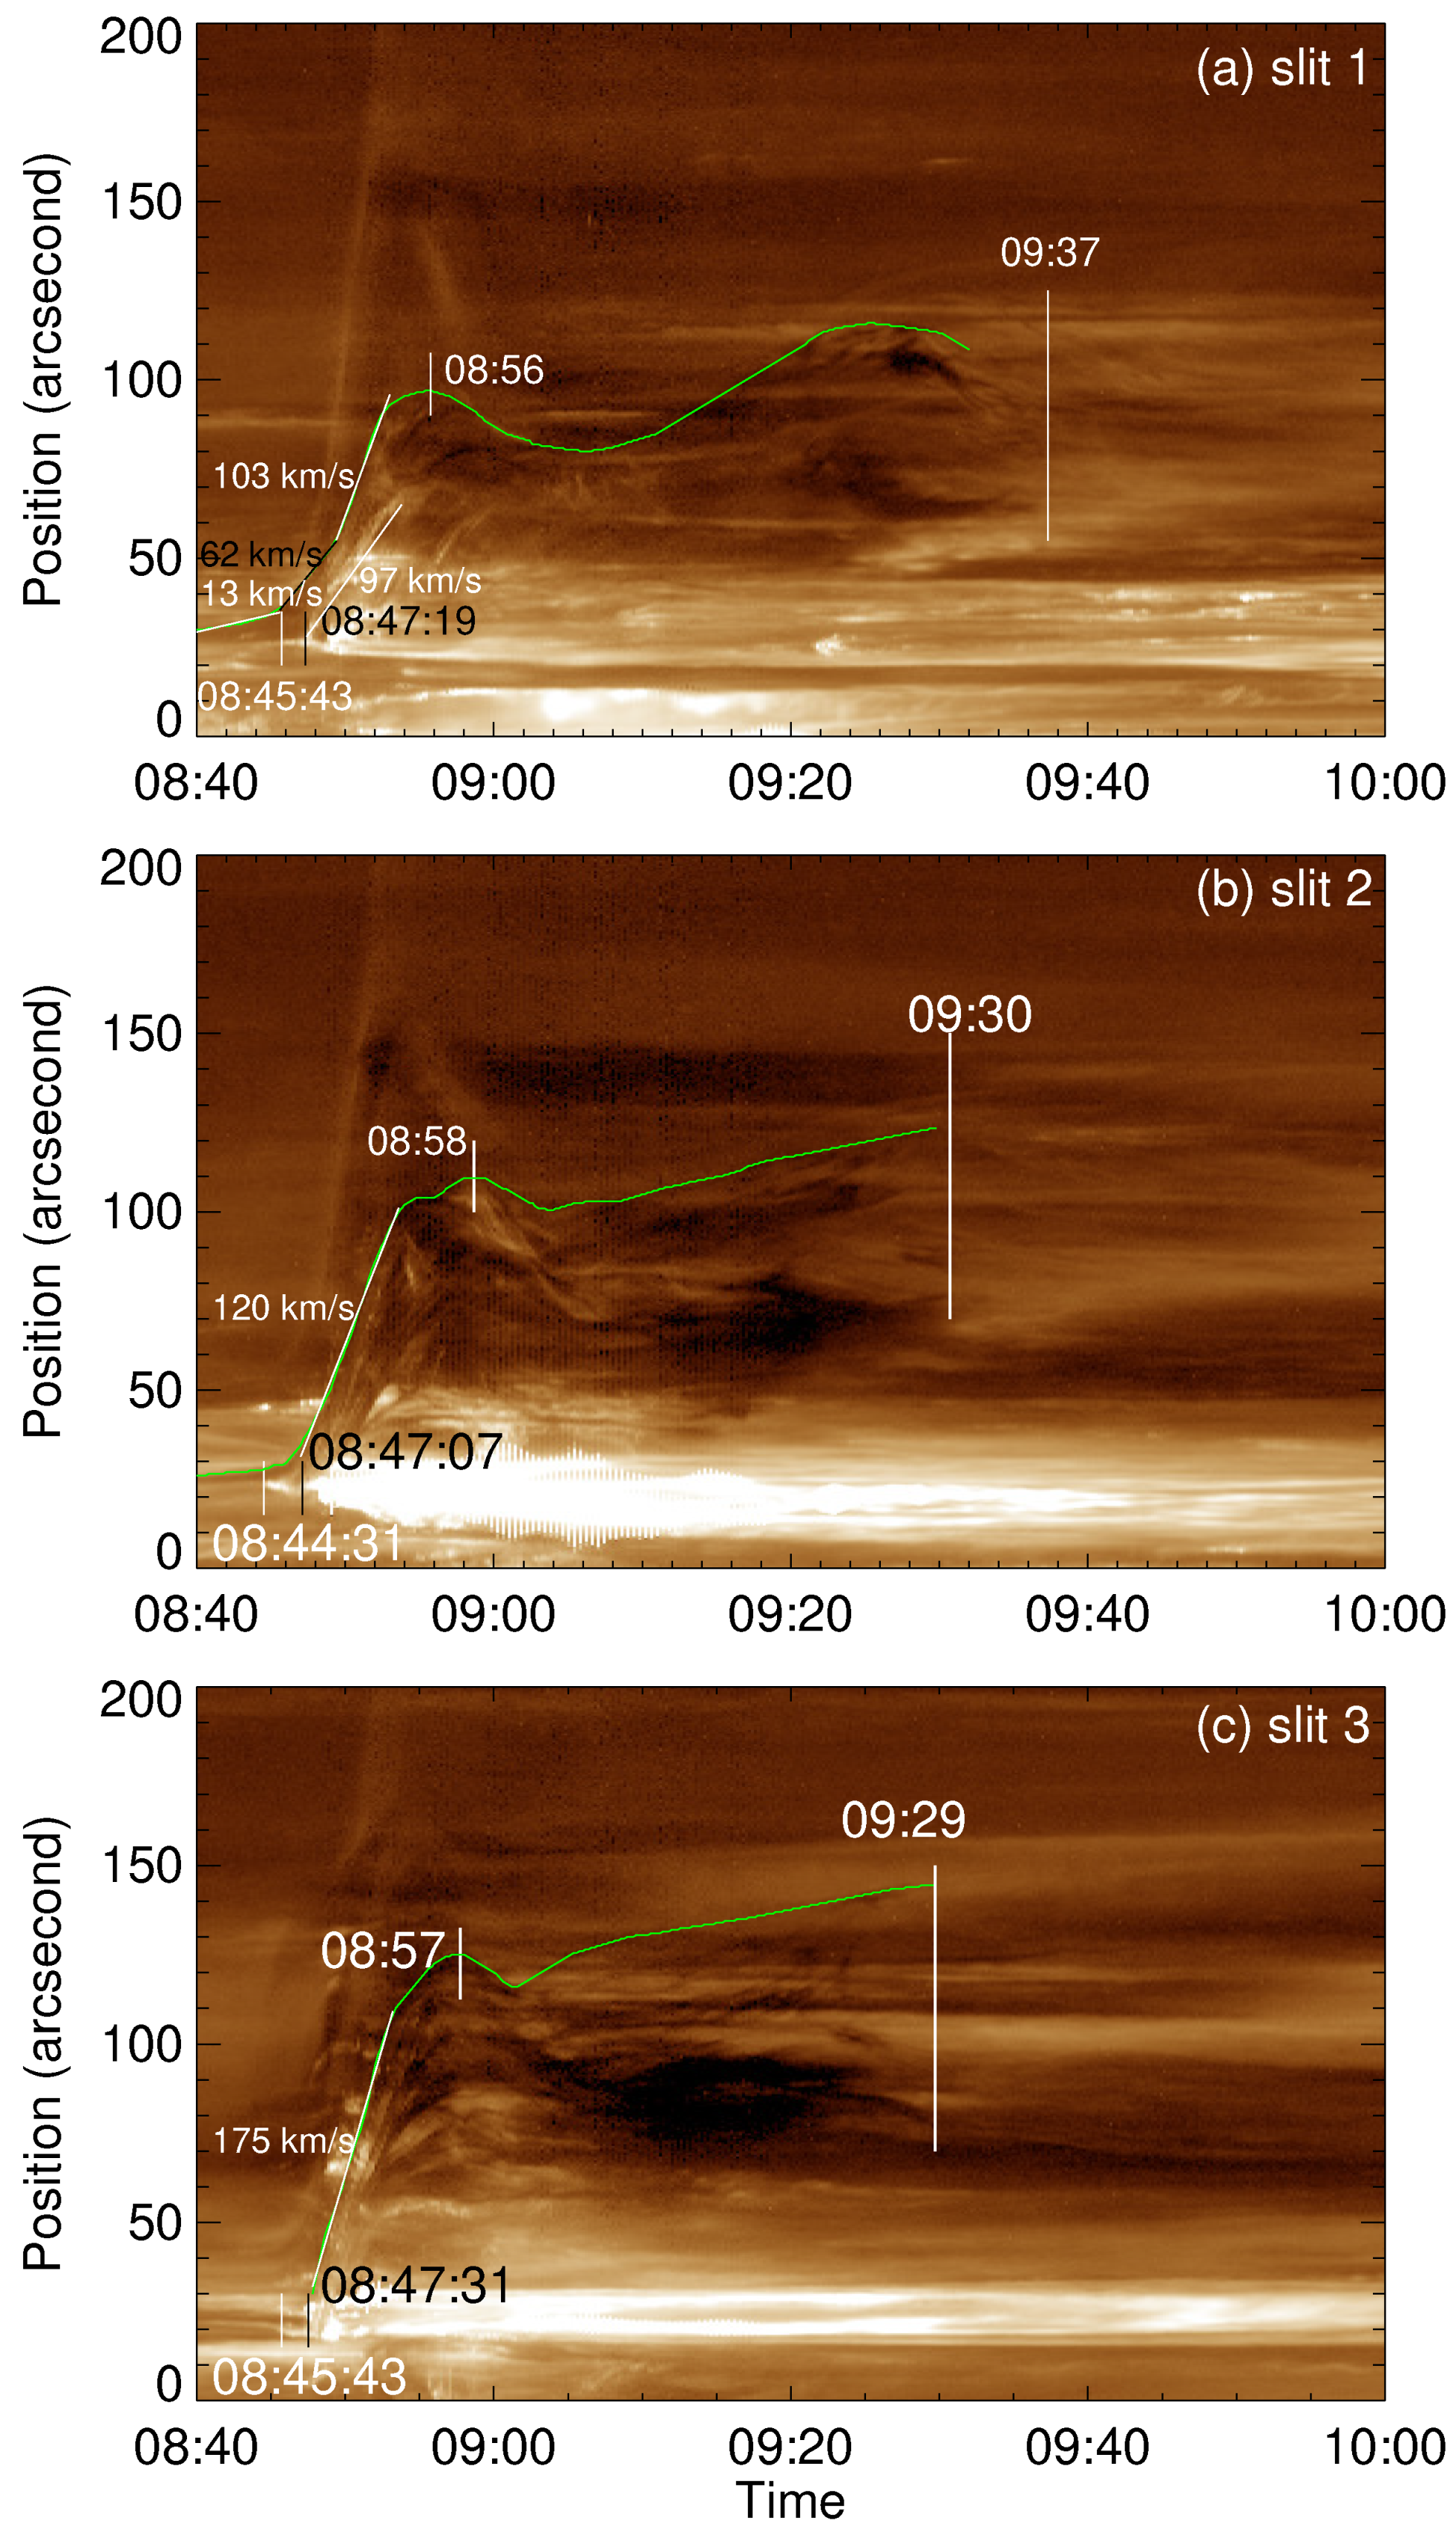
The gradual expansion of the anchored leg starts around 08:42 UT and can be identified easily from Figure 5a–c. As shown in Figure 6a, the anchored leg of the filament can be identified as dark feature along the time axis at beginning, with the width of 2900 km. The expansion presents as the slowly rising of its upper-limb with the average speed of about 13 km s 1 . The initial EUV intensity enhancement, as the possible precursor of low atmoshpere reconnection, first appears around 08:44:31 UT (Figure 6b) and situates under the center of the S-shaped filament. It is indicated by the white arrow in Figure 5b. This EUV brightening extends along the PIL at first. It is confirmed by Figure 6, that the width of the brightening feature under the filament in all three panels is almost consistent at first two minutes. The brightening appears under the eruptive leg around 08:44:51 UT. While it appears under the anchored leg about 1 min later (08:45:43 UT). At that time, the width of the anchored leg extends to about 5000 km. The narrow bright ribbon can be seen clearly in Figure 5c. As shown in Figure 6a, the expansion of the anchored leg becomes fast after the EUV brightening. The average expansion speed of its upper-limb is of about 65 km s 1 . In Figure 6b, the filament body around the center part expands slowly after the EUV brightening. While in Figure 6c, the width of the filament remains stable around the active leg.

4.1.2. Eruption Phase (08:47–08:57)

The morphological evolution of the filament during the eruption phase is shown in Figure 5d–g. It can be seen more smoothly in Figure 6. The fast rising of the lower limb of the filament first occurs at the center part around 08:47:07 (Figure 6b). Around 08:47:19 UT, the fast rising of the anchored leg starts. Furthermore, then, as shown in Figure 6c, the main filament eruption begins around 08:47:31 UT, with the active leg suddenly break off from the solar surface. Meanwhile, the EUV brightening, which results from the evolution of the post flare loops, begins to extend away from the PIL. It can be identified as the slowly broaden of the brightening feature in Figure 6. Its width extends from about 4100 km at 08:47:43 UT to about 10,000 km at 08:48:43 UT along slit 1.
As indicated in Figure 6a, the average rising speed of the filament upper-limb is about 62 km s 1 at the first 3 min and then accelerates to about 103 km s 1 . Meanwhile, its lower-limb erupts with the average speed of about 97 km s 1 . As shown in Figure 6b,c, the rising speed of the filament is about 120 km s 1 and 175 km s 1 , respectively. Associated with the eruption, the compact filament expands and becomes rarefied. It expands in a large scale of about 5.6 × 10 4 km, which is about 10 times of its initial width. Consequently, it can be seen clearly that the filament is made up of several threads. No significant untwisted/twisted feature is observed during the eruption phase, both for the whole filament or the threads. The plasma material reaches the maximum displacement around 08:56 UT, 08:58 UT and 08:57 UT along slit 1–3, respectively. Combining this figure with on-line animation, it can be found that the filament material hovers for about 3 min before they reach the maximum displacement. Furthermore, then the filament shrinks a little at first and hovers again.
During the filament eruption, one thread of the filament, as indicated by green arrows in Figure 5e,f, erupts toward the east, separates from the main filament body gradually, and then falls down to a remote area. Considering the motivation of present study, we will not give more detail about it.

4.1.3. Decay Phase (08:57–10:20 UT)

Figure 5 h–l shows the process of the filament material draining back to its anchored leg. During this process, the filament features in 193 Å become darker and darker. Figure 6c shows the dark features first appear around 09:03 UT. The dark features disappear around 09:37 UT, which may represent all material pass through this slice. For the slit 2, the obvious filament material darking occurs around 09:06 UT. Around 09:30 UT, all the material passes though the slit 2. Figure 6a shows that the filament material goes though the slit around 09:29 UT. The average velocity of the plasma material passes though the slit 2 and slit 1 is deduced with 203 km s 1 and 57 km s 1 , respectively.

4.2. RHESSI Observations

The reconstruction of 3–6 keV, 6–12 keV and 12–25 keV source can be obtained from 08:47 UT to 09:00 UT with about 1 min integration. These X-ray sources, observed at energy of 3–6 keV (blue), 6–12 keV (red), 12–25 keV (yellow), and 25–50 keV (green), if obtained, are overlaid on 193 Å images in Figure 5. Contour levels are set at 50% and 80% of the maximum brightness of each energy band. The figure reveals the presence of single source in 3–6 keV and 6–12 keV, which locates on the PIL and spatially coincident with the initial brightening. It has the apparent form of a loop-top source. The source in both 3–6 keV and 6–12 keV moves toward the active leg slowly along the PIL with about 14 and 15.7 arc-second, respectively. The HXR emission in the energy band of 12–25 keV is spatially consistent with the low energy sources, which covers the initial brightening at the preflare phase and locates in the middle of two ribbons. It moves toward the active leg associated with the softer source. The HXR source in high energy band of 25–50 keV only can be reconstructed around 08:51 UT. It is also co-spatial with the soft X-ray source.

4.3. Magnetic Topology of the Host Region

4.3.1. Long Term Evolution

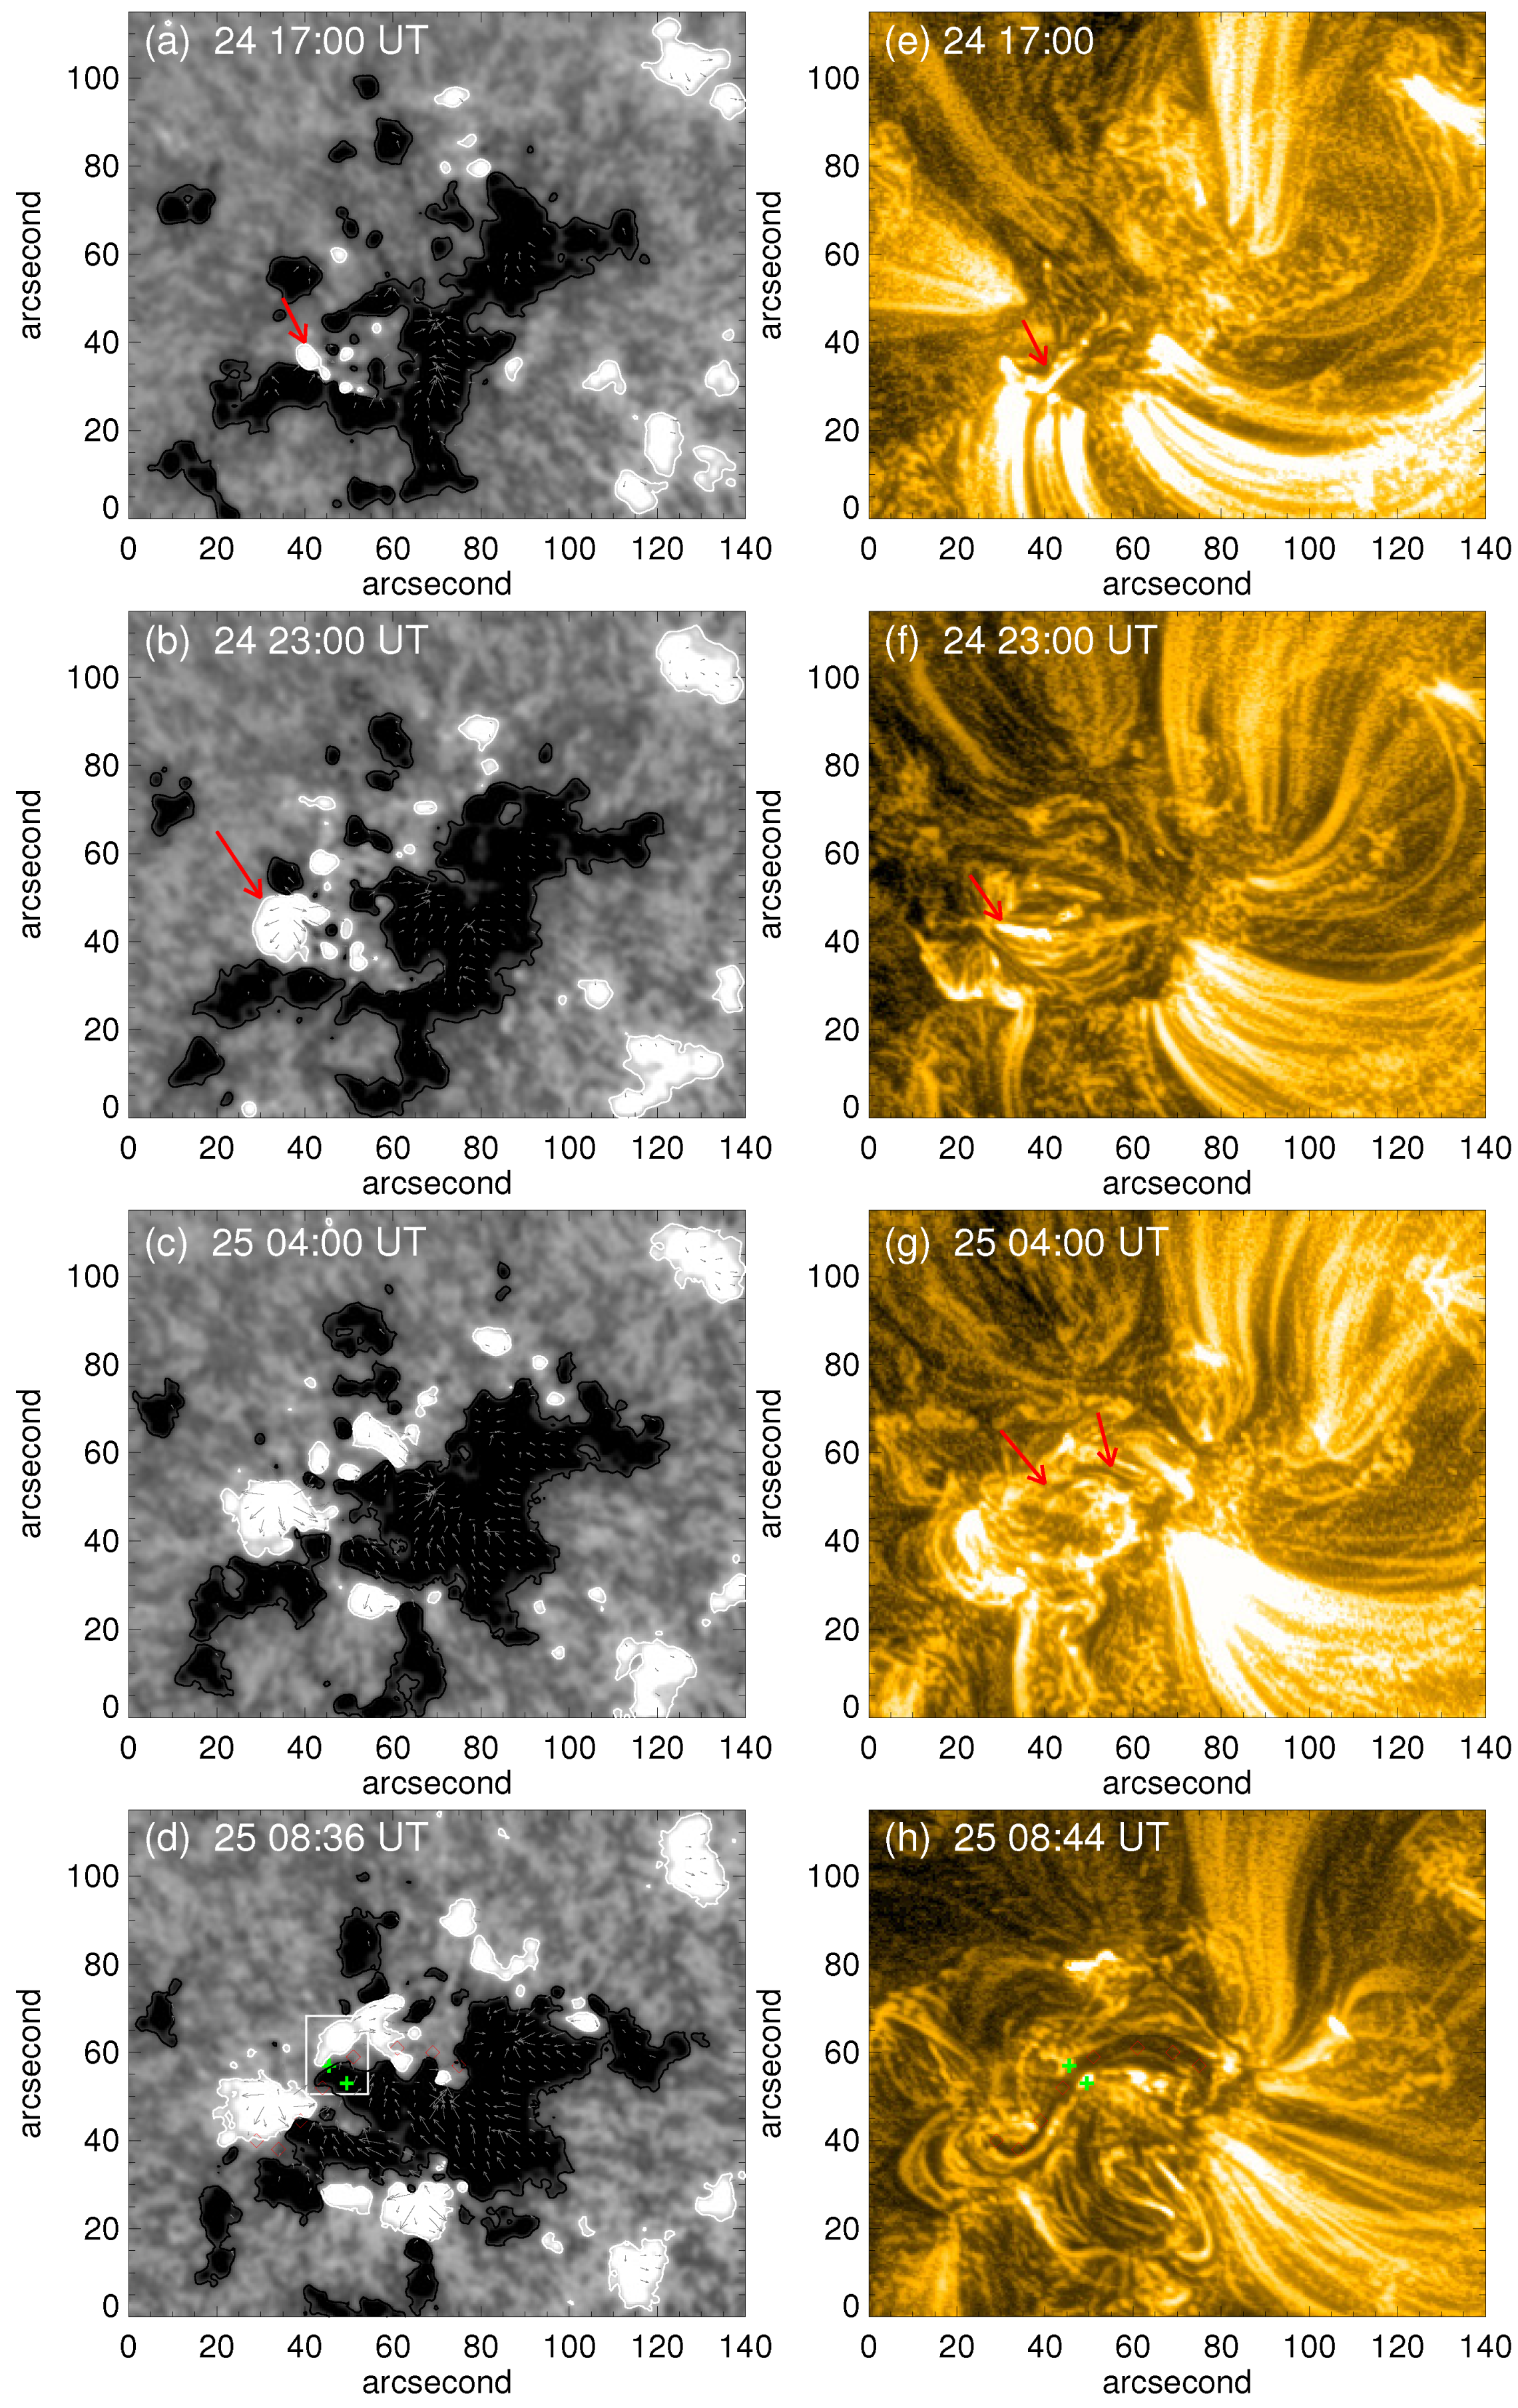
The long term dynamic evolution of the photospheric magnetic field can be seen clearly in an animation (hmi.mpg). The first and second row in Figure 7 show the morphology of photospheric magnetic field and corresponding solar atmosphere at four selected times as examples. For the magnetic field, the white and black contours outline the area with the longitudinal magnetic field of ± 50 Gauss. In the second row, AIA 171 Å images show the counterpart in the solar atmosphere.
As shown in the movies, NOAA 11,387 is a newly emerging active region, which appears in a decay negative area around 11:00 UT, 24 December 2011. During the early emergence phase of the first 8 h, the newly emerging magnetic polarities, including many small positive and negative polarities, emerge, converge and cancel very rapidly. The magnetic field recorded at 17:00 UT ( Figure 7a), shows an example of the magnetic configuration in the early emerging phase. In Figure 7a, several small positive polarities can be identified in the large negative area. These positive polarities disappear very rapidly in a few minutes. Small EUV brightenings are identified associated with the magnetic field emergence and cancellation. Red arrow in Figure 7e shows an example of the corresponding EUV brightening associated with the magnetic field emergence and cancellation.
The long term existing positive polarity first appears around 24 December, 19:00 UT. As shown in Figure 7b on 24 December, 23:00 UT, it is indicated by green arrow. Meanwhile, some small positive and negative couples can be found around the positive polarity. EUV brightening associated with the magnetic field emergence is indicated by red arrow in Figure 7f. Associated with the magnetic field emergence, the fibers, which were arranged along the PIL in low corona, appear in the EUV wavelength as indicated in Figure 7g with red arrows.
With the continuous formation of the fibers along the PIL, a S-shaped filament forms around 08:30 UT. Figure 7d shows the magnetic field around 25 December, 08:36 UT, just 13 min before the eruption. The profile of the S-shaped filament is outlined by red diamonds in both images. Green pluses indicate the position where the initial EUV brightenings occur. As shown by this image, EUV brightenings on both side of the filament locate at the negative polarities side. Considering that the active region locates on the southwest of the solar disk and the filament hovers in the solar atmosphere, the projection effect is responsible for the positional deviation. It suggests that EUV brightenings should be the possible signature of the reconnection that occurs between the opposite polarities, which we outlined with a white box.
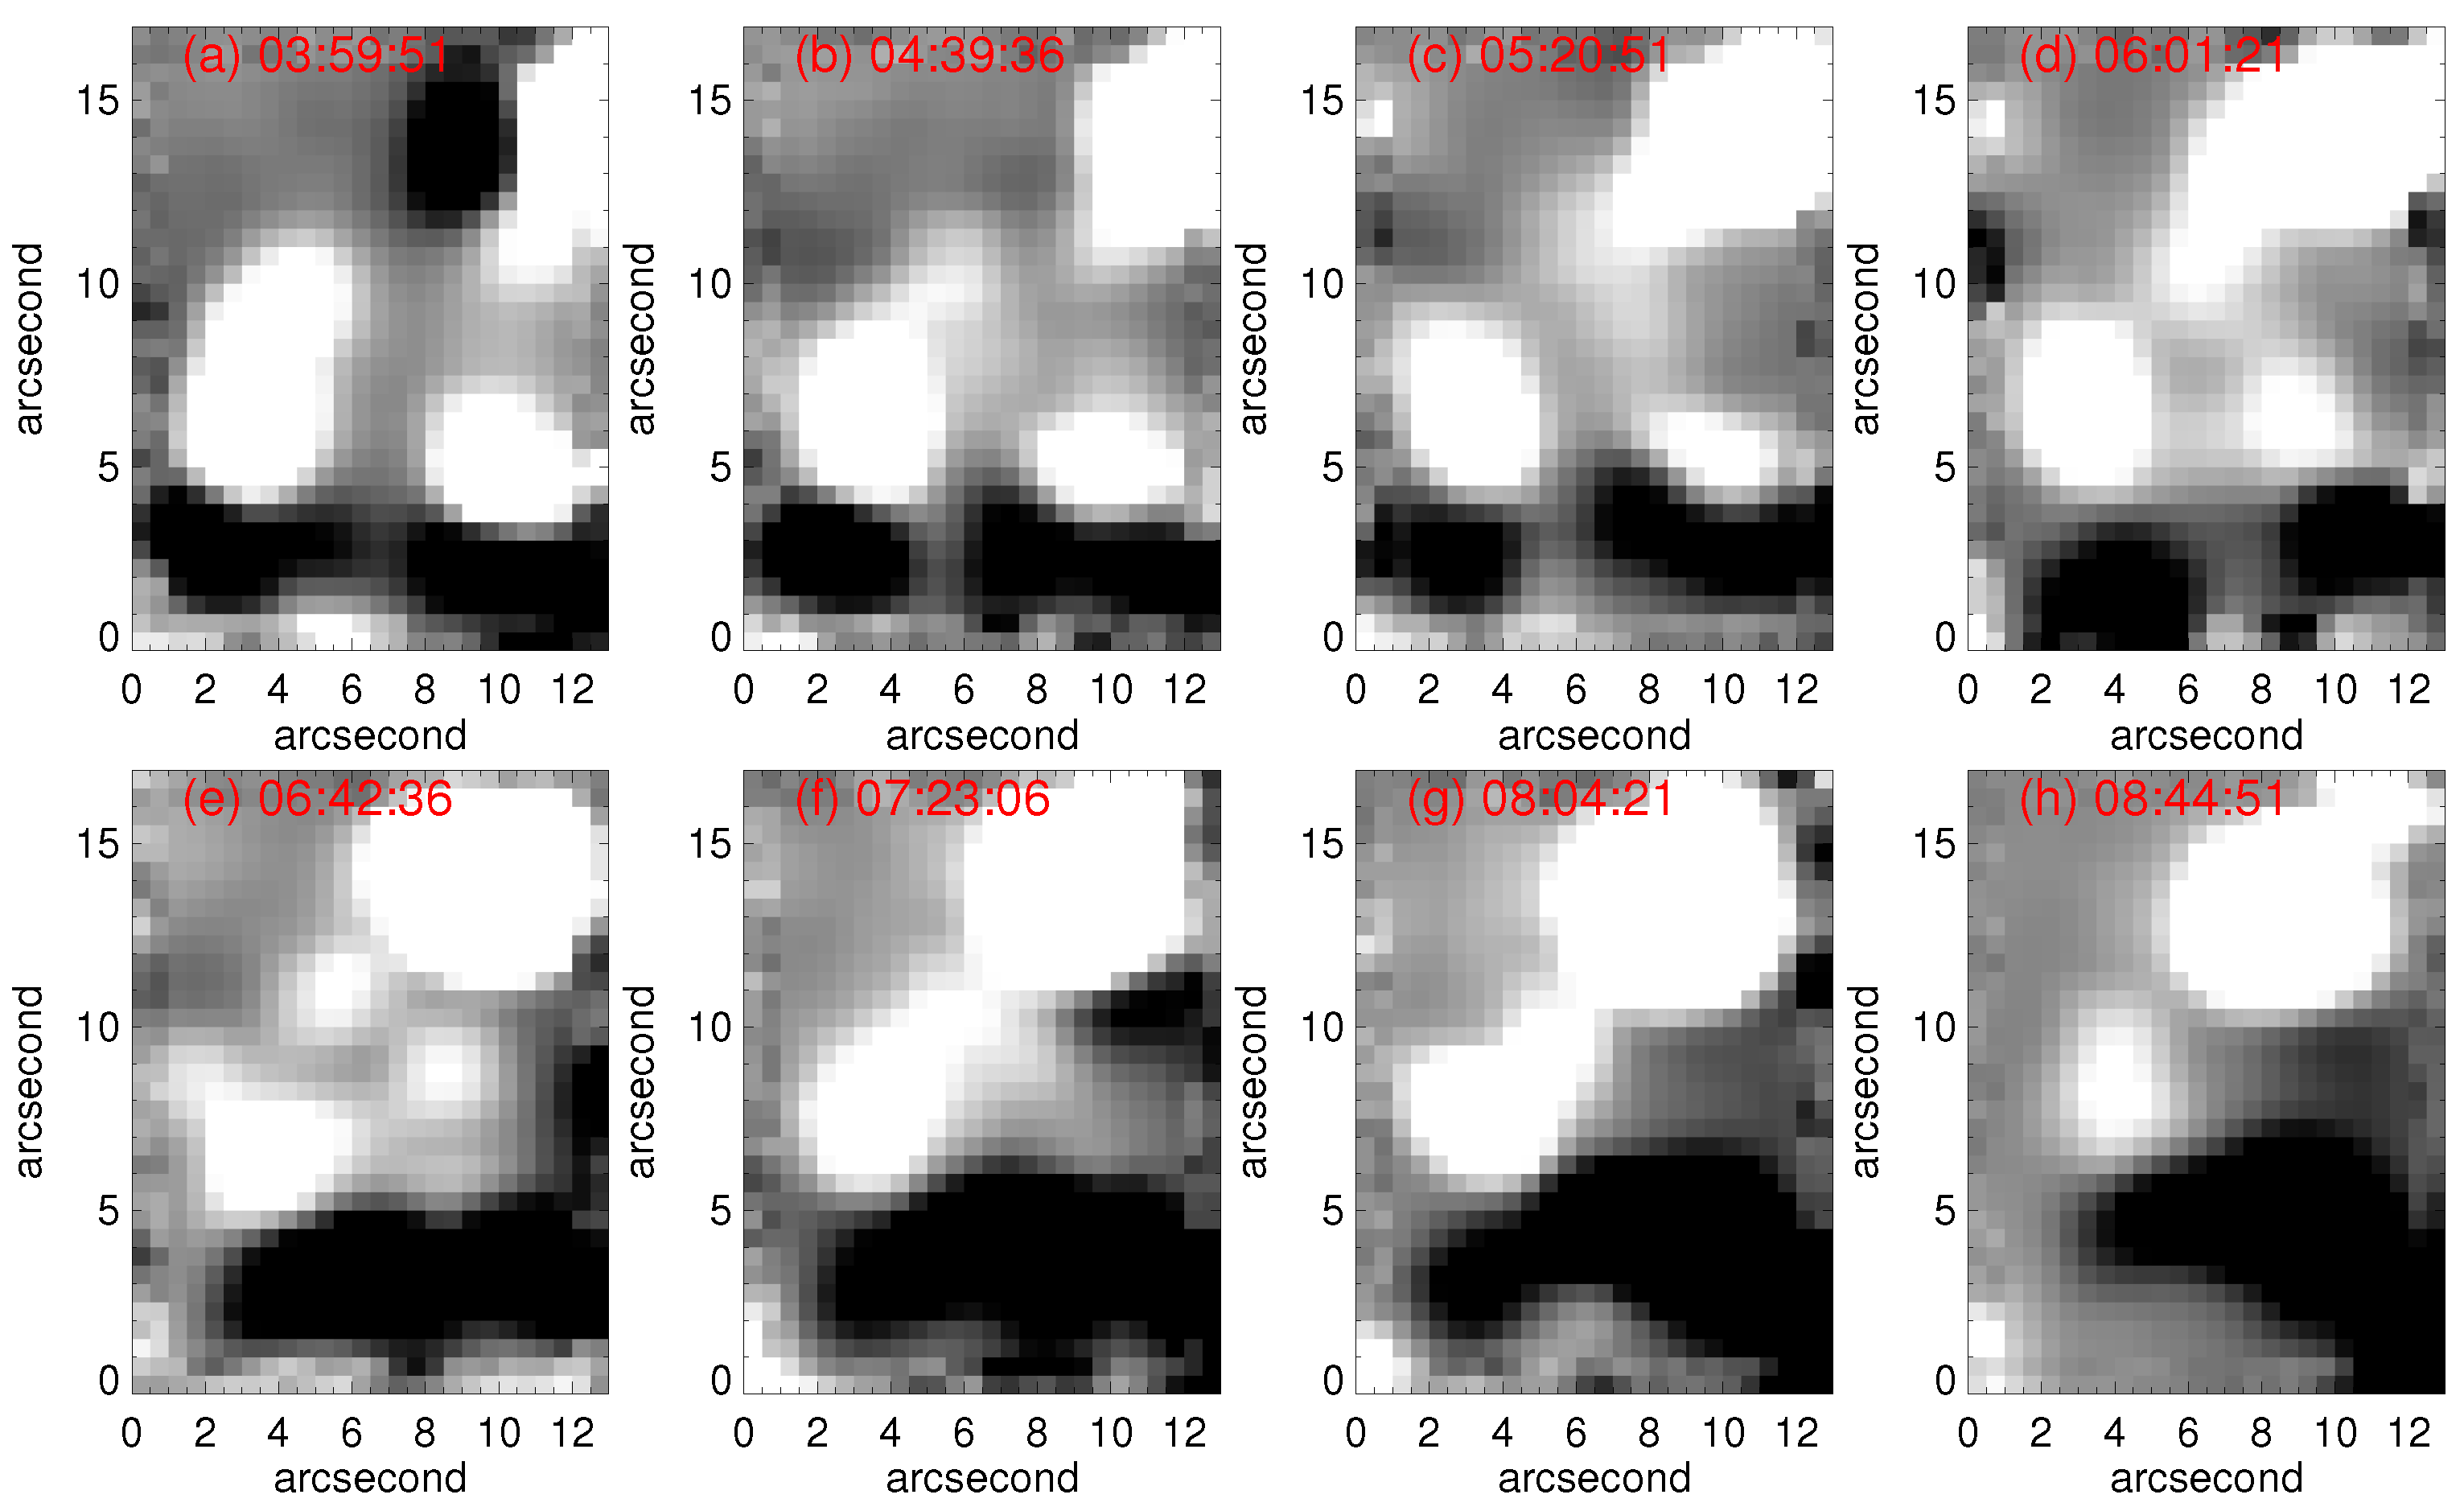
Figure 8 shows the temporal evolution of the magnetic field in the core region as outlined by white box in Figure 7d during the time period from around 04:00 UT to 08:44 UT. The figure shows that within the core region along the PIL, opposite polarities squeeze and cancel before the eruption. During this time period, the magnetic flux of the positive polarities decrease about 2.4 × 10 15 Mx. While for the negative polarities, the magnetic flux decrease at first and then increase because of the merger of nearby negative polarities.
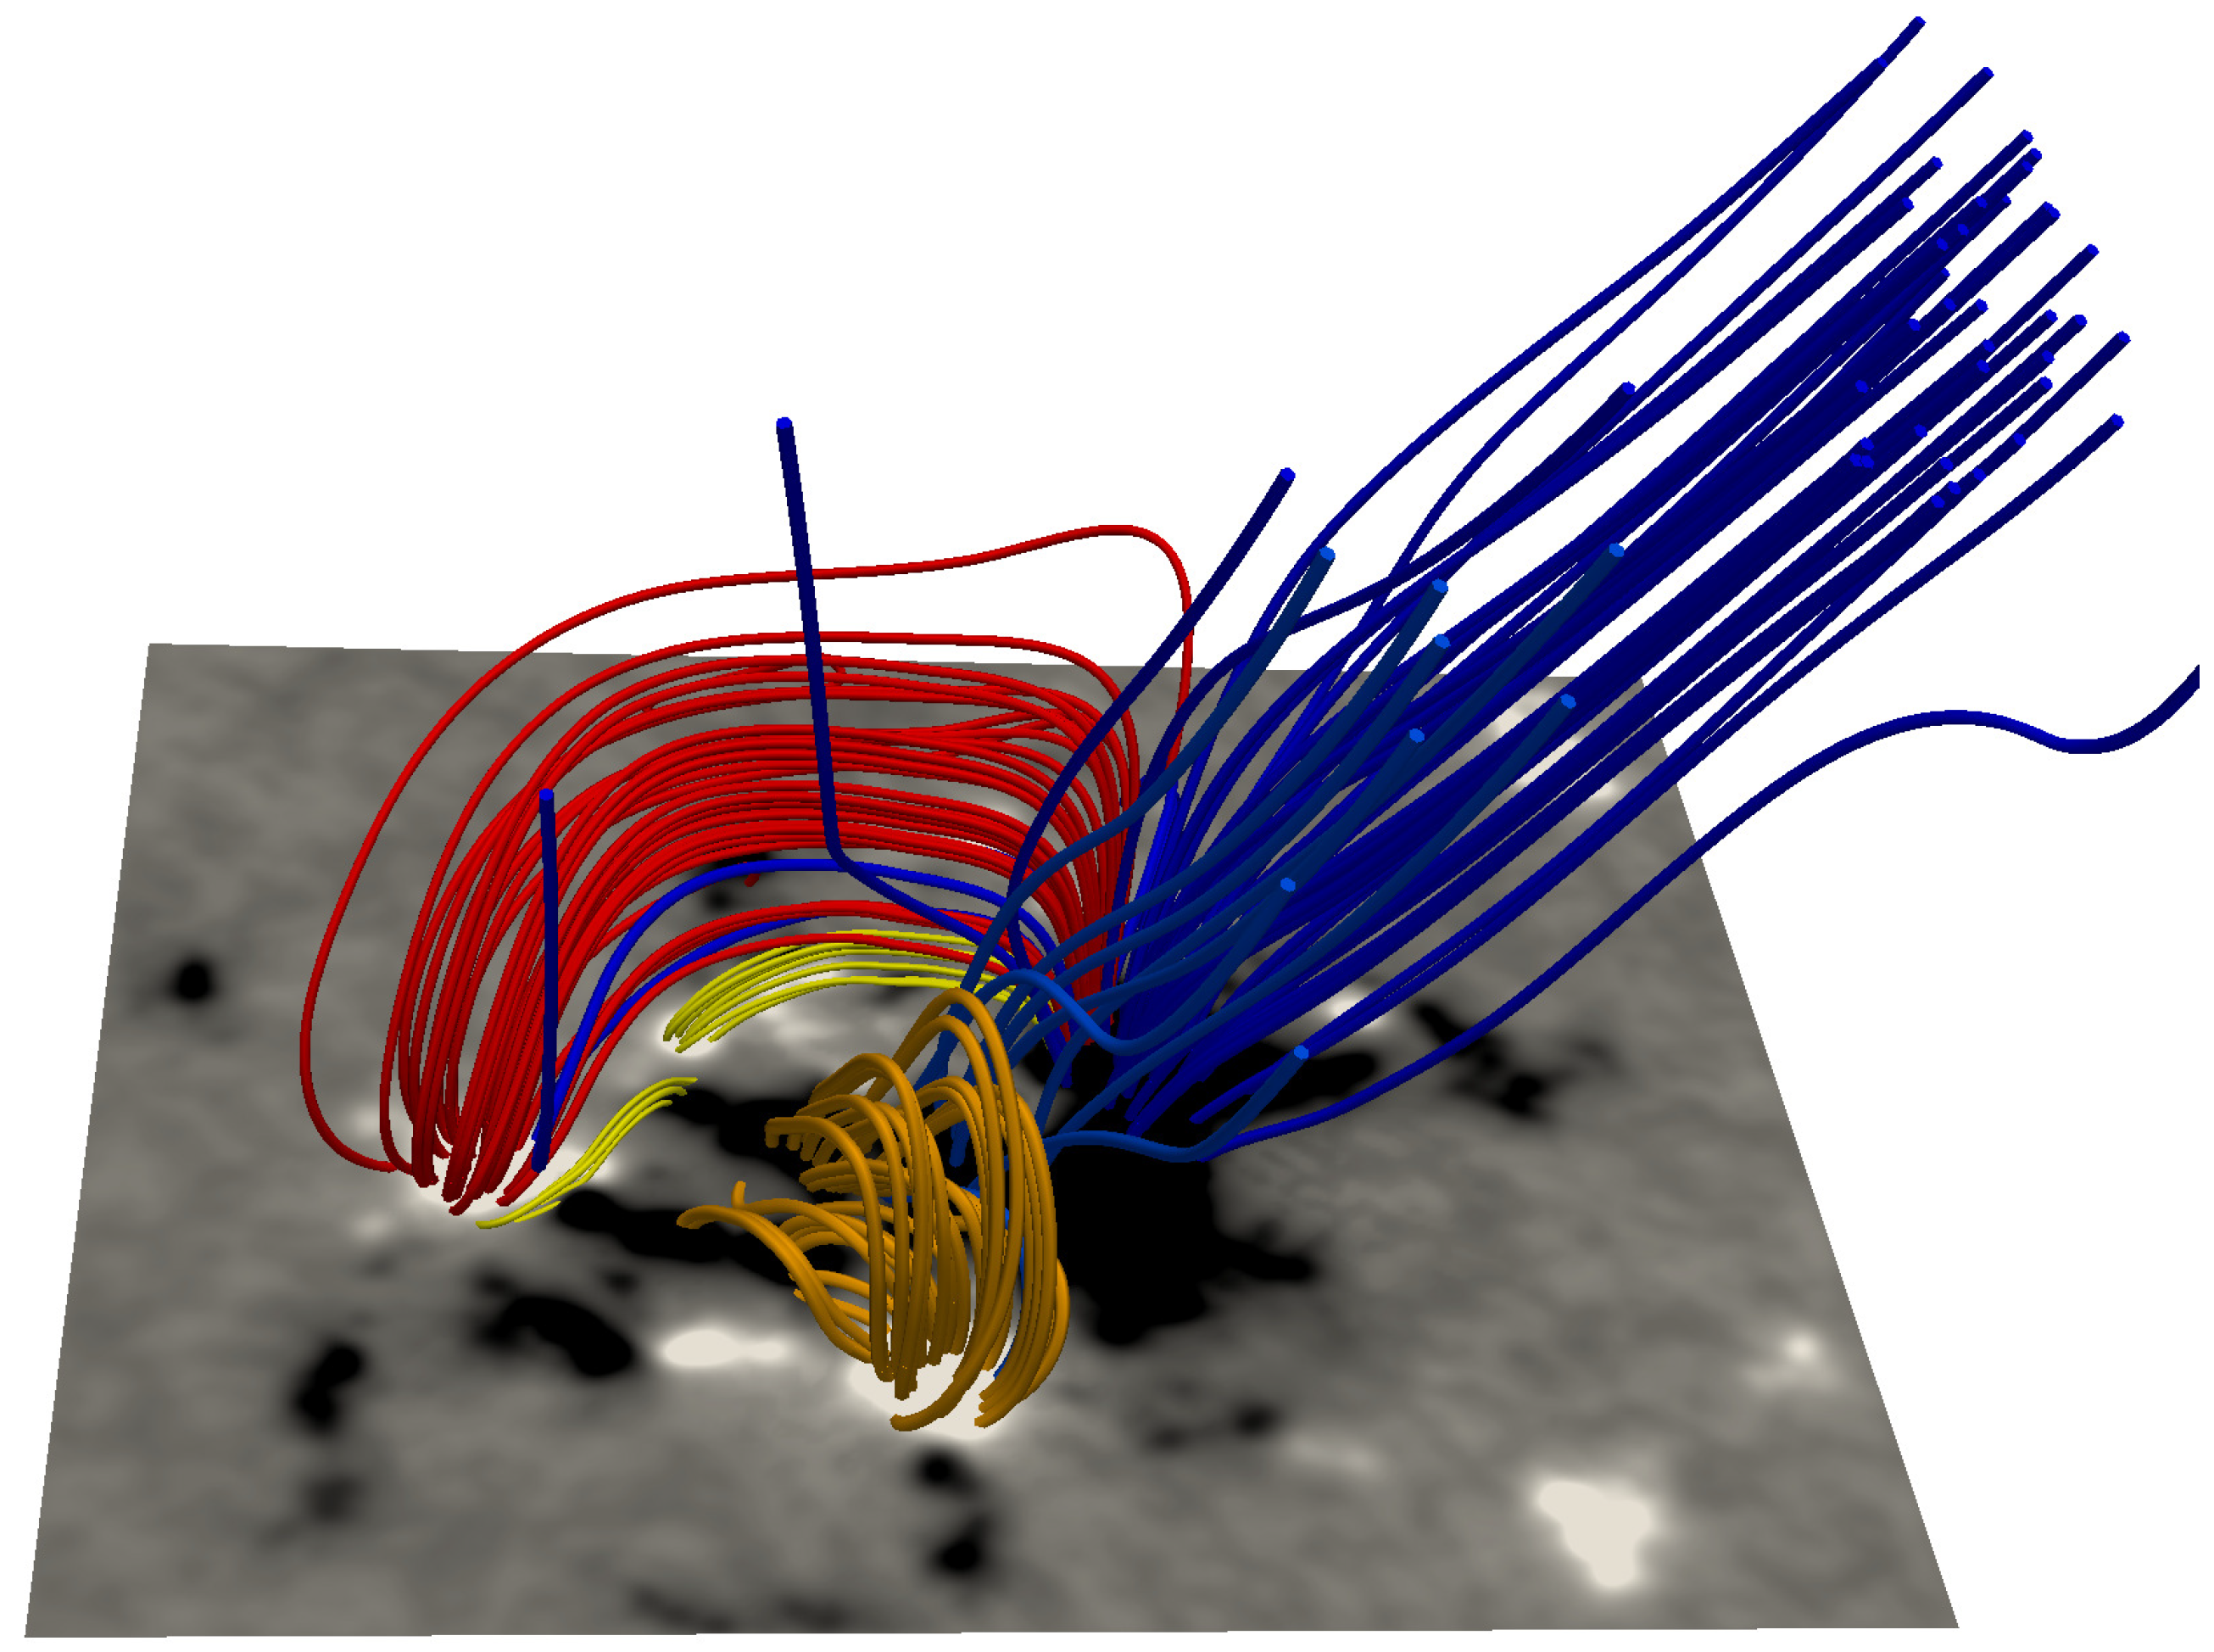
The Non-linear Force Free magnetic Field (NLFFF) extrapolation from the photospheric vector magnetograms is a general method to reconstruct the coronal field. Here, the NLFFF extrapolation is carried out by using boundary element integration method ([37,38]). By using this method, [37] have revealed for the first time the presence of a magnetic rope from the extrapolation of the three-dimensional magnetic field structure. To extrapolate the magnetic field, we used the code developed by Yu. This code is available online (https://github.com/sjyu1988/dbie) (accessed on 15 September 2021). The magnetic field is calculated in a Cartesian box of 140 × 115 × 100 arcsec 3 . As shown in Figure 9, the main configuration of the coronal magnetic field is overlaying magnetic loops associated with the emergence couples (red lines). Under that loops, two magnetic structures, which outlined by yellow lines, appear along the PIL. They locate end to end to form a S-shaped structure. As we show in Figure 3c,d, the S-shaped filament is combined by two J-shaped filaments, which are co-spatial with the extrapolated magnetic structures. Comparing Figure 7d and Figure 9, it is easy to find that the EUV initial brightening locates between opposite polarities where the nearby legs of the two small filaments are rooted in. It confirms the `tether-cutting’ scene that filament eruption is triggered by the reconnection between the nearby foot-points of two small filaments.

4.3.2. Non-Potential Parameters

In order to give a quantitative description of the temporal evolution of the magnetic field, the following parameters are calculated and shown in Figure 10. There are:
(1)
Magnetic flux (Figure 10a): including positive ( ϕ + ), unsigned negative ( ϕ ), and unsigned total magnetic flux ( ϕ ). It is the sum of all pixels where field strength is greater than 20 G. The ϕ is a quantitative measure of the effective size of active regions, which provides a physical clue as to the energy available for solar eruptions ([39]);
(2)
Magnetic helicity transport rate H t (Figure 10b): calculating by d H / d t = 2 ( B · A p ) υ z d S 2 ( υ · A p ) B z d S . Magnetic helicity is a quantitative measurement of the global chiral properties of the magnetic field. It can be transported across the boundary by the passage of helical field lines through the surface (the first term) or by the shuffling horizontal motion of field lines on the surface (the second term) ([40]), since the solar corona is an open volume with the photosphere as a boundary with normal flux. Ref. [41] pointed out that both terms can be calculated with the local correlation tracking method ([42]) from a time series of line-of-sight magnetograms ([43]);
(3)
Accumulated helicity Δ H (Figure 10c): integrating from the measured d H / d t . The accumulation of magnetic helicity in the corona plays a significant role in storing magnetic energy ([44]). For a newly emerging active region, it can estimate the magnetic helicity stored in the solar corona;
(4)
α t o t a l (black diamond in Figure 10d): calculating by α t o t a l J z · B z / B z 2 . It is provided by HMI team in SHARP data. One σ error bars is also shown in Figure 10d. It is used to denote a measure of the overall twist of the active region magnetic fields ([45,46]);
(5)
E f r e e (red stars in Figure 10d): obtaining from E f r e e = E N L F F E P o t . It quantifies the energy deviation of the coronal magnetic field from its potential state and is regarded as the upper limit of the energy that is available to power the solar eruption.
As show in Figure 10a, the magnetic flux evolution during the first 8 h remains stable. It is consistent with the impression from the animation that many small opposite polarities emerge, converge and cancel rapidly during the first emergence phase. The steady increase of both positive and negative polarities start around 20:00 UT on 24 December, just about 13 h before the failed filament eruption. It is also confirmed by the animation that even though the small opposite polarities emerge and cancel rapidly along the PIL, the main bipolar emerges steady. Before the failed filament eruption, the unsigned total magnetic flux is about 4 × 10 21 Mx. For a super-active regions, this value is usually more than 10 22 Mx ([39,47]).
Because the fast variation of the magnetic topology during the first 8 h, the sign of the H t varies very rapidly around zero (Figure 10b), with the main contribution is negative in the first 5 h and then positive in the following times. As a result, the absolute value of the accumulated helicity is only about several one-tenth of 10 40 Mx 2 (Figure 10c) around 22:00 UT on 24 December. Associated with the steady emergence of the magnetic polarities, the helicity transport is mainly with positive sign, which is consistent with the S-shaped filament on south hemisphere ([48]). As shown in Figure 10b, the maximum helicity transport rate is less than 10 40 Mx 2 h 1 . As reported by [49], a necessary condition for the occurrence of an X-flare is that the peak helicity flux has a magnitude greater than 6 × 10 36 Mx 2 s 1 (i.e., 2.16 × 10 40 Mx 2 h 1 ). Meanwhile, the accumulated helicity is about 4.0 × 10 40 around the failed filament eruption initiation. For a CME associated flare, the accumulated helicity usually around several times of 10 43 Mx 2 ([50]). The small value of H t and Δ H is consistent with the long term evolution of the magnetic field as shown by the movie. There is no observational evidence of sunspot rotation and shear motion along the PIL. Both processes can result in the increase of magnetic twist on photosphere and then accumulate the magnetic helicity in corona. Meanwhile, for the failed eruption, no significant twisted features is observed during the whole observational phase. These indicate that kink instability could not be the possible trigger for this event.
The α t o t a l shows similar evolution tendency, with the value varies during a large range of ±0.02 Mm 1 during the first 8 h (black diamond in Figure 10d). Furthermore, then, the α t o t a l appears steady increase with positive sign. In Figure 10d, the blue curve is the GOES flux in 1–8 Å, which shows two flares that occurred in AR 10387. Both associated with the decrease of α t o t a l and E f r e e . For the C5.5 flare which we studied in present work, the α t o t a l reaches a local maximum around 07:30 UT, about 75 min before the flare, and show a local minimum just at the flare time. The free energy shows a decrease of about 2.3 × 10 31 erg during the eruption. By a case study of [51], magnetic free energy of about 9.1 × 10 31 is large enough to power a confined M1.2 flare. Meanwhile, the average energy is about 4.3 × 10 30 erg for a CME ([52]). Considering both evidences, the free energy releases in the present event is larger enough to power a fully eruption.

4.3.3. Decay Index

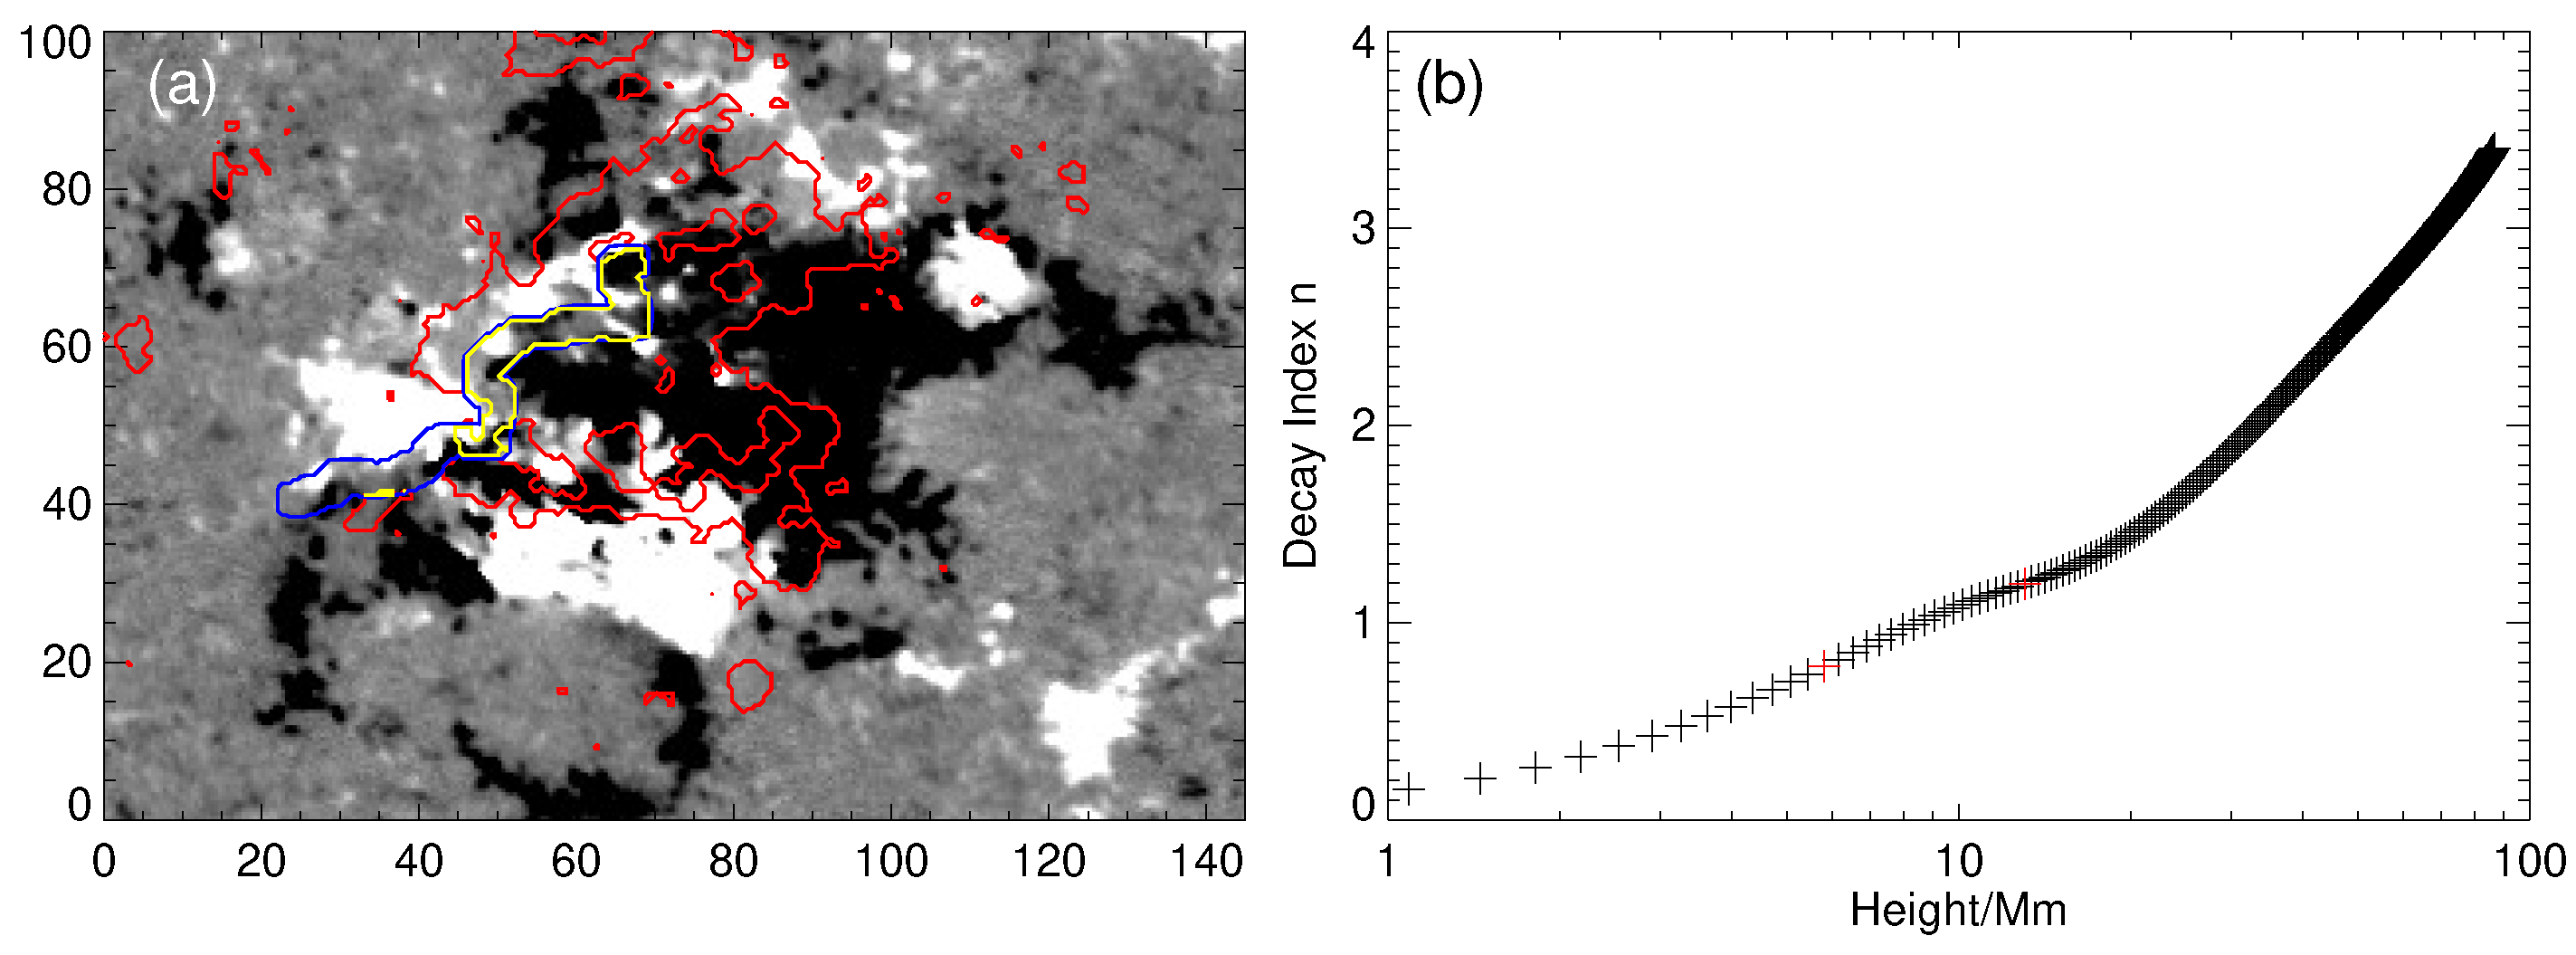
In order to quantitatively describe how fast the closed magnetic field decreases with height, the parameter-decay index is calculated and shown in Figure 11. Following previous researchers ([53,54]), we have designed a Flaring Polarity Inversion Line (FPIL) mask to demarcate the AR core field, where most free energy is stored. The PIL is identified from a smoothed longitudinal magnetic field map, and we dilate them with a circular kernel (radius r = 2.2 Mm). It is shown as a blue contour in Figure 11a. The flare ribbons are isolated from the AIA 1600 Å image (above 700 DN s 1 ), which was recorded near the flare peak, as shown with the red contour. The intersection of the dilated PIL and flare ribbons contributes to our FPIL mask (yellow contour). The variation of decay index along the height is shown in Figure 11b. The initial active height of the filament cannot be determined by SDO observation, since it is a disk-event from SDO point of view. While for STEREO-A, the host region can be identified as a brightening area with the maximum height of 13 Mm at 08:46:15 UT. Since the suddenly eruption of the active leg occurs around 08:47:31 UT. So 13 Mm can be used as the up limit of the apex height. Meanwhile, from the extrapolated magnetic field, the height of the sheared arcade, where the filament is lifted, is about 5.8 Mm. It can be used as the lower limit of the apex height. The apex height where the filament eruption occurs would locate between the up and lower limit. As shown in Figure 11b, vertical profile of the decay index is monotonic. Similar variation tendency of n is also reported in several studies ([54,55]). While, in a complex magnetic configuration, switchback or saddle-like vertical n profile is also obtained ([55,56,57]). In the scatter plot, red plus indicated the height of the upper and lower limit. It shows that n is about 0.8 and 1.2 at the height of 5.8 Mm and 13 Mm, which is smaller than the common threshold value of 1.5 and as same as the threshold value proposed by [11] for erupted filament.

5. Summary and Conclusions

In this study, based on the solar limb observations from STEREO-A and solar disk observations from SDO and RHESSI, we present high resolution multi-wavelength observations of a failed filament eruption, which was associated with a C5.5 flare and a hovered-CME on 25 December 2011. We summarize the observational results as follows:
The limb observations give a sample evolution of the failed filament eruption. It shows that the filament erupts asymmetrically with one leg anchored to the Sun while the other undertook dynamic motions. During the eruptive process, the active leg whips upward to the maximum height of 4.8 × 10 5 km, and then drains back to the solar surface along the anchored leg. A hovered-CME that results from the filament activities appears in COR1 as a small fan-shape, and then moves upward with the average velocity of about 200 km s 1 . It reaches the maximum height of about 2.6 R , within the FOV of COR1.
The solar disk observations give more details about the eruption. The erupted filament is composited by two small filaments that locate along the PIL from end to end. The conjunction of their nearby legs locate in the core field of the S-shaped filament. The failed filament eruption starts as a gradual expansion of the anchored leg. EUV brightening appears about 2 min later after the expansion and locates around opposite polarities where the two nearby legs rooted. This brightening expands along the neutral line at first and then perpendicular to the neutral line. Initial hard X-ray emission occurs spatio-temporal with the EUV brighting. The fast rising of the filament begins as a result of active leg cut off from the solar surface and associated with the flare ribbon separation from the PIL. The fast rising phase lasts about seven minutes till the filament reaches the maximum displacement. Then, the filament stays around this place for about three minutes as well as the filament plasma begins cooling. Subsequently, the filament plasma flows to the anchored leg and then finally drains back to the solar surface. The falling down phase lasts for about forty minutes.
Our main results and conclusions are summarized as follows:
  • In relation to the eruption onset mechanisms is that this eruption is triggered by tether-cutting reconnection. The observational evidence is as follows: 1. even though the slow expansion of the anchored leg occurs earlier than that of the EUV brightening in the core S-shape field, the impulsive eruption is related to the EUV brightening rather than the filament expansion; 2. as the pre-eruption activity, the expansion occurs at the anchored leg, which always fixes on the solar surface during the whole eruption; and 3. the active leg remain stable at the very beginning and then suddenly erupts into the high coronal about two minutes later of the EUV brightening. The disconnection between the active leg and the solar surface means that reconnection should be occurred here; and 4. the EUV brightening first appears at the S-sharped core region which spatio-temporal with the cancellation of opposite magnetic polarities and the hard X-ray emission in the 25–50 KeV energy band, which is due to the non-thermal emission. Both are possible signatures for reconnection occurring under the filament; and 5. no significant untwisted/twisted features are recorded by both STEREO-A and AIA during the eruption. It means that kink instability is not possible to be the triggered. In summary, the above observational results indicate that the eruption is triggered by tether-cutting reconnection.
  • Concerning the failure of the eruption, it was confined by the strong corresponding overlying field. The supported observational evidence is as follows: 1. In this study, the active region is an ephemeral region, which emerges in a decaying region with about 22 h before the eruption. Associated with the emergence of the active region, magnetic loops, which are connected to the main bipolar, emerge from the photosphere into the corona gradually. Two J-shaped magnetic structures, which co-spatial with the S-shaped filament, appear just under the magnetic loops; 2. As shown in Figure 5, the erupted filament always remain the arc-shape during its eruption, which presents the strong confine of overlaying magnetic field; 3. The decay index at the apex of the filament is about 0.8–1.2. It is smaller than or comparable with the critical value; 4. Free energy release during the eruption is about 2.3 × 10 31 erg, which is large enough to power a fully eruption; 5. The maximum accelerated velocity deduced from STEREO-A observation is about 1 km s 2 , which is about 3 times greater than the solar gravitational constant ( g = 0.273 km s 2 ). All these observational evidences suggest that the eruption failed, possibly due to an inward magnetic tension force.
  • The associated coronal counterpart which was recorded as a CME by COR1 is not a real coronal mass ejection. Both limb and disk observations show that there is no coronal plasma ejected from the low atmosphere to the high coronal and even into the interplanetary. More important, the COR1 observation shows that the moving brightening front that is identified as CME stops when it reaches the maximum height of about 2.6 R . These observations indicate that some CMEs, even recorded by both COR1 and COR2, are only the transient heating and disturbing of coronal rather than really CME.

Author Contributions

Conceptualization, Y.Z., B.T., Y.Y.; investigation, Y.Z., B.T., C.T., J.H., Y.Y.; formal analysis, Y.Z., CT., J.H.; writing—original draft preparation, Y.Z.; writing—review and editing, Y.Z., B.T., Y.Y.; funding acquisition, Y.Y. All authors have read and agreed to the published version of the manuscript.

Funding

This research was funded by the National Natural Science Foundation of China, grant number 11790301, 11973057, 11941003, and the MOST Key Project 2018YFA0404602.

Data Availability Statement

The data presented in this study are openly available in the homepage of SDO, STEREO and RHESSI.

Acknowledgments

Data were made available courtesy of NASA/SDO and the AIA, and HMI science teams. We are also grateful to the STEREO and RHESSI teams for public access to calibrated data. We thank the anonymous referee for helpful comments on the manuscript.

Conflicts of Interest

The authors declare no conflict of interest.

References

  1. Ji, H.S.; Wang, H.M.; Schmahl, E.J.; Moon, Y.-J.; Jiang, Y.C. Observations of the Failed Eruption of a Filament. Astrophys. J. 2003, 595, L135–L138. [Google Scholar] [CrossRef]
  2. Rust, D.M.; Kumar, A. Evidence for Helically Kinked Magnetic Flux Ropes in Solar Eruptions. Astrophys. J. 1996, 464, 199. [Google Scholar] [CrossRef]
  3. Török, T.; Kliem, B.; Titov, V.S. Ideal kink instability of a magnetic loop equilibrium. Astron. Astrophys. 2004, 413, L27–L30. [Google Scholar] [CrossRef]
  4. Fan, Y. Coronal Mass Ejections as Loss of Confinement of Kinked Magnetic Flux Ropes. Astrophys. J. 2005, 630, 543. [Google Scholar] [CrossRef]
  5. Kliem, B.; Török, T. Torus Instability. Phys. Rev. Lett. 2006, 96, 255002. [Google Scholar] [CrossRef] [Green Version]
  6. Fan, Y.; Gibson, S.E. Onset of Coronal Mass Ejections Due to Loss of Confinement of Coronal Flux Ropes. Astrophys. J. 2007, 668, 1232. [Google Scholar] [CrossRef] [Green Version]
  7. Török, T.; Kliem, B. The Evolution of Twisting Coronal Magnetic FLux Tubes. Astron. Astrophys. 2003, 406, 1043. [Google Scholar] [CrossRef] [Green Version]
  8. Fan, Y.; Gibson, S.E. The Emergence of a Twisted Magnetic Flux Tube into a Preexisting Coronal Arcade. Astrophys. J. 2003, 589, 105. [Google Scholar] [CrossRef]
  9. Török, T.; Kliem, B. Confined and Ejective Eruptions of Kink-unstable Flux Ropes. Astrophys. J. 2005, 630, L97–L100. [Google Scholar] [CrossRef] [Green Version]
  10. Nindos, S.; Patsourakos, S.; Wiegelmann, T. On the Role of the Background Overlying Magnetic Field in Solar Eruptions. Astrophys. J. 2012, 748, L6. [Google Scholar] [CrossRef]
  11. Zuccarello, F.P.; Aulanier, G.; Gilchrist, S.A. the Apparent Critical Decay Index at the Onset of Solar Prominence Eruptions. Astrophys. J. 2016, 821, L23. [Google Scholar] [CrossRef] [Green Version]
  12. Zuccarello, F.P.; Chandra, R.; Schmieder, B.; Aulanier, G.; Joshi, R. Transition from Eruptive to Confined Flares in the Same Active Region. Astron. Astrophys. 2017, 601, A26. [Google Scholar] [CrossRef]
  13. Moore, R.L.; Sterling, A.C.; Hudson, H.S.; Lemen, J.R. Onset of the Magnetic Explosion in Solar Flares and Coronal Mass Ejections. Astrophys. J. 2001, 552, 833. [Google Scholar] [CrossRef]
  14. Chen, H.D.; Zhang, J.; Cheng, X.; Ma, S.L.; Yang, S.H.; Li, T. Direct Observations of Tether-cutting Reconnection during a Major Solar Event from 2014 February 24 to 25. Astrophys. J. 2014, 797, L15. [Google Scholar] [CrossRef] [Green Version]
  15. Antiochos, S.K. The Magnetic Topology of Solar Eruptions. Astrophys. J. 1998, 502, L181. [Google Scholar] [CrossRef]
  16. Antiochos, S.K.; DeVore, C.R. A Model for Solar Coronal Mass Ejections. Astrophys. J. 1999, 510, 485. [Google Scholar] [CrossRef] [Green Version]
  17. Aulanier, G.; Török, T.; Démoulin, P.; Deluca, E.E. Formation of Torus-unstablie Flux Ropes and Electric Currents in Erupting Sigmoids. Astrophys. J.
  18. Liu, Y. Magnetic Field Overlying Solar Eruption Regions and Kink and Torus Instabilities. Astrophys. J. 2008, 679, L151. [Google Scholar] [CrossRef] [Green Version]
  19. Liu, Y.; Su, J.T.; Xu, Z.; Lin, H.; Shibata, K.; Kurokawa, H. New Observation of Failed Filament Eruptions: The Influence of Asymmetric Coronal Background Fields on Solar Eruptions. Astrophys. J. 2009, 696, L70. [Google Scholar] [CrossRef]
  20. Shen, Y.D.; Liu, Y.; Liu, R. A time series of filament eruptions observed by three eyes from space: From failed to successful eruptions. Res. Astron. Astrophys. 2011, 11, 594. [Google Scholar] [CrossRef]
  21. Kuridze, D.; Mathioudakis, M.; Kowalski, A.F.; Keys, A.F.; Jess, D.B.; Balasubramanam, K.S.; Keenan, F.P. Failed filament eruption inside a coronal mass ejection in active region 11121. Astron. Astrophys. 2013, 552, 55. [Google Scholar] [CrossRef] [Green Version]
  22. Zhou, Z.J.; Cheng, X.; Zhang, J.; Wang, Y.M.; Wang, D.; Liu, L.J.; Zhang, B.; Cui, J. Why Do Torus-unstable Solar Filaments Experience Failed Eruptions. Astrophys. J. 2019, 877, L28. [Google Scholar] [CrossRef]
  23. Xu, H.; Su, J.; Chen, J.; Ruan, G.; Awasthi, A.K.; Zhang, H.; Zhang, M.; Ji, K.; Zhang, Y.; Liu, J. Multiwavelength Observation of a Failed Eruption from a Helical Kink-unstable Prominence. Astrophys. J. 2020, 901, 121. [Google Scholar] [CrossRef]
  24. Mrozek, T. Failed Eruption of a Filament as a Driver for Vertical Oscillations of Coronal Loops. Sol. Phy. 2011, 270, 191. [Google Scholar] [CrossRef] [Green Version]
  25. Netzel, A.; Mrozek, T.; Kołomanński, S.; Gburek, S. Extreme-ultraviolet and hard X-ray signatures of electron acceleration during the failed eruption of a filament. Astron. Astrophys. 2012, 548, 89. [Google Scholar] [CrossRef] [Green Version]
  26. Chandra, R.; Filippov, B.; Joshi, R.; Schmieder, B. Two-step Filament Eruption during 14–15 March 2015. Sol. Phys. 2017, 292, 81. [Google Scholar] [CrossRef] [Green Version]
  27. Howard, R.A.; Moses, J.D.; Vourlidas, A.; Newmark, J.S.; Socker, D.G.; Plunkett, S.P.; Korendyke, C.M.; Cook, J.W.; Hurley, A.; Davila, J.M.; et al. Sun Earth Connection Coronal and Heliospheric Investigation (SECCHI). Space Sci. Rev. 2008, 136, 67–115. [Google Scholar] [CrossRef] [Green Version]
  28. Wülser, J.P.; Lemen, J.R.; Tarbell, T.D.; Wolfson, C.J.; Cannon, J.C.; Carpenter, B.A.; Duncan, D.W.; Gradwohl, G.S.; Meyer, S.B.; Moore, A.S.; et al. Telescopes and Instrumentation for Solar Astrophysics; Fineschi, S., Gummin, M.A., Eds.; SPIE: Bellingham, WA, USA, 2004; Volume 5171, pp. 111–122. [Google Scholar]
  29. Thompson, W.T.; Davila, J.M.; Fisher, R.R.; Orwig, L.E.; Mentzell, J.E.; Hetherington, S.E.; Derro, R.J.; Federline, R.E.; Clark, D.C.; Chen, P.T.; et al. COR1 inner coronagraph for STEREO-SECCHI. In Innovative Telescopes and Instrumentation for Solar Astrophysics; SPIE: Bellingham, WA, USA, 2003; Volume Vulume 4853. [Google Scholar]
  30. Lemen, J.R.; Akin, D.J.; Boerner, P.F.; Chou, C.; Drake, J.F.; Duncan, D.W.; Edwards, C.G.; Friedlaender, F.M.; Heyman, G.F.; Hurlburt, N.E.; et al. The Atmospheric Imaging Assembly (AIA) on the Solar Dynamics Observatory (SDO). Sol. Phys. 2012, 275, 17–40. [Google Scholar] [CrossRef] [Green Version]
  31. Morgan, H.; Druckmüller, M. Multi-Scale Gaussian Normalization for Solar Image Processing. Sol. Phys. 2014, 289, 2945–2955. [Google Scholar] [CrossRef] [Green Version]
  32. Bobra, M.G.; Sun, X.; Hoeksema, J.T.; Turmon, M.; Liu, Y.; Hayashi, K.; Barnes, G.; Leka, K.D. The Helioseismic and Magnetic Imager (HMI) Vector Magnetic Field Pipeline: SHARPs - Space-Weather HMI Active Region Patches. Sol. Phys. 2014, 289, 3549–3578. [Google Scholar] [CrossRef] [Green Version]
  33. Lin, R.P.; Dennis, B.R.; Hurford, G.J.; Smith, D.M.; Zehnder, A.; Harvey, P.R.; Curtis, D.W.; Pankow, D.; Turin, P.; Bester, M.; et al. The Reuven Ramaty High-Energy Solar Spectroscopic Imager (RHESSI). Sol. Phys. 2002, 210, 3–32. [Google Scholar] [CrossRef]
  34. Dere, K.P.; Landi, E.; Mason, H.E.; Monsignori Fossi, B.C.; Young, P.R. CHIANTI—an atomic database for emission lines. Astron. Astrophys. Suppl. Ser. 1997, 125, 149–173. [Google Scholar] [CrossRef] [Green Version]
  35. Landi, E.; Del Zanna, G.; Young, P.R.; Dere, K.P.; Mason, H.E.; Landini, M. CHIANTI-An Atomic Database for Emission Lines. VII. New Data for X-Rays and Other Improvements. Astrophys. J. Suppl. Ser. 2006, 162, 261. [Google Scholar] [CrossRef] [Green Version]
  36. Zhang, Y.; Tan, B.; Karlický, M.; Mészárosovxax, H.; Huang, J.; Tan, C.; Simões, P.J.A. Solar Radio Bursts with Spectral Fine Structures in Preflares. Astrophys. J. 2015, 799, 30. [Google Scholar] [CrossRef] [Green Version]
  37. Yan, Y.; Liu, Y.; Akioka, M.; Wei, F. The Magnetic Topological Structure and Energy of the 2B/X2 Flare in NOAA 8100. Sol. Phys. 2001, 201, 337–355. [Google Scholar] [CrossRef]
  38. Wang, R.; Yan, Y.H.; Tan, B.L. Three-Dimensional Nonlinear Force-Free Field Reconstruction of Solar Active Region 11158 by Direct Boundary Integral Equation. Sol. Phys. 2013, 288, 507. [Google Scholar] [CrossRef] [Green Version]
  39. Tian, L.R.; Liu, Y.; Wang, J.X. the Most Violent Super-active Region in the 22nd and 23rd Cycles. Sol. Phys. 2006, 209, 361–374. [Google Scholar] [CrossRef]
  40. Berger, M.A.; Field, G.B. The topological properties of magnetic helicity. J. Fluid Mech. 1984, 147, 133–148. [Google Scholar] [CrossRef] [Green Version]
  41. Démoulin, P.; Berger, M.A. Magnetic Energy and Helicity Fluxes at the Photospheric Level. Sol. Phys. 2003, 215, 203–215. [Google Scholar] [CrossRef]
  42. November, L.J.; Simon, G.W. Precise Proper-Motion Measurement of Solar Granulation. Astrophys. J. 1988, 333, 427–442. [Google Scholar] [CrossRef]
  43. Chae, J. Observational Determination of the Rate of Magnetic Helicity Transport through the Solar Surface via the Horizontal Motion of Field Line Footpoints. Astrophys. J. 2001, 560, L95–L98. [Google Scholar] [CrossRef]
  44. Zhang, M.; Flyer, N.; Low, B.C. Magnetic Field Confinement in the Corona: The Role of Magnetic Helicity Accumulation. Astrophys. J. 2006, 644, 575. [Google Scholar] [CrossRef] [Green Version]
  45. Pevtsov, A.A.; Canfield, R.C.; Metcalf, T.R. Latitudinal Variation of Helicity of Photospheric Magnetic Fields. Astrophys. J. 1995, 440, L109–L112. [Google Scholar] [CrossRef]
  46. Tian, L.R.; Alexander, D. Role of Sunspot and Sunspot-Group Rotation in Driving Sigmoidal Active Region Eruptions. Sol. Phys. 2006, 233, 29–43. [Google Scholar] [CrossRef]
  47. Guo, J.; Zhang, H.Q.; Chumak, O.V.; Liu, Y. A Quantitative Study on Magnetic Configuration for Active Region. Sol. Phys. 2006, 237, 25–43. [Google Scholar] [CrossRef]
  48. Chandra, R.; Schmieder, B.; Aulanier, G.; Malherbe, J.M. Evidence of Magnetic Helicity in Emerging Flus and Associated Flare. Sol. Phys. 2009, 258, 53–67. [Google Scholar] [CrossRef] [Green Version]
  49. LaBonte, B.J.; Georgoulis, M.K.; Rust, D.M. Survey of Magnetic Helicity Injection in Regions Producing X-class Flares. Astrophys. J. 2007, 671, 955. [Google Scholar] [CrossRef] [Green Version]
  50. Zhang, Y.; Liu, J.H.; Zhang, H.Q. Relationship between Rotating Sunspots and Flares. ApJ 2006, 644, 575. [Google Scholar] [CrossRef] [Green Version]
  51. Zhang, Q.M.; Cheng, J.X.; Dai, Y.; Tam, K.V.; Xu, A.A. Energy Parition in a Confined Flare with an Extreme-ultraviolet Late Phase. Astron. Astrophys. 2021, 650, A88. [Google Scholar] [CrossRef]
  52. Vourlidas, A.; Buzasi, D.; Howard, R.A.; Esfandiari, E. Mass and Energy Prperties of LASCO CMEs. In Solar Variability: From Core to Outer Frontiers, Proceedings of the 10th European Solar Physics Meeting, Prague, Czech Republic, 9–14 September 2002; Wilson, A., Ed.; ESA SP-506; ESA Publications Division: Noordwijk, The Netherlands, 2002; Volume 506, pp. 91–94. [Google Scholar]
  53. Sun, X.; Bobra, M.G.; Hoeksema, J.T.; Liu, Y.; Li, Y.; Shen, C.; Couvidat, S.; Norton, A.A.; Fisher, G.H. Why Is the Great Solar Active Region 12192 Flare-rich but CME-poor. Astrophys. J. 2015, 804, L28. [Google Scholar] [CrossRef] [Green Version]
  54. Jing, J.; Liu, C.; Lee, J.; Ji, H.; Liu, N.; Xu, Y.; Wang, H. Statistical Analysis of Torus and Kink Instabilities in Solar Eruptions. Astrophys. J. 2018, 864, 138. [Google Scholar] [CrossRef] [Green Version]
  55. Filippov, B. Failed Prominence Eruption Near 24 Cycle Maximum. Mon. Not. R. Astron. Soc. 2020, 494, 2166–2177. [Google Scholar] [CrossRef]
  56. Guo, Y.; Ding, M.D.; Schmieder, B.; Li, H.; Török, T.; Wiegelman, T. Driving Mechanism and Onset Condition of a Confined Eruption. Astrophys. J. 2010, 725, L38. [Google Scholar] [CrossRef]
  57. Amari, T.; Canou, A.; Aly, J.J. Characterizing and Predicting the Magnetic Environment Leading to Solar Eruption. Nature 2014, 514, 465–469. [Google Scholar] [CrossRef]
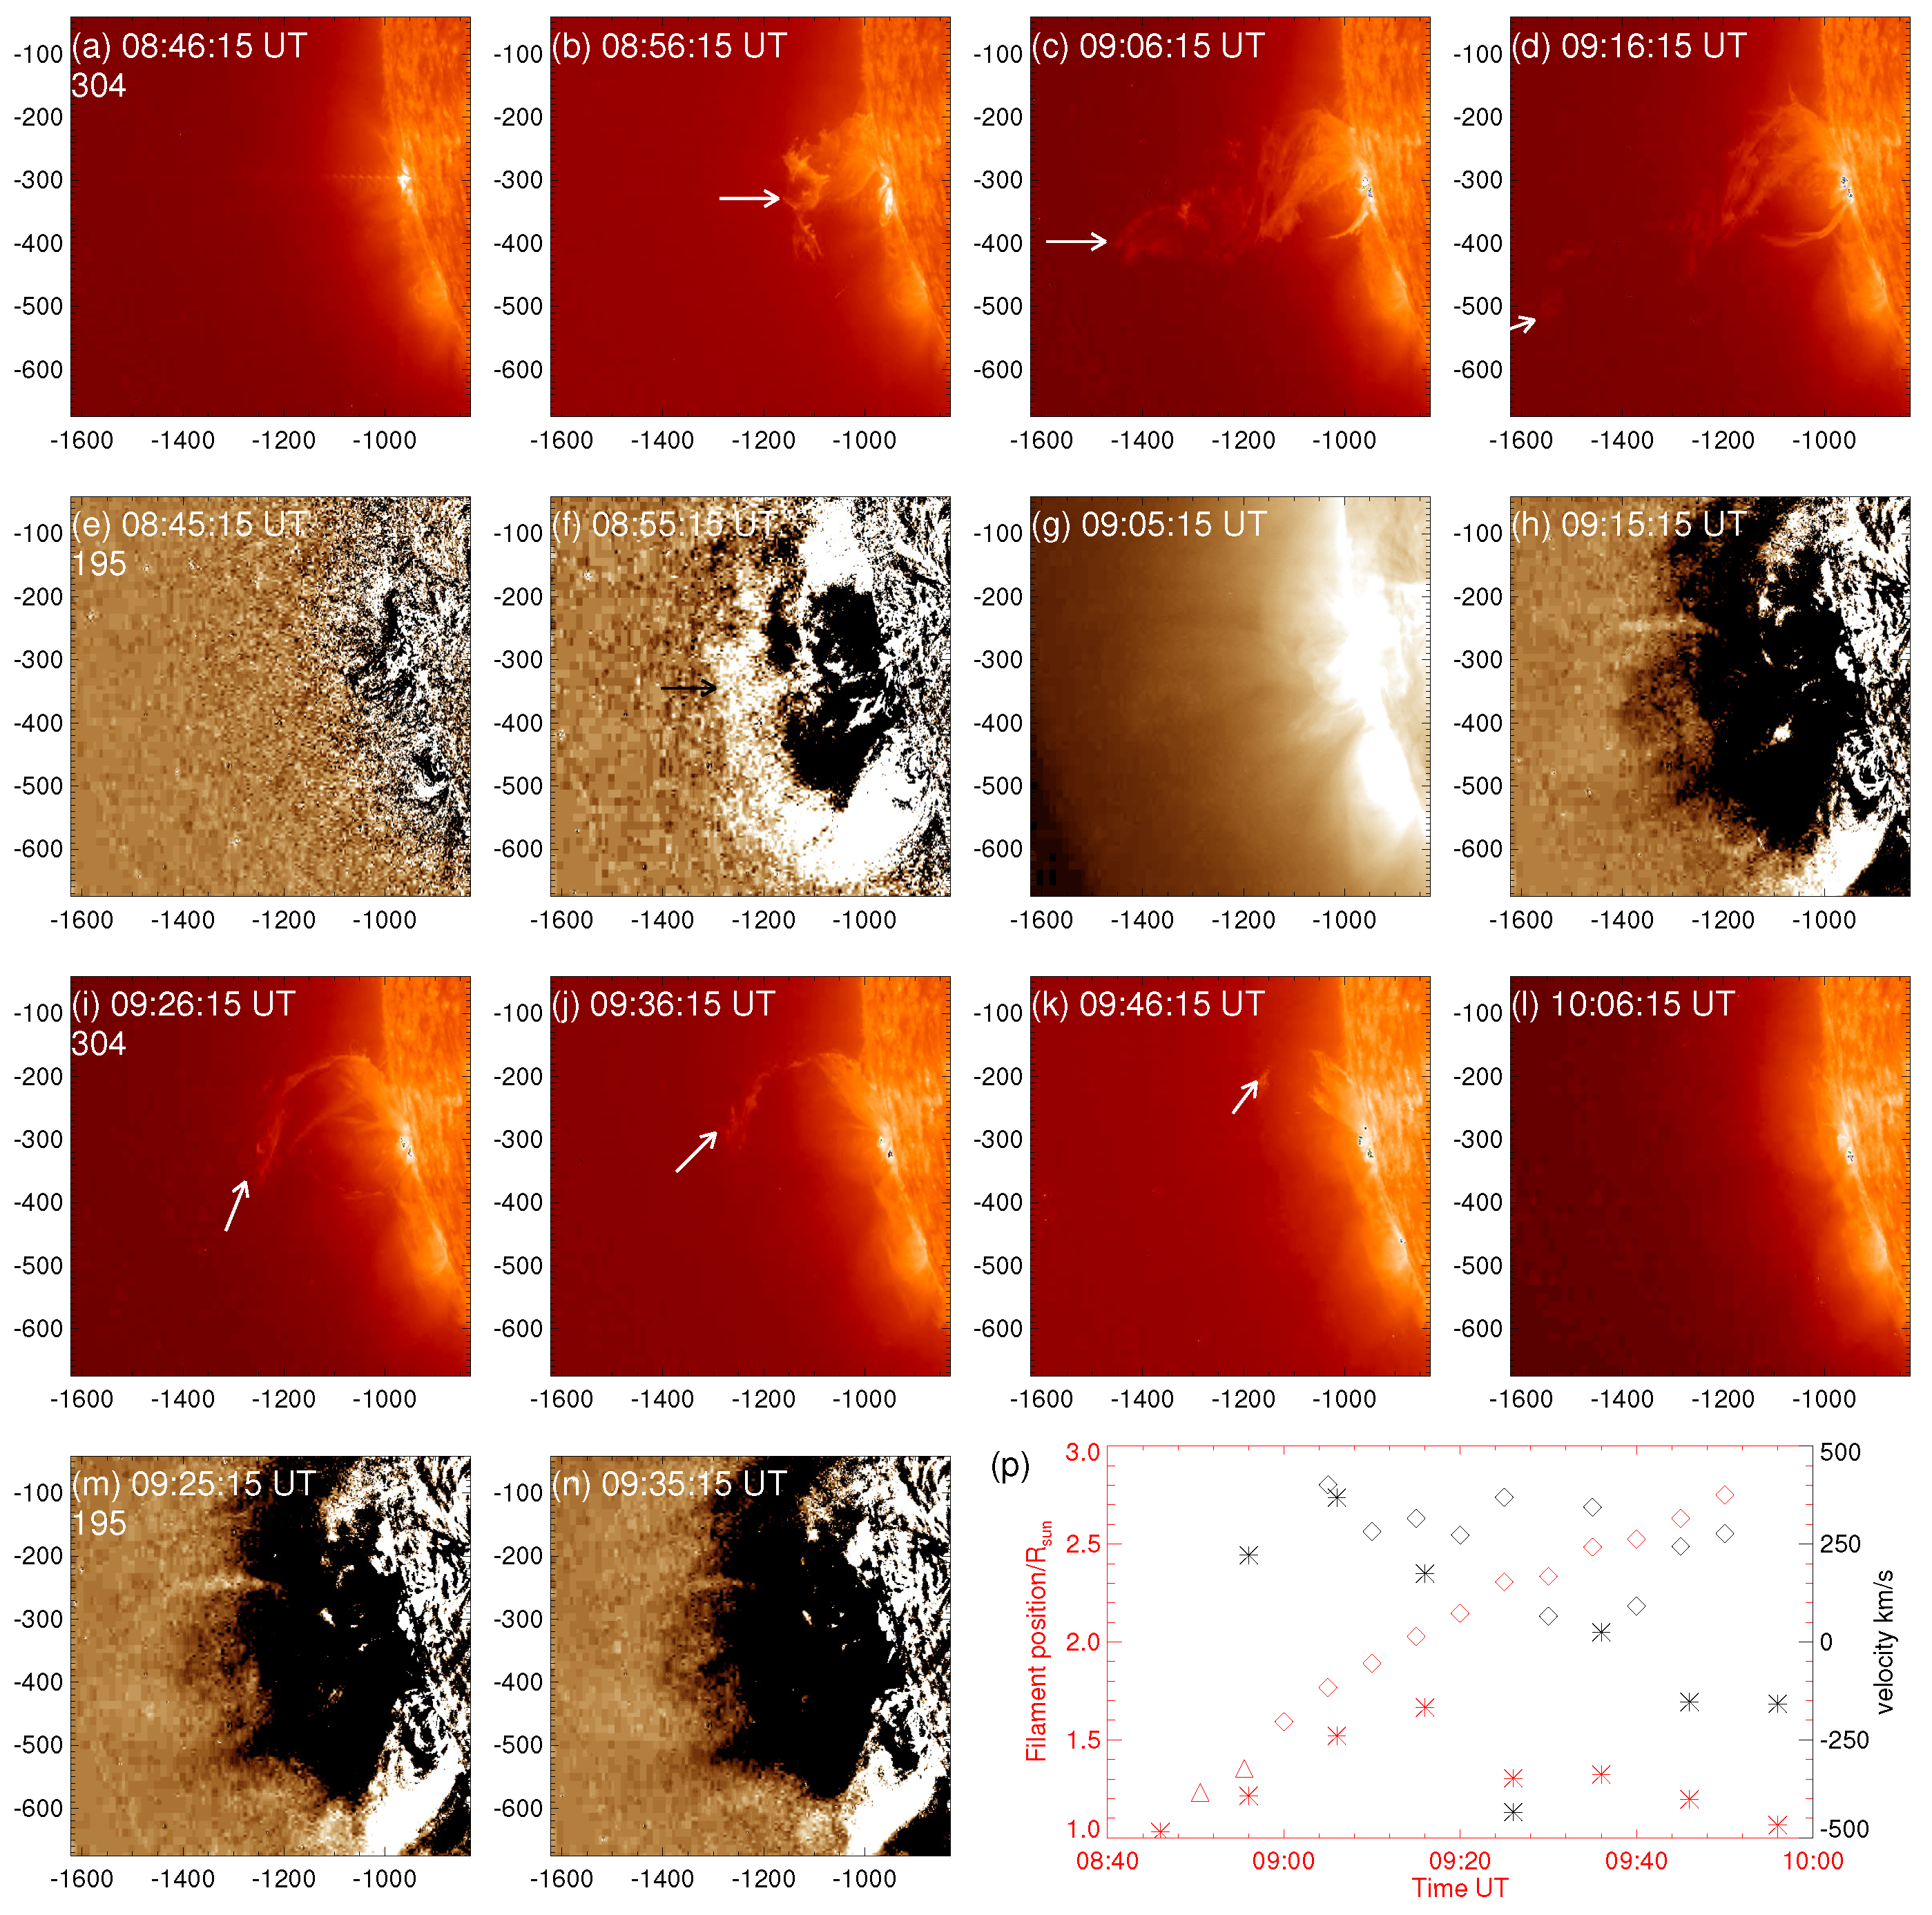
Figure 1. Dynamical evolution of the filament eruption observed by STEREO-A. The first (Panel ad) and third row (Panel il) is 304 Å image. The second (Panel e, f, and h) and fourth (Panel mn) is base difference image of 195 Å, with one direct image shown in (Panel g). The unit of the X- and Y-axis is the acrsecond from the solar center. Panel p: red stars represent the position of the top position of the filament material observed by EUVI A as indicated by arrows, and black stars indicate the velocity deduced from the red stars; red diamonds represent the position of the bright front observed by COR1 along the black line as shown in Figure 2h and black diamonds indicate the velocity deduced from the red diamonds; the red triangles indicate the position of the leading edge of the coronal transient as indicated by black arrow in Figure 1f.
Universe 07 00405 g001
Figure 2. The first (Panel ad) and third row (Panel i) is the running difference brightening image, and the second (Panel eh) and fourth row (Panel j) is the mass distribution image recorded by STEREO-A COR1/COR2. The unit of all images is the solar radius from the solar center. (Panel k) shows the mass profile along the black line as shown in panel h.
Universe 07 00405 g002
Figure 3. (a) The scale image is the line of sight magnetic field, with black for negative polarity and white for positive polarity. Blue contour outlines the profile of the filament in 171 Å image; (b) AIA 171 Å image shows the morphology of the active region. Three vertical lines show the filament slits, which were studied in detail in the following. Green squareness outlines the area where the initial EUV brightening occurred. White dotted line indicates the solar limb from STEREO-A point of view; (c) AIA 304 Å image of the filament as outlined by the red box in panel b; (d) AIA 193 Å image of the filament as outlined by the red box in panel b.
Universe 07 00405 g003
Figure 4. (a) GOES X-ray intensity profile at wavelength of 1–8 Å (black curve) and temperature profile deduced from GOES flux (red curve); (b) RHESSI time profile at 3–6, 12–50 KeV; (c) SDO/AIA EUV light curve in cool line of 304, 171, 193 and 211 Å; (d) SDO/AIA EUV light curve in hot line of 335, 094, and 131 Å; the five vertical lines indicate the following time: 1. expansion of the anchored leg; 2. appearance of the initial EUV brightening; 3. erupting of the erupted leg; 4. GOES flare begin; 5. GOES flare peak.
Universe 07 00405 g004
Figure 5. The dynamic evolution observed by SDO at 193 Å wavelength. (Panel ac) are direct images. (Panel dl) are running difference images. Red curves outline the profile of the front edge of the erupted filament. The green arrows indicate the filament material which erupted to remote place. Contours represent the RHESSI source region. Two animations of this figure is available in the online journal. The animation (aia_193.mpg) begins at approximately 08:40 UT and ends at around 11:00 UT. It shows the whole dynamic evolution of the filament eruption and falling back of the filament material. Note that the cadence is 12 s for the eruption periods (from 08:40 to 09:30) but is 1 min from 09:30 to 11:00 UT. The real-time duration of the animation is 16 s. Another animation (aia_4wavelength.mpg) is composited of images with 304, 171, 193 and 131 Å. It begins at approximately 07:30 UT and ends at around 09:40 UT. It shows multi-wavelength observations of the filament eruption. The cadence is 5 min for the pre-eruption periods (from 07:30 to 08:40) but is 12 s from 08:40 to 09:40 UT. (Two animations of this figure is available.)
Universe 07 00405 g005
Figure 6. (Panel ac) are time-distance diagrams along the three slits as indicated in Figure 3. Green curves outline the profile of the upper limb of the erupted filament. Details can be found in text.
Universe 07 00405 g006
Figure 7. First column (Panel ad): SDO/HMI vector magnetograms of active region NOAA 10387 from its early emergence to the filament eruption. The longitudinal component of the magnetic field is represented by gray-scale patches. White (black) represents positive (negative) polarity fields. The transverse components of the field are shown with gray arrows, with lengths proportional to the relative field strength. Red arrows indicate the emergence of opposite polarities along the PIL; second column (Panel eh): AIA 171 Å image. Red arrows in upper two rows indicate the EUV brightening spatio-temporal with the opposite polarities emergence and cancellation along the PIL. Red arrows in third row indicate dark thread along the PIL. Red diamonds outline the profile of the filament and green pluses indicate the initial EUV brightening.
Universe 07 00405 g007
Figure 8. (a)–(h) line of sight magnetic field. This figure shows the dynamic evolution of the magnetic field in the core region, which is indicated by white box in Figure 7d.
Universe 07 00405 g008
Figure 9. NLFFF extrapolation of 25 December 2011 at 08:36 UT. The yellow lines outline the structures, which are consistent with the two small filaments. The red lines represent the overlaying magnetic field. Blue lines are the opened magnetic field, and orange lines represent other closed magnetic field.
Universe 07 00405 g009
Figure 10. Temporal evolution of (a) unsigned flux (black line), negative flux (plus) and positive flux (diamond); (b) transport rate of magnetic helicity; (c) accumulated helcity; (d) α t o t a l (black diamond), E f r e e (red star) and GOES flux (blue curve).
Universe 07 00405 g010
Figure 11. (a) Magnetic flied of active region NOAA 10387 on Dec 25, 08:36 UT, with red contour for the flare region at the peak time, blue contour for PIL and yellow contour for the intersection of the first two; (b) the height profile of the decay index above the FPIL region as outlined by yellow contour in Panel a.
Universe 07 00405 g011
Publisher’s Note: MDPI stays neutral with regard to jurisdictional claims in published maps and institutional affiliations.