Article

Cluster Membership of Galaxies Using Multi-Layer Perceptron Neural Network

Department of Earth Sciences, National Taiwan Normal University, No. 88, Sec. 4, Tingzhou Rd., Wenshan District, Taipei 11677, Taiwan
*
Author to whom correspondence should be addressed.
Universe 2022, 8(7), 339; https://doi.org/10.3390/universe8070339
Submission received: 20 May 2022 / Revised: 16 June 2022 / Accepted: 16 June 2022 / Published: 21 June 2022
(This article belongs to the Section Galaxies and Clusters)

Abstract

:
In this study, we report systematic investigations of the membership of galaxies inside a cluster using a machine learning (ML) neural network. By directly assigning the membership, rather than estimating the galaxy redshift as an intermediate step, we optimize the network structure to determine the membership classification. The cluster membership is determined by the Multi-Layer Perceptron (MLP) neural network trained using various observed photometric and morphological parameters of galaxies measured from I and V band images taken with the Subaru Suprime-Cam of 16 clusters at redshift ∼0.15–0.3. This dataset enables MLP to be applied to cluster galaxies in a wide range of cluster-centric distances, well into a field, and a wide range of galaxy magnitudes, into a regime of dwarf galaxies. We find: (1) With only two bands, our MLP model can achieve relatively high overall performance, obtaining high scores simultaneously in both the purity and the completeness of the classification; (2) The performance of MLP can be improved by including non-SED (Spectral Energy Distribution) parameters; (3) Faint galaxies are harder to assign their memberships even using our MLP model, though the performance is more robust than other photometric methods. ML can effectively combine various conventional methods of finding cluster membership, making it inherit advantages of each method. The overall good performance of the ML membership is vital to cluster studies in the era of faint and data-intensive galaxy survey in which the complete spectroscopic observation is out of reach.

1. Introduction

Clusters of galaxies offer many exciting astronomical research opportunities in a wide variety of scientific interests, including cosmology, dark matter, large-scale structure, gravitational lensing, and AGN (Active Galactic Nucleus). Clusters of galaxies also provide a unique project for studying the evolution and formation of galaxies—a big topic of current astronomical interest. Observations of one cluster will provide us with a powerful method to assemble a large galaxy sample, with well-controlled galaxy environments, and of one particular epoch of the Universe, which is crucial when we later compare galaxies over various galaxy environments and epochs, and when we compare them with the predictions of various stellar population synthesis models.
To assemble these controlled samples, and to determine the properties of cluster galaxies, the contaminating effect from superposed galaxies is a serious issue, although the degree of the effect is dependent on cluster redshifts, galaxy magnitudes, and various other galaxy characteristics. The effect is generally small for the bright galaxies, but it becomes increasingly larger for the fainter populations—a class of objects that may hold a key to our understanding of the elusive dark matter (e.g., Refs. [1,2]). Decoupling the background-foreground sources is also important for the studies involving strong and weak lensing, because these studies typically require the separation of cluster member galaxies from background lensed objects (e.g., Refs. [3,4,5]).
Despite the importance of identifying the cluster members, separating the member galaxies from background or foreground is not an easy task, particularly when it must be conducted effectively and efficiently in the era of big data generated by the advent of the extremely large detectors (e.g., Hyper-Suprime-Cam (HSC): Ref. [6]), data-intensive survey, and the dedicated survey telescopes (e.g., Large Synoptic Survey Telescope (LSST): Ref. [7]). Spectroscopic redshifts are often regarded as an ideal method to identify the cluster memberships in regards to the accuracy. However, it is impossible to obtain spectroscopic redshifts with high completeness for many galaxies, particularly including faint populations even inside one very nearby cluster, let alone in many clusters in the non-local Universe. Because of this critical nature of the incompleteness, all spectroscopic investigations of galaxy population inside cluster, such as the studies of the galaxy luminosity function, even the ones in the local Universe, are forced to employ an approach that uses a ‘statistical estimate’ of the number of cluster galaxies based on a small sample of spectroscopically observed galaxies (e.g., Refs. [8,9,10]).
Photometric redshift (photo-z) is sometimes used to reduce the background contamination. Unfortunately, even by using photo-z, the background contamination remains at a non-negligible level, at an increasing level towards a bluer or fainter population, because of rapidly increasing errors in photo-zs in these galaxies. This contamination will often lead to a variety of false positives unless an additional statistical analysis on top of photo-z is applied (e.g., Ref. [11]). The contamination of the background becomes even larger in the case of using photo-zs without near-infrared bands nor U band.
Meanwhile, several studies have developed a technique to establish cluster membership using galaxy ‘morphological’ criteria, such as surface brightness (e.g., Refs. [12,13]). Unfortunately, this method works reasonably only for very low surface brightness galaxies inside very nearby clusters, but it becomes problematic for intermediate or high surface brightness galaxies [13]. Even for the very low surface brightness galaxies, for which the method works most effectively, the selected members still contain ∼5–10% of background objects.
Unfortunately, each of these individual non-spectroscopic methods have their limitations and weaknesses, and therefore they are often not satisfactory for the desired investigation, most notably, for the study involving faint galaxies. It is, therefore, of most importance to develop an efficient and accurate non-spectroscopic scheme of determining the cluster membership that can be applied to various studies.
Machine learning (ML) can be a revolutionary approach to combining all of this available non-spectroscopic information effectively and in a coherent manner, which is a much-needed breakthrough for the coming data-intensive surveys. ML can take advantage of, and combine together, a vast amount of various information, which was separately exploited piece by piece in the conventional cluster membership methods, such as the red-sequence method (e.g., Ref. [4]), methods based on photometric redshifts (e.g., Ref. [14]), other color selection methods of member galaxies (e.g., Ref. [3]), or surface brightness techniques to decouple the background galaxies [13].
Despite the strong possibility of ML, only a few such applications have previously been explored, and they were typically for a very particular type of object, such as Quasars at high redshift (e.g., Refs. [15,16]). We hardly have any previous research to apply this method for the generic cluster membership. Recently, Angora [17] showed an important result of the ML galaxy-membership using image-based deep learning. They reported purity-completeness scores of more than 90% for bright galaxies. This result is encouraging by showing us the promising possibility of the ML approach for decoupling cluster galaxies from background galaxies. Unfortunately, their method, however, used as many as 12 (optical and IR) band images from HST, which made the method less ‘portable’ to more generally available telescopes and datasets. Furthermore, because of the small field-of-view (fov) of the HST cameras, the investigation typically covers only a central region of a cluster, making the method harder to be used for the more generic study of cluster galaxies. Finally, perhaps by the restriction from the small fov of HST, their cluster sample went relatively far in the redshift up to z∼0.6, which forced the investigation limited to intrinsically bright galaxies.
Here we investigate the cluster membership using the Multi-Layer Perceptron (MLP) neural network. By directly assigning the membership, rather than estimating the galaxy redshift as an intermediate step, we can explore a network structure to use all available information optimally for the membership classification. Photometric and morphological information is extracted from Subaru Suprime-Cam archival data. This dataset enables MLP to apply to cluster galaxies in a wide range of cluster-centric distances, well into a field, and a wide range of galaxy magnitudes, into a regime of dwarf galaxies.
The paper is organized as follows. In Section 2, we describe our data and method, and Section 3 summarizes our results. Throughout the paper, we use H o = 70 km s 1 Mpc 1 , Ω m = 0.3, and Ω Λ = 0.7, unless otherwise stated.

2. Methods

2.1. Data

The Suprime-Cam optical broad-band images were retrieved from the Subaru-Mitaka-Okayama-Kiso Archive (SMOKA) [18]. The camera covers a 34 × 27 field of view with a pixel scale of 0 . 202. For flat-fielding, distortion correction, sky subtraction, and image stacking, the reduction software developed by Yagi [19] was used. We refined the astrometry using the USNO-A2 catalog with positional uncertainties less than ∼0 . 2.
The photometry was calibrated to the Vega system using SDSS (Sloan Digital Sky Survey) dr8, in which Jordi and Ammon [20] was used for the transformations from SDSS bands. For pointings without corresponding SDSS coverage, Landolt standards [21] were used if they were observed. Data taken under possible non-photometric conditions were discarded unless we could perform a direct calibration using standard stars distributed all over the target cluster image itself. The Galactic extinction was corrected using the extinction map of Schlafly and Finkbeiner [22]. We made no attempt to apply an individual k correction, since the k correction to our data is expected to be comparable to the typical error on the galaxy photometry in the bulk of our clusters: at our redshift range (z∼0.15–0.3), the k correction is estimated to be ∼0.1 for I band [23]. Suprime-Cam I band images were observed in SDSS i filter while the V band images were observed in Johnson V filter. We used only images with less than ∼1 . 2 seeing.

2.2. Galaxy Measures

From a list of objects detected via SExtractor [24] in the I band, galaxies were selected on the basis of CLASS_STAR versus MAG_AUTO diagram. We used MAG_AUTO and aperture magnitudes with radius 1 for total magnitudes and colors, respectively. The initial galaxy detection was performed with DETECT_THRESH = 2 and DETECT_MINAREA = 4. MAG_AUTO from SExtractor provides an estimate of the total magnitude of a galaxy by integrating pixels with an adaptively scaled aperture derived from Kron ellipse [25]. CLASS_STAR is the neural network trained standard star/galaxy classifier output from SExtractor where the value close to 1 represents the higher chance of being a star. For more details of other standard outputs from SExtractor, please refer to [24]. We estimated the overall accuracy of galaxy magnitude as a conservative measure, approximately 0.1 mag considering various fundamental uncertainties associated with the galaxy photometry.
The morphology and light profile of galaxies were objectively characterized by several measures. CONC is a concentration index of the galaxy light profile. There are many variants of concentration measures characterizing the galaxy profile (e.g., Refs. [26,27,28,29,30,31,32]), in which the concentration (or ‘inverse’ concentration) is defined as the ratio of the light inside a certain inner radius to the light inside a certain outer radius or the ratio between the inner and the outer radii. We used the radius ratio, rather than the flux ratio, taking Petrosian 50 and 90 percent radii as the inner and outer radii, respectively, because we found that these radii were relatively robust against various image quality and various analyses thresholds for the typical galaxy light profile.
The asymmetry was measured by subtracting the 180-degree rotated image from the original unrotated one, followed by adding, as well as normalizing, all residual signals above zero. The ellipticity was defined by the ratio of a semi-major and semi-minor axis of the light profile, while the semi-major and semi-minor axis were determined by the maximum and minimum spatial rms of the profile, respectively (e.g., Ref. [33]). ISOAREA_IMAGE was the extracted area of a galaxy in pixel, while FWHM_IMAGE was the full-width half maxima assuming a Gaussian core. For further details of the measures, please see [34].

2.3. Artificial Intelligence

For the ML engine, we used TensorFlow [35]. TensorFlow is originally developed by Google’s Machine Intelligence research organization to conduct machine learning and deep neural networks research, but the system is general enough to apply to a wide range of research fields. TensorFlow can also handle multiple parallel GPU processing, in addition to multiple CPUs, to make the deep and wide neural network more efficient. In the end, TensorFlow 2.3.0 was used on CUDA 10.1 and cuDNN 7.6.5 with GPU mode (RTX 2070 Super with 8G VRAM). We employed the parameter-based neutral network using MLP (e.g., Ref. [36]). For the activation function, the ReLU (Rectified Linear Unit) function [37] was used for hidden layers, while the sigmoid function [38] was used for the output layer.
The weight was optimized by the Adam optimizer with the back-propagation [39]. To avoid ‘over-fitting’, in which the model is trained too much to fit the training data, the best training epoch was estimated using Early-Stopping [40] with the patience value of 10. The architecture of the optimal MLP model was in the end automatically searched by Keras tuner [41].

2.4. Training

We used the spectroscopic redshifts available at NED (NASA/IPAC Extragalactic Database) for the model training. The NED spectroscopic redshifts and our SExtractor generated catalog were matched with a matching radius with 1 . 5 and manually checked and cleaned. The NED database is a rather heterogeneous dataset with various astrometric accuracy, therefore the optimal matching radius was determined by a plot of the number of matched objects versus the matched distance. Among all SExtractor-generated list of galaxies, galaxies with available NED spectroscopic redshifts were selected for the training and validation sample.
Our training and validation (test) samples were constructed from 16 clusters at z∼0.15–0.3 that were observed by Suprime-Cam in I and V optical bands and with NED spectroscopic redshifts of more than 20 galaxies inside the field-of-view of each cluster image. This particular redshift range was chosen so that we could obtain deep photometry of faint galaxies up to M* + 7 while keeping a large physical field-of-view (up to ∼4 Mpc), namely, we could achieve a crucial balance between the depth and the spatial coverage of observation. To avoid any unwanted convergence of the fit, the order of galaxies was randomized in the combined 16 cluster dataset, as well as checking for any strong (more than ∼70%) class imbalance [42]. The total number of galaxies used for training and validation was 5624. The dataset was then split randomly into training and validation samples by the ratio of 7:3, respectively. The list of clusters is summarized in Table 1.
We have tested various neural network models, searching for the best classification performance, by varying various fitting elements and conditions, such as network architectures, input galaxy samples, combinations of input measures, cluster membership definitions, and various validation apertures from the cluster center.
The galaxy membership to each cluster for the training and validation was determined using the NED spectroscopic redshifts, as those within a certain velocity with respect to the cluster rest frame velocity. We used a standard 3000 kms 1 [3,43,44,45] for our best model. We have also tested ranges of 3000, 4000, 5000, and 6000 kms 1 with respect to the cluster velocity to check any fitting trend of our model. Input measures of each galaxy were normalized using z-score normalization before feeding them into the neural network.
The neural network algorithms are stochastic by design. This is particularly so when the TensorFlow is running with GPU. We therefore repeated the fitting 50 times with the same configuration and selected the best model for the bulk of our analyses or conducted the statistical analyses for all 50 trials, if needed.

3. Results

3.1. Optimizing the Model—Experiments

To evaluate the performance of the MLP model, we have used the following standard statistical estimators for binary classifications: purity, completeness, accuracy, F1-score, and AUC. (For more details of these measures, please refer to, e.g., Refs. [17,46]). The purity (PU), also known as precision or correctness, measures the correctness of the selected (predicted) cluster members by the neural network. It is defined as the number of true cluster members among the predicted members divided by the number of total predicted members, or equivalently, PU = TP/PP, where TP and PP are the true and predicted positives, respectively, in the confusion matrix for the binary classification [46]. The completeness (CO), also known as recall, sensitivity, or true positive rate, measures the completeness of the selected cluster members by the neural network. It is defined as the number of true cluster members among predicted members divided by the number of total real members in the entire sample, or CO = TP/P, where P is the real positive in the confusion matrix. The accuracy (ACC) is defined as the number of correctly predicted cluster or non-cluster members divided by the number of the total sample, or ACC = (TP + TN)/S, where TN and S are true negative and total sample, respectively. The F1-score (F1), also known as F1-measure or the Sorensen–Dice coefficient [47], is the harmonic mean of PU and CO, defined as F1 = 2PU × CO/(PU + CO). The AUC (Area Under the Curve) is the area under the ROC (Receiver Operating Characteristic) curve. The ROC curve is a plot in which FPR (false positive rate) is plotted against TPR (true positive rate). FPR can be calculated via the false positive divided by the total real negative in the confusion matrix, while TPR is identical to CO. The higher AUC score means the better performing model, with AUC = 1.0 representing the maximum, i.e., the perfect classifying model, while the model with AUC = 0.5 is the random classification, i.e., with no real classification power.
Figure 1 shows the ROC curves for various MLP architectures. The ‘Optimal’ size MLP model consists of 17 × 35 × 35 × 1 network architecture, i.e., the input layer consists of 17 neurons, the final output layer consists of 1 neuron, and 2 intermediate hidden layers consist of 35 neurons each. ‘Small’, ‘Large’, and ‘VeryLarge’ models comprise 17 × 3 × 1, 17 × 100 × 100 × 100 × 1, and 17 × 100 × 100 × 100 × 100 × 1, respectively. Here, the definition of the cluster line-of-sight boundary is fixed to 3000 kms 1 boundary, and all galaxies in cluster images irrespective of the apparent two-dimensional cluster-centric distance are used for the training. To check the statistical consistency, the best of 50 trials (left panel) is compared to the median of 50 trials (right panel).
Figure 1 indicates that the size of the network, in general, does not significantly affect the performance of the MLP model at least in our case, though our ‘Optimal’ architecture, which is determined using the Keras tuner, is performing slightly better. This is partially due to the fact that–unless the model is extremely small or large–the size of the model architecture can be compensated by the number of the iteration, i.e., the fitting epoch. Namely, even for a relatively small model, we can usually achieve the model performance comparable to a larger model if we iterate the fitting longer. This is consistent with the final epoch of each architecture: 226, 31, 17, and 14, respectively for ‘Small’, ‘Optimal’, ‘Large’, and ‘VeryLarge’, clearly anti-correlated to the size of the model architecture.
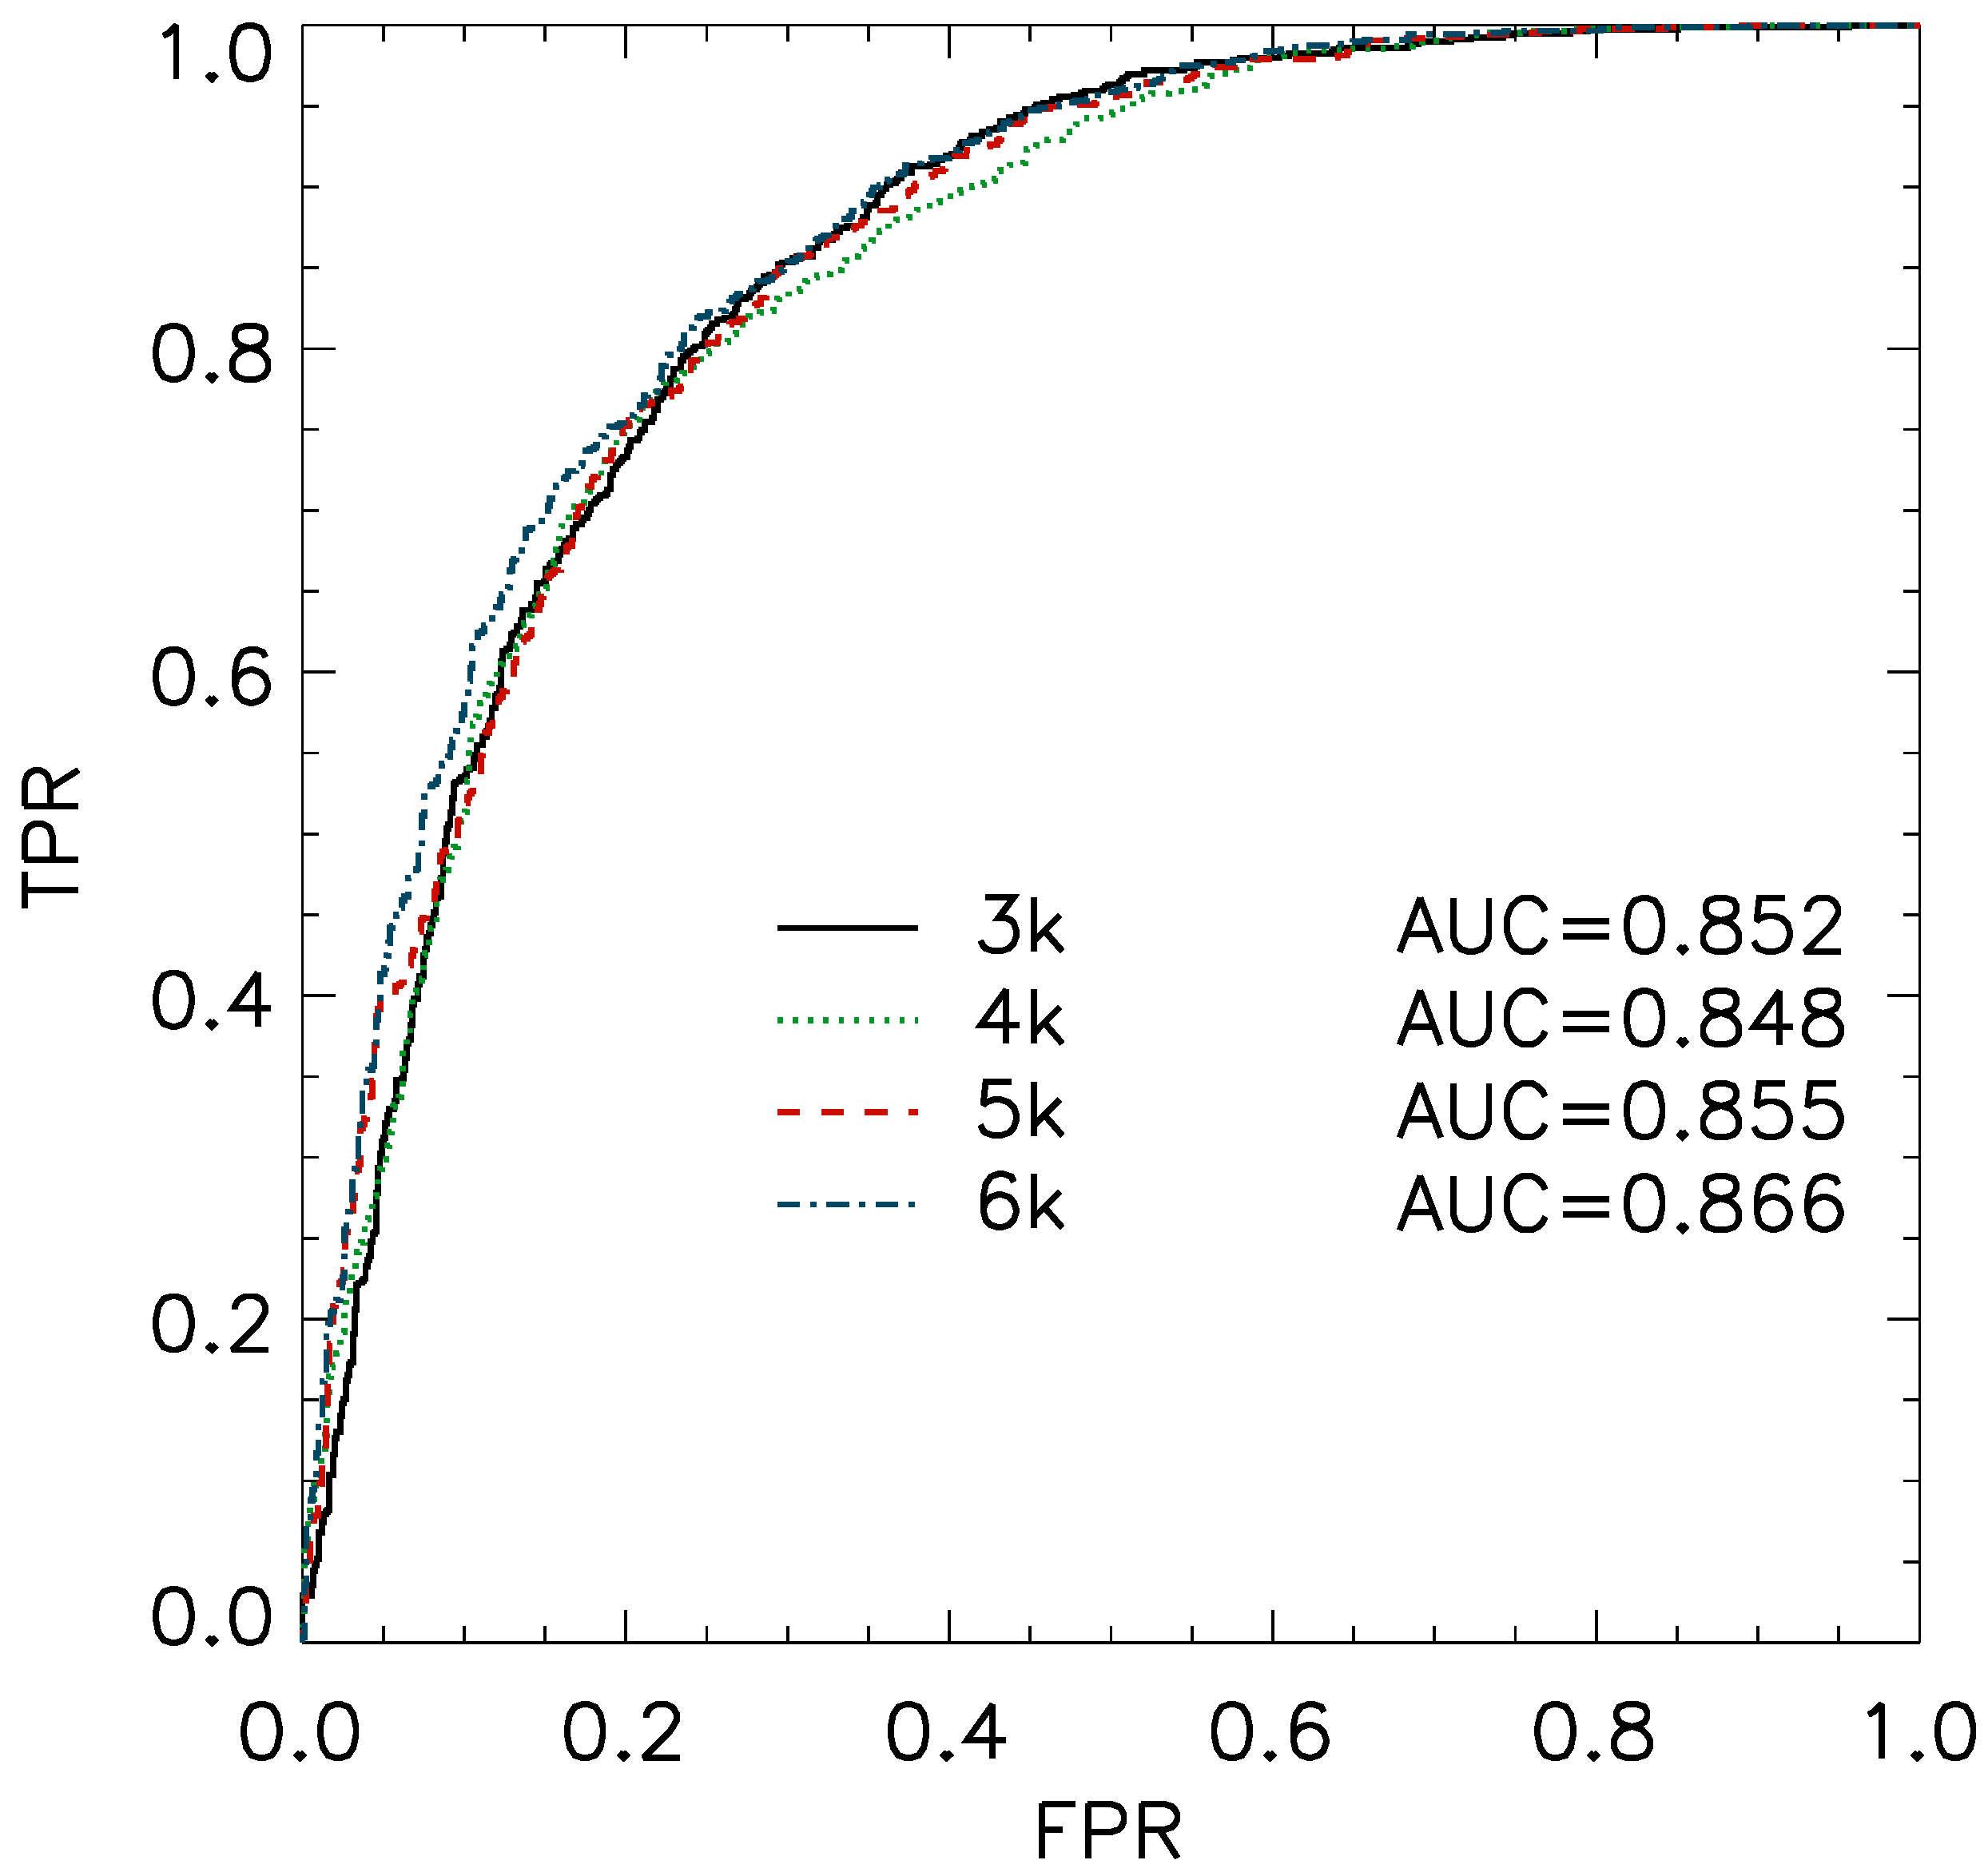
Figure 2 shows the ROC curves for various cluster definitions. In Figure 2, we vary the line-of-sight boundary of the cluster membership to check if we have any particular fitting sensitivity to a certain physical scale. The labels marked ‘3 k’, ‘4 k’, ‘5 k’, and ‘6 k’ represent 3000, 4000, 5000, and 6000 kms 1 velocity boundaries relative to the rest frame cluster velocity, respectively. Figure 2 indicates that the velocity boundary does not significantly affect the performance of the MLP model for our case.
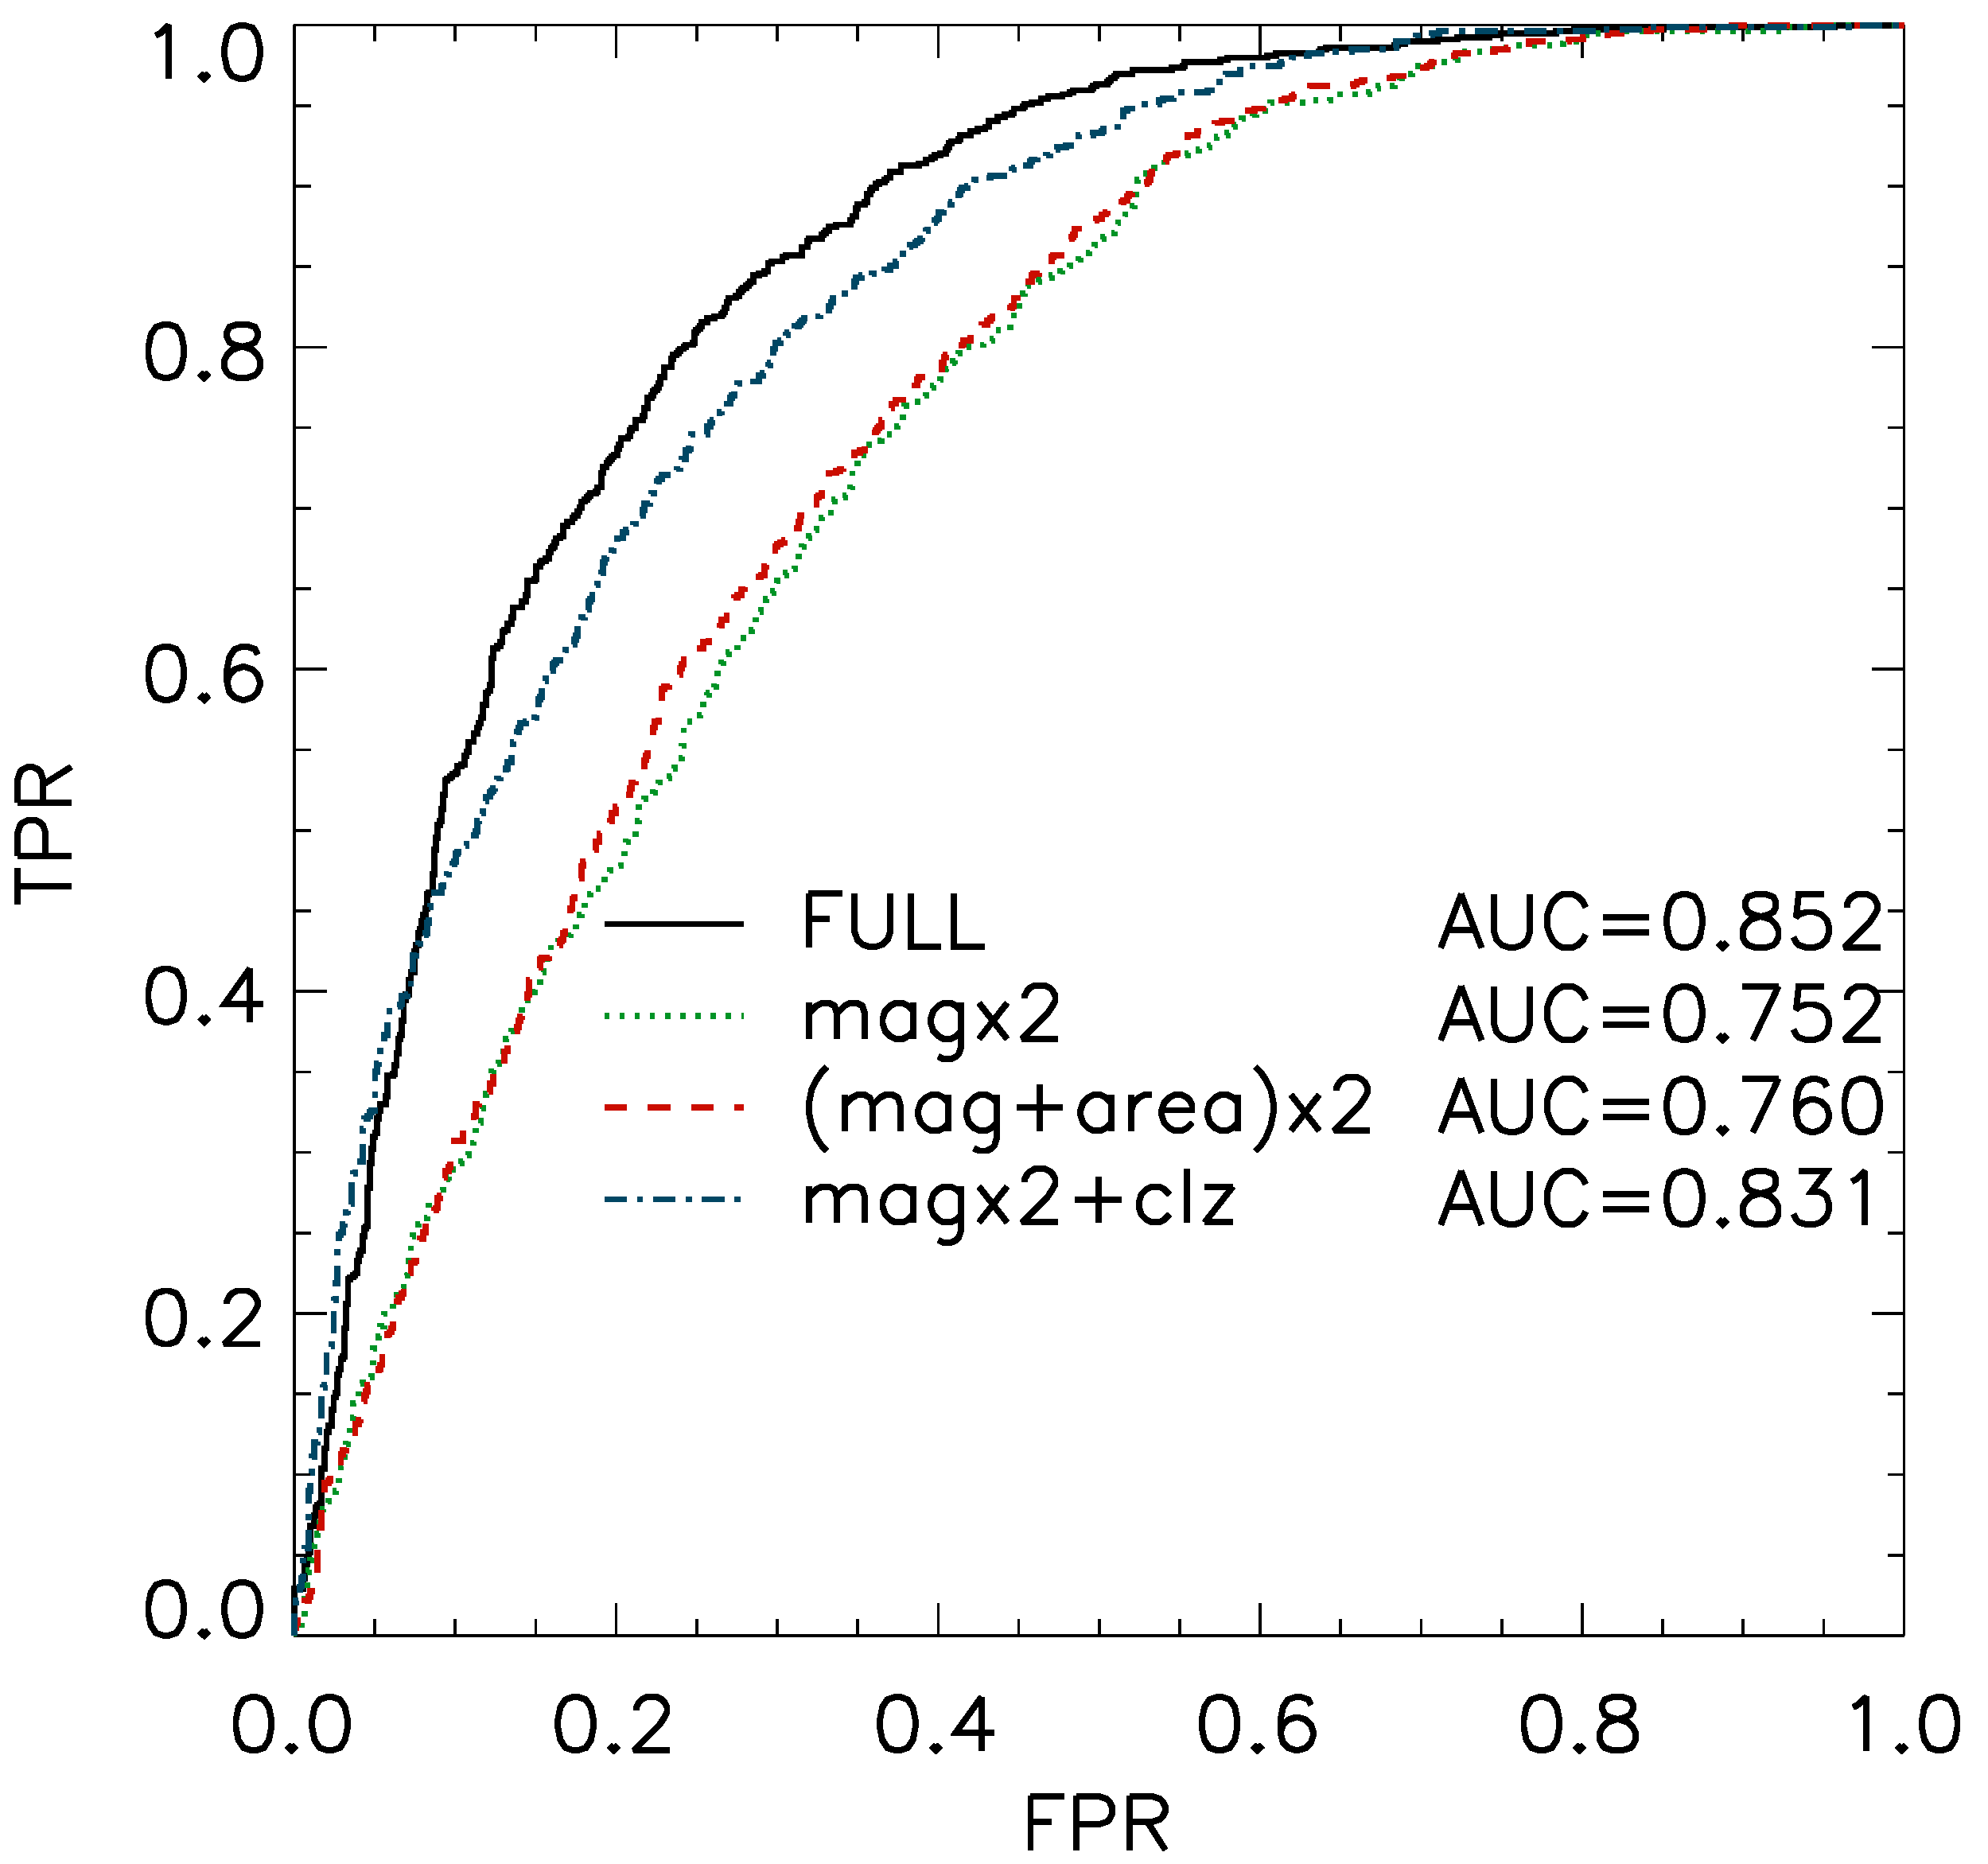
Figure 3 shows the ROC curves for various input measures. The label ‘area’ is the ISO_AREA_IMAGE, while the label ‘clz’ is the redshift of each cluster. The label ‘magx2’ means that the model is trained with only MAG_AUTO in two bands. The label ‘FULL’ means that the model is fed all of the measures for training, i.e., MAG_AUTO, ISO_AREA_IMAGE, CONC, FWHM_IMAGE, ELLIPTICITY, MAG_APER, BACKGROUND, ASYMMETRY in both bands, and clz.
Figure 3 shows that the membership classification using only SED (Spectral Energy Distribution) of galaxies, labeled ‘magx2’, leads to the lowest performance. Including non-SED measures can improve the performance, indicating that the neural network can extract the information beyond the SED of galaxies and combine this information jointly to better determine the cluster membership. Note also that inclusion of the cluster redshift (e.g., magx2 + clz), not to be confused with ‘galaxy redshift’, can also improve the fit because we are investigating the membership of different clusters at different redshifts. In case we fit only one cluster or fit clusters with the same redshifts, this clz will not be necessary.
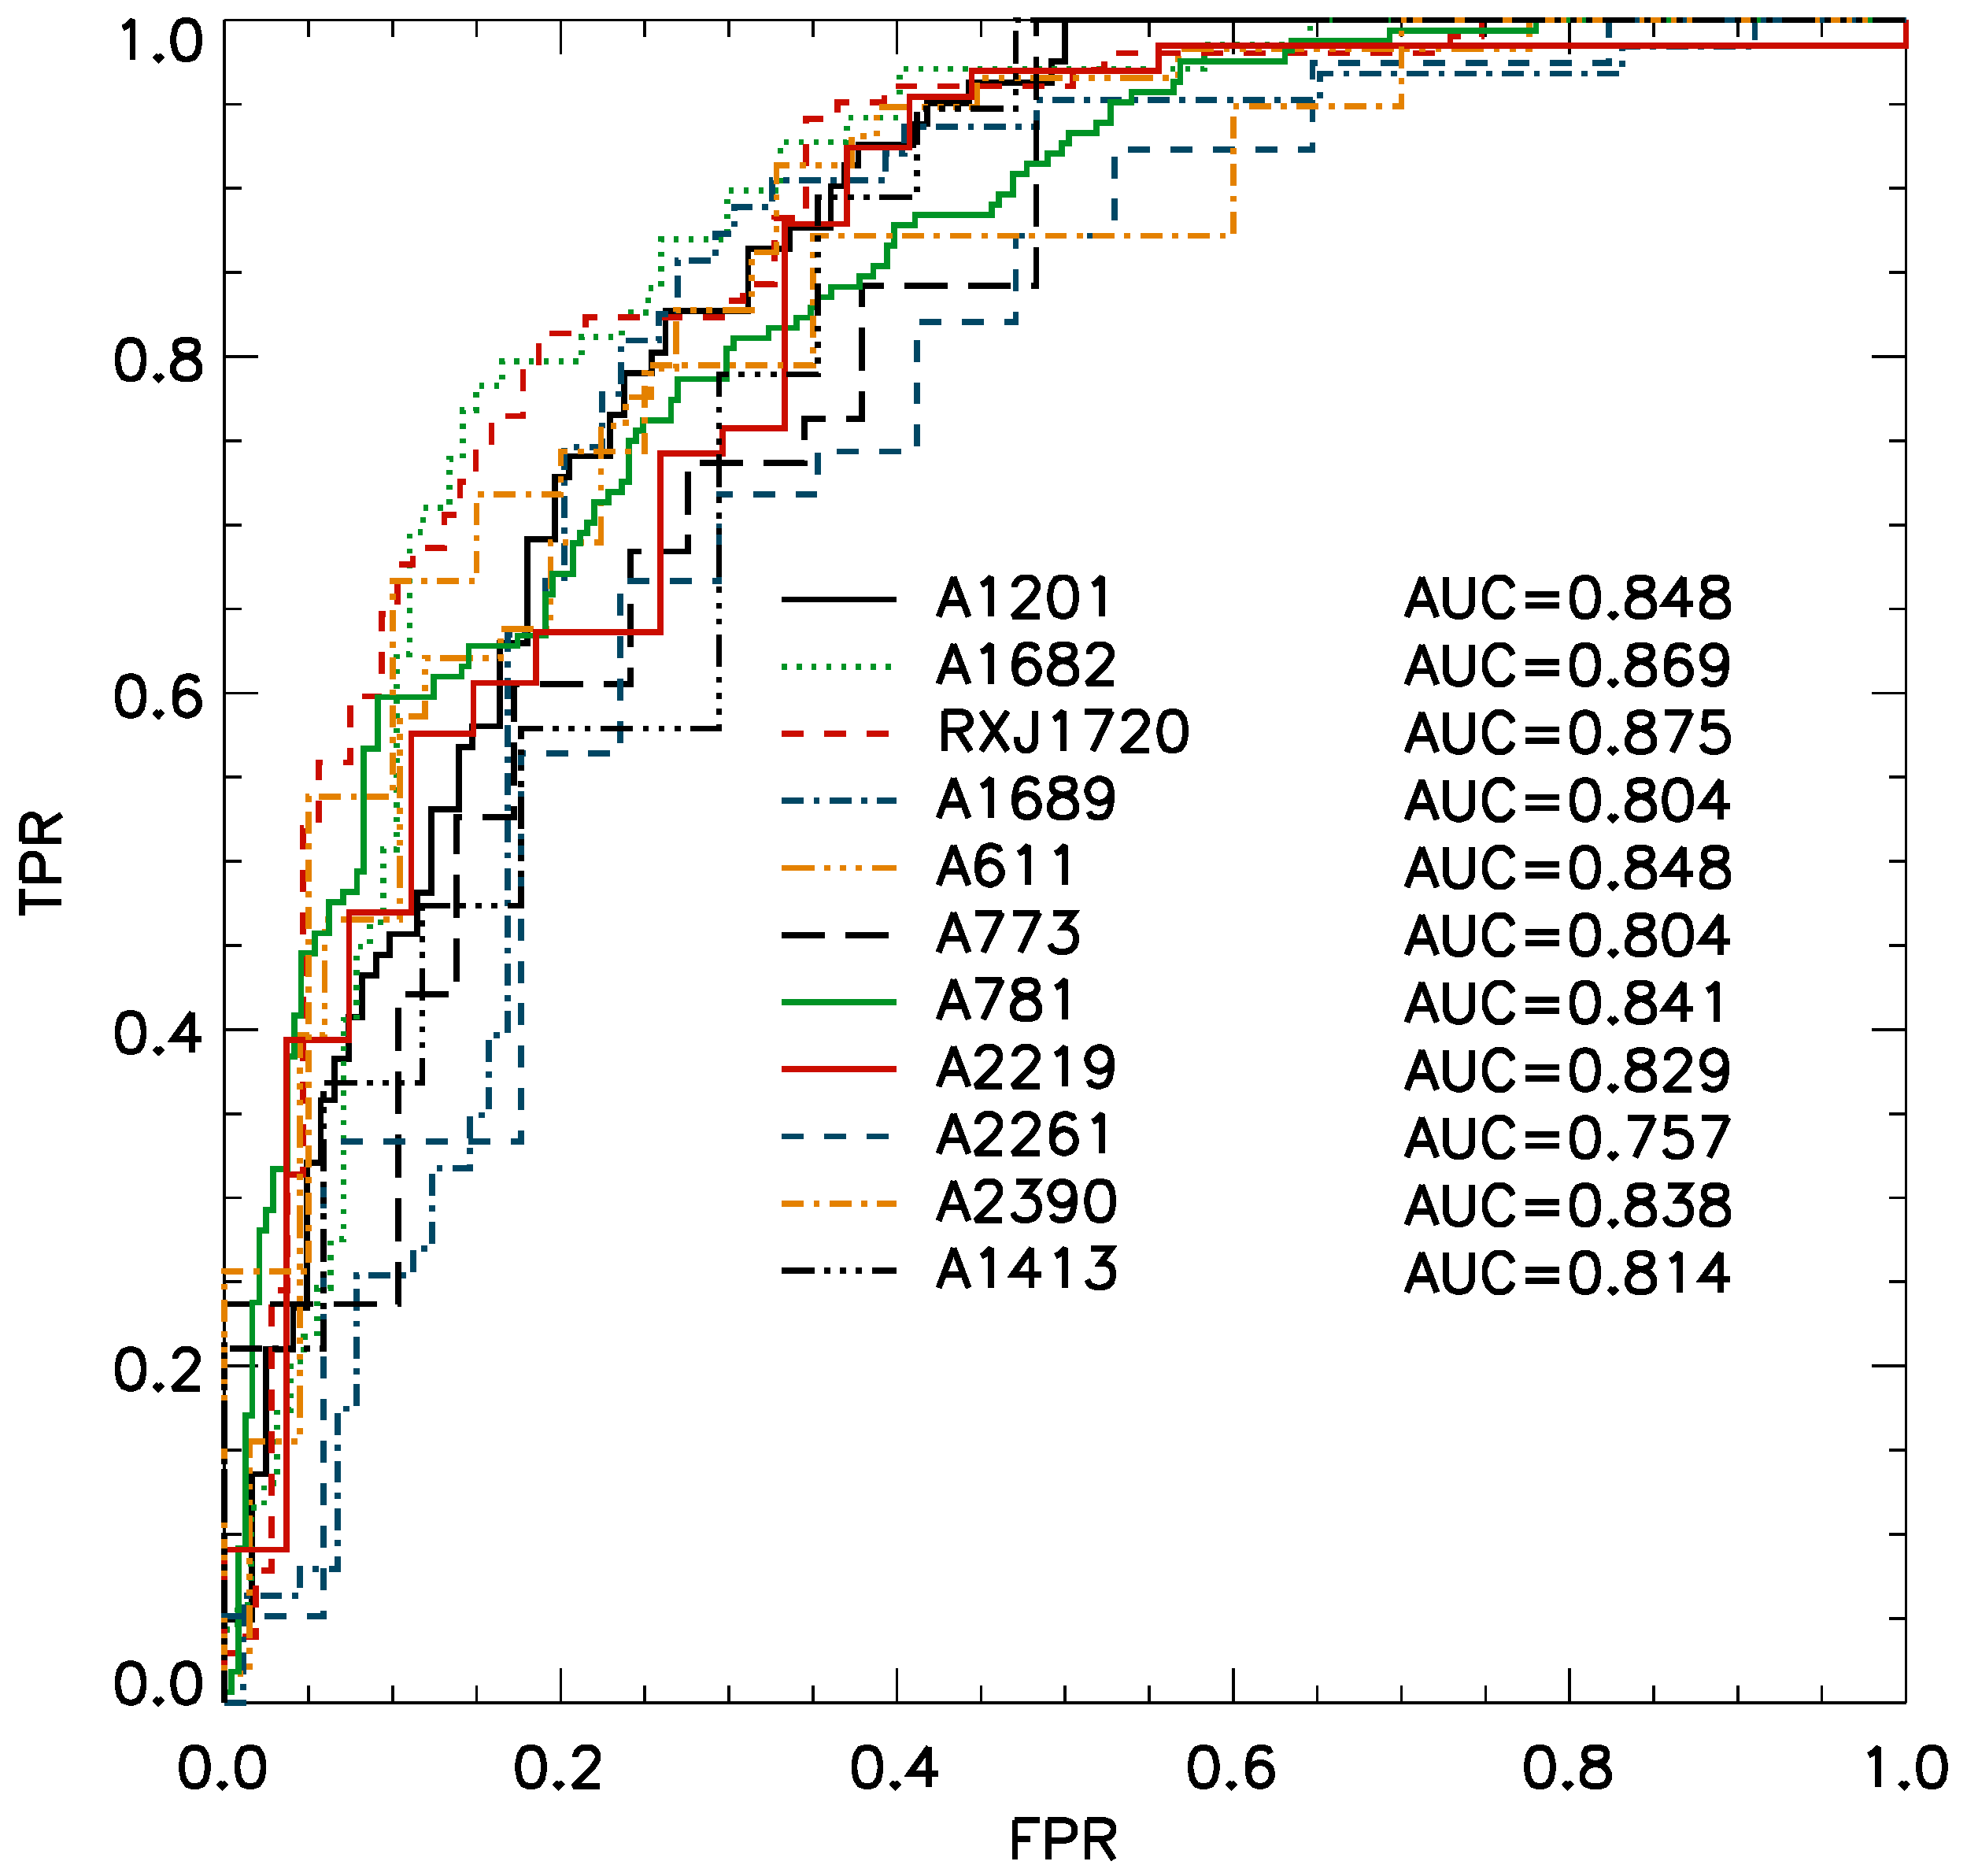
Figure 4 shows the ROC curves for various individual clusters to check the variations of performance among them. Here, for brevity and to avoid small number statistics, clusters with validation galaxies less than 30 are not shown, as well as clusters with either class (i.e., cluster members or non-members) less than 10 in each cluster. Note that, in this investigation, the training is conducted using all clusters combined, while the validation is conducted for each cluster, separately. Figure 4 shows some variations of classification among clusters. Clusters with a smaller number of samples tend to show a wider range of AUC, as some of the variations are coming from a statistical variation due to the small-number sample. In addition, the small sample clusters tend to be fitted loosely, because the model is trained with more influence from, therefore fitted well for, clusters with bigger sample size. Note that some validation samples of individual clusters can be class-imbalanced, although our combined sample is not. However, that will not affect our statistics, such as AUC, unless we use the purity or F1-score which are sensitive to the class imbalance in the validation sample.
Alternatively, one can attempt to fit the model individually to each cluster. This individual fitting, or training, may be able to achieve better performance in some clusters, particularly for clusters with many available galaxies, because we can optimize our model to each cluster. However, the performance is expected to be worse for most of the other clusters because of a much smaller sample size of galaxies per cluster to train each individual model, not to mention the possible further reduction of galaxies in order to correct the possible class imbalance in each cluster dataset.
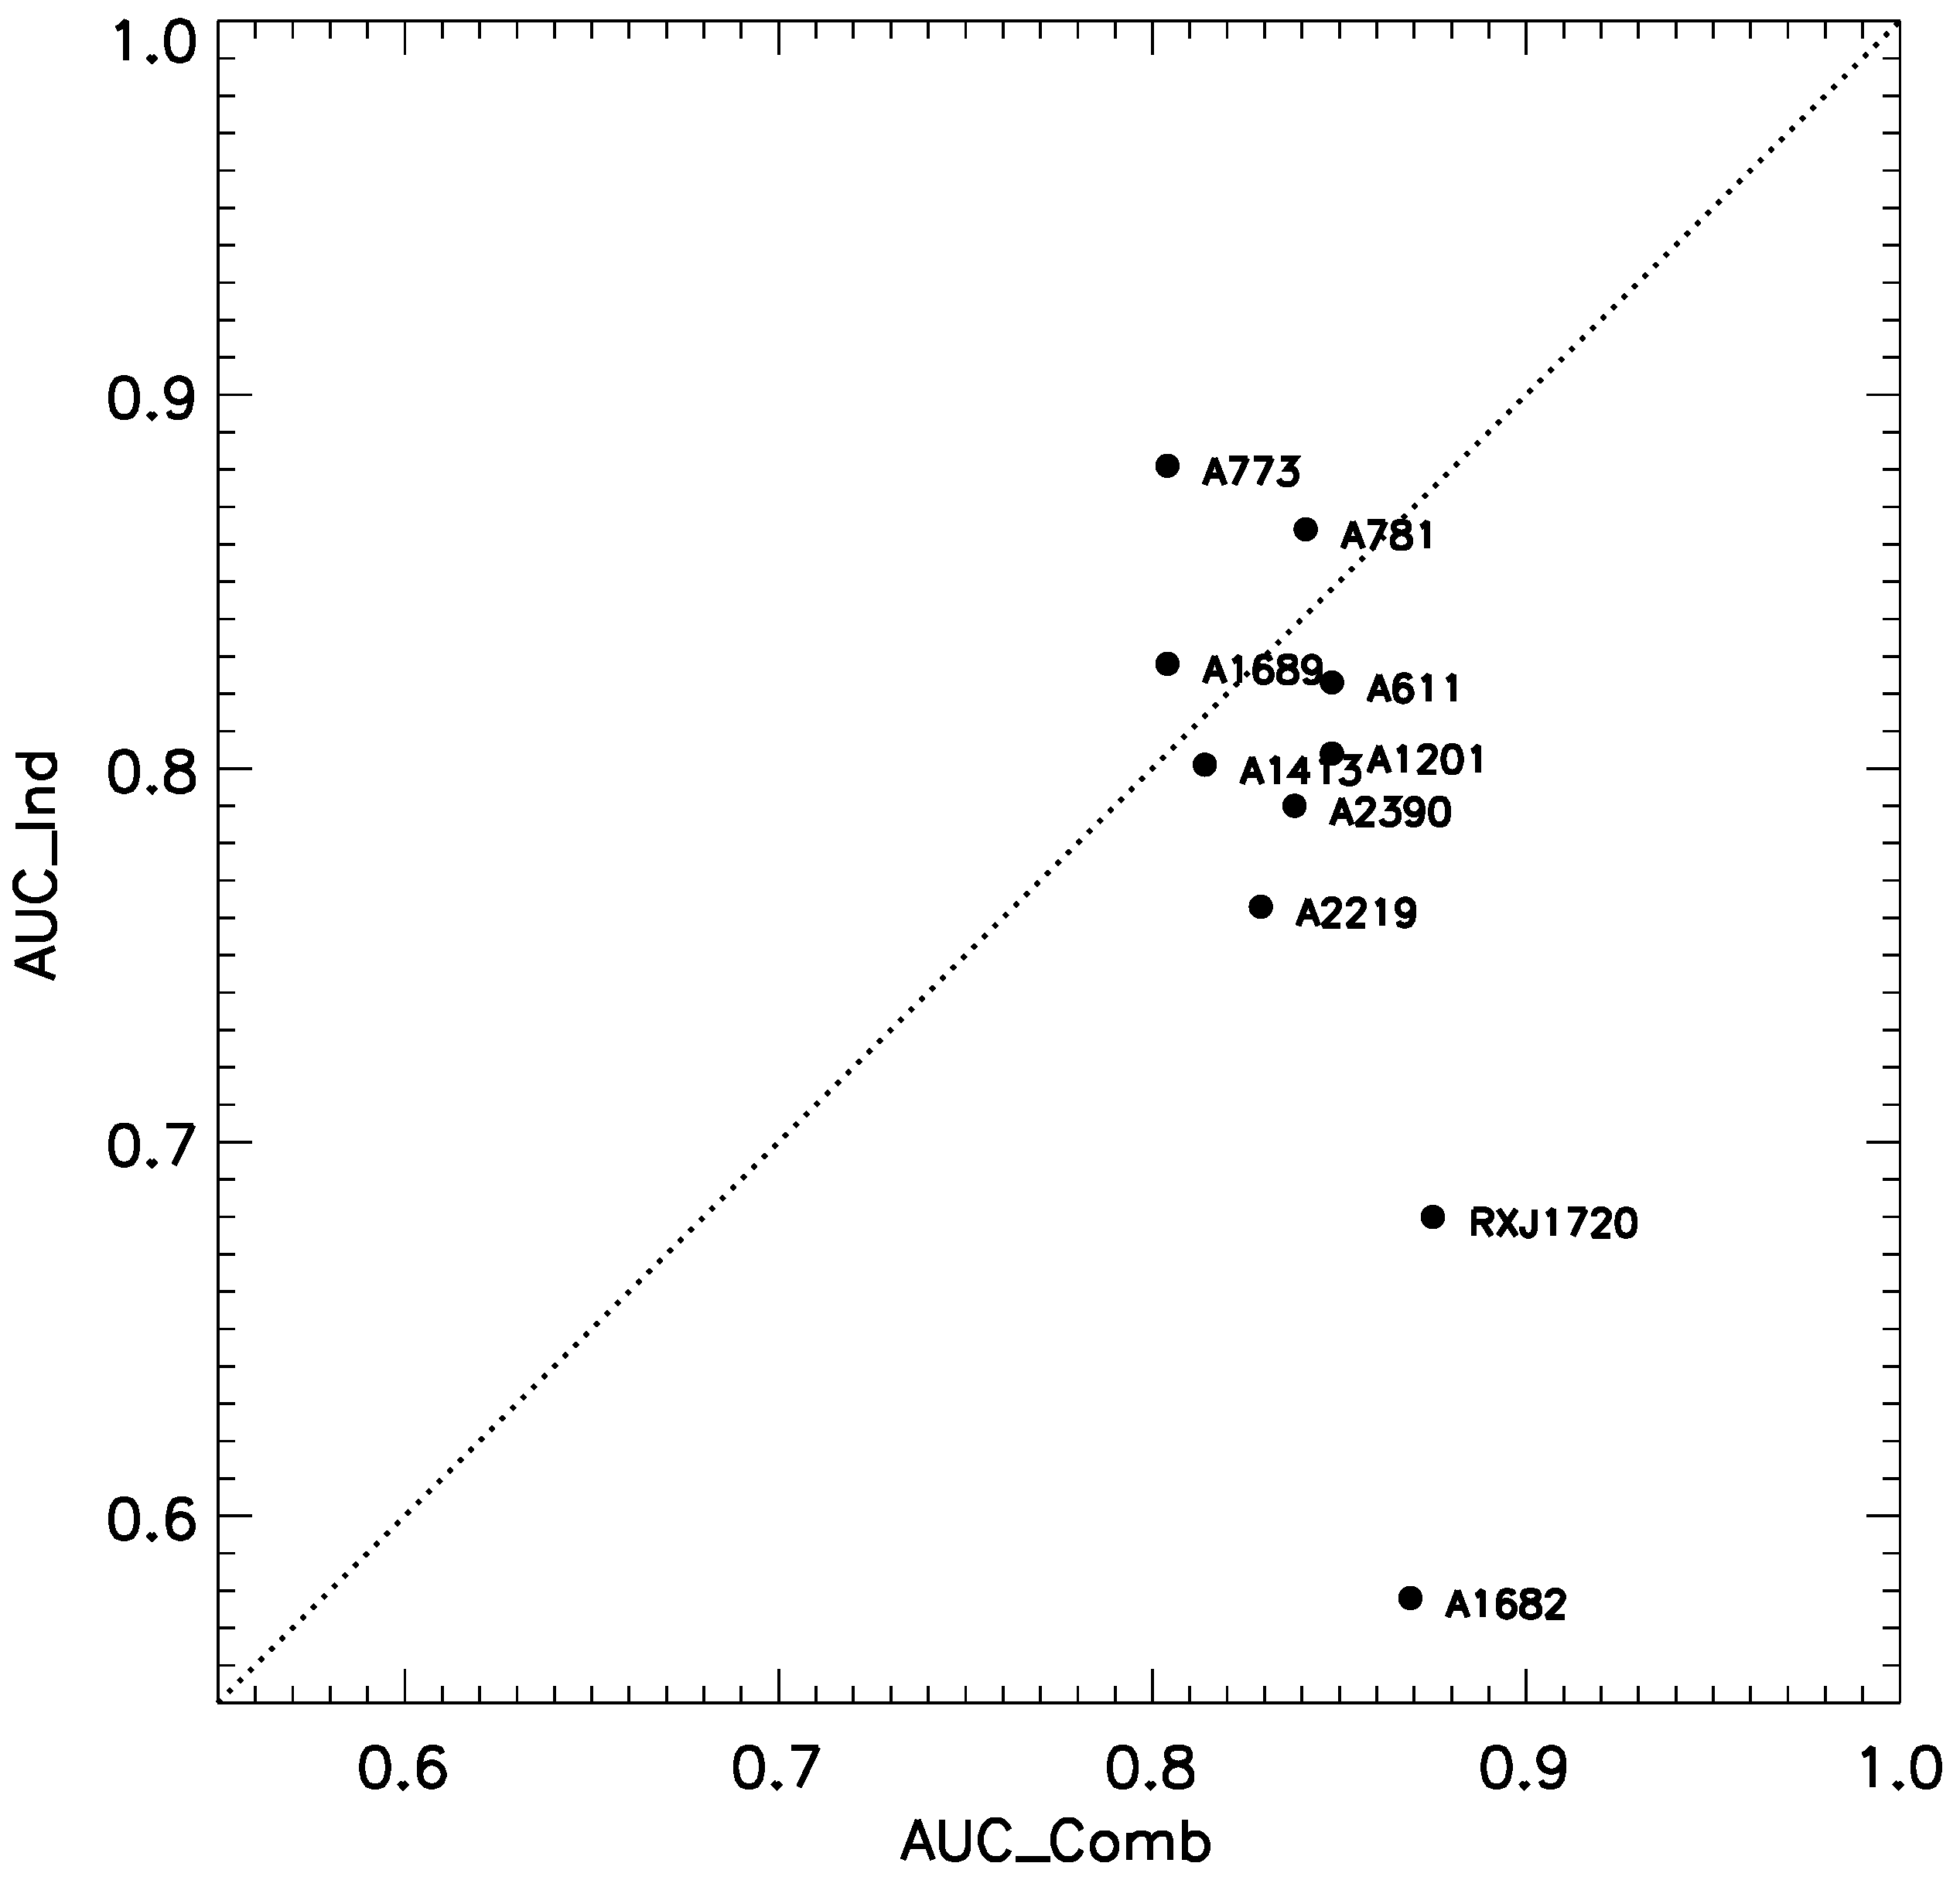
Figure 5 shows a comparison of combined cluster training and individual cluster training. Clusters with more than 30 galaxy samples are shown. Individual cluster training is conducted using the identical set-ups to the combined training, except for excluding clz (cluster redshift) from the input measures. A diagonal line is where the combined and individual trainings produce the same AUC values. Figure 5 demonstrates that, for some clusters, one can achieve better performance, but for the bulk of clusters, the performance is comparable to the combined training at best. Moreover, the individual training produces much-scattered values of AUC, particularly for these clusters with a relatively small number of available galaxies. For other clusters with a much smaller number of galaxies, the individual model often fails completely. There is room for slight improvement in individual cluster fitting by further tweaking the model, such as changing the combination of input measures, or changing the architecture; however, the real bottle-neck of the individual cluster fitting, a lack of sample galaxies per cluster, cannot be improved by the tweaking. In contrast, by conducting the training using a combined cluster dataset, we can create a stable model that works reasonably for most clusters, including clusters with a small sample size that individual training often fails.
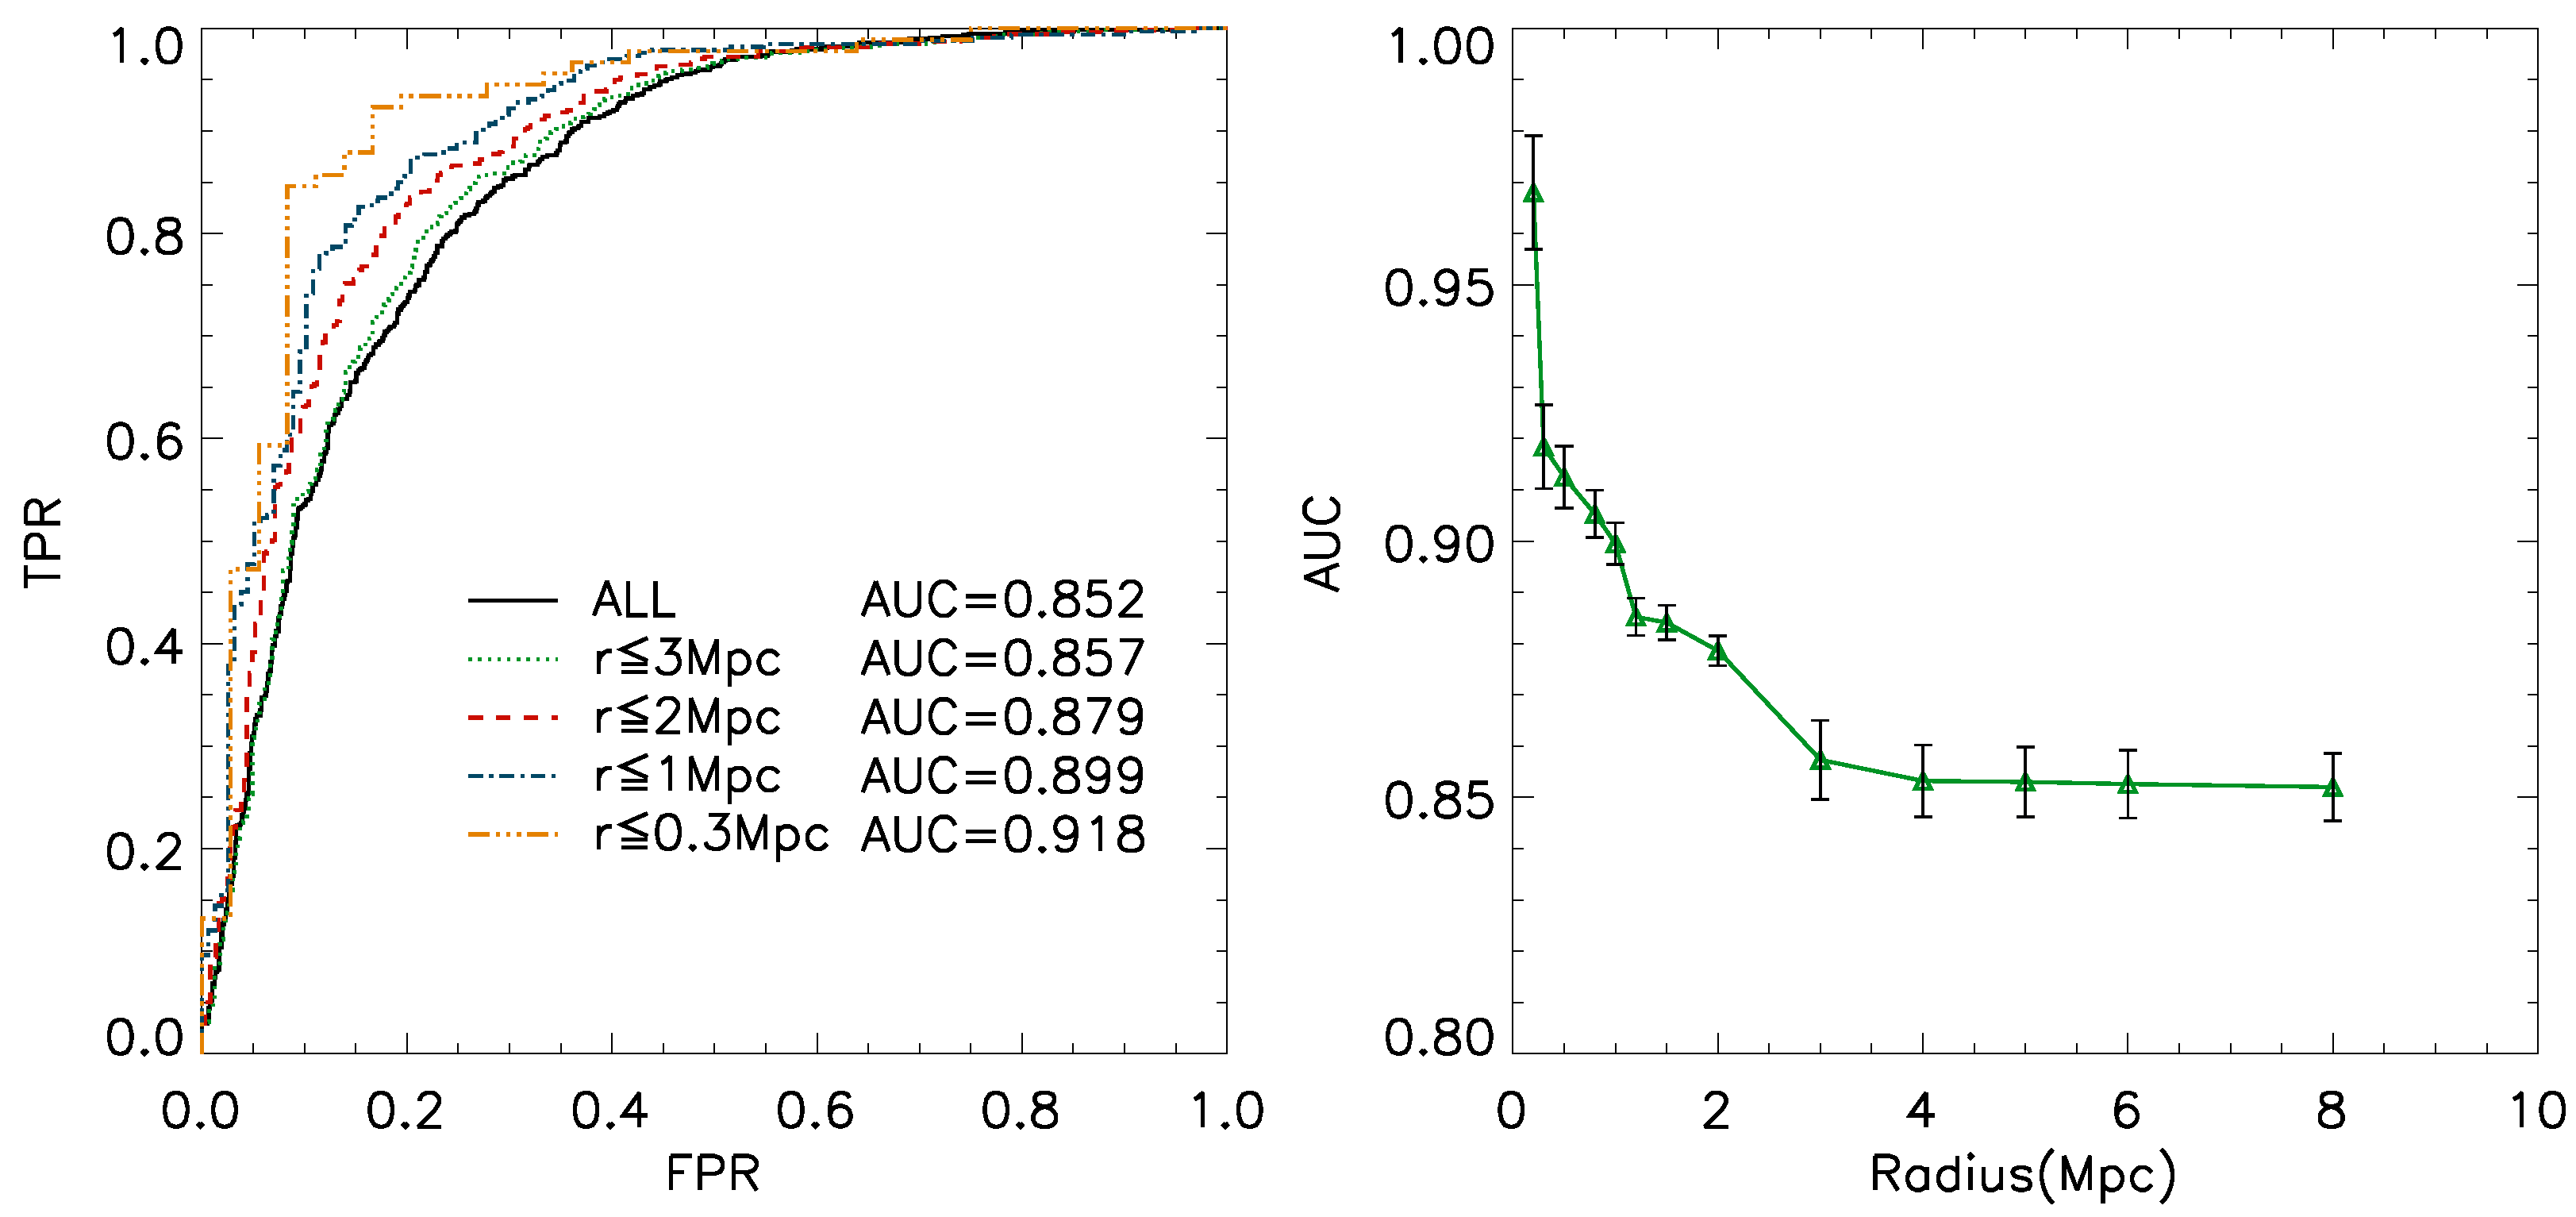
Figure 6, left panel, shows the ROC curves for various apertures around the cluster center to check the variations in the performance of membership classification with various co-centric cluster aperture radii. Here ‘ALL’ means all galaxies in the data, but we assigned a fiducial radius of 8 Mpc because the maximum cluster-centric distance is about 8 Mpc in our combined dataset. Meanwhile, the galaxy sample labeled as, for example, r ≤ 3 Mpc means that we check the performance inside 3 Mpc. Figure 6, right panel, shows the variation of the AUC scores over various validation aperture sizes. The error bar is 10% error normalized by the square root of the number of galaxies inside each aperture. Both panels of Figure 6 illustrate that inside of the central ∼3 Mpc radius, the performance of the neural network classification appears to be better and increasing toward the cluster center. Note that, here, we train for the entire sample, i.e., we train with only line-of-sight constraint, but we validate inside each of these apertures.
We also test a model retrained inside each aperture, but it is found that the model performs better if we train the model using the entire sample, rather than re-training for each aperture in which the number of training galaxies is diminishing rapidly in a smaller aperture. This demonstrates one of the interesting aspects of using the ML network: We can combine the information learned from the entire sample, even if we later apply the model to make a prediction to a subset of the data. Meanwhile, the better classification performance of the MLP model inside the inner region is important, because that is the region where most of the cluster investigations are conducted and compared. Please note, however, that the apparent higher performing statistics of any kind do not automatically imply increased intrinsic classification-power of the model toward the center, because the sample becomes class imbalanced near the center where the number of cluster galaxies naturally increases against the background galaxy count. However, as pointed out in Figure 4, our AUC statistics are robust against this imbalance. We will come back to this point in the next section and the discussion in more detail.
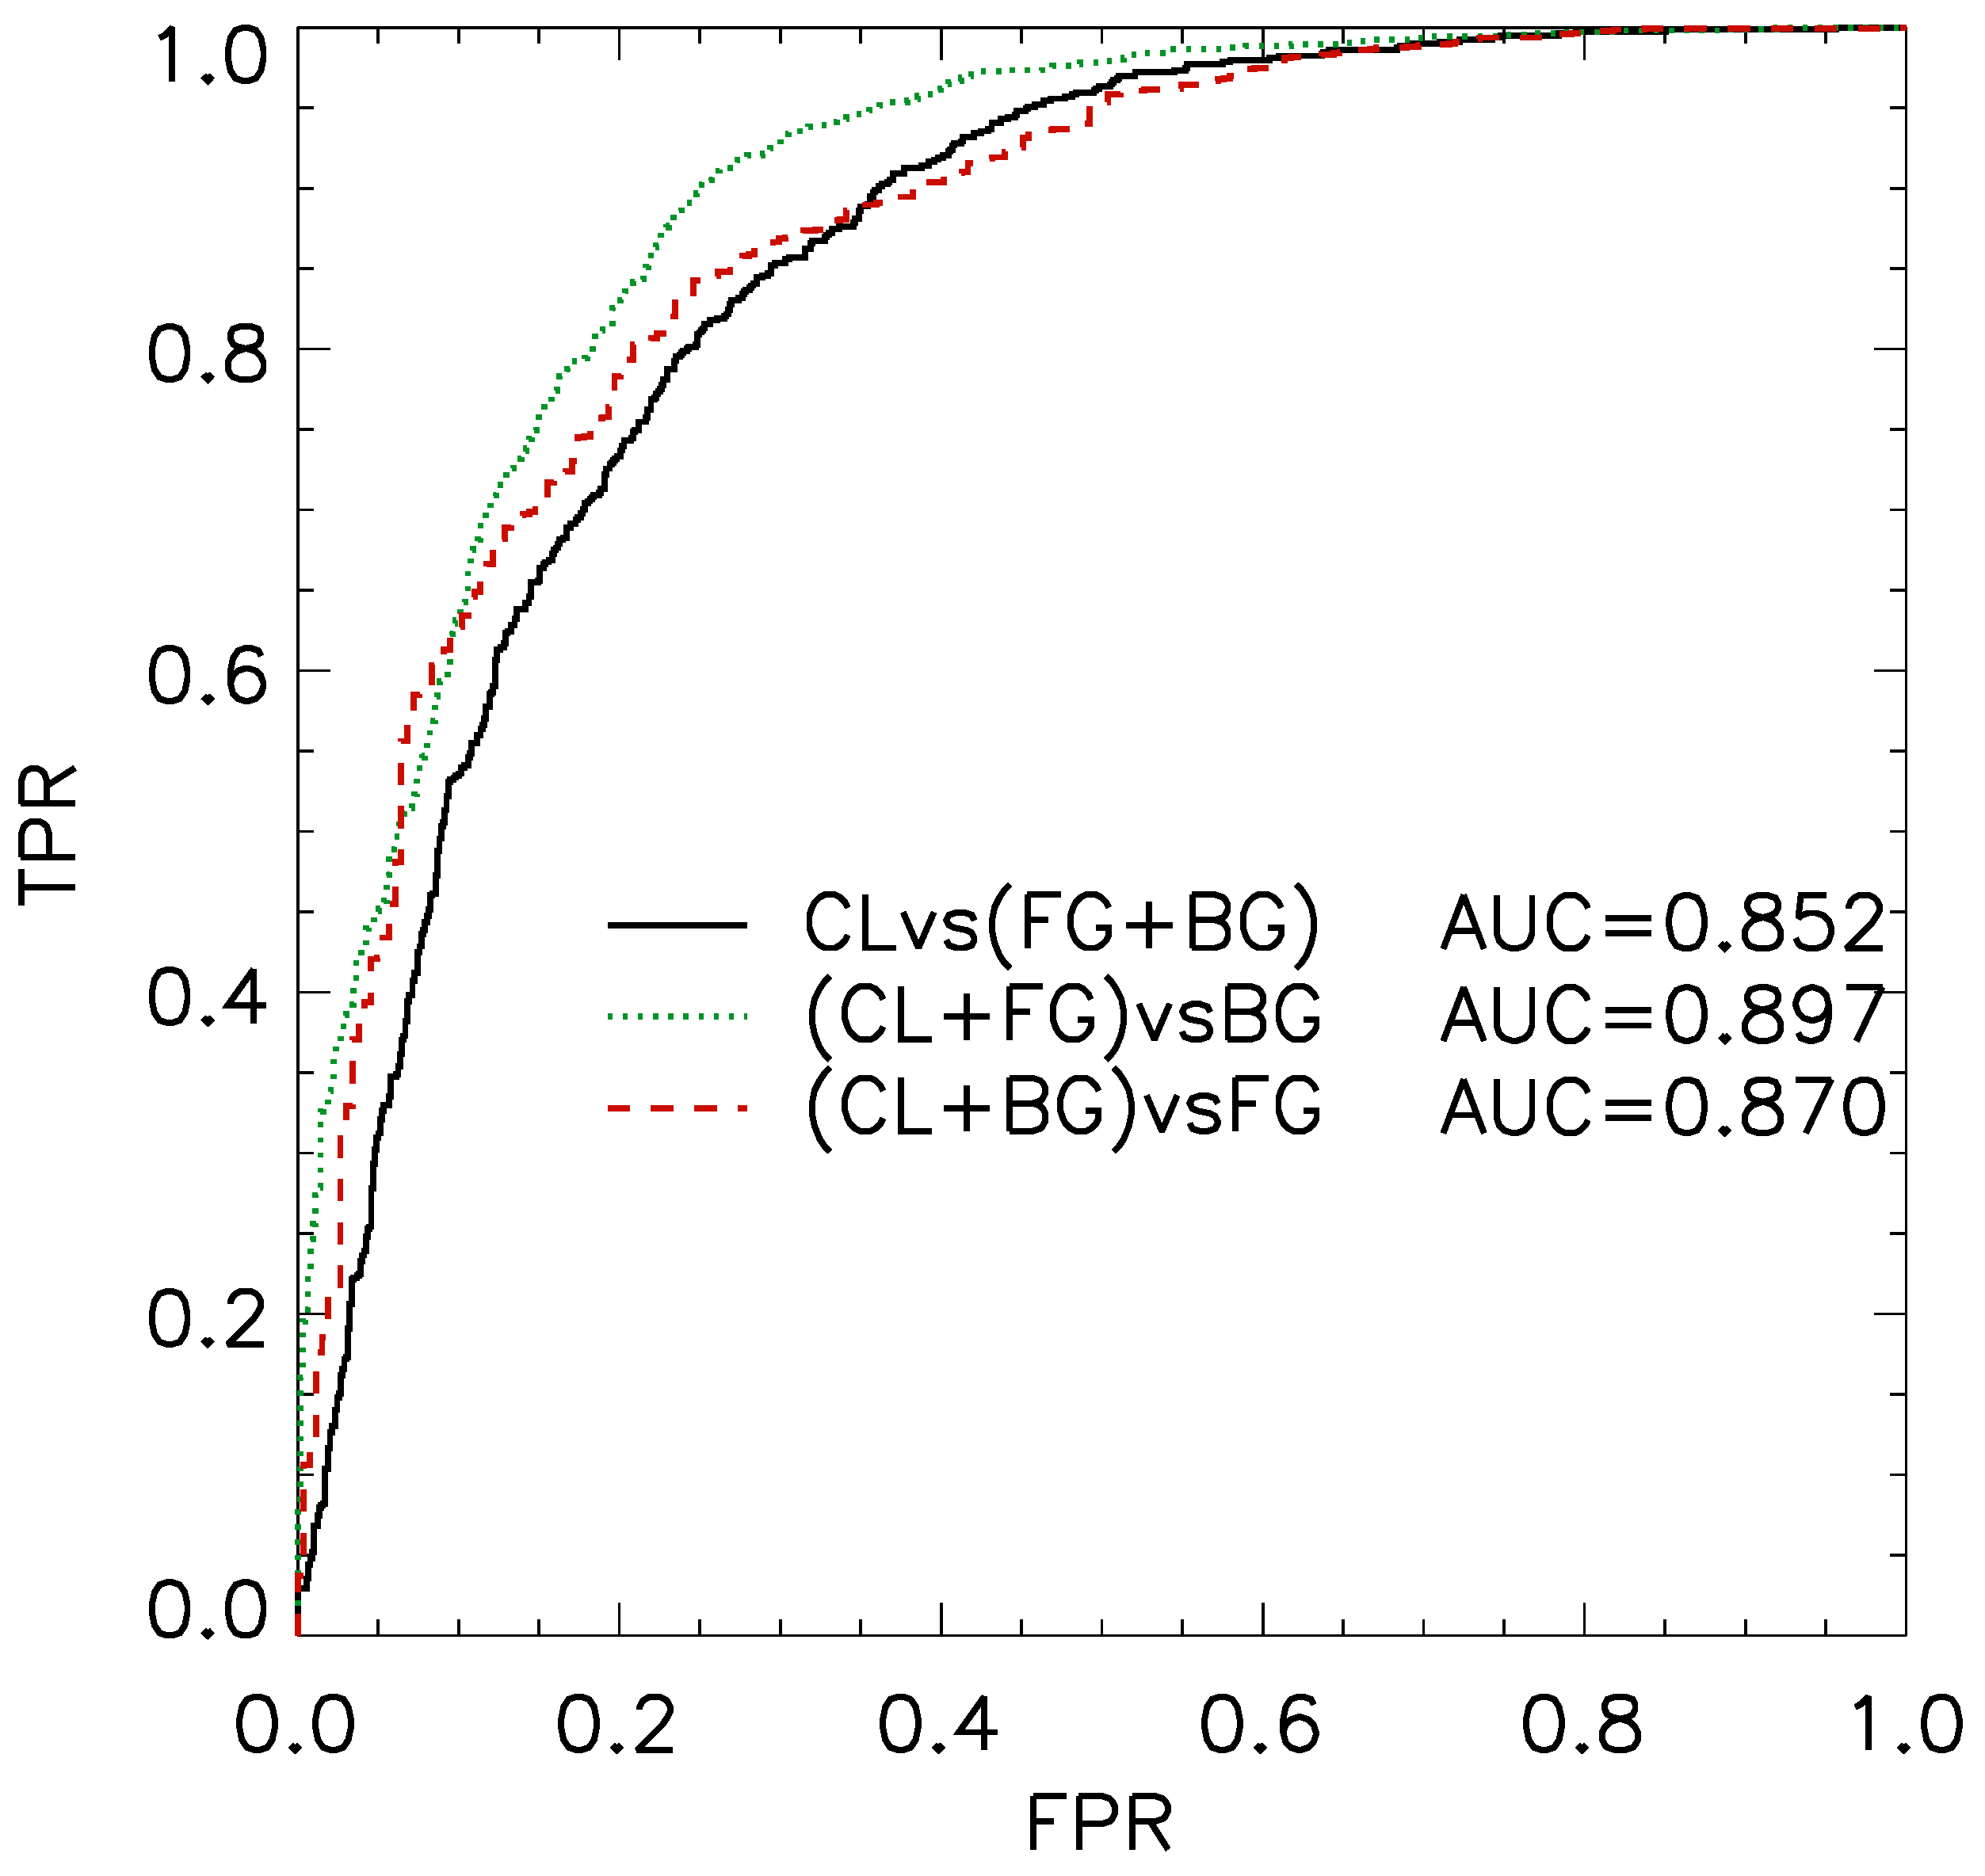
Figure 7 shows the performance of decoupling the foreground or background galaxies separately from the rest of the sample. Figure 7 demonstrates that separating the background galaxies, labeled as ‘(CL + FG)vsBG’, turns out to be easier than separating cluster membership, labeled as ‘CLvs(FG + BG)’, or than separating the foreground galaxies, labeled as ‘(CL + BG)vsFG’. Note also that the model separates the background ‘(CL + FG)vsBG’ slightly better than the full cluster classification ‘CLvs(FG + BG)’. This is perhaps due to the fact that, in this figure, each of the models is re-trained for each classification, i.e., the model is more optimized for each of the classifications.

3.2. Best Model and Comparison to Other Methods

Figure 8 shows the performance of our best model. The panel shows the ROC curve of our best model. The diagonal line is a random classification with AUC = 0.5, which has no classification power, plotted for comparison. The further away from this diagonal line, the better our classification performance.
Table 2 summarizes our best MLP model. The 17 input measures are MAG_AUTO, CONC, ELLIPTICITY, ISOAREA_IMAGE, FWHM_IMAG, MAG_APER, BACKGROUND, ASYMMETRY for both I and V bands, and cluster redshift of each cluster. The final epoch for training is 31. The total number of galaxies used for training and validation is 5624. The cluster line-of-sight boundary is 3000 kms 1 . The number of clusters stacked together is 16.
Table 3 shows the comparisons of various non-spectroscopic methods of the cluster memberships. First, to compare our MLP model to a standard two band photometric method, which is based on SED, we test a simple color selection using galaxy V-I color, the method labeled ‘Color Selection’ in Table 3. The V-I color is measured from our Subaru image using aperture magnitudes with an aperture radius 1 . The predicted cluster members are selected as those galaxies in a color range between +0.2 and −1.25 relative to the cluster red sequence V-I color. The red sequence of each cluster is determined by fitting a straight line, by visually checking if the fit is reasonable, to the red sequence of cluster galaxies in the V-I vs I color-magnitude diagram of each cluster field. The real cluster member boundary for the validation target is set to the line-of-sight boundary 3000 kms 1 from each of the cluster rest frame velocity taken from NED, to be consistent with our MLP model. The same color selection that is conducted inside an area with a radius of 1.5 Mpc from the cluster center is also tested (labeled ‘r ≤ 1.5 Mpc’), to be compared to our MLP performance in the inner region. Table 3 shows that two band color selection can achieve a completeness score comparable to, or even higher than, our MLP model, but the purity is quite low compared to the MLP model. Namely, the two band color selection can detect a fair fraction of the real cluster members, but it tends to contain many misclassified non-members in the detection, as well. This purity score improves slightly, just like our MLP model, within the inner 1.5 Mpc region, making the overall performance of the color selection (e.g., F1 score) slightly higher, while the completeness score is relatively unchanged. The situation of this low purity can also be slightly improved if we use a tighter (i.e., narrower) color range, labeled as ‘Red Sequence’ in Table 3, but with the expense of missing blue galaxies and of further lowering of the completeness, making the overall classification performance lower. Here, with ‘Red Sequence’ method, we select galaxies inside the +0.2 and −0.2 of the cluster red-sequence color.
We also compare our MLP model to a method using five band photometric redshifts to select cluster members, labeled as ‘Five Band Photo-z’ in Table 3. Here, the ugriz photometric redshifts of SDSS dr16 (that is, essentially, of dr12) are used as a standard five band photometric redshifts, for which the average redshift error for galaxies at z∼0.2 is reported to be approximately 0.025 [48]. The cluster members are selected as those galaxies with photometric redshifts within ±3000 kms 1 relative to the cluster redshift, to be consistent with other methods. Table 3 shows that five band photometric redshifts can achieve a purity comparable to or slightly better than our MLP model, but the completeness score is much lower than our MLP model. The low completeness score of the photometric redshifts is presumably coming from the fact that the size of errors in the photometric redshifts is relatively large compared to the line-of-sight redshift range of the cluster members, and is not coming from the fact that the photometric redshift is failed for some galaxies, because we have removed these photo-z missing galaxies from our statistics in the first place.
Again the apparent purity can be slightly improved inside the inner ≤ 1.5 Mpc region, while the completeness remains essentially the same. Please note, however, that the improvement of the purity in the inner region needs to be interpreted with much caution, because the purity can be, by definition, influenced by the class imbalance of the sample. As discussed in the previous section, the inner regions usually have a higher ratio of the cluster galaxy count relative to the background galaxies, and that can artificially increase the purity. The F1 score can also be mildly affected by this increased purity because the F1 score is partially calculated from the purity. To address the improvement of the performance in the inner region, other statistics, such as completeness, AUC, or ACC, are considered more reliable unless the imbalance is removed by such as the random undersampling or class weight techniques [42]. Table 3 demonstrates that the MLP method, by only using two bands, can produce reasonably high purity and completeness simultaneously, making the overall performance of the classification higher than other standard methods of cluster memberships, without restricting the investigation to a particular population of cluster galaxies, such as red cluster galaxies.
Table 4 shows the comparisons of various non-spectroscopic methods for various magnitudes. ‘Bright’ galaxies are those with i magnitude between 14 and 20, while ‘Faint’ galaxies are those with i magnitude between 20 and 27. All of the methods are tested for the region r ≤ 1.5 Mpc. Table 4 demonstrates, as expected, that all methods perform worse for the faint galaxies. The purity drops significantly for the faint galaxies by using the color selection, while the photometric redshifts produce the much lower values for both the purity and completeness of the faint galaxies. Note, however, that the drop in the purity can be partially attributed to the class imbalance of the faint population, i.e., the number of cluster galaxies relative to the background galaxies drops in the faint population (c.f. Ref. [49]).
The MLP method, while maintaining the high purity even for the faint galaxies, also produces slightly lower completeness for the faint galaxies. Nevertheless, Table 4 demonstrates that the MLP method works reasonably even for the faint galaxies, while other methods perform comparatively worse for the faint galaxies.

4. Summary and Discussion

We have conducted systematic investigations of the membership of galaxies inside a cluster using ML neural network. By directly assigning the membership, rather than estimating the galaxy redshift as an intermediate step, we explore the optimal network structure to determine the membership classification. The cluster membership is determined by the MLP neural network trained using various observed photometric and morphological parameters of galaxies measured from I and V band images taken with Subaru Suprime-Cam of 16 clusters at redshift ∼0.15–0.3. This choice of data ensures we use wide field-of-view data that can lead us to more practical usage of the ML network to generic cluster galaxy study, covering a wide range of cluster-centric distances, well into a field, and a wide range of galaxy magnitudes, into a faint dwarf regime of galaxies.
Our results can be summarized as follows:
  • We find that ML can effectively use the information beyond galaxy SED and perform better than the photometric method that is purely based on SED alone;
  • The performance of our MLP model can be improved by including the non-SED galaxy parameters, such as the concentration index, galaxy iso-area, asymmetry, and ellipticity, while it is relatively less affected by the variations of the MLP model architecture;
  • Our MLP model appears to be able to separate the background galaxies better than the foreground galaxies;
  • Faint galaxies are somewhat harder to assign their cluster memberships even using our MLP model, though the model is more robust against the faint magnitude than other photometric methods for finding the cluster membership for the faint galaxies;
  • The MLP method can achieve relatively high statistics simultaneously for both purity and completeness, which is essential for maintaining the overall cluster membership performance.
ML appears to be able to go beyond the conventional non-spectroscopic method by combining various photometric and morphological information, including and beyond the SED information, which is separately exploited piece by piece in the conventional cluster membership methods.
ML can be trained to directly predict the cluster membership rather than predicting galaxy redshifts and then use them to determine the cluster memberships. After testing an approach to predicting galaxy redshifts using MLP, we find that the performance of the predicted final membership seems to be higher for the direct membership than the method via galaxy redshifts. This is perhaps because ML can optimize the usage of the available information for a particular purpose, in this case, the cluster membership.
ML also seems capable of achieving high scores for both purity and completeness of the classification at the same time, which is unfortunately not easy using the conventional methods. If the completeness is low, even if the purity is high, such as the memberships determined via traditional photometric redshifts (or even the spectroscopic redshifts), we need to carefully account for the large population of missing members when we wish to investigate some statistical natures of cluster galaxies. Moreover, there is no guarantee that these missing cluster members are statistically uniform in quality and quantity over various magnitudes and locations. Often, one must make an assumption that these missing populations are uniform across a range of magnitudes and/or locations. For example, the standard spectroscopic investigations of cluster galaxies, such as the luminosity function (e.g., Refs. [9,50]), rely on this assumption, i.e., the cluster galaxy to the background galaxy count ratio estimated by the spectroscopic redshift of a small subset of sample galaxies is assumed to be extendable to all cluster galaxies at all locations.
Meanwhile, if the purity is low, even if the completeness is high, such as the membership determined by the loose color selection, we need to carefully account for a large number of contaminating galaxies. Again, there is no guarantee that these contaminating galaxies are uniform in quality and quantity, and one must make an assumption about these contaminating galaxies. For example, the conventional background-galaxy subtraction typically relies on an assumption that the number of contaminating galaxies is uniform across the cluster field and only a function of their magnitudes.
Therefore, achieving a good score for both purity and completeness simultaneously is highly desirable for the statistical investigations of the number or nature of cluster galaxies, particularly for the investigations of their variations across the cluster field. A further advantage of ML is that the balance between the purity and completeness can be easily adjusted, if needed, (e.g., making completeness extremely high by lowering the purity slightly, or vice versa) to fit a particular science needs. This can be achieved by adjusting the probability threshold separating the final binary classification in the neural network without changing the overall performance of the classification.
A similar freedom of ML can be also explored during the training process of the model. We find that the model can perform better when we train the model for the entire image area, but use the model to predict membership in a smaller cluster-centric distance. Similarly, it appears that ML can perform better if we use the information from other clusters in addition to a target cluster, rather than training for a target cluster using only the information from that cluster alone. Namely, ML can be trained better when we combine the information from all of the sample clusters, rather than training for an individual cluster. This implies in general that ML can use the information outside of, but related to, your target of interest, to achieve better performance.
Another interesting aspect of ML is it that is seems the performance is robustly determined by the total quantity of the information that the model uses, rather than the individual quality of the information. This may not be true for all of the applications of ML, but it is perhaps the case for a wide range of applications. For our application, rather than carefully selecting galaxies with good quality information, one can alternatively achieve similar performance by roughly selecting galaxies with the information of acceptable quality and then putting all of them into the training, and letting ML decide how to use the acceptable quality information. In other words, a small number of galaxies with high-quality measures can be, in some cases, compensated by a large number of galaxies with medium data quality.
Despite all of the advantages of the ML neural network, it has its limitation. One problem is how to use the trained model for the entire sample, e.g., when we naively apply the model to the entire dataset of galaxies, it may create at least two distinct data subsets with different prediction accuracy, by a mechanism similar to ‘data leakage’ during the validation process of the ML training [51]. In that situation, the training sample contained in the total sample is better fitted than the rest of the total sample and therefore tends to have a higher accuracy of the cluster membership. This is analogous to a situation where you use spectroscopic redshifts to estimate cluster memberships for a subset of galaxies with available spectroscopy, while using another method to predict the cluster membership for the remaining galaxies, then combining these two subsets for analyses. The different prediction accuracy may lead to a false conclusion depending on a particular science when it is not properly accounted. For example, if one of the two subsets are biased toward certain characteristics of galaxies (such as magnitudes, or locations), so that their investigations are searching for the correlation, then the statistical segregation of characteristics of galaxies can be originated from the difference in the accuracy of the cluster membership.

4.1. Radial Distributions of Galaxies

Furthermore, we have another problem related to ML: To construct the training and validation sample for ML, the spectroscopic information is usually required, and therefore these galaxy samples are prone to the bias originating from spectroscopic observations. This bias of the spectroscopic data can cause the problem to any other (non-spectroscopic) method of cluster membership classification, including membership determined by the photo-zs, because when we evaluate the performance of these methods, even if they are not ML, they often require spectroscopic memberships for comparison. Unfortunately, the spectroscopic data are frequently biased; the samples are usually not uniformly taken over various parameter planes, such as the locations and magnitudes, because of various constraints associated with spectroscopic observations.
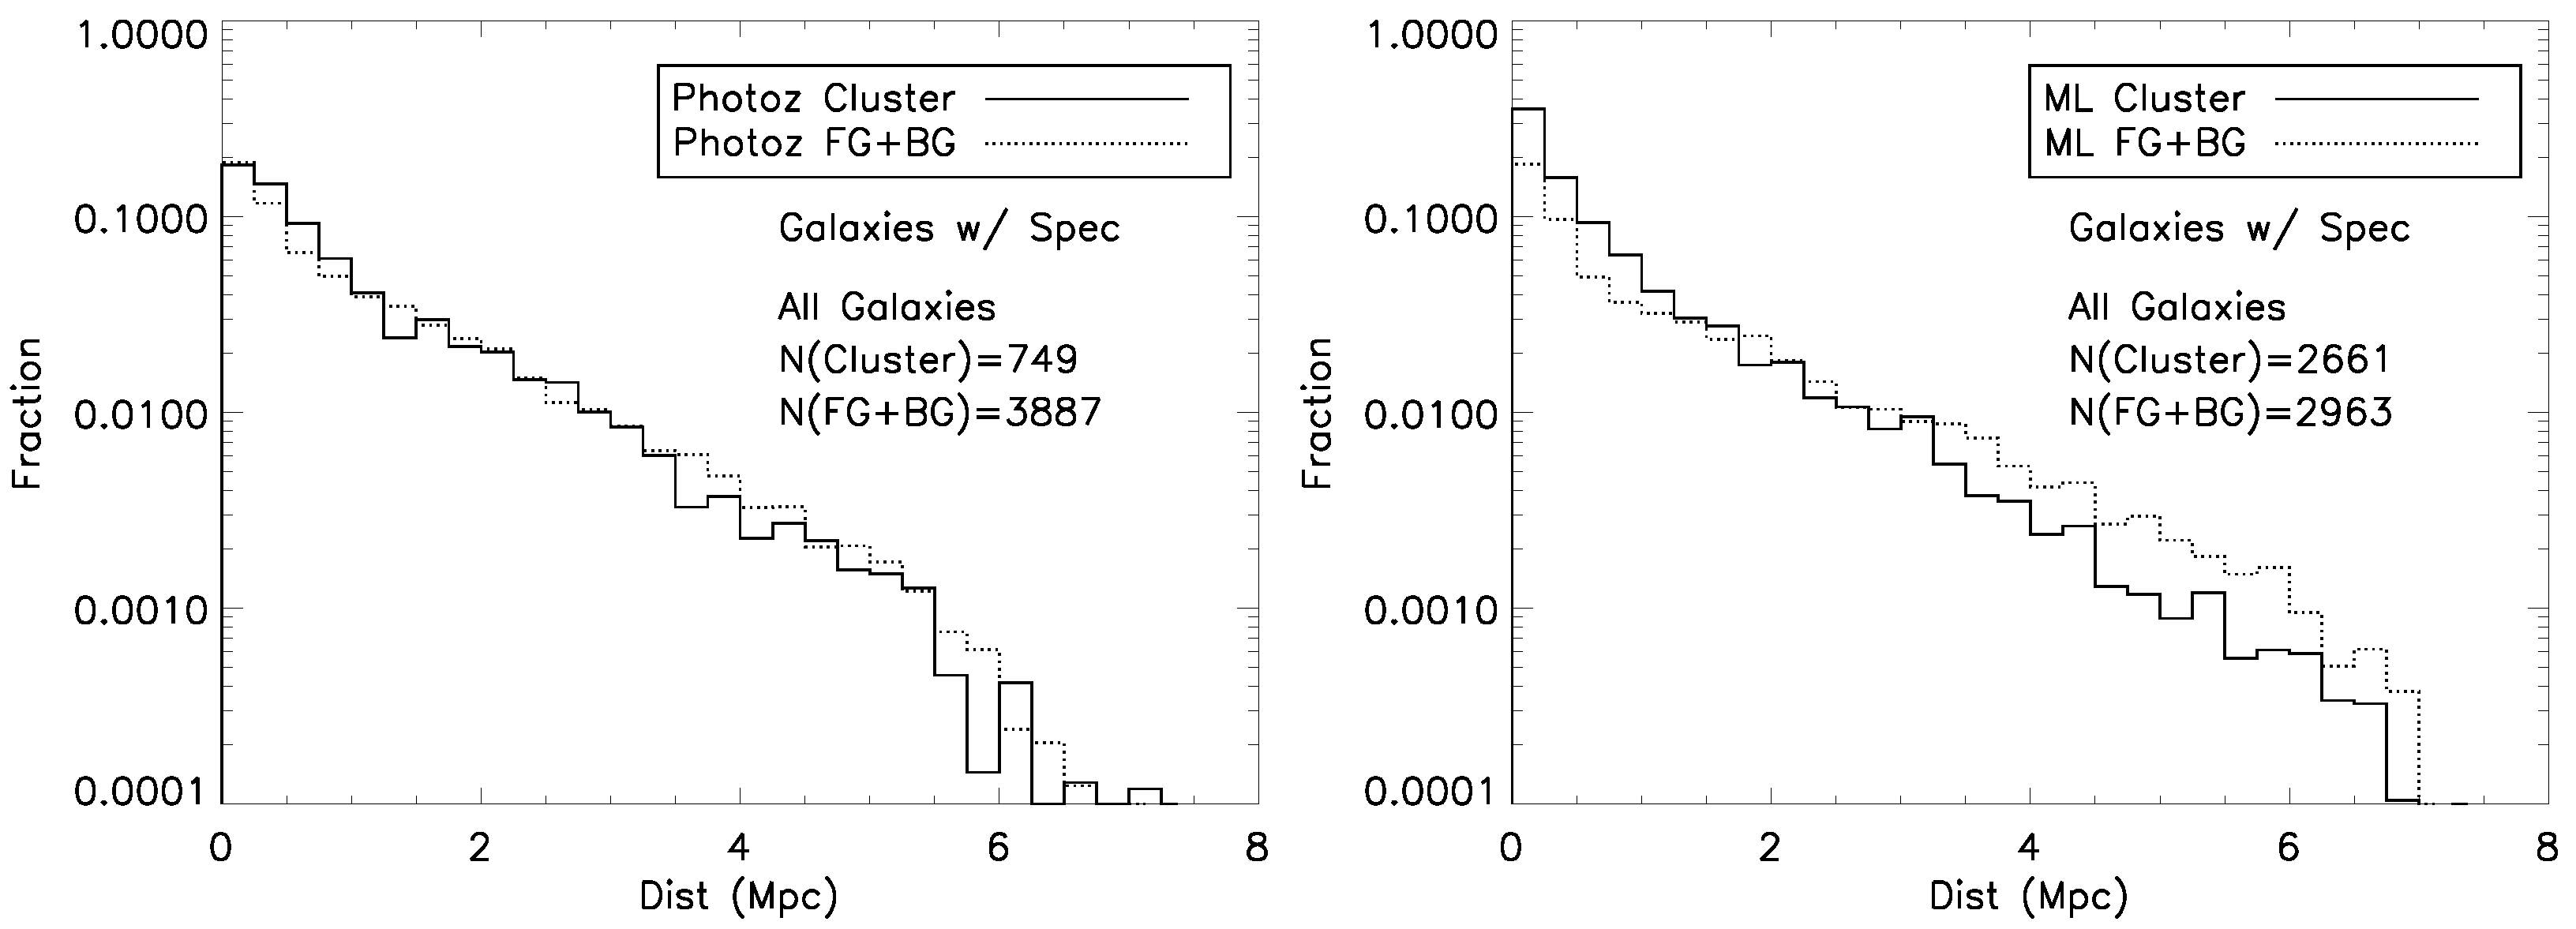
Figure 9 illustrates the bias in our spectroscopic sample used for the training and validation of MLP. The left panel shows a distribution of our spectroscopic sample as a function of cluster-centric distance. The spectroscopic sample comprises our Subaru catalog with available NED spectroscopic redshifts. ‘All’ sample means that cluster (CL), foreground (FG), and background (BG) galaxies are all combined. The total number of galaxies is represented by ‘N’. The number of galaxies in each distance bin is normalized by the total number of galaxies and corrected for by the search area of the bin, thus an unbiased sample should show a flat distribution with respect to the cluster-centric distance. A distance beyond ∼3 Mpc sometimes gets projected to the outside of a cluster image in some directions, thus the decreasing of the galaxy counts beyond ∼3 Mpc can be due to the fov effect. The left panel of Figure 9 illustrates a typical bias of the spectroscopic cluster observation, in which an object closer to the cluster center is preferentially observed. By matching to the spectroscopic catalog, our Subaru photometric catalog suffers from bias, despite our original Subaru catalog being relatively unbiased against the cluster-centric distance.
Some enhancement near the central region in the left panel can be attributed to the real number count enhancement by the cluster galaxies against the background. Indeed the right panel of Figure 9 shows that the number of cluster galaxies (solid line, only constrained by the line-of-sight velocity) is increased toward the cluster center. However, the right panel also shows that even the number of fore/background galaxies (dotted line, labeled as ‘FG + BG’) is increased toward the center, indicating the major spectroscopic sample bias rather than the enhancement by the real cluster galaxies.
Figure 10 shows cluster-centric distributions of cluster memberships assigned using the SDSS photometric redshift (left panel), and distributions of cluster memberships assigned by our ML (MLP best model, right panel), both corresponding to our sample investigated in Table 3 with available NED spectroscopic redshifts. The total number of galaxies in the left panel is slightly smaller because not all of our galaxies with NED redshifts have corresponding photo-z entries in the SDSS database.
Figure 10, left panel, illustrates that, as expected, our dataset with the SDSS photometric redshifts is also centrally biased. This bias is again suspected to originate from the spectroscopic sampling bias. In addition to the bias, it also fails to recover the original membership (c.f. Figure 9 right panel): it misclassifies many cluster galaxies into non-members, thus artificially increasing the number of FG + BG galaxies significantly in Figure 10, left panel. This is most likely due to the relatively low line-of-sight resolution of photometric redshifts. The low resolution is suspected to cause the high purity and low completeness of the cluster membership determined on the basis of the photometric redshifts in Table 3, by essentially counting only those galaxies near the center of the recessional velocity range.
Meanwhile, in the right panel of Figure 10, our ML prediction recovers the original membership better than the photometric redshifts, but the sample still displays an overall sampling bias toward the center of clusters, suspected be originated from the bias in the spectroscopic dataset.

4.2. Radial Distributions of Galaxies in the Samples without Spectroscopic Sampling Bias

In general, using an entire sample including galaxies without spectroscopic redshifts to evaluate the performance of the one cluster-membership method is more desirable, because it is the dataset of our final target of the investigation, and it is expected to be less affected by the problematic spectroscopic sampling bias. Unfortunately, with this dataset, it is not easy to evaluate the accuracy of the method, because there is no correct answer to compare our prediction to. However, in these datasets, one indication of the good classification performance can be the ‘flatness’ of the fore/background galaxy count with respect to the cluster-centric distance, because we expect no positional variation of galaxy count except for some small variations from, such as, large scale structure in the fore/background or the magnification bias by the cluster gravitational lensing (e.g., Refs. [52,53]).
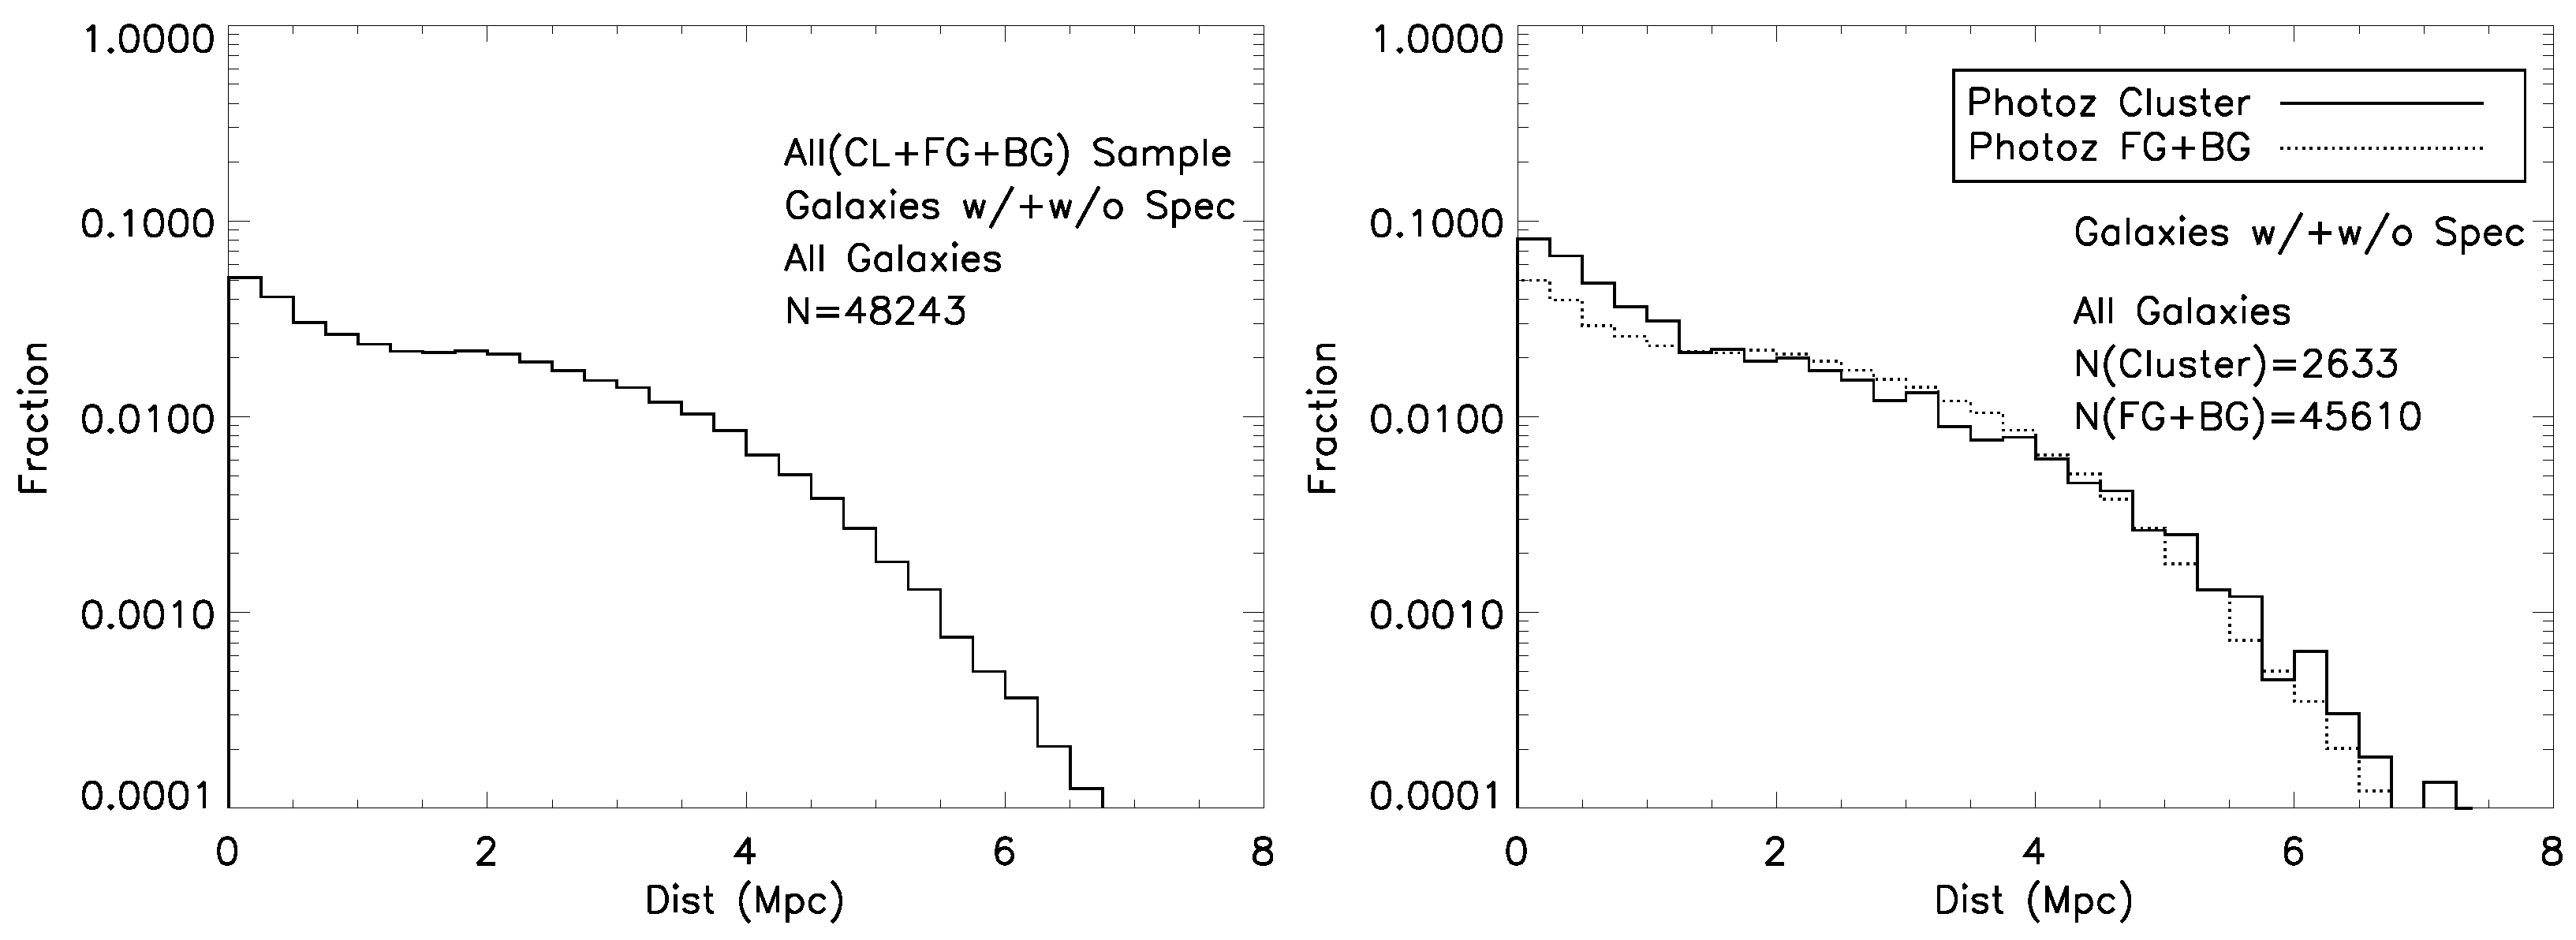
Figure 11 shows the cluster-centric distribution of photo-z sample with or without NED spectroscopic redshifts, labeled as ‘w/ + w/o Spec’. Namely, our Subaru catalog is matched only with SDSS photo-z catalog and only those galaxies with available photo-zs are shown. This photo-z sample is, therefore, affected only by the bias in the photo-z dataset (and a small bias from the Subaru catalog itself, if any), and it is expected to be free from the spectroscopic bias. The left panel of Figure 11 illustrates that our photometric sample is much less biased than the spectroscopic sample, but it still shows some central sampling bias inside of ∼1 Mpc. One can suspect that the increased galaxy count near the cluster center can be partially attributed to a real enhancement of the count by the cluster galaxies, and the right panel of Figure 11 shows a small enhancement of cluster galaxies relative to the FG + BG galaxies. However, in the right panel, the number of cluster galaxies is much smaller than the FG + BG galaxies, implying that the bulk of the enhancement in the left panel is not due to the cluster galaxies. In fact, in the right panel, the number of FG + BG galaxies is also increased toward the center, consistent with the idea that the bulk of the number enhancement in the left panel is related to the overall sampling bias in the SDSS photo-z dataset. The suspected intrinsic bias in the photo-z dataset should be noted and properly accounted for if one wishes to conduct an investigation of galaxies involving photo-zs.
The right panel of Figure 11 shows a non-flat FG + BG count (dotted line). In fact, in addition to the bias in the photo-z dataset, there is perhaps a small effect from the wrong membership classification (e.g., some of the FG + BG enhancement is due to the misclassification of cluster galaxies). However, with the biased sample, it is not easy to decouple the weak performance of the classification from the overall sampling bias, unfortunately.
To further investigate the bias in our original Subaru catalog itself, in Figure 12 we plot the distribution of galaxies as a function of the cluster-centric distance of all of the Subaru samples with or without NED spectroscopic redshifts. Namely, the Subaru sample is not matched with any other dataset. The left panel illustrates that all of the galaxies (CL + FG + BG) show an approximately flat distribution inward of ∼3 Mpc, consistent with an interpretation that our Subaru photometric catalog has no strong cluster-centric bias. Meanwhile, in the right panel, the FG + BG count, shown as a dotted line, is flat inside of ∼3 Mpc, demonstrating that, (a) our original Subaru catalog has no significant sampling bias with respect to the cluster-centric distance, (b) previous sampling biases revealed in Figure 9, Figure 10 and Figure 11 are not from the bias in our original Subaru data, and they can be mostly attributed to NED spectroscopic and/or SDSS photo-z bias, and (c) our ML FG + BG classification, and therefore our ML cluster membership, can be considered relatively reliable, if the flatness of the background distribution can be regarded as the indication of the reliable classification.
With the unbiased sampling and overall reliability of the cluster membership by ML, one can (1) conduct the investigation of cluster galaxies less affected by the size of the aperture from a cluster center, (2) conduct the investigation of galaxy counts or galaxy natures with respect to the cluster-centric distance, (3) directly use the number counts, or nature of cluster members to investigate the cluster galaxies rather than using the statistical ratio of the cluster galaxies to the fore/background galaxies, (4) further improve the accuracy of the investigation by employing an additional background subtraction, which requires the assumption of the flat background counts with respect to the cluster-centric distance, and (5) decouple the real enhancement of galaxy count, or galaxy nature, of the cluster members from the contaminating sampling bias or the membership misclassification.
Further investigations of cluster memberships using more than two bands, but to maintain the portability of the method, perhaps up to five bands, can be conducted in the future to improve our membership-classification performance. The CNN (Convolutional Neural Network) [54] model, which uses the image more directly, and the CNN model combined with the MLP model can also be tested for the improvement of the performance. Meanwhile, optimal MLP input measures to further improve our performance for the faint galaxies, and more distant galaxies, should be investigated using existing large deep surveys, such as HSC SSP survey [55], and future larger galaxy datasets for the ML cluster membership.

Author Contributions

Conceptualization, Y.H.; methodology, Y.H. and C.-H.L.; software, Y.H. and C.-H.L.; validation, Y.H. and C.-H.L.; formal analysis, Y.H.; investigation, Y.H.; resources, Y.H.; data curation, Y.H.; writing—original draft preparation, Y.H.; writing—review and editing, Y.H.; visualization, Y.H.; supervision, Y.H.; project administration, Y.H. All authors have read and agreed to the published version of the manuscript.

Funding

This research received no external funding.

Data Availability Statement

Not applicable.

Acknowledgments

This research has made use of the NASA/IPAC Extragalactic Database (NED), which is operated by the Jet Propulsion Laboratory, California Institute of Technology, under contract with the National Aeronautics and Space Administration. This research is based in part on data collected at Subaru Telescope, which is operated by the National Astronomical Observatory of Japan. We are honored and grateful for the opportunity of observing the Universe from Maunakea, which has a cultural, historical, and natural significance in Hawaii. SDSS-IV is managed by the Astrophysical Research Consortium for the Participating Institutions of the SDSS Collaboration including the Brazilian Participation Group, the Carnegie Institution for Science, Carnegie Mellon University, Center for Astrophysics|Harvard & Smithsonian, the Chilean Participation Group, the French Participation Group, Instituto de Astrofísica de Canarias, The Johns Hopkins University, Kavli Institute for the Physics and Mathematics of the Universe (IPMU)/University of Tokyo, the Korean Participation Group, Lawrence Berkeley National Laboratory, Leibniz Institut für Astrophysik Potsdam (AIP), Max-Planck-Institut für Astronomie (MPIA Heidelberg), Max-Planck-Institut für Astrophysik (MPA Garching), Max-Planck-Institut für Extraterrestrische Physik (MPE), National Astronomical Observatories of China, New Mexico State University, New York University, University of Notre Dame, Observatário Nacional/MCTI, The Ohio State University, Pennsylvania State University, Shanghai Astronomical Observatory, United Kingdom Participation Group, Universidad Nacional Autónoma de México, University of Arizona, University of Colorado Boulder, University of Oxford, University of Portsmouth, University of Utah, University of Virginia, University of Washington, University of Wisconsin, Vanderbilt University, and Yale University.

Conflicts of Interest

The authors declare no conflict of interest.

References

  1. Dekel, A.; Silk, J. The origin of dwarf galaxies, cold dark matter, and biased galaxy formation. Astrophys. J. 1986, 303, 39–55. [Google Scholar] [CrossRef]
  2. Oh, S.H.; De Blok, W.; Brinks, E.; Walter, F.; Kennicutt, R.C. Dark and luminous matter in THINGS dwarf galaxies. Astron. J. 2011, 141, 193. [Google Scholar] [CrossRef] [Green Version]
  3. Grillo, C.; Suyu, S.; Rosati, P.; Mercurio, A.; Balestra, I.; Munari, E.; Nonino, M.; Caminha, G.; Lombardi, M.; De Lucia, G.; et al. CLASH-VLT: Insights on the mass substructures in the Frontier Fields Cluster MACS J0416. 1–2403 through accurate strong lens modeling. Astrophys. J. 2015, 800, 38. [Google Scholar] [CrossRef]
  4. Caminha, G.; Rosati, P.; Grillo, C.; Rosani, G.; Caputi, K.; Meneghetti, M.; Mercurio, A.; Balestra, I.; Bergamini, P.; Biviano, A.; et al. Strong lensing models of eight CLASH clusters from extensive spectroscopy: Accurate total mass reconstructions in the cores. Astron. Astrophys. 2019, 632, A36. [Google Scholar] [CrossRef] [Green Version]
  5. Bergamini, P.; Rosati, P.; Mercurio, A.; Grillo, C.; Caminha, G.; Meneghetti, M.; Agnello, A.; Biviano, A.; Calura, F.; Giocoli, C.; et al. Enhanced cluster lensing models with measured galaxy kinematics. Astron. Astrophys. 2019, 631, A130. [Google Scholar] [CrossRef] [Green Version]
  6. Miyazaki, S.; Komiyama, Y.; Nakaya, H.; Kamata, Y.; Doi, Y.; Hamana, T.; Karoji, H.; Furusawa, H.; Kawanomoto, S.; Morokuma, T.; et al. Hyper suprime-cam. In Proceedings of the Ground-Based and Airborne Instrumentation for Astronomy IV, Online, 14 September 2012; International Society for Optics and Photonics: Bellingham, WA, USA, 2012; Volume 8446, p. 84460Z. [Google Scholar]
  7. Ivezić, Ž.; Kahn, S.M.; Tyson, J.A.; Abel, B.; Acosta, E.; Allsman, R.; Alonso, D.; AlSayyad, Y.; Anderson, S.F.; Andrew, J.; et al. LSST: From science drivers to reference design and anticipated data products. Astrophys. J. 2019, 873, 111. [Google Scholar] [CrossRef]
  8. Mobasher, B.; Colless, M.; Carter, D.; Poggianti, B.M.; Bridges, T.J.; Kranz, K.; Komiyama, Y.; Kashikawa, N.; Yagi, M.; Okamura, S. A photometric and spectroscopic study of dwarf and giant galaxies in the Coma cluster. IV. the luminosity function. Astrophys. J. 2003, 587, 605. [Google Scholar] [CrossRef] [Green Version]
  9. Agulli, I.; Aguerri, J.; Sánchez-Janssen, R.; Barrena, R.; Diaferio, A.; Serra, A.L.; Méndez-Abreu, J. Deep spectroscopic luminosity function of Abell 85: No evidence for a steep upturn of the faint-end slope. Mon. Not. R. Astron. Soc. Lett. 2014, 444, L34–L38. [Google Scholar] [CrossRef] [Green Version]
  10. Agulli, I.; Aguerri, J.; Diaferio, A.; Dominguez Palmero, L.; Sánchez-Janssen, R. Deep spectroscopy of nearby galaxy clusters–II. The Hercules cluster. Mon. Not. R. Astron. Soc. 2017, 467, 4410–4423. [Google Scholar] [CrossRef] [Green Version]
  11. Tanaka, M.; Kodama, T.; Arimoto, N.; Okamura, S.; Umetsu, K.; Shimasaku, K.; Tanaka, I.; Yamada, T. The build-up of the colour–magnitude relation as a function of environment. Mon. Not. R. Astron. Soc. 2005, 362, 268–288. [Google Scholar] [CrossRef] [Green Version]
  12. Trentham, N.; Tully, R.B. The faint end of the galaxy luminosity function. Mon. Not. R. Astron. Soc. 2002, 335, 712–732. [Google Scholar] [CrossRef] [Green Version]
  13. Chiboucas, K.; Tully, R.B.; Marzke, R.O.; Trentham, N.; Ferguson, H.C.; Hammer, D.; Carter, D.; Khosroshahi, H. Keck/LRIS Spectroscopic Confirmation of Coma Cluster Dwarf Galaxy Membership Assignments. Astrophys. J. 2010, 723, 251. [Google Scholar] [CrossRef] [Green Version]
  14. Molino, A.; Costa-Duarte, M.; de Oliveira, C.M.; Cenarro, A.; Neto, G.L.; Cypriano, E.; Sodré, L.; Coelho, P.; Chow-Martínez, M.; Monteiro-Oliveira, R.; et al. J-PLUS: On the identification of new cluster members in the double galaxy cluster A2589 and A2593 using PDFs. Astron. Astrophys. 2019, 622, A178. [Google Scholar] [CrossRef] [Green Version]
  15. Brescia, M.; Cavuoti, S.; D’Abrusco, R.; Longo, G.; Mercurio, A. Photometric redshifts for quasars in multi-band surveys. Astrophys. J. 2013, 772, 140. [Google Scholar] [CrossRef]
  16. Biviano, A.; Rosati, P.; Balestra, I.; Mercurio, A.; Girardi, M.; Nonino, M.; Grillo, C.; Scodeggio, M.; Lemze, D.; Kelson, D.; et al. CLASH-VLT: The mass, velocity-anisotropy, and pseudo-phase-space density profiles of the z = 0.44 galaxy cluster MACS J1206. 2-0847. Astron. Astrophys. 2013, 558, A1. [Google Scholar] [CrossRef] [Green Version]
  17. Angora, G.; Rosati, P.; Brescia, M.; Mercurio, A.; Grillo, C.; Caminha, G.; Meneghetti, M.; Nonino, M.; Vanzella, E.; Bergamini, P.; et al. The search for galaxy cluster members with deep learning of panchromatic HST imaging and extensive spectroscopy. Astron. Astrophys. 2020, 643, A177. [Google Scholar] [CrossRef]
  18. Baba, H.; Yasuda, N.; Ichikawa, S.I.; Yagi, M.; Iwamoto, N.; Takata, T.; Horaguchi, T.; Taga, M.; Watanabe, M.; Ozawa, T.; et al. Development of the subaru-mitaka-okayama-kiso archive system. In Proceedings of the Astronomical Data Analysis Software and Systems XI, Victoria, BC, Canada, 30 September–3 October 2001; Volume 281, p. 298. [Google Scholar]
  19. Yagi, M.; Kashikawa, N.; Sekiguchi, M.; Doi, M.; Yasuda, N.; Shimasaku, K.; Okamura, S. Luminosity Functions of 10 Nearby Clusters of Galaxies. I. Data. Astron. J. 2002, 123, 66–86. [Google Scholar] [CrossRef] [Green Version]
  20. Jordi, K.; Ammon, E. Empirical color transformations between SDSS photometry and other photometric systems. Astron. Astrophys. 2006, 460, 339–347. [Google Scholar] [CrossRef]
  21. Landolt, A. UBVRI photometric standard stars in the magnitude range 11.5–16.0 around the celestial equator. Astron. J. 1992, 104, 340–371. [Google Scholar] [CrossRef]
  22. Schlafly, E.F.; Finkbeiner, D.P. Measuring Reddening with Sloan Digital Sky Survey Stellar Spectra and Recalibrating SFD. Astrophys. J. 2011, 737, 103. [Google Scholar] [CrossRef]
  23. Chilingarian, I.; Melchior, A.; Zolotukhin, I. Analytical approximations of K-corrections in optical and near-infrared bands. Mon. Not. R. Astron. Soc. 2010, 405, 1409–1420. [Google Scholar] [CrossRef] [Green Version]
  24. Bertin, E.; Arnouts, S. SExtractor: Software for source extraction. Astron. Astrophys. Suppl. Ser. 1996, 117, 393–404. [Google Scholar] [CrossRef]
  25. Kron, R.G. Photometry of a complete sample of faint galaxies. Astrophys. J. Suppl. Ser. 1980, 43, 305–325. [Google Scholar] [CrossRef]
  26. Okamura, S.; Kodaira, K.; Watanabe, M. Digital surface photometry of galaxies toward a quantitative classification. III—A mean concentration index as a parameter representing the luminosity distribution. Astrophys. J. 1984, 280, 7–14. [Google Scholar] [CrossRef]
  27. Doi, M.; Fukugita, M.; Okamura, S. Morphological Classification of Galaxies Using Simple Photometric Parameters. Mon. Not. R. Astron. Soc. 1993, 264, 832. [Google Scholar] [CrossRef] [Green Version]
  28. Abraham, R.G.; Valdes, F.; Yee, H.K.C.; van den Bergh, S. The morphologies of distant galaxies. 1: An automated classification system. Astrophys. J. 1994, 432, 75–90. [Google Scholar] [CrossRef]
  29. Hashimoto, Y.; Oemler, A., Jr.; Lin, H.; Tucker, D. The Influence of Environment on the Star Formation Rates of Galaxies. Astrophys. J. 1998, 499, 589–599. [Google Scholar] [CrossRef] [Green Version]
  30. Hashimoto, Y.; Oemler, A., Jr. The Concentration-Density Relation of Galaxies in the Las Campanas Redshift Survey. Astrophys. J. 1999, 510, 609. [Google Scholar] [CrossRef] [Green Version]
  31. Conselice, C.J. The Relationship between Stellar Light Distributions of Galaxies and Their Formation Histories. Astrophys. J. Suppl. Ser. 2003, 147, 1–28. [Google Scholar] [CrossRef]
  32. Goto, T.; Yamauchi, C.; Fujita, Y.; Okamura, S.; Sekiguchi, M.; Smail, I.; Bernardi, M.; Gomez, P. The morphology-density relation in the Sloan Digital Sky Survey. Mon. Not. R. Astron. Soc. 2003, 346, 601–614. [Google Scholar] [CrossRef]
  33. Hashimoto, Y.; Henry, J.; Böhringer, H. Alignment of galaxies and clusters. Mon. Not. R. Astron. Soc. 2008, 390, 1562–1568. [Google Scholar] [CrossRef] [Green Version]
  34. Hashimoto, Y.; Henry, J.P.; Boehringer, H. Multiwavelength investigations of co-evolution of bright cluster galaxies and their host clusters. Mon. Not. R. Astron. Soc. 2014, 440, 588–600. [Google Scholar] [CrossRef] [Green Version]
  35. Abadi, M.; Barham, P.; Chen, J.; Chen, Z.; Davis, A.; Dean, J.; Devin, M.; Ghemawat, S.; Irving, G.; Isard, M.; et al. {TensorFlow}: A System for {Large-Scale} Machine Learning. In Proceedings of the 12th USENIX Symposium on Operating Systems Design and Implementation (OSDI 16), Savannah, GA, USA, 2–4 November 2016; pp. 265–283. [Google Scholar]
  36. Ramchoun, H.; Ghanou, Y.; Ettaouil, M.; Janati Idrissi, M.A. Multilayer perceptron: Architecture optimization and training. Int. J. Interact. Multimed. Artif. Intell. 2016, 4, 26–30. [Google Scholar] [CrossRef]
  37. Nair, V.; Hinton, G.E. Rectified Linear Units Improve Restricted Boltzmann Machines. In Icml; 2010; Available online: https://icml.cc/Conferences/2010/papers/432.pdf (accessed on 1 January 2022).
  38. Han, J.; Moraga, C. The influence of the sigmoid function parameters on the speed of backpropagation learning. In International Workshop on Artificial Neural Networks; Springer: Berlin/Heidelberg, Germany, 1995; pp. 195–201. [Google Scholar]
  39. Kingma, D.P.; Ba, J. Adam: A method for stochastic optimization. arXiv 2014, arXiv:1412.6980. [Google Scholar]
  40. Prechelt, L. Automatic early stopping using cross validation: Quantifying the criteria. Neural Netw. 1998, 11, 761–767. [Google Scholar] [CrossRef] [Green Version]
  41. O’Malley, T.; Bursztein, E.; Long, J.; Chollet, F.; Jin, H.; Invernizzi, L.; de Marmiesse, G.; Fu, Y.; Podivìn, J.; Schäfer, F. KerasTuner. 2019. Available online: https://github.com/keras-team/keras-tuner (accessed on 1 January 2022).
  42. Ramyachitra, D.; Manikandan, P. Imbalanced dataset classification and solutions: A review. Int. J. Comput. Bus. Res. (IJCBR) 2014, 5, 1–29. [Google Scholar]
  43. Kent, S.; Gunn, J. The dynamics of rich clusters of galaxies. I-The Coma cluster. Astron. J. 1982, 87, 945–971. [Google Scholar] [CrossRef]
  44. Zhao, J.; Shao, Z. Statistical deformation of line-of-sight velocity membership of galaxy clusters. Astron. Astrophys. 1994, 288, 89–96. [Google Scholar]
  45. Caminha, G.; Grillo, C.; Rosati, P.; Balestra, I.; Karman, W.; Lombardi, M.; Mercurio, A.; Nonino, M.; Tozzi, P.; Zitrin, A.; et al. CLASH-VLT: A highly precise strong lensing model of the galaxy cluster RXC J2248.7-4431 (Abell S1063) and prospects for cosmography. Astron. Astrophys. 2016, 587, A80. [Google Scholar] [CrossRef]
  46. Stehman, S.V. Selecting and interpreting measures of thematic classification accuracy. Remote Sens. Environ. 1997, 62, 77–89. [Google Scholar] [CrossRef]
  47. Sorensen, T.A. A method of establishing groups of equal amplitude in plant sociology based on similarity of species content and its application to analyses of the vegetation on Danish commons. Biol. Skar. 1948, 5, 1–34. [Google Scholar]
  48. Beck, R.; Dobos, L.; Budavári, T.; Szalay, A.S.; Csabai, I. Photometric redshifts for the SDSS Data Release 12. Mon. Not. R. Astron. Soc. 2016, 460, 1371–1381. [Google Scholar] [CrossRef]
  49. Hashimoto, Y.; Henry, J.P.; Böehringer, H. Dwarf galaxies and cluster environments. Mon. Not. R. Astron. Soc. 2018, 481, 981–999. [Google Scholar]
  50. Agulli, I.; Aguerri, J.; Sánchez-Janssen, R.; Dalla Vecchia, C.; Diaferio, A.; Barrena, R.; Dominguez Palmero, L.; Yu, H. Deep spectroscopy of nearby galaxy clusters–I. Spectroscopic luminosity function of Abell 85. Mon. Not. R. Astron. Soc. 2016, 458, 1590–1603. [Google Scholar] [CrossRef] [Green Version]
  51. Perlich, C.; Kaufman, S.; Rosset, S. Leakage in data mining: Formulation, detection, and avoidance. In Proceedings of the 17th International Conference on Knowledge Discovery and Data Mining, San Diego, CA, USA, 21–24 August 2011; pp. 556–563. [Google Scholar]
  52. Umetsu, K. Cluster–galaxy weak lensing. Astron. Astrophys. Rev. 2020, 28, 1–106. [Google Scholar] [CrossRef]
  53. Hashimoto, Y.; Böhringer, H.; Umetsu, K. Dwarf galaxy luminosity functions and cluster environments. Mon. Not. R. Astron. Soc. 2022, 511, 2796–2813. [Google Scholar] [CrossRef]
  54. LeCun, Y.; Boser, B.; Denker, J.S.; Henderson, D.; Howard, R.E.; Hubbard, W.; Jackel, L.D. Backpropagation applied to handwritten zip code recognition. Neural Comput. 1989, 1, 541–551. [Google Scholar] [CrossRef]
  55. Aihara, H.; Arimoto, N.; Armstrong, R.; Arnouts, S.; Bahcall, N.A.; Bickerton, S.; Bosch, J.; Bundy, K.; Capak, P.L.; Chan, J.H.; et al. The hyper suprime-cam SSP survey: Overview and survey design. Publ. Astron. Soc. Jpn. 2018, 70, S4. [Google Scholar] [CrossRef]
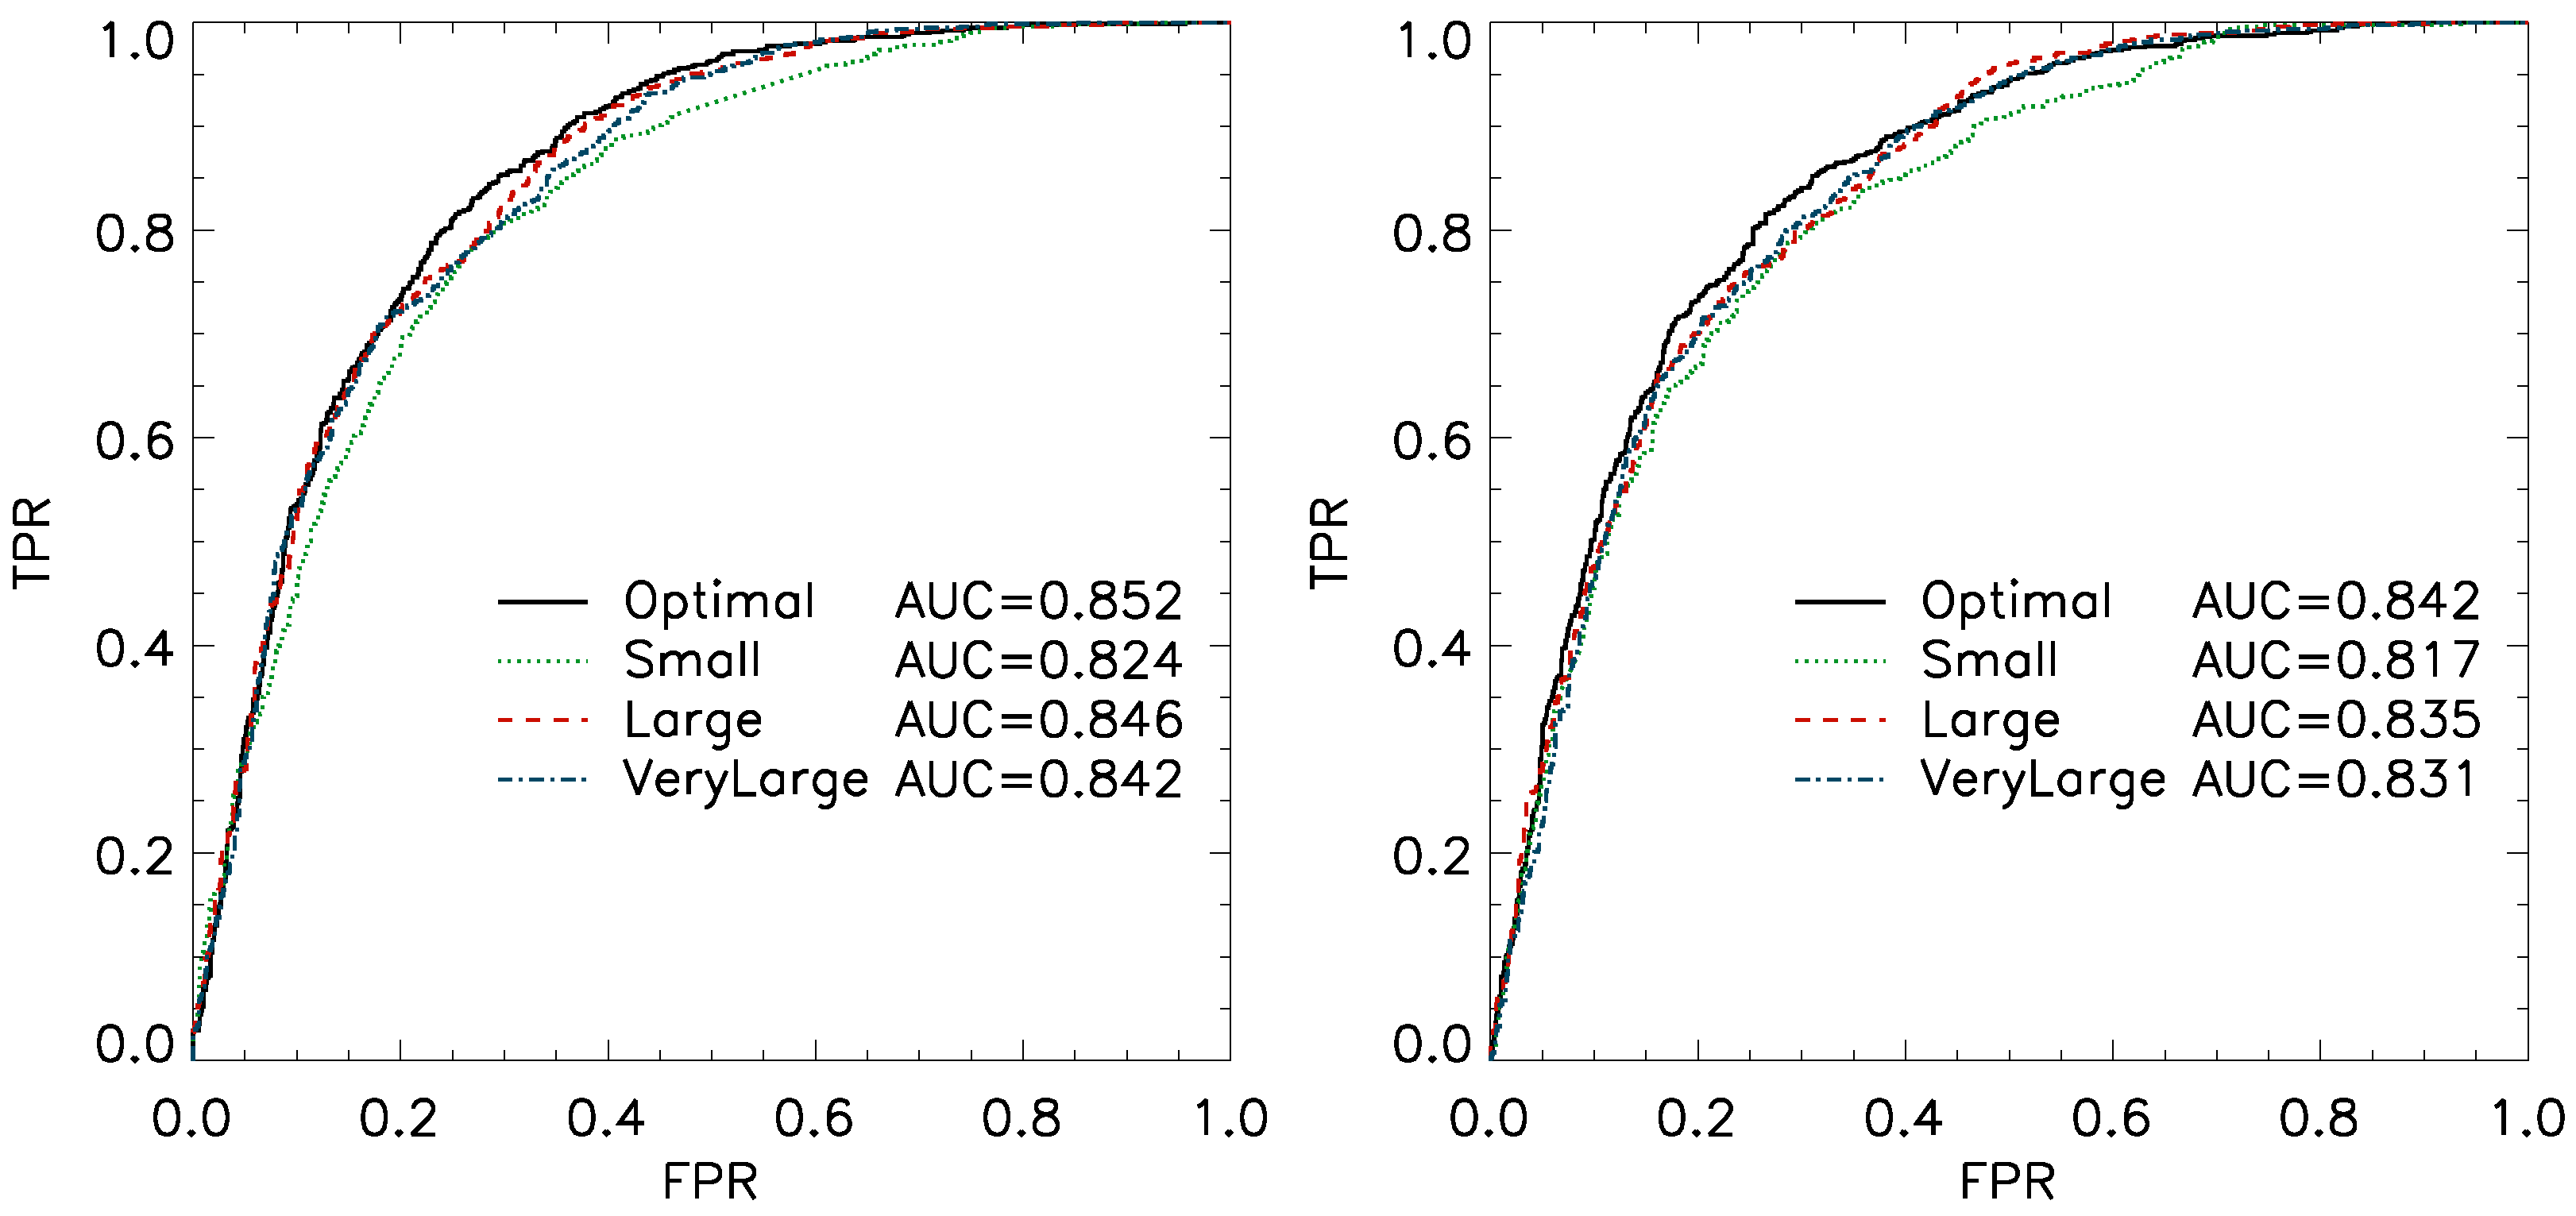
Figure 1. The ROC curves for various MLP architectures. FPR is the false positive rate and TPR is the true positive rate. The ‘Optimal’ size MLP model consists of 17 × 35 × 35 × 1 network architecture, i.e., the input layer consists of 17 neurons, the finally output layer consists of 1 neuron, and 2 intermediate hidden layers consist of 35 neurons each. ‘Small’, ‘Large’, and ‘VeryLarge’ models comprise 17 × 3 × 1, 17 × 100 × 100 × 100 × 1, and 17 × 100 × 100 × 100 × 100 × 1, respectively. The left and right panels show, the best and the median models out of all 50 trials, respectively.
Universe 08 00339 g001
Figure 2. The ROC curves for various cluster definitions. We vary the boundary of the cluster membership in the line-of-sight velocity to check if we have any particular sensitivity to a certain physical scale. The labels marked ‘3 k’, ‘4 k’, ‘5 k’, and ‘6 k’ represent 3000, 4000, 5000, and 6000 kms 1 velocity boundaries relative to the rest frame cluster velocity, respectively.
Universe 08 00339 g002
Figure 3. The ROC curves for various input measures. The label ‘area’ is the ISO_AREA_IMAGE, while the label ‘clz’ is the redshift of each cluster. The label ‘magx2’ means that the model is trained with only MAG_AUTO in two bands. The label ‘FULL’ means that the model is fed all of the measures for training, i.e., MAG_AUTO, ISO_AREA_IMAGE, CONC, FWHM_IMAGE, ELLIPTICITY, MAG_APER, BACKGROUND, ASYMMETRY in both bands, and clz.
Universe 08 00339 g003
Figure 4. The ROC curve variations of individual clusters. Note that the training is conducted using all clusters combined, but the validation is performed separately for each cluster in this plot.
Universe 08 00339 g004
Figure 5. Comparison of combined cluster training and individual cluster training. A diagonal line is where the combined and individual trainings produce the same AUC values.
Universe 08 00339 g005
Figure 6. The ROC curves for various validation apertures (left panel) and the AUC scores for various validation apertures (right panel).
Universe 08 00339 g006
Figure 7. Decoupling of foreground or background galaxies. Separating the background galaxies, labeled as ‘(CL + FG)vsBG’ turns out to be somewhat easier than separating the cluster membership, labeled as ‘CLvs(FG + BG)’, or than separating the foreground galaxies, labeled as ‘(CL + BG)vsFG’.
Universe 08 00339 g007
Figure 8. The ROC curve of our best model. The diagonal line is a random classification with AUC = 0.5, which has no classification power, plotted for comparison. The further away from this diagonal line, the better our classification performance.
Universe 08 00339 g008
Figure 9. Total sample distribution as a function of cluster-centric distance (left panel) and cluster membership assigned by spectroscopy (right panel), both corresponding to our Subaru sample with available spectroscopy. ‘All’ sample means that cluster (CL), foreground (FG), and background (BG) galaxies are all combined. The number of galaxies in each distance bin is normalized by the total number of galaxies and corrected for by the search area of the bin, thus an unbiased sample should show a flat distribution with respect to the cluster-centric distance.
Universe 08 00339 g009
Figure 10. Distributions of cluster memberships assigned by the SDSS photometric redshifts as a function of cluster-centric distance (left panel) and distributions of cluster memberships assigned by our ML (MLP best model) as a function of cluster-centric distance (right panel), both corresponding to our sample with spectroscopy.
Universe 08 00339 g010
Figure 11. Galaxy distribution free from the spectroscopic sampling bias. Total sample distribution as a function of cluster-centric distance (left panel) and cluster memberships assigned by photometric redshifts (right panel), both corresponding to our sample with or without spectroscopy. Namely, our Subaru catalog is matched only with photometric redshift catalog.
Universe 08 00339 g011
Figure 12. Sampling bias in our Subaru catalog itself. Total sample distribution as a function of the cluster-centric distance (left panel) and the cluster memberships assigned by the MLP best model (right panel), corresponding to our sample with or without spectroscopy.
Universe 08 00339 g012
Table 1. Cluster sample. No. of Galaxies with Spec is the number of galaxies in our Subaru sample with available NED spectroscopic redshifts.
ClusterRedshiftNo. of Galaxies with SpecNo. of Galaxies
A7810.298138265,745
RXJ17200.16471825,961
A12010.16970221,315
A16820.22662990,951
A16890.18448162,682
A6110.28835743,765
A22190.22831572,506
A7730.21723776,467
A23900.23320950,036
A22610.22417965,158
MS13590.32815528,654
A14130.1428159,959
ZWCL27010.2146872,660
RXJ21290.2355919,959
A17580.2802931,570
A680.2552337,153
Table 2. Our Best Model. No. of Measures is the number of input measures.
NameNo. of MeasuresArchitectureNo. of Trainable ParametersPUCOF1AUC
Best MLP1717 × 53 × 53 × 138700.7550.7610.7580.852
Table 3. Comparisons of various non-spectroscopic methods of the cluster membership.
MethodPurityCompletenessF1Accuracy
Color Selection0.5650.9160.6990.631
Red Sequence0.6710.7770.7200.717
Five Band Photo-z0.8080.2570.3900.598
Color Selection (r ≤ 1.5 Mpc)0.7220.9240.8110.725
Red Sequence (r ≤ 1.5 Mpc)0.8110.8110.8110.760
Five Band Photo-z (r ≤ 1.5 Mpc)0.9060.2210.3560.447
Best MLP0.7550.7610.7580.773
Best MLP (r ≤ 1.5 Mpc)0.8880.7890.8360.805
Table 4. Comparisons of various non-spectroscopic methods for various magnitudes. Bright galaxies are those with i magnitude between 14 and 20, while Faint galaxies are those with i magnitude between 20 and 27. Here, all methods are tested for the region r ≤ 1.5 Mpc.
MethodPurityCompletenessF1Accuracy
Color Selection (Bright)0.8260.9130.8680.782
Five Band Photo-z (Bright)0.9560.3310.4910.459
Color Selection (Faint)0.4920.9560.6490.590
Five Band Photo-z (Faint)0.5000.0540.0980.510
Best MLP (Bright)0.9300.9300.9300.890
Best MLP (Faint)0.9130.6770.7780.865
Publisher’s Note: MDPI stays neutral with regard to jurisdictional claims in published maps and institutional affiliations.