Abstract
The narrowband light from a scannable, single-mode dye laser influences the electrical properties of gas discharges. The variation in these properties as the laser wavelength λ is scanned yields the optogalvanic spectrum of the discharge (i.e., electrical conductivity vs. frequency). By connecting a neon lamp, capacitor, and power supply in parallel, an undriven relaxation oscillator is formed whose natural frequency f0 is affected by neon-resonant laser light and this λ-dependence of the relaxation oscillator frequency f0 yields a variant optogalvanic spectrum (i.e., f0 vs. frequency). In this paper, a driving force is effectively applied to an otherwise undriven oscillator when the incident light is chopped periodically at fd. For fd ≈ f0 and a sufficiently large driving force amplitude (laser intensity and the degree of neon resonance), the relaxation oscillator can be entrained so that f0 is locked on fd and is independent of λ. For the new chopped-light technique described here, fd is adjusted to be the subthreshold of the entrainment range, where the λ-dependence of f0 is advantageously exaggerated by periodic pulling, and the beat frequency |fd − f0| vs. λ provides an optogalvanic spectrum with appealingly amplified signal-to-noise qualities. Beat frequency neon spectra are reported for the cases fd < f0 and fd > f0 and are compared with spectra obtained using the unchopped-light (i.e., undriven) method.
1. Introduction
The impedance of a gas discharge is sensitive to laser irradiation at wavelengths corresponding to the electronic transitions of atoms or molecules present in the discharge. Electrical impedance change occurs in nonequilibrium dynamics and can be on the order of 0%-10% positive or negative, depending on the species, the transition, and the oscillatory nature of any dynamic forcing. Here, we focus on the optogalvanic effect that can be used to measure the spectra of majority, minority, and impurity species [1]. Applications of the optogalvanic effect are found in analytical chemistry, laser stabilization, wavelength measurements, and laser calibration.
Two mechanisms contribute significantly to the optogalvanic effect [2]. First, optical pumping alters the population in the electronic states, each state having its own ionization probability. Ionization probability changes the creation rate of ion–electron pairs that directly affects conductivity. The second mechanism involves collisions that transfer kinetic energy between free electrons and optically pumped atoms. Such collisions change the electron temperature, indirectly affecting conductivity. Typically, the impedance change is negative, but transitions originating from metastable states can induce a positive or negative change. From this change, optogalvanic spectra are detected directly from the dc discharge current using conventional techniques [3]. A higher signal-to-noise ratio is the hallmark of a clever relaxation oscillator method [4] for optogalvanic detection, whereby neon gas gets incorporated into a self-oscillating circuit.
Instead of obtaining a neon spectrum from laser wavelength-dependent deviations in the frequency of the discharge–recombination cycle, we apply a nearly entraining driving force to such a self-oscillating circuit and examine the resulting modulation (or beat) frequency that comes from quasiperiodic dynamics. The laser wavelength dependence of this modulation can be exaggerated by a factor of 50 beyond that of the oscillator frequency by the phenomenon of periodic pulling [5] to obtain the optogalvanic beat frequency spectrum of neon. These three methods (direct, relaxation oscillator, and beat frequency) are described in more detail in Section 2. Section 3 explains the principles of the driven oscillator method. The experimental details and results are included in Section 4, with a discussion and conclusions in Section 5.
2. Techniques for Optogalvanic Spectroscopy
2.1. Conventional Method [3]
A conventional circuit contains a large, in-series, ballast resistor (>10 kW) to maintain a steady current through the discharge. For a constant discharge current, the optogalvanic spectrum is determined from the laser wavelength dependence of the discharge voltage (i.e., the equilibrium discharge impedance). For the largest signals, measurements can be performed with an oscilloscope. For smaller signals, detection is complicated by the presence of background light emission from the ionized gas and by the steady-state discharge current. Phase synchronous detection is required to obtain a satisfactory signal-to-noise ratio. A lock-in amplifier eliminates noise by bandpass filtering the signal and subtracting the background level. Phase synchronous reference is provided by a mechanical chopper or acousto-optic modulator applied to the laser beam.
2.2. Relaxation Oscillator Method [4]
The need for a lock-in amplifier can be eliminated by incorporating the gas discharge into a self-oscillating electronic circuit. The dynamic circuit is known as a neon-bulb relaxation oscillator. The neon bulb is connected in parallel with a capacitor, C, which is charged through a resistor, R, leading from a dc power supply. The supply voltage, V0, is set just above the gas’ breakdown voltage, Vb. As the potential difference, V, across the capacitor, and also across the bulb, gradually approaches V0, the value V = Vb is eventually reached, whereupon the neon gas breaks down, the capacitor rapidly discharges, and V drops below the minimum value required to maintain the discharge. The nonequilibrium charge–discharge cycle is repeated at a frequency, f0, primarily determined by the time constant (τ−1 = RC) of the circuit, the dc power supply voltage, V0, and the electrical properties of the bulb, e.g., the electron density and metastable atom density. Neon-resonant irradiation causes a change in the electron density, the metastable atom density, and the overall ionization probability of the atoms as described above, directly affecting the breakdown voltage. An increase (a decrease) in Vb results in a decrease (an increase) in oscillation frequency. These laser-induced changes in f0 are larger when V0 is close to Vb and can be detected quantitatively with a frequency-to-voltage converter (e.g., a frequency counter) or qualitatively with an audio amplifier and speaker. The change in the oscillation frequency in a neon indicator bulb was reported to be a few percent and greater by two orders of magnitude than the change in the current in ordinary optogalvanic detection [4].
3. Principles of Driven Oscillator Method
3.1. Concepts of Entrainment and Periodic Pulling [5,6,7,8,9]
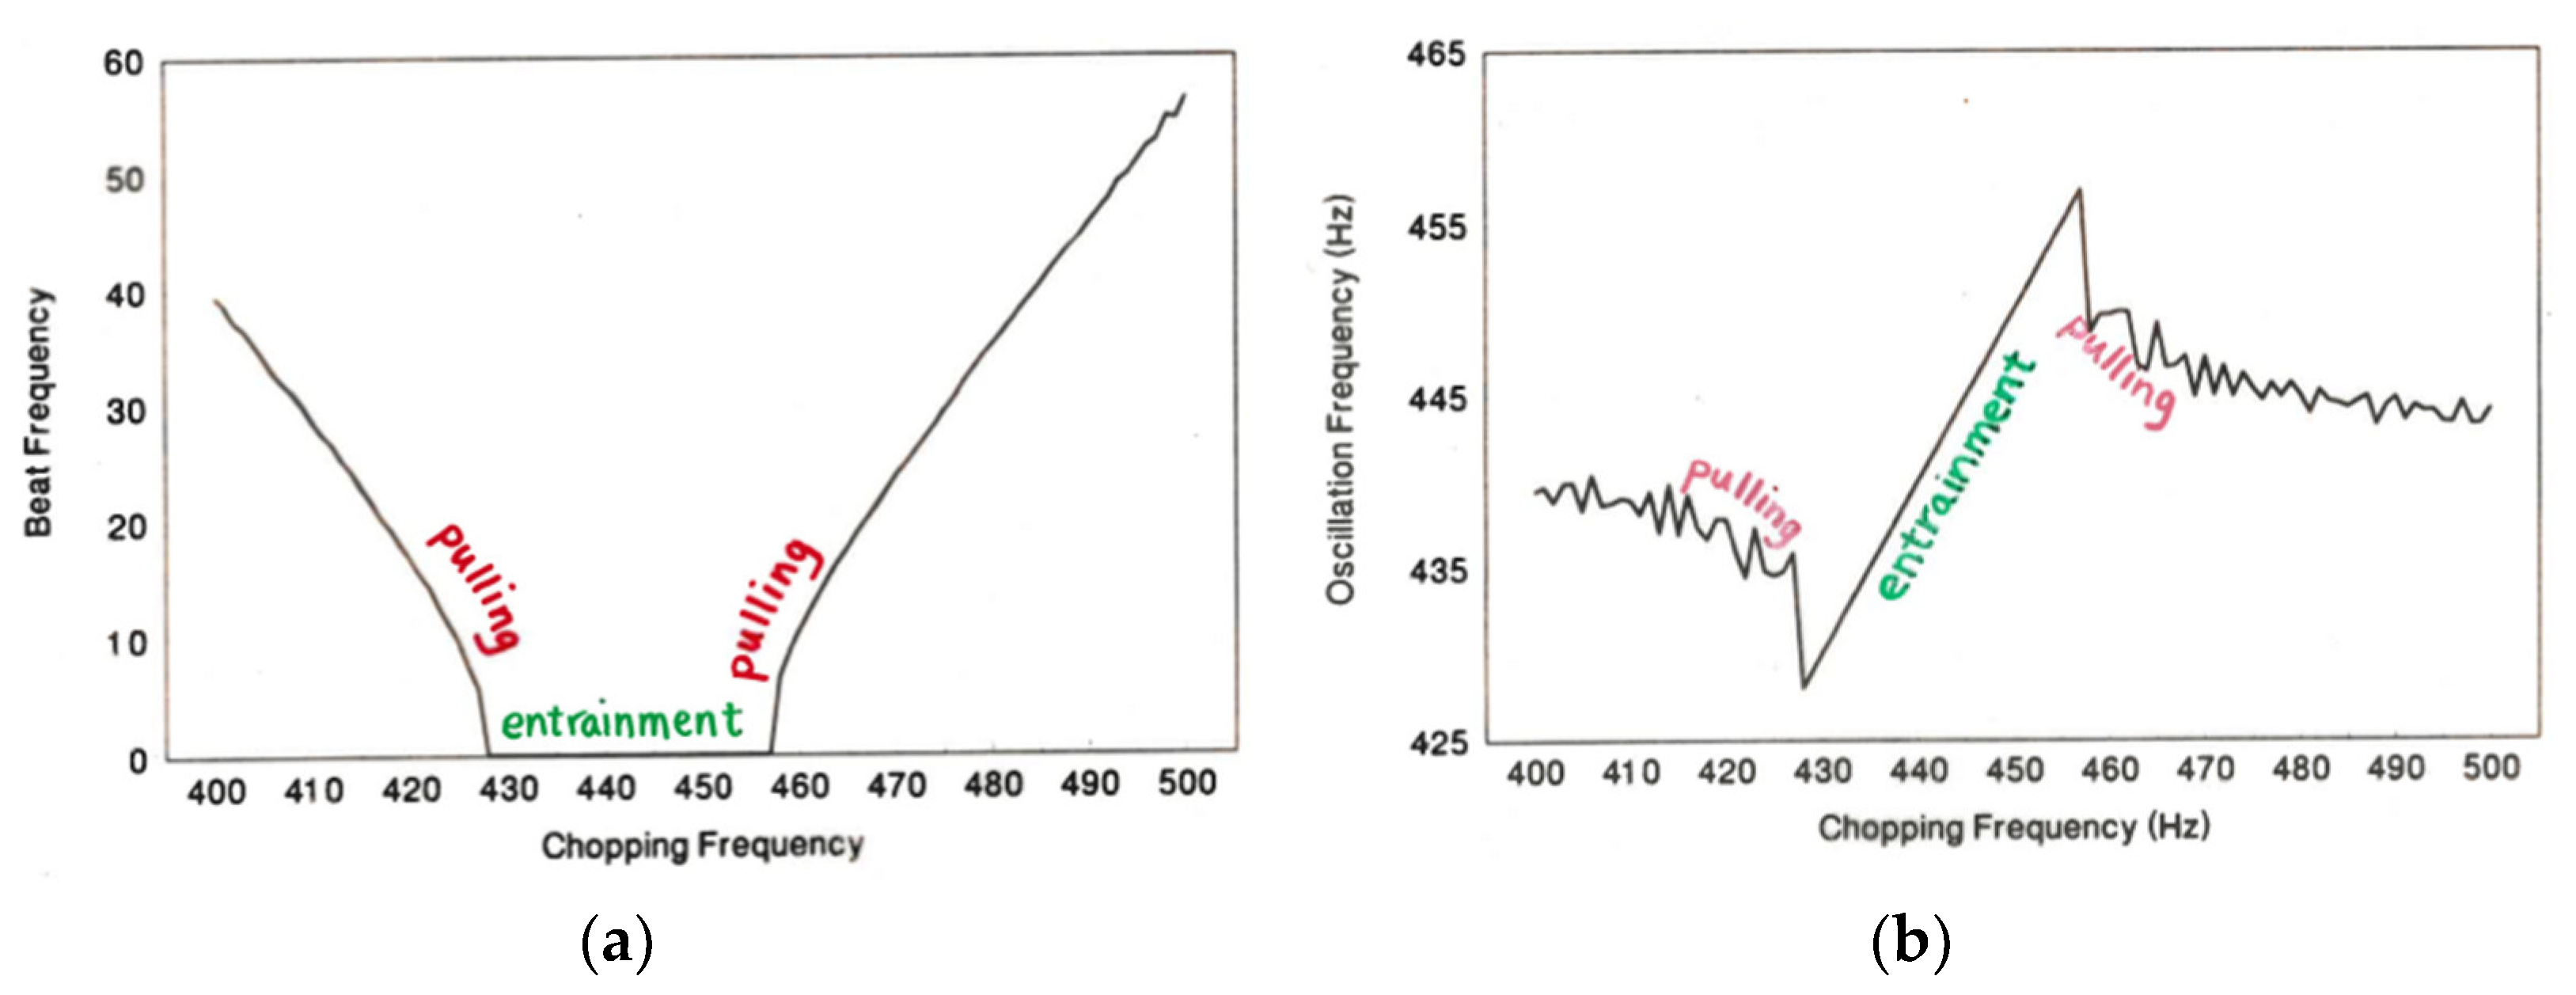
A real-world oscillator has nonlinearities that distinguish it from an ideal harmonic oscillator. Often, these nonlinearities are satisfactorily described by additional nonequilibrium terms in the differential equation modeling the system. Typically, the influence on the oscillator behavior of a nonlinearity, even one whose corresponding term has a small coefficient, is small for some conditions and dramatic for others. We are interested in conditions for which such an influence is large so that it can be used to exaggerate the effect of an externally applied driving force on a self-oscillating system. A large influence is achieved by setting the driving force frequency in close proximity to the natural frequency associated with the forced oscillator entrainment boundary known as the Arnol’d tongue in an Ad vs. fd/f0 graph.
Relaxation oscillation is a periodic process characterized by two different time scales that result from nonlinear dissipation or restoring-force processes. Relaxation oscillators [10] are observed in many different fields of science and technology [11,12,13,14]. The application of a driving force can significantly affect the behavior of a relaxation oscillator, making the behavior quasi-periodic. For instance, the periodicity of a neon-bulb oscillator can become independent of that associated with self-oscillation, and instead, it can be controlled within a certain range by entraining the oscillator to an external driving force with an adjustable period [15,16]. The range of frequencies associated with entrainment (for which f = fd) is bound by minimum and maximum values, (fE)min < f < (fE)max, which depend on the driving force amplitude normalized to undriven oscillator amplitude.
Entrainment, also known as mode locking, refers to the synchronization of a self-oscillating system to a periodically varying driving force [11]. It occurs if the driving force has an amplitude, Ad, sufficiently large and a frequency, fd, sufficiently close to the self-oscillation frequency, f0. A larger driving force amplitude is required to entrain a system farther away from its self-oscillation frequency (i.e., (Ad)crit is an increasing function of |f0 − fd| but, in the proximity of f0, the values of amplitude (Ad)crit are small compared to the self-oscillation, A0. Dunham [15] demonstrates that chopping the neon-resonant laser light incident on the discharge can entrain the oscillator to the harmonics and subharmonics of the chopping frequency. He further shows that the driven oscillator appears to exhibit chaotic behavior for some driving force parameters. Such behavior has been seen in neon glow discharge plasmas as well [17,18,19,20,21].
Periodic pulling occurs for conditions where fd < (fE)min or fd > (fE)max, i.e., just outside the entrainment range (fE)min < fd < (fE)max. Periodic pulling refers to the frequency modulation induced by a driving force unable to pull the system’s oscillation frequency all the way to the driving force frequency (i.e., to the point where each oscillation cycle is synchronized). Instead, the frequency is pulled part of the way and remains pulled, but not synchronized, over many relaxation oscillator cycles until a phase mismatch of approximately 180° eventually accumulates between the driving force’s phase and the neon-bulb oscillation’s phase. At this point, the pulling is interrupted and the oscillation frequency returns, in fact, overshoots, so that the phases re-match again, temporarily. This process gets repeated at a frequency that is sensitively dependent on both the driving force frequency and driving force amplitude because they determine the difference between the pulled oscillation frequency and the driving force frequency. The amplitude and frequency of a nonlinear oscillator are commonly interdependent, resulting in a synchronized frequency and amplitude modulation. Sheridan et al. [16], using an experimental arrangement similar to Dunham [15], demonstrate that chopping the neon-resonant laser light incident on the discharge can result in periodic pulling for driving force frequencies above and below the entrainment range. The experimental arrangement utilized for the investigation reported here is identical to that of Sheridan et al. [16], except that a narrowband scannable dye laser replaces the broadband scannable dye laser. This substitution permits the higher value of wavelength resolution necessary to achieve a sufficient degree of neon resonance for obtaining the spectra presented here.
3.2. Sensitivity of Beat Frequency to Small Changes in Driving Force
For fd << (fE)min and Ad << (Ad)crit, the influence of the driving force is weak and the modulation apparent in the system does not significantly vary from the conventional dependence on |f0 − fd|. However, for Ad <≈ (Ad)crit (i.e., for fd in the proximity of (fE)min or (fE)max), the modulation is sensitively dependent on the positive values of (Ad)crit − Ad, as expected for periodic pulling [5]. The value of (Ad)crit − Ad can be controlled by varying the driving force amplitude or by varying the driving force frequency (which changes (Ad)crit). This sensitivity is demonstrated in the neon-bulb oscillator, in which case the driving force amplitude is related to the degree of resonance between the laser light energy and the atomic energy states (which is maximum when λL = hc/Eneon, where h is Planck’s constant, c is the speed of light, and Eneon is the energy of the atomic transition). Figure 1 shows how the behaviors of the oscillator frequency and beat frequency differ from the conventional behavior as the driving force frequency is scanned across a range that includes an entrainment regime where Ad > (Ad)crit. Just outside the entrainment regime, small changes in |f0 − fd| are seen to result in large changes in beat frequency.
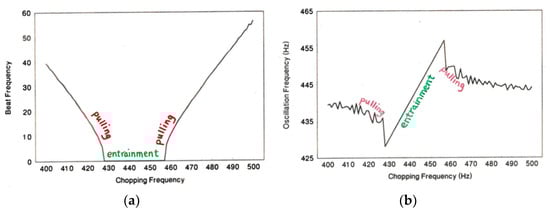
Figure 1.
System’s oscillation frequency and system’s beat frequency as a function of chopping frequency, i.e., driving frequency. (a) Beat frequency and (b) system’s oscillation frequency shows effects of periodic pulling and entrainment when driving and oscillation frequency values are close.
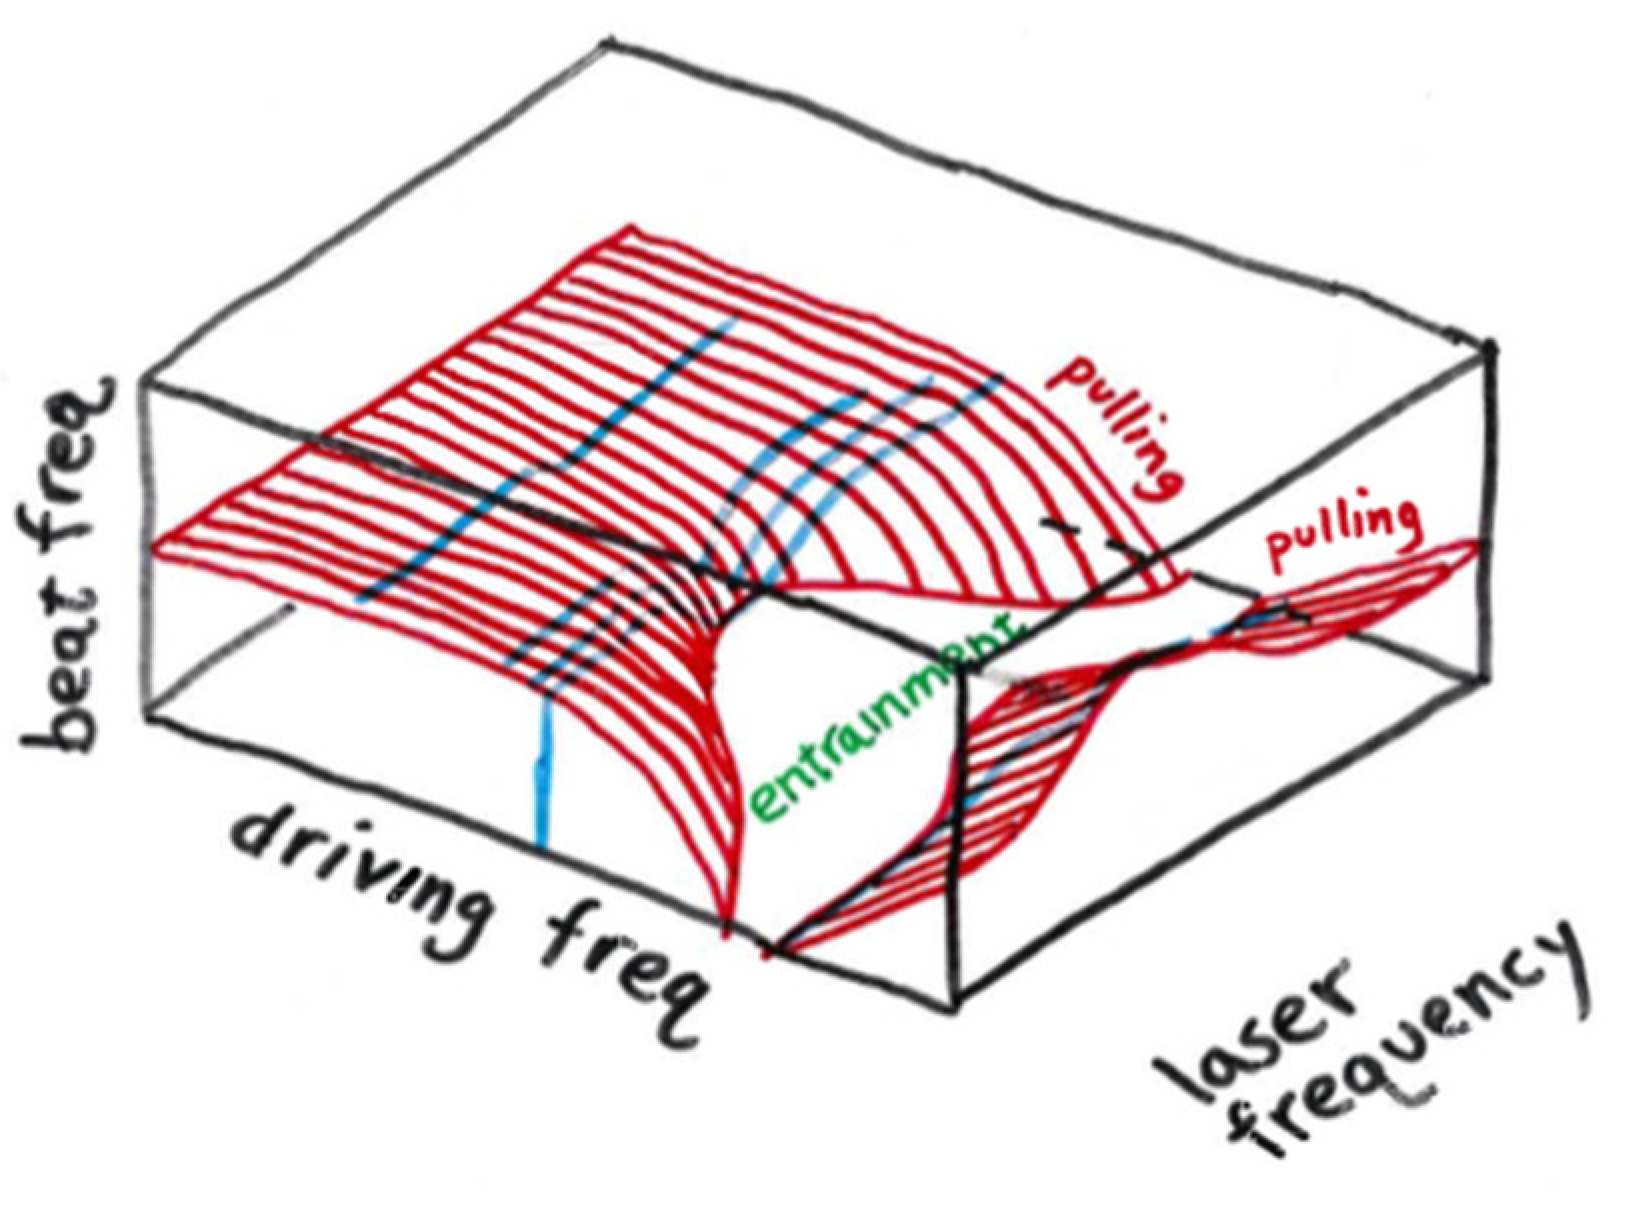
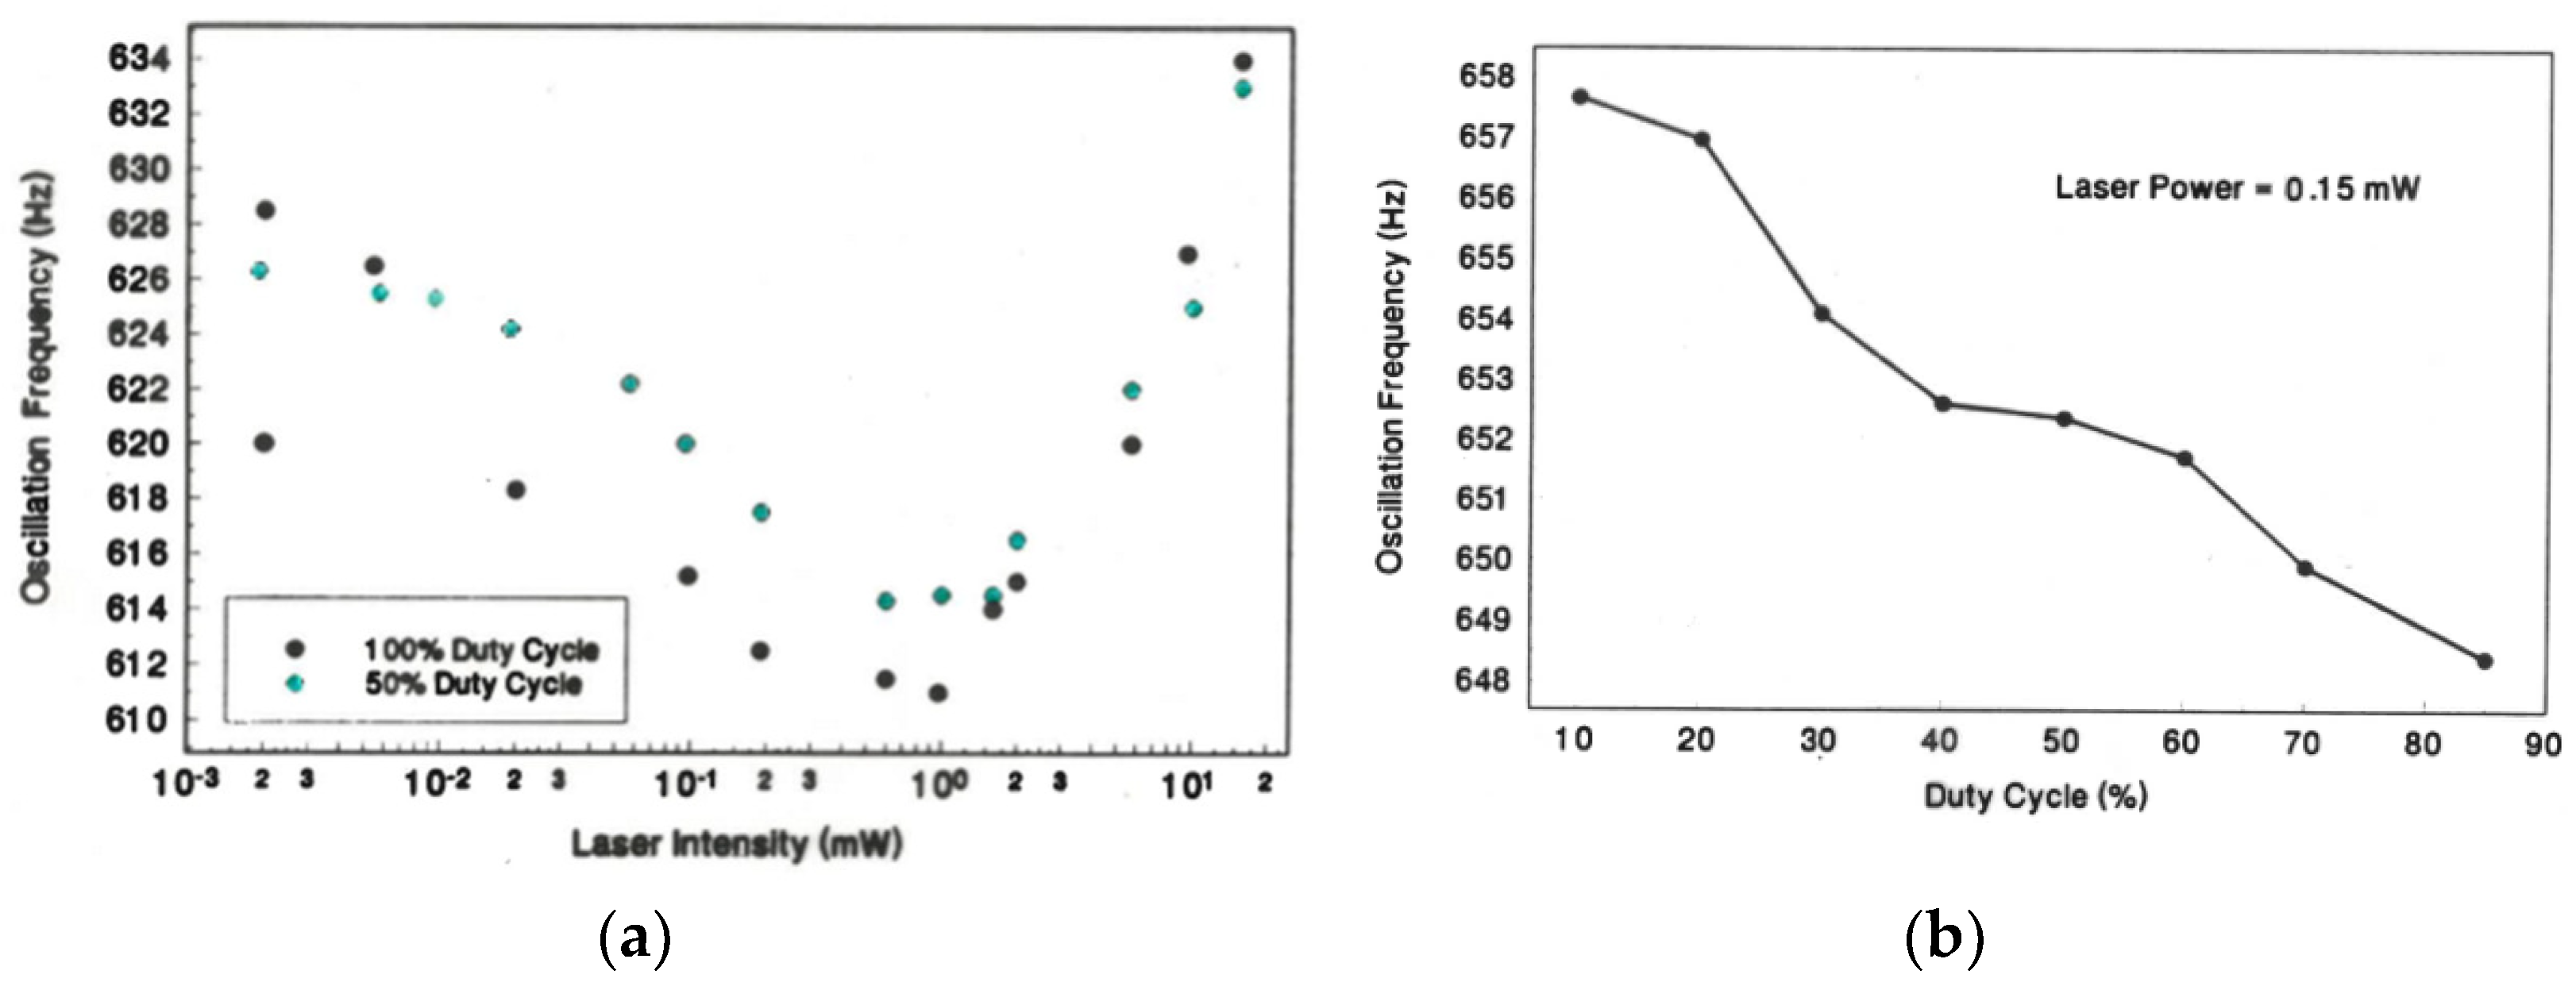
Another demonstration of the exaggerated dependence of the beat frequency is shown in Figure 2 which shows the value of fb that corresponds to each of the several combinations of driving force amplitude (which changes with λL) and driving force frequency fd. This correspondence is affected by the widening and shifting of the entrainment regime along the fd axis as λL is incremented in the vicinity of neon’s 575 nm line. This widening, which is a feature of the driven nonlinear oscillator model, corresponds to an increase in Ad, and consequently an increased fd range for which Ad > (Ad)crit, as the degree of neon resonance increases. The degree of neon resonance is directly related to the driving force amplitude. The shifting is not a feature of the model but occurs because the dc neon-resonant laser light lowers the self-oscillation frequency of the relaxation oscillator. This phenomenon is documented in Figure 3, which shows the oscillation frequency for different intensities of dc neon-resonant laser light and also for different duty cycles of chopped neon resonant laser light. Presumably, a laser-induced redistribution of the atomic energy-level populations is responsible for this effect on the self-oscillation frequency.
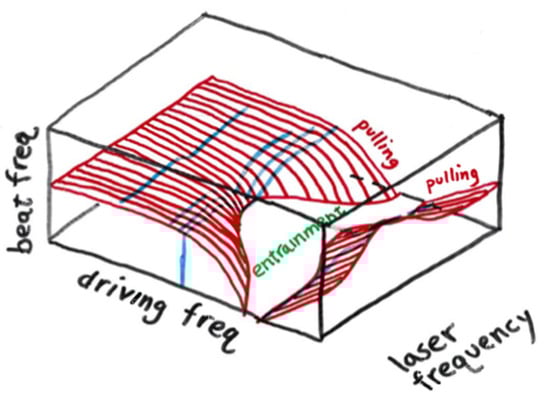
Figure 2.
Beat frequency (increasing vertically) vs. driving force frequency (increasing from left to right). Effect of incident laser light’s resonance with neon influences the relaxation oscillator’s natural frequency, while the Arnol’d tongue feature remains dominant. Here, the system’s natural frequency, approximated by the entrainment’s midpoint along fd axis, decreases slightly as the laser light is scanned through the neon line. The blue line is the optogalvanic beat frequency spectrum (see Figure 6) for a given value of laser chopping frequency, i.e., driving frequency. Of interest is the blue line that is immediately to the left of the zero-beat-frequency region, i.e., entrainment region.
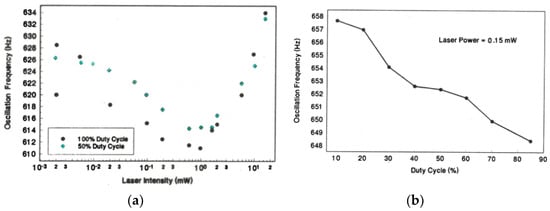
Figure 3.
Natural frequency vs. duty cycle. (a) Increasing laser intensity increases optogalvanic effect until heating effects dominate. (b) Optogalvanic effect increases (relaxation oscillator’s national frequency decreases) as chopping duty cycle increases.
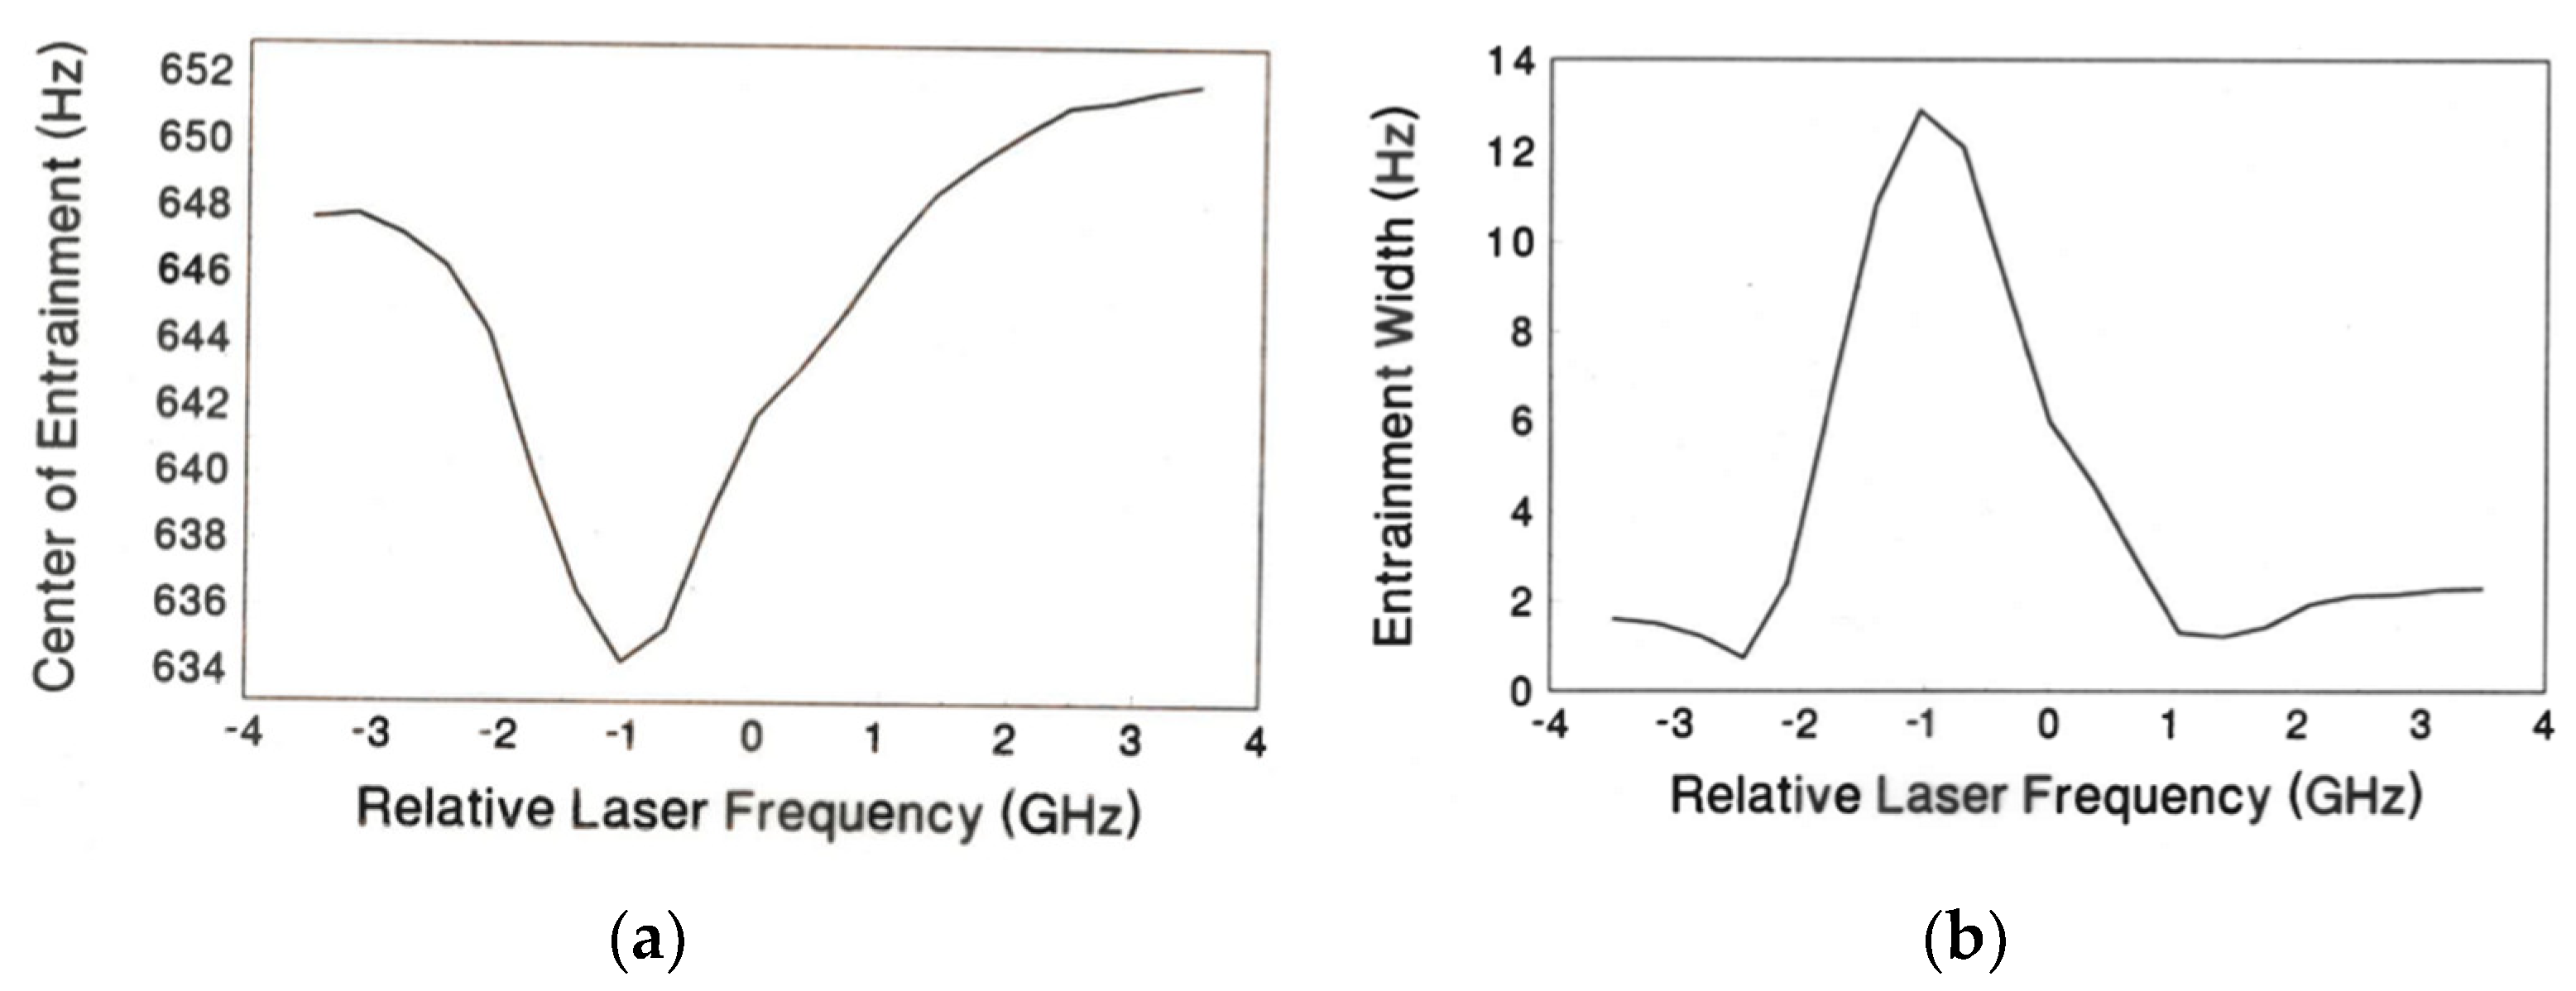
It is possible to approximately isolate the two effects by determining the value of [(fE)max ± (fE)min]/2, which is the expression for the width (−) and center (+) of the entrainment regime, as a function of λL, as shown in Figure 4. The combination of these effects results in a slightly increased (decreased) sensitivity of the beat frequency on λL for fd < f0 (for fd > f0). The plot of beat frequency fb as a function of λL is referred to as the beat frequency spectrum. This beat frequency spectrum is optogalvanic in nature since it is sensitive to the influence of resonant laser light on the electrical properties of the gas.
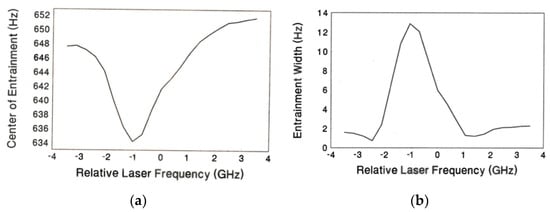
Figure 4.
Isolation of two effects (widening and shifting). (a) Center of entrainment shifts as optogalvanic effect increases. (b) Entrainment width broadens as optogalvanic effect increases.
4. Results
The experimental configuration is shown in Figure 5. The relaxation oscillator consists of a power supply, a neon bulb, and the circuit elements of resistance and capacitance. For specific values of the resistor, capacitor, and discharge voltage, the discharge occurs in the 2N11 bulb at a frequency of 3 kHz. The ring dye laser (Coherent 899-21) utilizes Rhodamine 6G dye and is pumped by a 4 W argon-ion laser (Coherent Innova 304). The discharge frequency reduces to 2.6 kHz when 10 mW of dc laser light, non-resonant with neon, is incident on the neon bulb, presumably due to energy absorption by the walls and electrodes of the tube, resulting in the bulk heating of the neon gas. The laser wavelength is calibrated by matching the observed wavelengths of several spectral lines to published values. The light is chopped with an acousto-optic modulator controlled by a square-wave voltage signal with an adjustable duty cycle. Neutral density filters are used to adjust the light intensity. Except where noted, the duty cycle is 50%. A frequency counter determines the frequency of the oscillator from the voltage across the neon bulb. The beat frequency of the driven oscillator is measured in the same way by attaching a low-pass filter to the input of the counter.
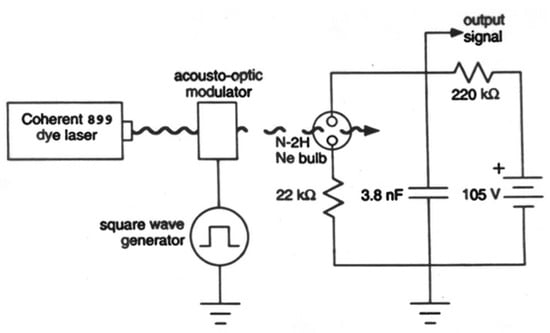
Figure 5.
Schematic diagram of experimental setup.
To obtain a suitable beat frequency spectrum, the sensitivity of the beat frequency to the driving force frequency must be maximized while avoiding entrainment when λL is resonant with an atomic transition in the gas. This is accomplished by adjusting the value of fd and the attenuation of the laser light.
Figure 6 shows beat frequency spectra for the cases of fd < f0 and fd > f0. The slightly exaggerated sensitivity of the beat frequency to λL due to the additive combination of the effects of shifting and widening is recognizable in the case of fd < f0. The spectral feature has a height above the background comparable to the background, i.e., a signal-to-background ratio of unity. Here, the background is the off-resonance value of the beat frequency.
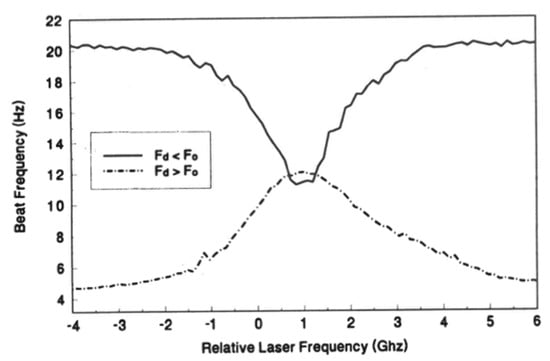
Figure 6.
Beat frequency spectra. Influence of optogalvanic effect on beat frequency for driving force frequency smaller or larger than the relaxation oscillator’s natural frequency.
5. Discussion and Conclusions
The driven oscillator method relies on the nonlinear, nonequlibrium nature of the gas discharge, specifically, the nonlinearity associated with the relaxation oscillation mechanism and the plasma dynamics. This requirement limits the list of gasses that may be analyzed with this method to the same list as the corresponding list for the relaxation method.
Whereas ionized gas is interrogated in conventional optogalvanic spectroscopy, the properties of neutral gas, such as the value of the breakdown voltage, are also influential in both the driven oscillator and relaxation oscillator methods. One possibility wherein the driving force affects only the ionized gas involves a silicon-controlled rectifier (SCR) to operate the discharge. This and a number of other physics details, such as the effect on the oscillation frequency of varying the relative phase difference between the relaxation and chopping cycles, have not been addressed here but are worthy of future investigation.
Although the driven oscillator method of determining the optogalvanic spectrum requires more care and additional equipment compared to the relaxation oscillator method, it provides a signal more sensitive at the approximate location of the spectral features. An important aspect of this comparison is compensating for the fact that the driven oscillator method involves fewer photons due to the chopping of the laser light that is inherent in the method. A simple compensation is possible by comparing the driven oscillator method results at one intensity of laser light with the relaxation oscillator results at either the same 50% duty cycle, instead of the ordinary 100% duty cycle, or at 100% duty cycle at half the intensity. Examples of oscillator frequency spectra with 100% duty cycle and 100% intensity, 100% duty cycle and 50% intensity, and 50% duty cycle and 100% intensity are compiled in Figure 7 as dashed, dotted, and solid lines, respectively. Note that the ratio of the signal (i.e., the dip or bump in the spectrum) to the background level is significantly greater in Figure 6 (1:1.5 compared to 1:50) than any of the cases in Figure 7 (1:50 compared to 1:1.5) because Figure 6 is the heterodyned version of Figure 7. This heterodyning is the added spectroscopic benefit of this driven oscillator methodology. It is worth noting that the appearance of dip exaggeration slightly evident in the dashed-line spectrum in Figure 7 may be attributable to the inadvertent proximity of the natural frequency to the 50% duty cycle chopping of the laser light. In that case, periodic pulling occurring across the neon spectral line is maximum where the neon resonance (i.e., the driving force amplitude in the system) is maximum.
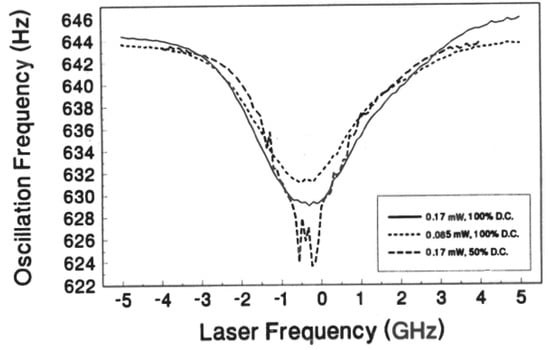
Figure 7.
Influence of laser intensity and chopping duty cycle (D.C.) on optogalvanic spectral line amplitude and shape. Beat freq spectra for 100%-100%, 100%-50%, 50%-100% (ratio of intensity to duty cycle).
In conclusion, the driven oscillator method has been shown to provide the optogalvanic spectrum of neon. This spectrum has qualities that may be more appealing than those of the spectra obtained from other methods. The principle behind the driven oscillator method is the exaggeration, due to the periodic nonlinear phenomenon known as periodic pulling, of the effect of an externally applied driving force on a nonlinear, nonequilibrium, self-oscillating system.
Funding
This work received no direct external funding.
Data Availability Statement
Data is contained in laboratory notebooks and are available to interested colleagues.
Acknowledgments
Collaborative contributions from D. Segal, C. Selcher, T. Sheridan, and W. Amatucci are gratefully acknowledged.
Conflicts of Interest
The author declares no conflict of interest exists.
References
- Barbieri, B.; Beverini, N.; Sasso, A. Optogalvanic spectroscopy. Rev. Mod. Phys. 1990, 82, 603. [Google Scholar] [CrossRef]
- Reddy, M.N. Laser optogalvanic spectroscopy: Experimental details and potential applications in R and D. Def. Sci. J. 1994, 44, 279–293. [Google Scholar] [CrossRef]
- Goldsmith, J.E.M.; Lawler, J.E. Optogalvanic Spectroscopy. Contemp. Phys. 1981, 22, 235. [Google Scholar] [CrossRef]
- Yan, G.Y.; Fujii, K.I.; Schawlow, A.L. Relaxation-oscillator detection of optogalvanic spectra. Opt. Lett. 1990, 15, 142–144. [Google Scholar] [CrossRef] [PubMed]
- Lashinsky, H. Mathematical models for nonlinear mode interactions in bounded plasmas. In Nonlinear Effects in Plasmas; Kalman, G., Feix, M., Eds.; Second Orsay Summer Institute, Gordon and Breach: New York, NY, USA, 1969; p. 451. [Google Scholar]
- Koepke, M.E.; Hartley, D.M. Experimental verification of periodic pulling in a nonlinear electronic oscillator. Phys. Rev. A 1991, 44, 6877. [Google Scholar] [CrossRef] [PubMed]
- Klinger, T.; Greiner, F.; Rohde, A.; Piel, A.; Koepke, M. Van der Pol behavior of relaxation oscillations in a periodically driven thermionic discharge. Phys. Rev. E 1995, 52, 4316. [Google Scholar] [CrossRef] [PubMed]
- Michelsen, P.; Pécseli, H.L.; Rasmussen, J.J.; Schrittwieser, R. The current-driven, ion-acoustic instability in a collisionless plasma. Plasma Phys. 1979, 21, 61. [Google Scholar] [CrossRef]
- Hayashi, C. Nonlinear Oscillations in Physical Systems; McGraw-Hill: New York, NY, USA, 1964. [Google Scholar]
- Minorsky, N. Nonlinear Oscillations; Krieger: Malabar, FL, USA, 1962; Chapter 3. [Google Scholar]
- Pavlidis, T. Biological Oscillators: Their Mathematical Analysis; Academic: New York, NY, USA, 1973; Chapter 4. [Google Scholar]
- Guckenheimer, J.; Holmes, P. Nonlinear Oscillations, Dynamical Systems, and Bifurcations of Vector Fields; Springer: New York, NY, USA, 1983; Section 2.1. [Google Scholar]
- Carnahan, C.W.; Kalmus, H.P. Synchronized oscillators as frequency-modulation receiver limiters. Electronics 1944, 17, 108. [Google Scholar]
- Schneider, F. Oscillations and Traveling Waves in Chemical Systems. Angew. Chem. 1986, 98, 941. [Google Scholar] [CrossRef]
- Dunham, J.S. Isotope shift studies of Gd I transitions using laser optogalvanic spectroscopy. In Optogalvanic Spectroscopy: Proceedings of the Second International Meeting on Optogalvanic Spectroscopy and Allied Topics, Glasgow, UK, 2–3 August 1990; Allied Topics, Stewart, R., Lawler, J.E., Eds.; CRC Press: Boca Raton, FL, USA, 1991. [Google Scholar]
- Sheridan, T.E.; Koepke, M.E.; Selcher, C.A.; Good, T.N. Periodic pulling in a driven relaxation oscillator. Proc. SPIE 1993, 2039, 158–167. [Google Scholar]
- Wilke, C.; Leven, R.W.; Deutsch, H. Experimental and numerical study of prechaotic and chaotic regimes in a helium glow discharge. Phys. Lett. A 1989, 136, 114–120. [Google Scholar] [CrossRef]
- Weltmann, K.-D.; Klinger, T.; Wilke, C. Experimental control of chaos in a periodically driven glow discharge. Phys. Rev. E 1995, 52, 2106. [Google Scholar] [CrossRef] [PubMed]
- Klinger, T.; Piel, A.; Seddighi, F.; Wilke, C. Van der Pol dynamics of ionization waves. Phys. Lett. A 1993, 182, 312. [Google Scholar] [CrossRef]
- Weltmann, K.-D.; Koepke, M.E.; Selcher, C.A. Spatiotemporal laser perturbation of competing ionization waves in a neon glow discharge. Phys. Rev. E 2000, 62, 2773. [Google Scholar] [CrossRef] [PubMed]
- Koepke, M.E.; Dinklage, A.; Klinger, T.; Wilke, C. Spatiotemporal signatures of periodic pulling during ionization-wave-mode transitions. Phys. Plasmas 2001, 8, 1432. [Google Scholar] [CrossRef]


Disclaimer/Publisher’s Note: The statements, opinions and data contained in all publications are solely those of the individual author(s) and contributor(s) and not of MDPI and/or the editor(s). MDPI and/or the editor(s) disclaim responsibility for any injury to people or property resulting from any ideas, methods, instructions or products referred to in the content. |
© 2024 by the author. Licensee MDPI, Basel, Switzerland. This article is an open access article distributed under the terms and conditions of the Creative Commons Attribution (CC BY) license (https://creativecommons.org/licenses/by/4.0/).