Article

Comparative Study of Time-Resolved Fluorescent Nanobeads, Quantum Dot Nanobeads and Quantum Dots as Labels in Fluorescence Immunochromatography for Detection of Aflatoxin B1 in Grains

1
College of Food Science, Southwest University, Chongqing 400715, China
2
Chongqing Animal Disease Prevention and Control Center, Chongqing 401120, China
3
Institute for Clean Energy & Advanced Materials, School of Materials & Energy, Southwest University, Chongqing 400715, China
*
Author to whom correspondence should be addressed.
These authors contributed equally to this work.
Biomolecules 2020, 10(4), 575; https://doi.org/10.3390/biom10040575
Submission received: 24 February 2020 / Revised: 11 March 2020 / Accepted: 24 March 2020 / Published: 9 April 2020

Abstract

:
Label selection is an essential procedure for improving the sensitivity of fluorescence immunochromatography assays (FICAs). Under optimum conditions, time-resolved fluorescent nanobeads (TRFN), quantum dots nanobeads (QB) and quantum dots (QD)-based immunochromatography assays (TRFN-FICA, QB-FICA and QD-FICA) were systematically and comprehensively compared for the quantitative detection of aflatoxin B1 (AFB1) in six grains (corn, soybeans, sorghum, wheat, rice and oat). All three FICAs can be applied as rapid, cost-effective and convenient qualitative tools for onsite screening of AFB1; TRFN-FICA exhibits the best performance with the least immune reagent consumption, shortest immunoassay duration and lowest limit of detection (LOD). The LODs for TRFN-FICA, QB-FICA and QD-FICA are 0.04, 0.30 and 0.80 μg kg−1 in six grains, respectively. Recoveries range from 83.64% to 125.61% at fortified concentrations of LOD, 2LOD and 4LOD, with the coefficient of variation less than 10.0%. Analysis of 60 field grain samples by three FICAs is in accordance with that of LC-MS/MS, and TRFN-FICA obtained the best fit. In conclusion, TRFN-FICA is more suitable for quantitative detection of AFB1 in grains when the above factors are taken into consideration.

Graphical Abstract

1. Introduction

Aflatoxin is a type of secondary metabolite produced mainly by microscopic fungal species Aspergillus flavus and Aspergillus parasiticus in the environment of high temperature and humidity (temperature 25–30 °C, moisture > 15%) [1]. According to the International Agency for Research on Cancer (IARC) [2], aflatoxins have been classified as a grade I carcinogenic substance. Among them, aflatoxin B1 (AFB1) is the most toxic, with strongest carcinogenicity; it contaminates more than 100 kinds of foods such as grain, oils, milk, condiments, nuts, tea and dairy products [3,4]. Since AFB1-caused food contamination comprises about 75% out of total mycotoxin contaminations [5], maximum residue limits (MRLs) for AFB1 in grains have been set (from 2 to 20 μg kg−1) in many countries, including the European Union (EU), the United States of America and China [6,7,8].
To better monitor the threat of AFB1 contamination, various methods have been developed in the past few decades [9,10,11,12]. Although the results are reliable and accurate, instrumental techniques [13] need expensive equipment and complicated sample pretreatment. Biosensors based on the antibody immunoprobes such as enzyme-linked immunosorbent assay (ELISA) [14] and fluorescence-linked immunosorbent assay (FLISA) [15,16] can achieve quantitative detection with good performance of specificity, sensitivity and simplicity, but the heterogeneous immunoassays require multiwashing procedures and long analysis times. To address the above issues, lateral flow immunochromatography assays have been considered as a promising method for onsite screening of mycotoxins [17,18,19]. Moreover, immunochromatography assays based on fluorescent markers (time-resolved fluorescent nanobeads (TRFN), quantum dot nanobeads (QB) and quantum dots (QD), etc.) have gradually become a popular research field in recent years for their advantages of sensitivity, accuracy, automated detection, shorter detection time, and so on [20,21,22]. Several fluorescence immunochromatography assays for highly sensitive detection of AFB1 have been reported [20,21,23,24,25].
Although many methods based on immune interactions have been developed for the detection of toxic and harmful substances, it is impossible to compare the performance of those methods for identifying the most appropriate approach due to the utilization of distinct antibodies/antigens, markers and the detection conditions. In recent years, only a few reports have used comparative methods under the same conditions [26,27,28,29,30,31]. For instance, Xie et al. [27] established flow immunochromatography to detect Escherichia coli O157:H7 in milk, in which fluorescent microspheres and colloidal gold were compared in terms of antibody labeling efficiency, sensitivity, antibody consumption and coefficient of variation. Wu et al. [28] systematically and comprehensively compared the performance of fluorescent microsphere and quantum dot immunochromatographic strips for quantitative detection of aflatoxin M1 (AFM1) in milk. However, to the best of our knowledge, among the widely used fluorescent labeling materials of TRFN, QB and QD, there are no clear statements on which labeling material is better for AFB1 detection in foods by immunochromatography. In this paper, in order to find a more suitable fluorescent detection method for quantitative detection of AFB1 in grains, TRFN, QB and QD were used as labels to establish fluorescent immunochromatography (TRFN-FICA, QB-FICA and QD-FICA) for the first time by comparing antibody labeling efficiency, detection sensitivity, antibody and antigen consumption, and accuracy under the same conditions (Figure 1).

2. Materials and Methods

2.1. Materials and Apparatus

2.1.1. Materials

Time-resolved fluorescent nanobeads (TRFN, 1%, solid content, w/v; carboxylate-modified Eu (III)-chelate-doped polystyrene nanobeads; excitation = 365 nm, emission = 610 nm) were purchased from Bangs Laboratories, Inc. (Fishers, Hamilton, IN, USA). Carboxylated quantum dot nanobeads (QB, 1 uM, w/v, excitation = 365 nm, emission = 610 nm) and quantum dots (QD, 1.0 mg/mL, w/v; carboxylate-modified CdSe/ZnS core/shell nanocrystals with amphiphilic polymer coating; excitation = 365 nm, emission = 610 nm) were purchased from NanoGen (Beijing, China). Anti-AFB1 monoclonal antibody (mAb) and coating antigen (AFB1-CMO-BSA) were donated by Beijing WDWK Biotech Co., Ltd., (Beijing, China). N-hydroxysuccinimide (NHS) and 1-ethyl-3-[3-(dimethylamino) propyl] carbodiimide (EDC) were obtained from Aladdin (Shanghai, China). AFB1, aflatoxin B2 (AFB2), AFM1, aflatoxin M2 (AFM2), aflatoxin G1 (AFG1), aflatoxin G2 (AFG2), zearalenone (ZEN), ochratoxin A (OTA), deoxynivalenol (DON) and bovine serum albumin (BSA) were purchased from Sigma (St. Louis, MO, USA). Chicken IgY and rabbit antichicken IgY-IgG were obtained from Biodragon Immunotechnologies Co., Ltd. (Beijing, China). Other chemical substances were purchased from Beijing Chemical Reagent Company (Beijing, China). All solvents and other chemicals were of analytical reagent grade and did not require further purification. A working standard of AFB1 was prepared from the 2 mg mL−1 stock solution by serial dilution with a sample buffer solution (0.3 M Tris-HCl containing 0.5% polyvinyl pyrrolidone and 0.4% Tetronic 1307, pH 8.0).
The nitrocellulose (NC) membrane (Unistart CN95) was acquired from Sartorius Stedim Biotech GmbH (Goettingen, Germany). The sample pad (glass fiber) and the absorbent pad were supplied by Shanghai Liangxin Co., Ltd. (Shanghai, China). The microtiter plates were supplied by Guangzhou JET BIOFIL Co., Ltd. (Guangzhou, China).

2.1.2. Apparatus

An XYZ3060 dispensing platform was purchased from Bio Dot Inc. (Irvine, CA, USA). The CM4000 guillotine-cutting module was purchased from Kinbio Tech Co., Ltd. (Shanghai, China). The fluorescence immunochromatography quantitative analyzer was purchased from WDWK Bio Co., Ltd. (Beijing, China). Ultrapure water was purified with the Milli-Q system from Millipore Corp. (Bedford, MA, USA). The size distributions and surface morphologies of the three labels were determined by transmission electron microscope (JEM 1200EX, Tokyo, Japan). The mAb labels were characterized with a particle size analyzer (Malvern Instruments Ltd., Worcestershire, UK).

2.2. Preparation of Three Labeled Antibody Probes

The TRFN-mAb was prepared based on the procedures described in the previous literature with slight modification [26,30]. Briefly, 5 μL of TRFN was dissolved in 45 μL of activation buffer (50 mM MES (2-Morpholinoethanesulfonic Acid), pH 6.0) and then centrifuged at 20,000× g for 15 min at 4 °C. Subsequently, 40 μL of activation buffer, 5 μL of NHS solution (1 mM) and 5 μL of EDC solution (1 mM) were added to the tube and stirred for 15 min; the solution was centrifuged at 20,000× g for 15 min and the precipitate was resuspended in 25 μL boric acid buffer (40 mM, pH 8.0). Next, 25 μL of anti-AFB1-mAb was added to the suspension and incubated at room temperature for 2 h, then centrifuged, and the precipitate was dissolved in 100 μL of blocking buffer (20 mM PBS, 50 mM ethanolamine, 4% BSA, pH 7.4) for 2 h. After the end of the blocking, the mixture was centrifuged at 20,000× g for 15 min at 4 °C, and the precipitate was resuspended in 50 μL of complex solution (10 mM Tris, 1% BSA, 2% sucrose, 2% trehalose, pH 8.5) at 4 °C until use. Ultrasonic dispersion was required for 3 min after each resuspension by centrifugation.
The preparation of TRFN-IgY, QB-mAb and QD-mAb probes was identical to the preparation of TRFN-mAb, and the only differences were that chicken IgY was used instead of anti-AFB1-mAb, and QB and QD were used instead of TRFN, respectively. All the labeled antibody probes were stored at 4 °C until use.

2.3. Preparation of the Fluorescence Immunochromatography Assay Strips

The fluorescence quantitative immunochromatographic strips consisted of four parts: absorbent pad, NC membrane, sample pad and adhesive plastic-backing sheet (Figure 1B). The procedures for making test strips were the same as our previously reported work with some modifications [32,33]. Briefly, a proper amount of AFB1-CMO-BSA and rabbit antichicken IgY-IgG were separately sprayed onto the NC membrane as capture reagents to form T line and C line. The distance between T and C line was 1.2 cm and the dispense rate was 0.7 μL cm−1. Afterward, the dried NC membrane, sample pad and absorbent pad were laminated and cut into 4.7 mm wide test strips. Finally, the PVC sheet and strip were installed onto a plastic plate and stored in dry conditions at 4 °C until use.

2.4. Sample Preparation and Detection

The sample preparation procedure was applied for corn, soybeans, sorghum, wheat, rice and oats. First, all samples were ground into powder and sieved through 20 mesh; then 1.00 ± 0.05 g of the pulverized samples were extracted with 4 mL of methanol/water solution (70/30, v/v); the mixture was vortexed for 5 min and centrifuged at 4000× g for 5 min at room temperature. Afterwards, 1 mL of the supernatant was diluted with 9 mL of sample buffer solution (0.3 M Tris-HCl containing 0.5% polyvinyl pyrrolidone and 0.4% Tetronic 1307, pH 8.0) to obtain a sample treatment solution.
Finally, an appropriate amount of fluorescent probes was added and incubated with 120 μL of sample treatment solution for 5 min at room temperature (25 °C) in the microwell; 85 μL of incubated working solution was added into the test area. The fluorescence intensity ratio of T line and C line were defined as FT and FC. The fluorescence values of FT, FC and FT/FC were collected for quantification.

2.5. Establishment of Quantitative Calibration Curves

The quantitative calibration curves were established by plotting B/B0 (the concentration of the analyte was 0 μg L−1, the value of FT/FC was marked as B0; while the concentration of the analyte was at other concentrations, the value of FT/FC was marked as B) against the logarithm of AFB1 concentration. Different concentrations of AFB1 (0, 5 × 10⁻⁴, 1 × 10⁻³, 5 × 10⁻³, 0.01, 0.05, 0.1, 0.5 and 1 μg L−1) were prepared by diluting in sample buffer solution; each piece of data was repeated for 6 times and fit to a four-parameter logistic equation using Origin (version 8.5, OriginLab, USA) software packages,
y = ( A D ) / [ 1 + ( x / C ) B ] + D
where A is the response value at high asymptote, B is the slope at the inflection point, C is the x value at the inflection point (corresponding to concentration resulting in 50% inhibition), D is the response value at low asymptote.

2.6. Validation of FICAs

For validation of TRFN-FICA, QB-FICA and QD-FICA, 60 different field grain samples (10 samples for each of corn, soybeans, sorghum, wheat, rice and oats) were analyzed by the three FICAs and liquid chromatography–tandem mass spectrometry (LC-MS/MS); the LC-MS/MS procedures were performed according to the standard method of “GB5009.22-2016” [34]. The detection performances of the three FICAs were compared to that of the LC-MS/MS to assess reliability. The LOD was calculated as the mean value of 20 blank samples plus three times the standard deviation (mean + 3SD). The accuracy of the method was investigated by spiking blank samples with single or multiple analytes at three concentrations (LOD, 2LOD, 4LOD). The recovery was calculated by the following equation: Recovery (%) = (measured concentration / fortified concentration) × 100%. The intra-assay and interassay precisions were represented by the coefficient of variation (CV); each sample was tested 6 times in duplicate and on three consecutive days.

3. Results and Discussion

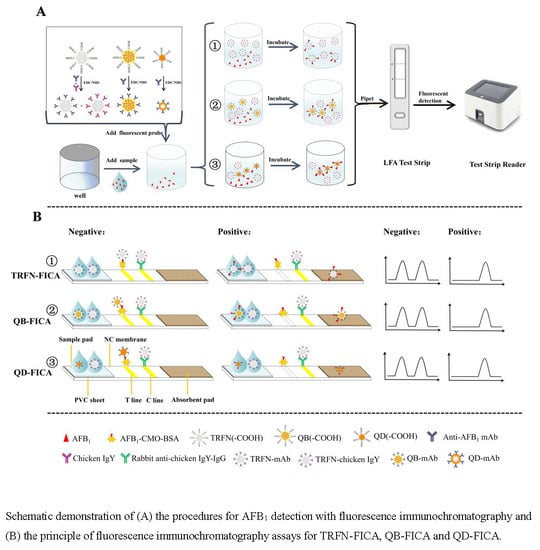
3.1. Principle of Three Fluorescence Labels for Detection of Aflatoxin B1

Three fluorescence labels were selected for the determination of AFB1 by direct competition reaction in general (Figure 1). Specifically, the rabbit antichicken IgY-IgG was immobilized on C line, and exhibited a constant C line fluorescence signal since the independent TRFN-chicken IgY was specially prepared for it. AFB1-CMO-BSA (coating antigen) was immobilized on T line, and when the fluorescence probes (QD-mAb, QB-mAb and TRFN-mAb) were not bound to free AFB1 molecules, they could be specifically captured by coating antigen as a reference signal in FICAs; otherwise, it would flow past both T and C lines with no signal. According to this principle, the adopted dual system (independent T and C lines) can maintain a comparatively stable C line fluorescence intensity with no interference; the fluorescence intensity of T line decreased with increased concentration of AFB1. Compared with previous studies of coating secondary antibodies to form T line [35,36], this dual system achieved better performance and could be applied in later reported immunochromatographic assays [37]. Overall, quantitative relationships can be established between the concentrations of AFB1 and FT/FC ratios, and can be further quantitatively calculated by the portable reader.

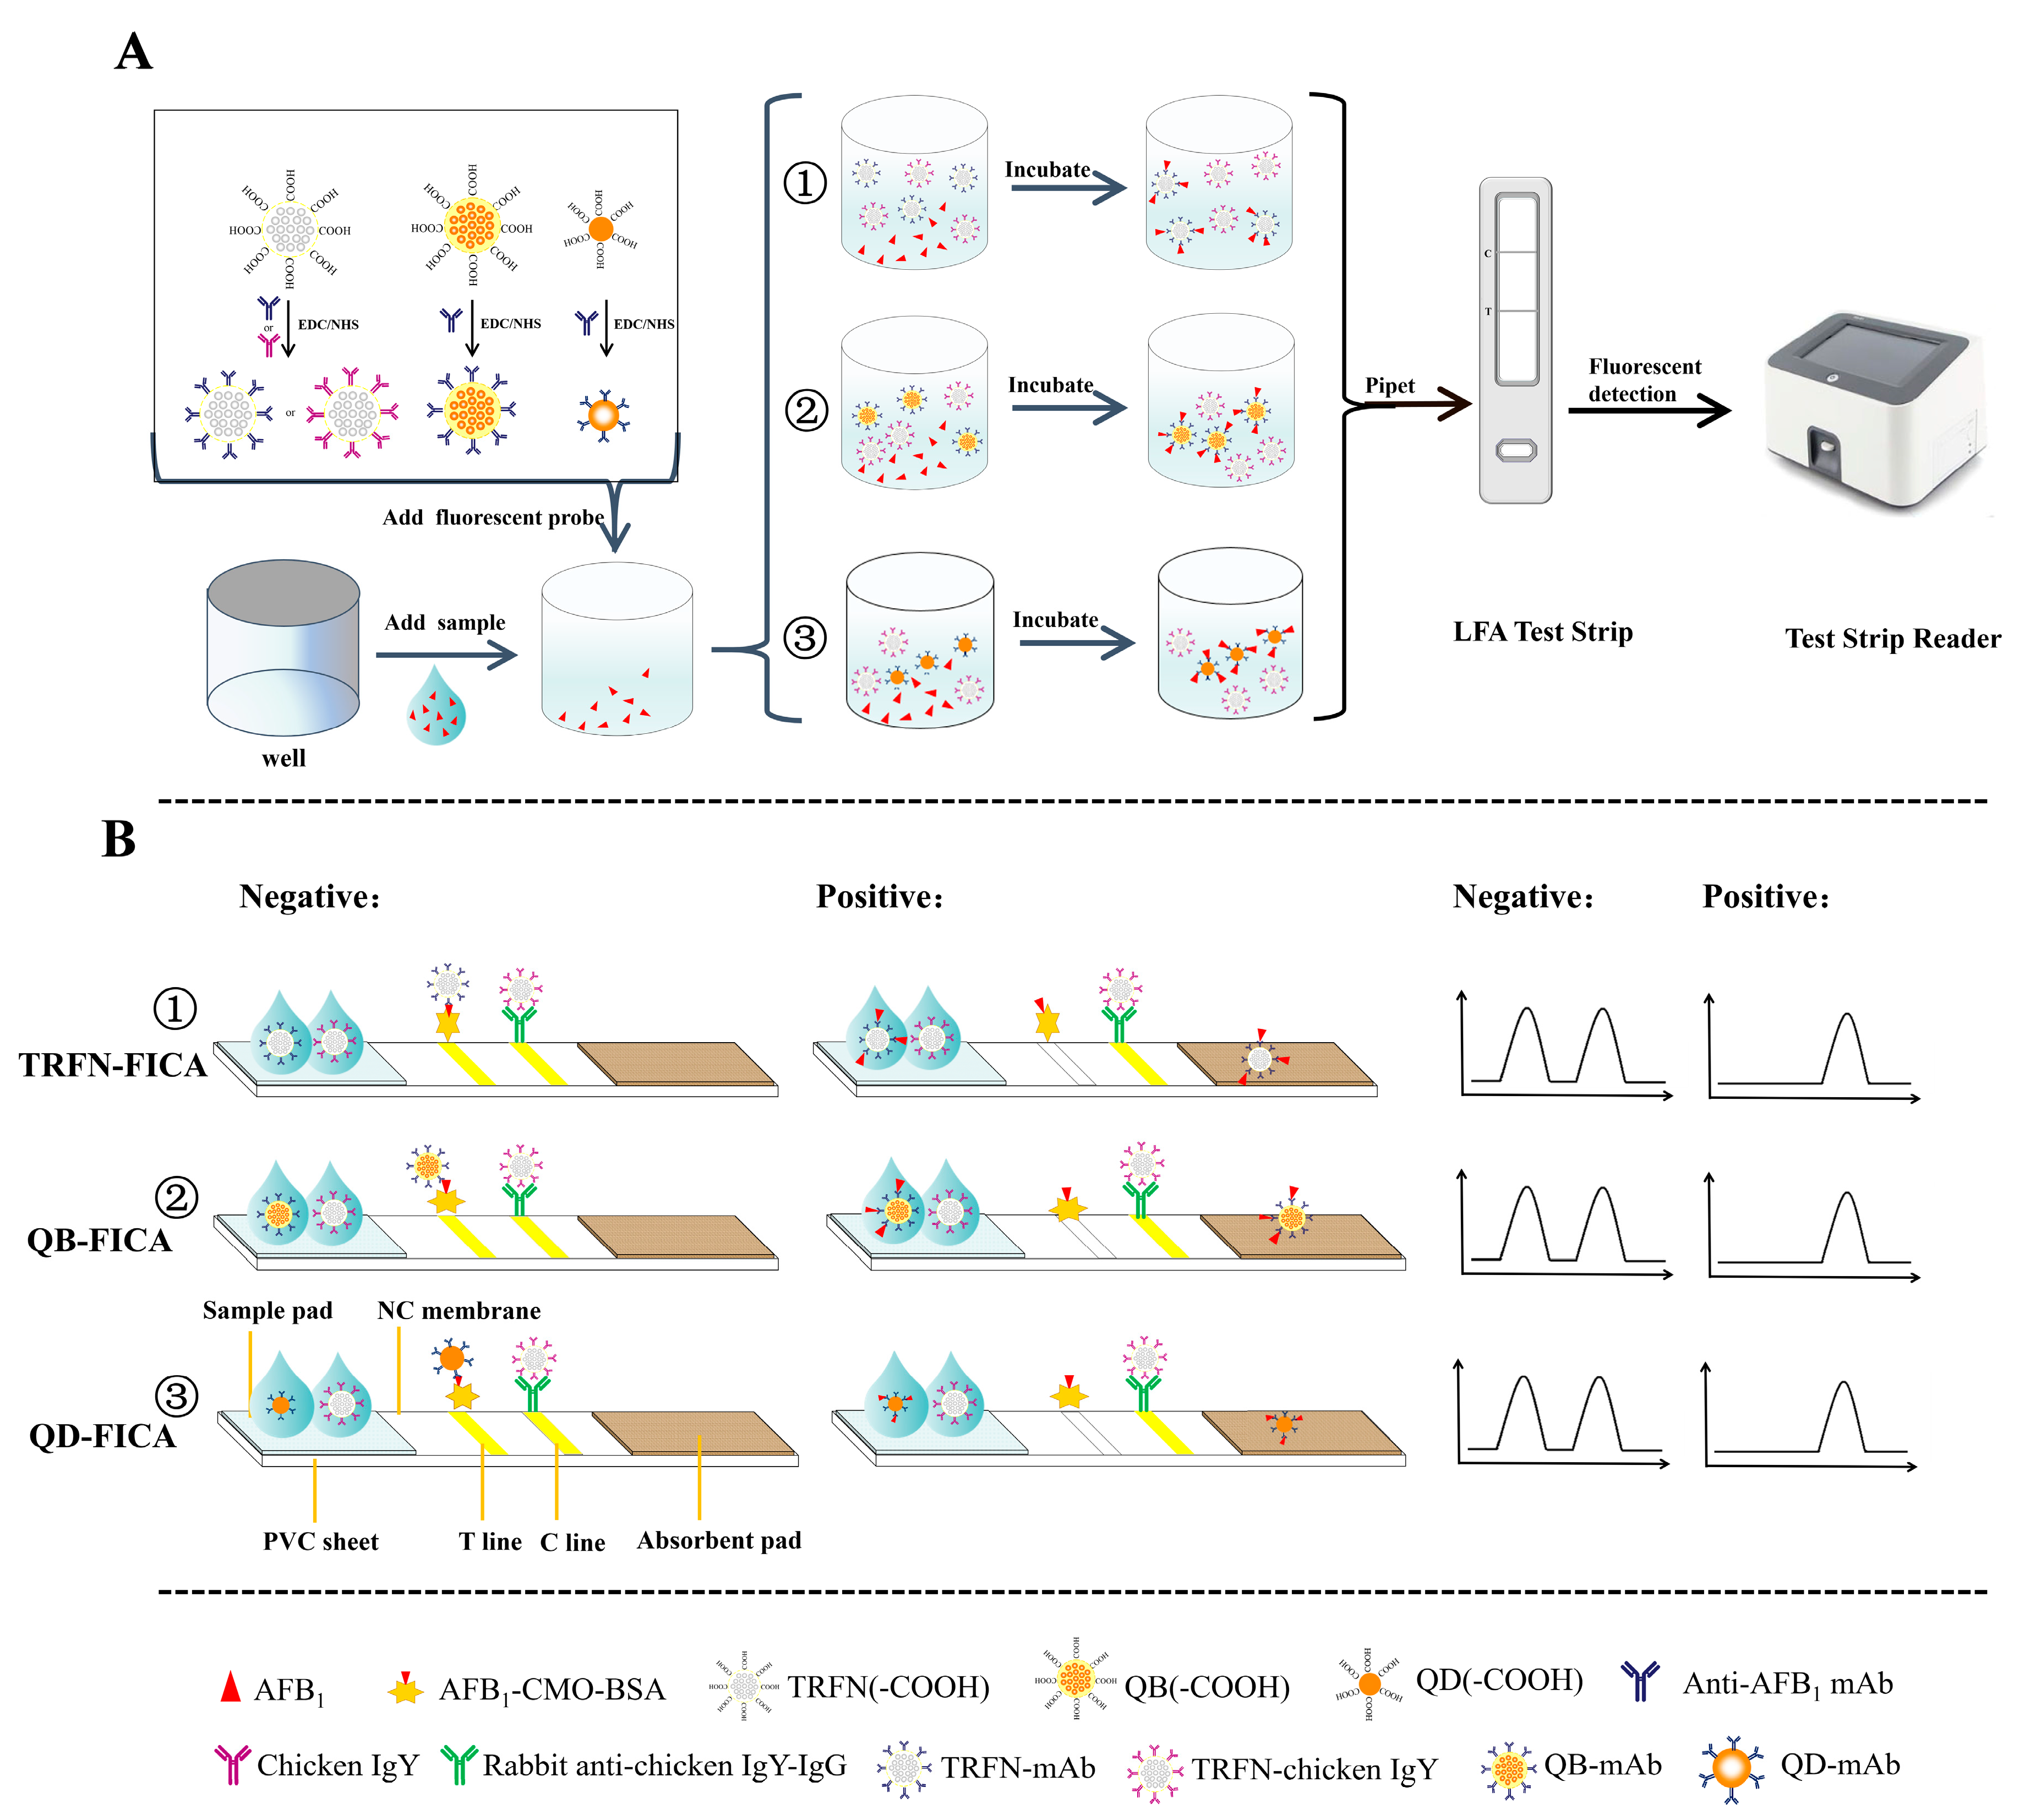
3.2. Characterization of Fluorescence Labels

The surface morphology and size of the three labels (TRFN, QB, QD) were characterized by transmission electron microscope (TEM), showing that TRFN, QB, QD had relatively uniform size distribution (Figure 2). TRFN are composed of rare earth lanthanide chelates (such as Eu(III), Tb(III) and Dy(III)) and exhibit longer (microsecond) lifetimes, allowing fluorescence decay to be monitored over time. This technique provides a means to separate the “true” fluorescence signal from short-lived background fluorescence, and an opportunity to improve assay sensitivity [38]. QD are new fluorescent labels with great prospects, and have been widely used to improve the detection sensitivity of FICA because of their narrow emission spectra, broad excitation range and highly fluorescent quantum yields [20]. Furthermore, QB are tens of thousands of quantum dots wrapped in inorganic materials such as silicon dioxide by self-assembly, which is easy to mass produce; they have stronger fluorescence stability and intensity than the corresponding single QD [28]. These labels were distributed uniformly in the low magnification image and scattered well in the magnified view; the magnified TEM image in Figure 2(B2) revealed that the single quantum dots were embedded uniformly when compared to Figure 2(C2). After chemically binding to the surfaces of the antibody, these fluorescence labels provided a high degree of long-term stability in sample detection [28], and the particle size analyzer indicated that the average hydrodynamic diameters of TRFN-mAb, QB-mAb and QD-mAb were significantly increased from 90 (TRFN) to 113 nm, 110 (QB) to 136 nm, and 15 (QD) to 42 nm (Figure S1), respectively. This proved that the three fluorescent probes were successfully synthesized, and all the probes were used for fluorescence immunochromatography detection.

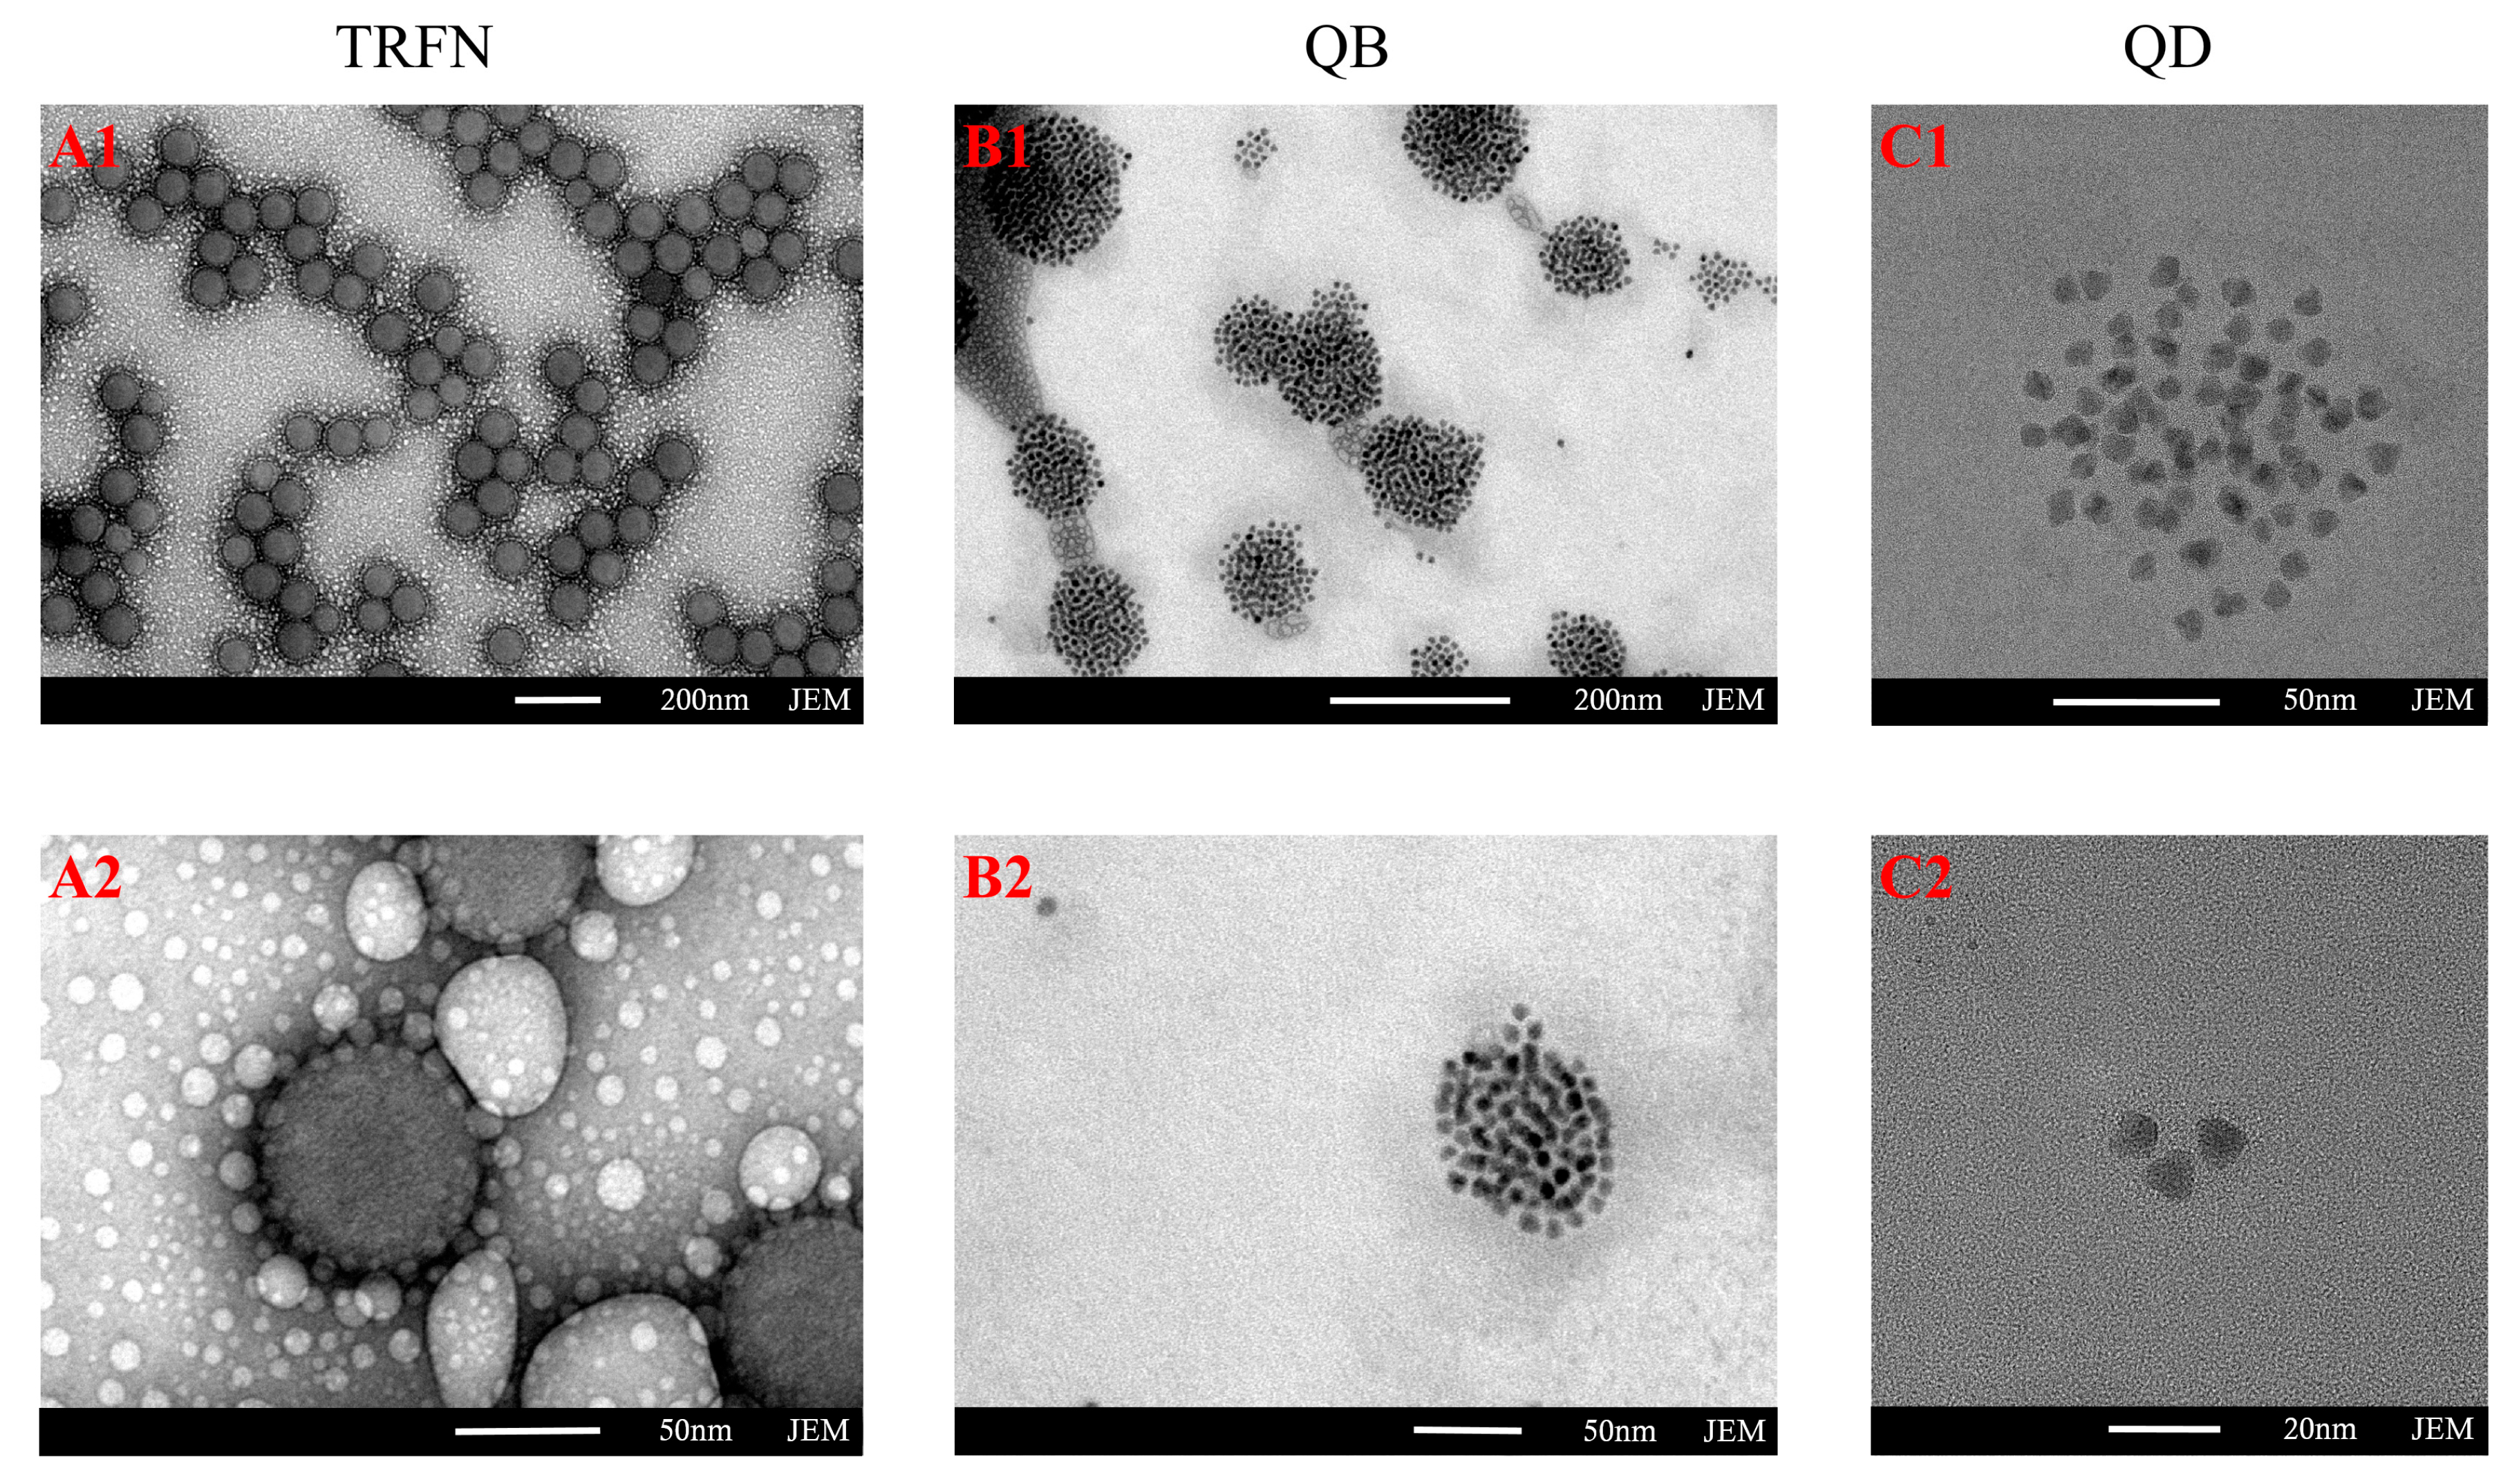
3.3. Optimization and Establishment of Standard Calibration Curve

To achieve the best performance of FICAs, parameters such as coupling pH, lateral flow immune response time, working concentration of labeled mAb immunoprobes (anti-AFB1-mAb) and working concentration of coating antigens (AFB1-CMO-BSA) were taken into consideration as important factors that affected the sensitivity of the FICAs. Therefore, all the FICAs needed to be introduced at optimum parameters. In this assay, the fluorescence intensity of C line was almost constant under the same reaction conditions (1.6 μg mL−1 of rabbit anti-chicken IgY-IgG as coating antigen and 3.4 μg mL−1 of TRFN-IgY as immunoprobe). The competitive inhibition ratio was observed by investigating appropriate fluorescence intensity of T line and C line, which was chosen as a factor to reflect the sensitivity of FICAs. As seen in Figure S2A, the fluorescence intensity of TRFN-FICA was enhanced with an increase of pH, and the highest competitive inhibition ratio was observed at pH 7.0; therefore, pH 7.0 was regarded as the optimal pH for coupling with TRFN. Using the same reasoning, pH 6.0 and 7.0 were the optimal labeling pH for QB-mAb and QD-mAb, respectively (Figure S2). In this study, the concentration parameters of labeled mAb immunoprobes (anti-AFB1-mAb) were 3.0, 4.5 and 4.5 μg mL−1 for TRFN-FICA, QB-FICA and QD-FICA, respectively (Figure S3). Coating antigens (AFB1-CMO-BSA) were 0.3, 0.65 and 0.65 μg mL−1 for TRFN-FICA, QB-FICA and QD-FICA, respectively (Figure S4). The optimum immunochromatography durations were 25, 30 and 35 min for TRFN-FICA, QD-FICA and QB-FICA, respectively (Figure S5).

3.4. Validation of FICAs

3.4.1. Sensitivity

Under optimum conditions, with the increasing concentration of AFB1 diluted in sample buffer solution, the fluorescence intensity of the corresponding test line gradually decreased. The calibration curves of three fluorescent label-based FICAs were constructed by plotting B/B0 against the logarithm of AFB1 concentrations (Figure 3); we then fit the data using linear equations. The sensitivity of TRFN-FICA, QB-FICA and QD-FICA were evaluated using the values of IC50 obtained from the calibration curves, which were 0.0133, 0.0442 and 0.0848 μg L−1, respectively. The dynamic linear ranges, determined as the concentrations causing 20%–80% inhibition of B/B0, were 0.00368–0.04804, 0.01621–0.09775 and 0.03756–0.16776 μg L−1, respectively.

3.4.2. Specificity

To examine the specificity of proposed FICAs, three structurally-related mycotoxins, such as AFB2, AFM1 and AFG1, and non-structurally-related mycotoxins, including DON, OTA and ZEN, were tested individually by the FICAs to evaluate specificity (Table S1). Data were obtained from six replicates. All results clearly demonstrated that the three FICAs (TRFN-FICA, QB-FICA and QD-FICA) have negligible cross reactivity (CR < 20%) with the other mycotoxins, and the proposed three FICAs can be applied to detect AFB1 with high specificity.

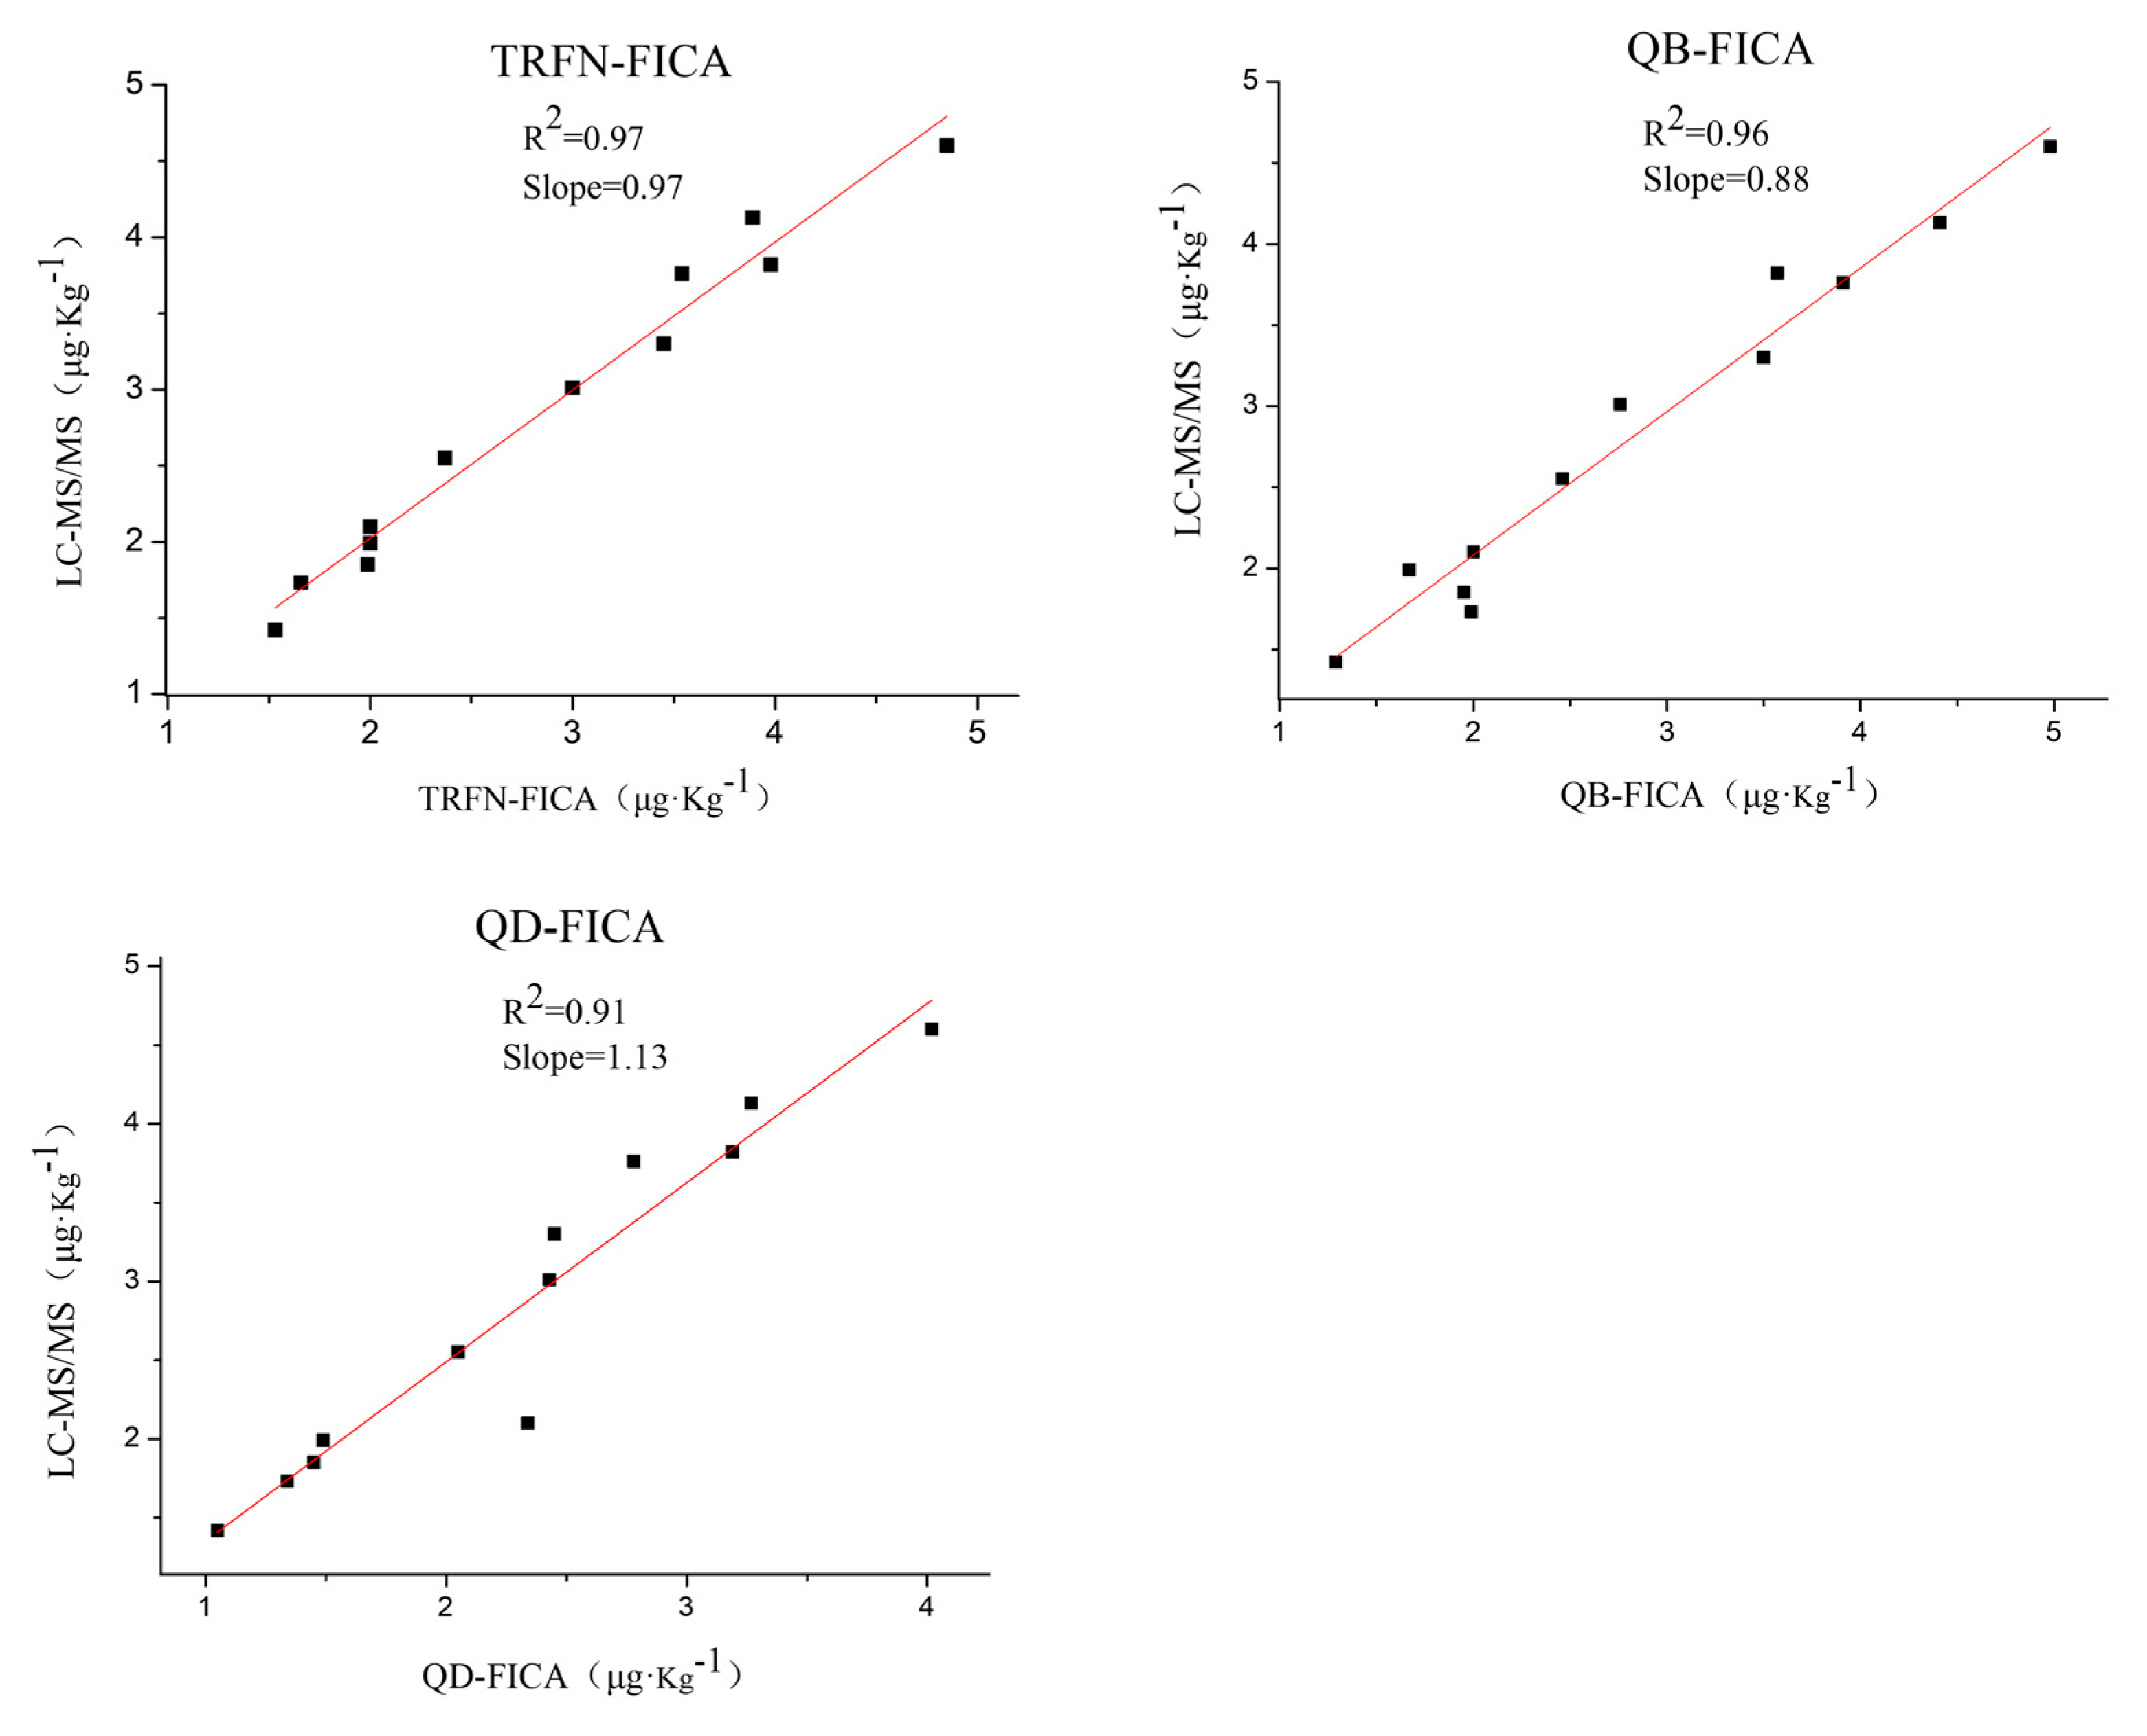
3.5. Application to Grain Samples

Detection performance of the three FICAs was investigated in real samples. The LOD was calculated as the mean value of 20 blank grain samples plus three times the standard deviation (mean + 3SD). Each of the 20 blank grain samples (corn, soybean, sorghum, wheat, rice and oats) were extracted and analyzed according to the sample preparation and detection procedure. The LODs for TRFN-FICA, QB-FICA and QD-FICA were 0.04, 0.30 and 0.80 μg kg−1, respectively. TRFN-FICA possessed the advantages of sensitivity, rapidity, antibody and antigen consumption, and accuracy when compared with QB-FICA and QD-FICA (Table 1).
Moreover, in comparison with most available immunoassay methods for comprehensive performance (Table 2), the detected performances of QD-FICA and QB-FICA were in accordance with the reported fluorescence immunochromatography in real samples or buffer solution [23,39]; TRFN-FICA had the best LOD and reached 125%–150% better sensitivity than the reported multiple time-resolved fluorescence immunochromatography assay [21,24]. Therefore, fluorescence immunochromatography assay, especially TRFN-FICA, possessed the obvious advantages of sensitivity, rapidity and cost-effectiveness for onsite screening of AFB1 in grains [36,40,41,42].
Furthermore, in order to verify and compare the reliability of FICAs, 60 grain samples were analyzed by liquid chromatography–tandem mass spectrometry (LC-MS/MS) [34], TRFN-FICA, QB-FICA and QD-FICA. A total of 12 samples were confirmed as positive samples, while others (48 samples) were negative by LC-MS/MS and three FICAs, and the representative mass chromatograms (highest and lowest concentrations for positive samples) are listed in Figure S6. There were no false negative or false positive results reported by the three FICAs, and analysis of field grain samples by FICAs were in accordance with that of LC-MS/MS (Figure 4). These results indicate that all three FICAs are reliable methods for the determination of AFB1 residues in grains, and that TRFN-FICA obtained the best fit.

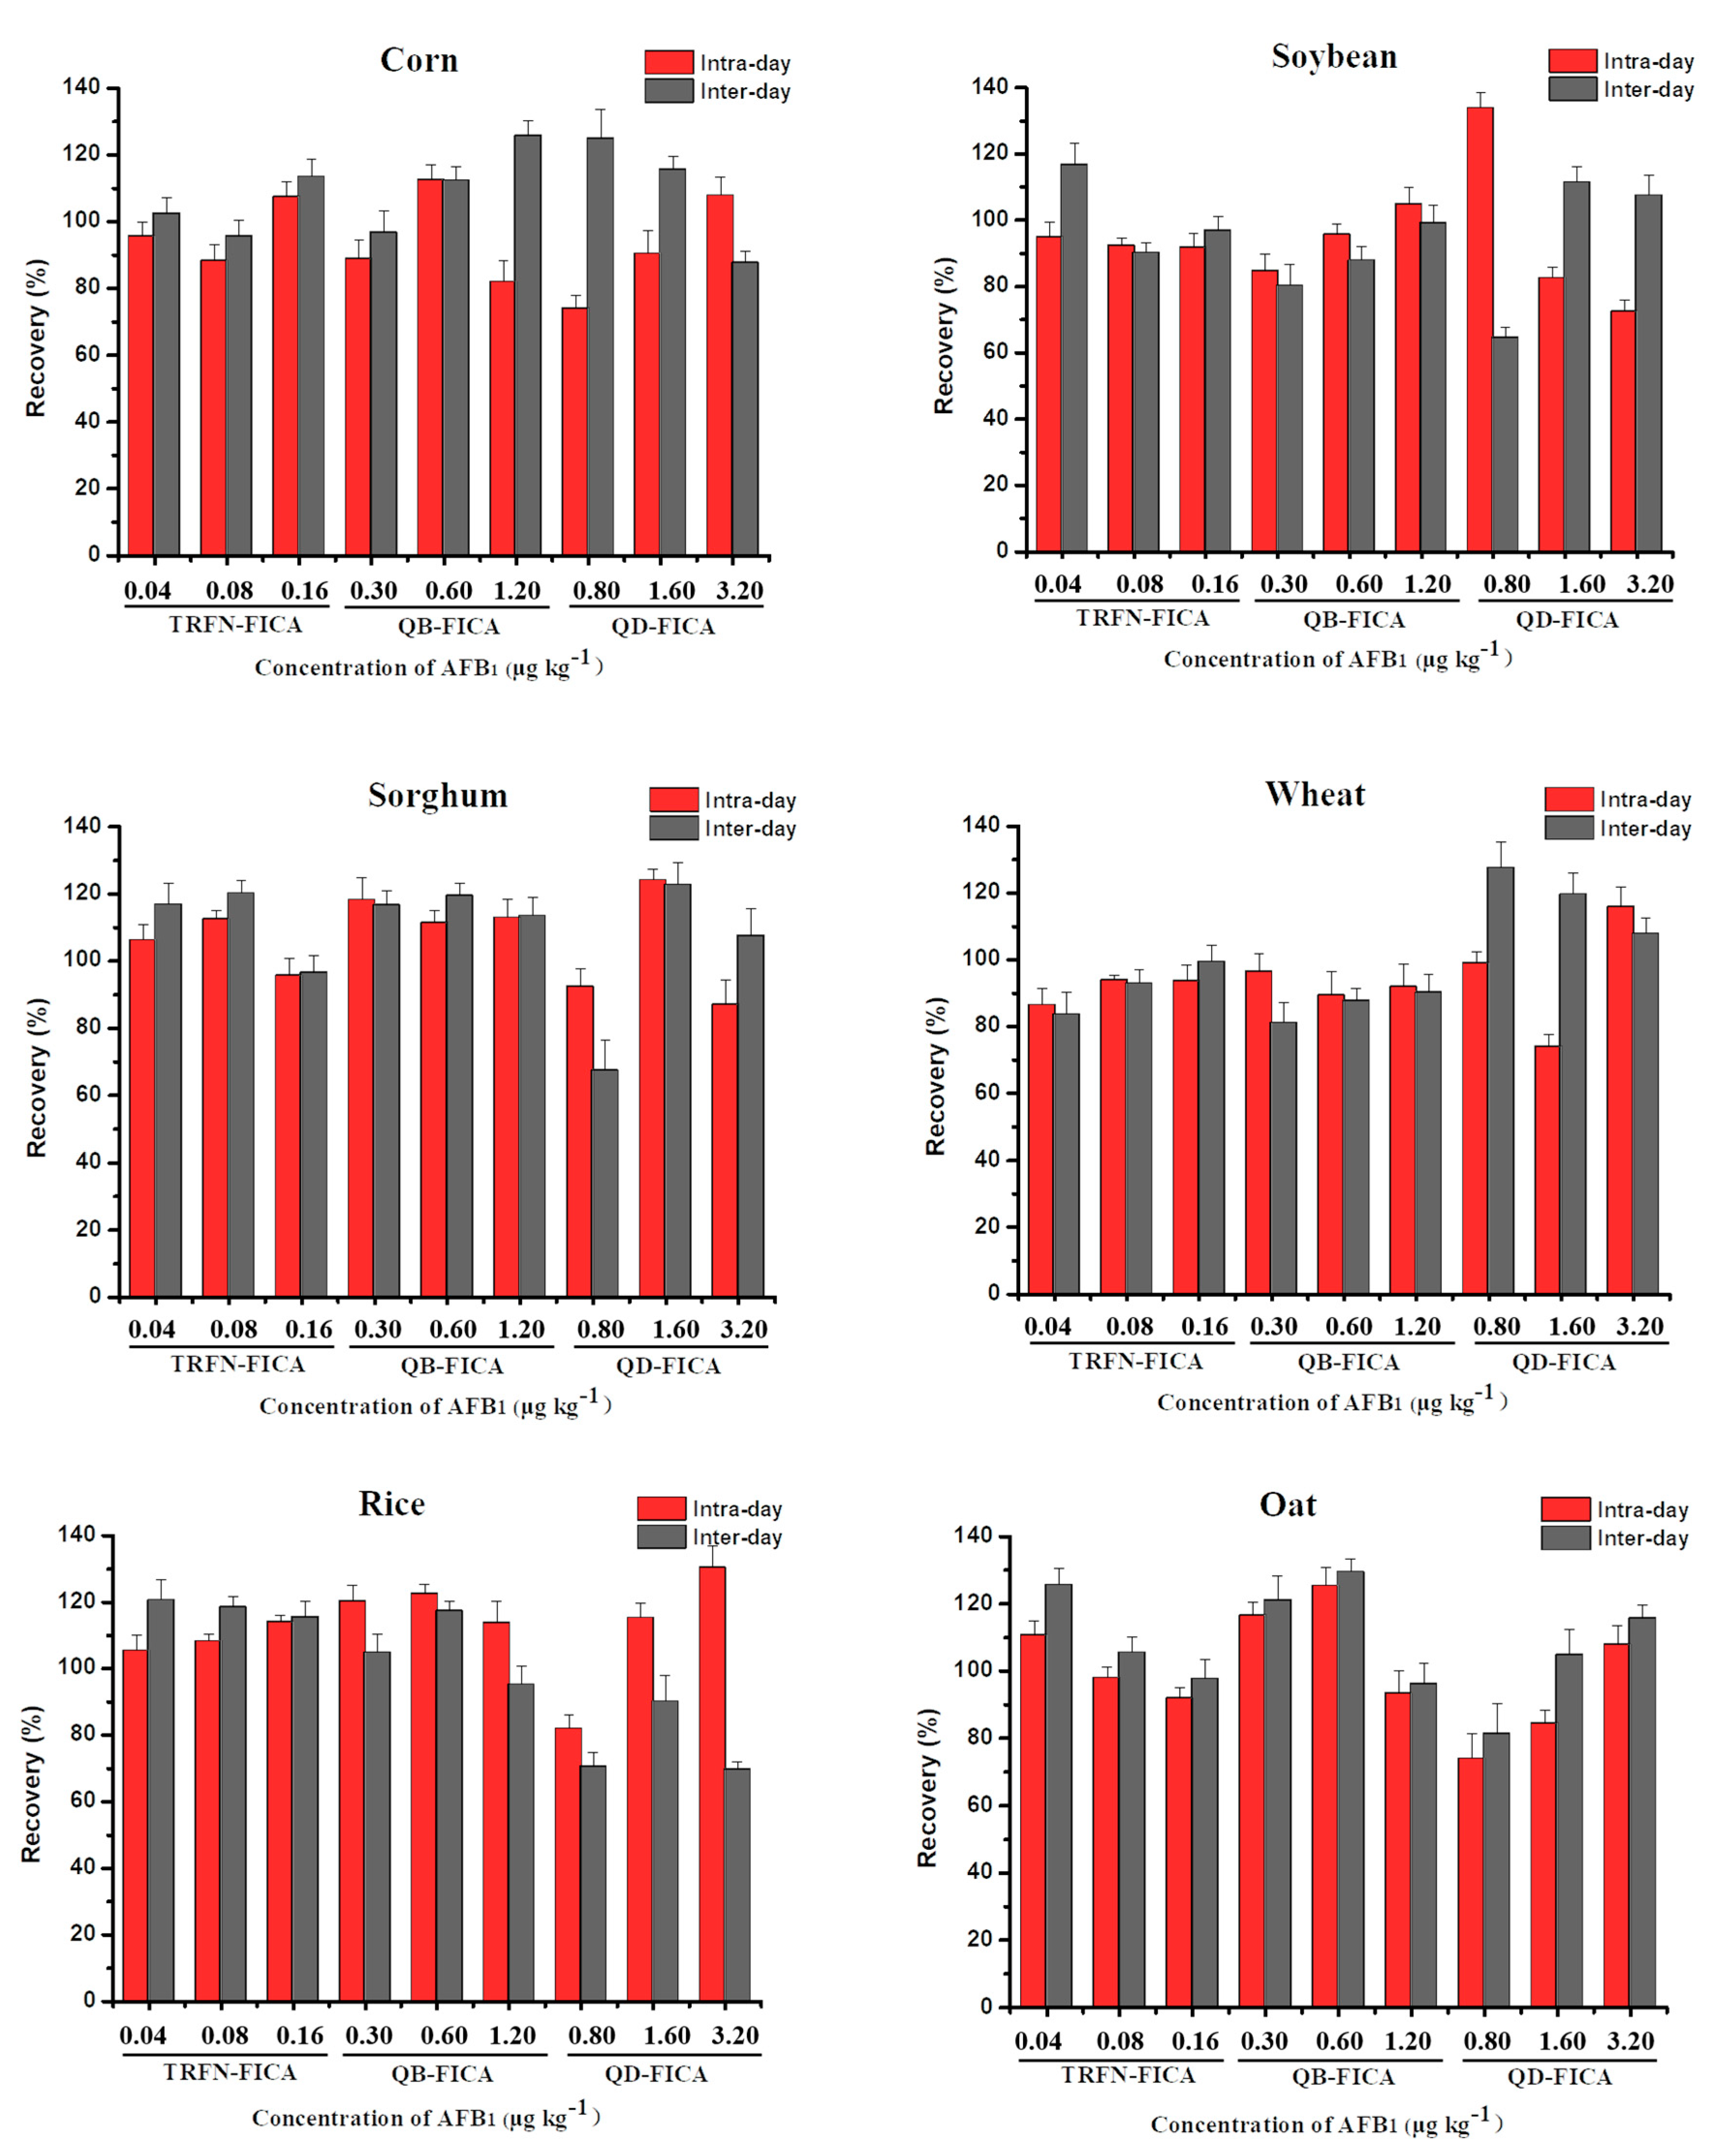
3.6. Accuracy and Precision of Three Label-Based FICAs

We performed recovery experiments to assess the accuracy and precision of the three FICAs using six kinds of blank grain samples (corn, soybeans, sorghum, wheat, rice and oat) with a series of known concentrations of AFB1. The choices of low, medium and high concentrations with AFB1 were the same as in the previous reported literature [32,33], which were represented by LOD, 2LOD and 4LOD, respectively. Data were obtained from six replicates and on three consecutive days. The intraday and interday recovery of TRFN-FICA ranged from 86.48% to 114.10% and 83.64% to 125.61%, respectively; the coefficient of variation were all less than 10%. Meanwhile, TRFN-FICA had better recovery than QB-FICA and QD-FICA (Figure 5), confirming that the accuracy and precision of TRFN-FICA were better than QB-FICA and QD-FICA.

4. Conclusions

In this study, three FICAs (TRFN-FICA, QB-FICA and QD-FICA) were systematically compared for the quantitative detection of AFB1 in grains successfully. Under optimum conditions, six types of grain samples were analyzed, showing that TRFN-FICA was the most consistent with LC-MS/MS. Moreover, TRFN-FICA had the lowest LOD, shortest immune duration (25 min), and less coating antigen consumption (0.30 μg) and antibody consumption (0.015 μg). Overall, compared with QB-FICA and QD-FICA, TRFN-FICA had a unique advantage in quantitative detection of AFB1 in grain, providing a reference for the selection of markers in detection methods.

Supplementary Materials

The following are available online at https://www.mdpi.com/2218-273X/10/4/575/s1. Figure S1: Particle size of three FICA labels. Figure S2: Optimization of coupling pH in preparing labeled mAb probes: (A) TRFN-mAb; (B) QB-mAb; (C) QD-mAb. Figure S3: Optimization of the concentration of anti-AFB1-mAb in preparing labeled mAb probes: (A) TRFN-mAb; (B) QB-mAb; (C) QD-mAb. Figure S4: Optimization of the concentration of AFB1-CMO-BSA for fluorescent immunochromatography: (A) TRFN-FICA; (B) QB-FICA; (C) QD-FICA. Figure S5: Immunoreaction dynamics of the three FICAs: (A) TRFN-FICA; (B) QB-FICA; (C) QD-FICA. Table S1: Cross reactivity (CR) of analytes with antibody detected by FICAs.

Author Contributions

Conceptualization, X.T.; methodology, Z.L.; software, X.W. (Xuan Wu); validation, X.W. (Xin Wang); data curation, X.W. (Xuan Wu); writing: original draft preparation, X.W. (Xin Wang); writing: review and editing, Z.L. and X.T.; visualization, X.W. (Xin Wang); supervision, X.T.; project administration, X.T.; funding acquisition, X.T. All authors have read and agreed to the published version of the manuscript.

Funding

This research was funded by the National Natural Science Foundation of China, grant number 31672605; Natural Science Foundation of Chongqing, China, grant number cstc2018jcyjAX0242 and cstc2017jcyjAX0313; China Postdoctoral Science Foundation, grant number 2016M590855; Chongqing Postdoctoral Science Foundation Special Funded Project, grant number Xm2017074.

Acknowledgments

We sincerely thank Beijing WDWK Biotech Co., Ltd., (Beijing, China) for providing experimental antibodies and coating antigens.

Conflicts of Interest

The authors declare no conflicts of interest.

References

  1. Sun, L.L.; Zhao, Q. Competitive horseradish peroxidase-linked aptamer assay for sensitive detection of Aflatoxin B1. Talanta 2018, 179, 344–349. [Google Scholar] [CrossRef] [PubMed]
  2. IARC Working Group. IARC Monographs on the Evaluation of Carcinogenic Risks to Humans. v. 56: Some Naturally Occuring Substances: Food Items and Constituents, Heterocyclic Aromatic Amines and Mycotoxins; International Agency for Research on Cancer: Lyon, France, 1993. [Google Scholar]
  3. Jia, Y.M.; Zhou, G.H.; Liu, P.L.; Li, Z.G.; Yu, B. Recent Development of Aptamer Sensors for the Quantification of Aflatoxin B1. Appl. Sci. 2019, 9, 2364. [Google Scholar] [CrossRef] [Green Version]
  4. Neagu, D.; Capodilupo, A.; Vilkanauskyte, A.; Micheli, L.; Palleschi, G.; Moscone, D. AFB1-AP Conjugate for Enzyme Immunoassay of Aflatoxin B1 in Corn Samples. Anal. Lett. 2009, 42, 1170–1186. [Google Scholar] [CrossRef]
  5. Danesh, N.M.; Bostan, H.B.; Abnous, K.; Ramezani, M.; Youssefi, K.; Taghdisi, S.M.; Karimi, G. Ultrasensitive detection of aflatoxin B1 and its major metabolite aflatoxin M1 using aptasensors: A review. TrAC Trends Anal. Chem. 2018, 99, 117–128. [Google Scholar] [CrossRef]
  6. Wei, T.; Ren, P.; Huang, L.; Ouyang, Z.; Wang, Z.; Kong, X.; Li, T.; Yin, Y.; Wu, Y.; He, Q. Simultaneous detection of aflatoxin B1, ochratoxin A, zearalenone and deoxynivalenol in corn and wheat using surface plasmon resonance. Food Chem. 2019, 300, 125176. [Google Scholar] [CrossRef]
  7. GB 2671-2017. In National Food Safety Standard for Mycotoxins Limits in Food; National Health Commission of the People’s Republic of China: Beijing, China, 2017.
  8. Compliance Policy Guides; Food and Drug Administration: Rockville, MD, USA, 2004.
  9. Edupuganti, S.R.; Edupuganti, O.P.; Hearty, S.; O’Kennedy, R. A highly stable, sensitive, regenerable and rapid immunoassay for detecting aflatoxin B1 in corn incorporating covalent AFB1 immobilization and a recombinant Fab antibody. Talanta 2013, 115, 329–335. [Google Scholar] [CrossRef]
  10. Ben Abdallah, Z.; Grauby-Heywang, C.; Beven, L.; Cassagnere, S.; Moroté, F.; Maillard, E.; Sghaier, H.; Cohen Bouhacina, T. Development of an ultrasensitive label-free immunosensor for fungal aflatoxin B1 detection. Biochem. Eng. J. 2019, 150, 107262. [Google Scholar] [CrossRef]
  11. Eom, T.; Cho, H.D.; Kim, J.; Park, M.; An, J.; Kim, M.; Kim, S.H.; Han, S.B. Multiclass mycotoxin analysis in edible oils using a simple solvent extraction method and liquid chromatography with tandem mass spectrometry. Food Addit. Contam. A 2017, 34, 2011–2022. [Google Scholar] [CrossRef]
  12. Xia, X.; Wang, Y.; Yang, H.; Dong, Y.; Zhang, K.; Lu, Y.; Deng, R.; He, Q. Enzyme-free amplified and ultrafast detection of aflatoxin B1 using dual-terminal proximity aptamer probes. Food Chem. 2019, 283, 32–38. [Google Scholar] [CrossRef]
  13. Huertas Perez, J.F.; Arroyo Manzanares, N.; Hitzler, D.; Castro Guerrero, F.G.; Gamiz Gracia, L.; Garcia Campana, A.M. Simple determination of aflatoxins in rice by ultra-high performance liquid chromatography coupled to chemical post-column derivatization and fluorescence detection. Food Chem. 2018, 245, 189–195. [Google Scholar] [CrossRef]
  14. Kolosova, A.Y.; Shim, W.B.; Yang, Z.Y.; Eremin, S.A.; Chung, D.H. Direct competitive ELISA based on a monoclonal antibody for detection of aflatoxin B1 Stabilization of ELISA kit components and application to grain samples. Anal. Bioanal. Chem. 2006, 384, 286–294. [Google Scholar] [CrossRef] [PubMed]
  15. Wei, J.Y.; Zhang, D.; Zhang, L.X.; Ouyang, H.; Fu, Z.F. Alkaline Hydrolysis Behavior of Metal-Organic Frameworks NH2-MIL-53(Al) Employed for Sensitive Immunoassay via Releasing Fluorescent Molecules. ACS Appl. Mater. Interfaces 2019, 11, 35597–35603. [Google Scholar] [CrossRef] [PubMed]
  16. Beloglazova, N.V.; Speranskaya, E.S.; Wu, A.; Wang, Z.; Sanders, M.; Goftman, V.V.; Zhang, D.; Goryacheva, I.Y.; De Saeger, S. Novel multiplex fluorescent immunoassays based on quantum dot nanolabels for mycotoxins determination. Biosens. Bioelectron. 2014, 62, 59–65. [Google Scholar] [CrossRef] [PubMed] [Green Version]
  17. Posthuma-Trumpie, G.A.; Korf, J.; van Amerongen, A. Lateral flow (immuno) assay: Its strengths, weaknesses, opportunities and threats. A literature survey. Anal. Bioanal. Chem. 2009, 393, 569–582. [Google Scholar] [CrossRef] [Green Version]
  18. Dzantiev, B.B.; Byzova, N.A.; Urusov, A.E.; Zherdev, A.V. Immunochromatographic methods in food analysis. TrAC Trends Anal. Chem. 2014, 55, 81–93. [Google Scholar] [CrossRef]
  19. Anfossi, L.; Baggiani, C.; Giovannoli, C.; D’Arco, G.; Giraudi, G. Lateral-flow immunoassays for mycotoxins and phycotoxins: A review. Anal. Bioanal. Chem. 2013, 405, 467–480. [Google Scholar] [CrossRef]
  20. Li, J.Y.; Mao, M.; Wu, F.; Li, Q.; Wei, L.Y.; Ma, L. Amino-functionalized CdSe/ZnS quantum dot-based lateral flow immunoassay for sensitive detection of aflatoxin B1. Anal. Methods 2018, 10, 3582–3588. [Google Scholar] [CrossRef]
  21. Tang, X.Q.; Li, P.W.; Zhang, Q.; Zhang, Z.W.; Zhang, W.; Jiang, J. Time-Resolved Fluorescence Immunochromatographic Assay Developed Using Two Idiotypic Nanobodies for Rapid, Quantitative, and Simultaneous Detection of Aflatoxin and Zearalenone in Maize and Its Products. Anal. Chem. 2017, 89, 11520–11528. [Google Scholar] [CrossRef]
  22. Wang, Y.K.; Shi, Y.B.; Zou, Q.; Sun, J.H.; Chen, Z.F.; Wang, H.A.; Li, S.Q.; Yan, Y.X. Development of a rapid and simultaneous immunochromatographic assay for the determination of zearalenone and fumonisin B1 in corn, wheat and feedstuff samples. Food Control 2013, 31, 180–188. [Google Scholar] [CrossRef]
  23. Shao, Y.N.; Duan, H.; Guo, L.; Leng, Y.K.; Lai, W.H.; Xiong, Y.H. Quantum dot nanobead-based multiplexed immunochromatographic assay for simultaneous detection of aflatoxin B1 and zearalenone. Anal. Chim. Acta 2018, 1025, 163–171. [Google Scholar] [CrossRef]
  24. Zhang, Z.W.; Tang, X.Q.; Wang, D.; Zhang, Q.; Li, P.W.; Ding, X.X. Rapid On-Site Sensing Aflatoxin B1 in Food and Feed via a Chromatographic Time-Resolved Fluoroimmunoassay. PLoS ONE 2015, 10, e0123266. [Google Scholar] [CrossRef] [PubMed] [Green Version]
  25. Wang, D.; Zhang, Z.; Li, P.; Zhang, Q.; Zhang, W. Time-resolved fluorescent immunochromatography of aflatoxin b1 in soybean sauce: A rapid and sensitive quantitative analysis. Sensors 2016, 16, 1094. [Google Scholar] [CrossRef] [PubMed] [Green Version]
  26. Foubert, A.; Beloglazova, N.V.; De Saeger, S. Comparative study of colloidal gold and quantum dots as labels for multiplex screening tests for multi-mycotoxin detection. Anal. Chim. Acta 2017, 955, 48–57. [Google Scholar] [CrossRef] [PubMed]
  27. Xie, Q.Y.; Wu, Y.H.; Xiong, Q.R.; Xu, H.Y.; Xiong, Y.H.; Liu, K.; Jin, Y.; Lai, W.H. Advantages of fluorescent microspheres compared with colloidal gold as a label in immunochromatographic lateral flow assays. Biosens. Bioelectron. 2014, 54, 262–265. [Google Scholar] [CrossRef] [PubMed]
  28. Wu, C.H.; Hu, L.M.; Xia, J.; Xu, G.M.; Luo, K.; Liu, D.F.; Duan, H.; Cheng, S.; Xiong, Y.H.; Lai, W.H. Comparison of immunochromatographic assays based on fluorescent microsphere and quantum-dot submicrobead for quantitative detection of aflatoxin M1 in milk. J. Dairy Sci. 2017, 100, 2501–2511. [Google Scholar] [CrossRef] [PubMed]
  29. Li, S.J.; Sheng, W.; Wen, W.; Gu, Y.; Wang, J.P.; Wang, S. Three kinds of lateral flow immunochromatographic assays based on the use of nanoparticle labels for fluorometric determination of zearalenone. Microchim. Acta 2018, 185, 238. [Google Scholar] [CrossRef] [PubMed]
  30. Hu, L.M.; Luo, K.; Xia, J.; Xu, G.M.; Wu, C.H.; Han, J.J.; Zhang, G.G.; Liu, M.; Lai, W.H. Advantages of time-resolved fluorescent nanobeads compared with fluorescent submicrospheres, quantum dots, and colloidal gold as label in lateral flow assays for detection of ractopamine. Biosens. Bioelectron. 2017, 91, 95–103. [Google Scholar] [CrossRef]
  31. Luo, K.; Hu, L.; Guo, Q.; Wu, C.; Wu, S.; Liu, D.; Xiong, Y.H.; Lai, W. Comparison of 4 label-based immunochromatographic assays for the detection of Escherichia coli O157: H7 in milk. J. Dairy Sci. 2017, 100, 5176–5187. [Google Scholar] [CrossRef]
  32. Wang, J.; Chang, X.X.; Zuo, X.W.; Liu, H.B.; Ma, L.C.; Li, H.J.; Tao, X.Q. A Multiplex Immunochromatographic Assay Employing Colored Latex Beads for Simultaneously Quantitative Detection of Four Nitrofuran Metabolites in Animal-Derived Food. Food Anal. Methods 2019, 12, 503–516. [Google Scholar] [CrossRef]
  33. Chang, X.X.; Zhang, Y.Q.; Liu, H.B.; Tao, X.Q. A quadruple-label time-resolved fluorescence immunochromatographic assay for simultaneous quantitative determination of three mycotoxins in grains. Anal. Methods 2020, 12, 247–254. [Google Scholar] [CrossRef]
  34. GB 5009.22-2016. In National Food Safety Standards of the People’s Republic of China, Determination of Aflatoxin B and G in Foods; National Medical Products Administration: Beijing, China, 2016.
  35. Liu, B.; Wang, L.L.; Tong, B.; Zhang, Y.; Sheng, W.; Pan, M.F.; Wang, S. Development and comparison of immunochromatographic strips with three nanomaterial labels: Colloidal gold, nanogold-polyaniline-nanogold microspheres (GPGs) and colloidal carbon for visual detection of salbutamol. Biosens. Bioelectron. 2016, 85, 337–342. [Google Scholar] [CrossRef] [PubMed]
  36. Chen, Y.Q.; Chen, Q.; Han, M.M.; Zhou, J.Y.; Gong, L.; Niu, Y.M.; Zhang, Y.; He, L.D.; Zhang, L.Y. Development and optimization of a multiplex lateral flow immunoassay for the simultaneous determination of three mycotoxins in corn, rice and peanut. Food Chem. 2016, 213, 478–484. [Google Scholar] [CrossRef] [PubMed]
  37. Sun, S.J.; Zheng, P.M.; Zhao, S.J.; Liu, H.B.; Wang, Z.P.; Peng, T.; Wang, J.Y.; Yao, K.; Wang, S.H.; Zeng, Y.Y.; et al. Time-resolved fluorescent immunochromatographic assay-based on three antibody labels for the simultaneous detection of aflatoxin B1 and zearalenone in Chinese herbal medicines. Food Addit. Contam. A 2018, 35, 2434–2442. [Google Scholar] [CrossRef]
  38. Majdinasab, M.; Sheikh-Zeinoddin, M.; Soleimanian-Zad, S.; Li, P.W.; Zhang, Q.; Li, X.; Tang, X.Q.; Li, J. A reliable and sensitive time-resolved fluorescent immunochromatographic assay (TRFICA) for ochratoxin A in agro-products. Food Control 2015, 47, 126–134. [Google Scholar] [CrossRef]
  39. Xu, W.; Xiong, Y.H.; Lai, W.H.; Xu, Y.; Li, C.M.; Xie, M.Y. A homogeneous immunosensor for AFB1 detection based on FRET between different-sized quantum dots. Biosens. Bioelectron. 2014, 56, 144–150. [Google Scholar] [CrossRef]
  40. Liu, J.W.; Lu, C.C.; Liu, B.H.; Yu, F.Y. Development of novel monoclonal antibodies-based ultrasensitive enzyme-linked immunosorbent assay and rapid immunochromatographic strip for aflatoxin B1 detection. Food Control 2016, 59, 700–707. [Google Scholar] [CrossRef]
  41. Xue, Z.H.; Zhang, Y.X.; Yu, W.C.; Zhang, J.C.; Wang, J.Y.; Wan, F.; Kim, Y.; Liu, Y.D.; Kou, X.H. Recent advances in aflatoxin B1 detection based on nanotechnology and nanomaterials—A review. Anal. Chim. Acta 2019, 1069, 1–27. [Google Scholar] [CrossRef]
  42. Li, X.; Li, P.; Zhang, Q.; Li, R.; Zhang, W.; Zhang, Z.; Ding, X.; Tang, X. Multi-component immunochromatographic assay for simultaneous detection of aflatoxin B1, ochratoxin A and zearalenone in agro-food. Biosens. Bioelectron. 2013, 49, 426–432. [Google Scholar] [CrossRef]
Figure 1. Schematic demonstration of (A) the procedures for aflatoxin B1 (AFB1) detection with fluorescence immunochromatography and (B) the principle of fluorescence immunochromatography assays for time-resolved fluorescent nanobeads (TRFN)-FICA, quantum dot nanobeads QB-(FICA) and quantum dots (QD)-FICA.
Biomolecules 10 00575 g001
Figure 2. Size characterization of three labels: (A1,A2) TEM images of TRFN at 200 and 50 nm magnifications; (B1,B2) TEM images of QB at 200 and 50 nm magnifications; (C1,C2) TEM images of QD at 50 and 20 nm magnifications.
Biomolecules 10 00575 g002
Figure 3. (A) Standard curves of TRFN-FICA, QB-FICA and QD-FICA for AFB1 and (BD) corresponding immunochromatographic strips.
Biomolecules 10 00575 g003
Figure 4. Consistent results between LC-MS/MS and the three FICAs (TRFN-FICA, QB-FICA and QD-FICA) in positive grain samples.
Biomolecules 10 00575 g004
Figure 5. The accuracy and precision of TRFN-FICA, QB-FICA and QD-FICA in AFB1 in spiked samples.
Biomolecules 10 00575 g005
Table 1. Performance of TRFN-FICA, QB-FICA and QD-FICA in 6 grains.
ParameterTRFN-FICAQB-FICAQD-FICA
LOD (μg kg−1)0.040.300.80
Antibody usage per test card (μg)0.0150.090.03
The best coating for AFB1-CMO-BSA (μg)0.300.650.65
Immunoassay duration (min)253035
Recovery (%)83.64%–125.61%80.29%–129.45%64.53%–133.86%
Coefficient of variation (%)3.10%–6.75%2.88%–7.16%2.34%–8.96%
Table 2. Comparison of immunoassays for determination of AFB1.
Detection MethodMarkerTarget SubstanceSampleDetection Limit of AFB1 (μg kg−1)
Immunoadsorption [15]EnzymeAFB1Feed samples2.0
Multiplex immunochromatography [36]Colloidal goldAFB1, ZEN, OTACorn0.10
Rice0.12
Fluorescent immunochromatography [24]TRFNAFB1Corn0.06
Fluorescent immunochromatography [20]QBAFB1Buffer solution0.005
(When the inhibition is 10)
Multiplex fluorescent immunochromatography [23]QBAFB1, ZENBuffer solution0.00165
(When the inhibition is 10%)
Multiplex fluorescent immunochromatography [21]TRFNAFB1, ZENBuffer solution0.05
Fluorescence resonance energy transfer [39]QDAFB1Rice0.04
Fluorescent immunochromatography (this study)TRFNAFB1Corn, soybean, sorghum, wheat, rice and oats0.04
QB0.30
QD0.80

