Abstract
This study aimed to investigate the chemical composition, and evaluate the antioxidant, anti-inflammatory, anti-pyretic, and the analgesic properties of methanol extracts from the leaves of Thymus algeriensis and Thymus fontanesii (Lamiaceae). Thirty-five secondary metabolites were characterized in both extracts using HPLC-PDA-ESI-MS/MS. Phenolic acids, mainly rosmarinic acid and its derivatives, dominated the T. algeriensis extract, while the phenolic diterpene carnosol and the methylated flavonoid salvigenin, prevailed in T. fontanesii extract. Molecular docking study was carried out to estimate the anti-inflammatory potential and the binding affinities of some individual secondary metabolites from both extracts to the main enzymes involved in the inflammation pathway. In vitro enzyme inhibitory assays and in vivo assays were used to investigate the antioxidant and anti-inflammatory activities of the extracts. Results revealed that both studied Thymus species exhibited antioxidant, anti-inflammatory, analgesic, and antipyretic effects. They showed to be a more potent antioxidant than ascorbic acid and more selective against cyclooxygenase (COX-2) than diclofenac and indomethacin. Relatively, the T. fontanesii extract was more potent as COX-2 inhibitor than T. algeriensis. In conclusion, Thymus algeriensis and Thymus fontanesii may be interesting candidates for the treatment of inflammation and oxidative stress-related disorders.
1. Introduction
Inflammation is a defense reaction of the body against the invasion of pathogens, injury, and other noxious stimuli. However, it can lead to persistent tissue damage by the migrated leukocytes or lymphocytes. Accordingly, it is essential to control inflammation and the associated pain and hyperthermia [1]. The most common treatments of inflammation currently utilize non-steroidal anti-inflammatory drugs (NSAIDs), central analgesics (opioids), glucocorticoids, and adjuvants drugs such as anticonvulsants and antidepressants. However, these agents have several side effects such as gastrointestinal disorders and are ineffective for treating some conditions. Further research for new bioactive molecules against pain and inflammation is, therefore, a persistent demand so that many studies are focusing currently on natural products as therapeutic alternatives [2].
The mint family Lamiaceae, comprises 236 genera, among them the genus Thymus, with 400 species of aromatic herbaceous, perennials, and small shrubs. They are cultivated originally in Europe but are now widely distributed in the Mediterranean region and Asia. Plants from the genus Thymus is used traditionally as herbal teas, culinary spices, condiments, and as analgesic, anti-rheumatic, antiseptic, astringent, and diuretic agents. Additionally, the plants are considered an important source of essential oils and the thyme oil, with its diverse biological properties including antioxidant, antibacterial, antimycotic, and age-delaying properties, is included in the world’s top ten essential oils [3].
The herbaceous fragrant, Thymus algeriensis, is an endemic plant to Libya, Tunisia, Algeria, and Morocco and considered as the most widespread North African species. The plant is largely used as a culinary herb and as a traditional medicine to treat digestive and respiratory infections (e.g., gastrointestinal dysentery, colds), prostate adenoma, and to prohibit abortion [3,4].
The spontaneous plant, Thymus fontanesii, is native to Algeria and Tunisia. Traditionally, it is used as a processed food preservative and as antispasmodic, carminative, stomachic, expectorant, antitussive, antiseptic, anthelmintic, and to treat some gastrointestinal diseases as well.
In the current study, the chemical composition of the methanol extracts from the leaves of T. algeriensis and T. fontanesii were characterized by LC-MS. Molecular docking in silico study was carried out to evaluate the anti-inflammatory potential and the binding affinities of some identified compounds in both extracts to the main enzymes involved in the inflammation pathway namely; cyclooxygenase-1 (COX-1), cyclooxygenase-2 (COX-2), 5-lipoxygenase (5-LOX), and 5-lipoxygenase activating protein (FLAP). The antioxidant, anti-inflammatory, anti-pyretic, and the analgesic properties of the extracts were evaluated both in vitro and in vivo.
2. Materials and Methods
2.1. Plant Material and Extraction
Leaves of Thymus algeriensis Boiss. et Reut. and Thymus fontanesii Boiss. et Reut. were collected in March 2018 from Algeria, “Ain Dem- AIN DEFLA” region (Latitude: 36.3059434N, Longitude: 2.5099262E, Altitude: 748 m) and “Mekhatria-AIN DEFLA” region (Latitude: 36.3025793N, Longitude: 1.9597495E, Altitude = 263 m), respectively. Voucher specimens were deposited in the herbarium of Pharmacognosy Department, Faculty of Pharmacy, Zagazig University, Egypt (Voucher specimen No. TA-L10, TF-L11).
Shade dried leaves (250 g) of each plant were ground and extracted by methanol 80% (3× 1L) at room temperature. The extracts were filtered, evaporated under vacuum and subjected to freeze-drying yielding 5 and 4.5 g of dried extract for T. algeriensis and T. fontanesii, respectively.
2.2. HPLC-PDA-ESI-MS/MS
A ThermoFinnigan LCQ-Duo ion trap mass spectrometer (ThermoElectron Corporation, Waltham, MA, USA) with an ESI source (ThermoQuest Corporation, Austin, TX, USA) was used to identify the phytochemical composition of the leaf extract as previously reported by Ghareeb et al. [5].
2.3. In Vitro Studies
2.3.1. Cyclooxygenase (COX) Inhibition Assay
The potential of T. algeriensis and T. fontanesii extracts to inhibit ovine COX-1 and COX-2 was evaluated using an enzyme immunoassay (EIA) kit (Cayman Chemical, AnnArbor, MI, USA) according to the manufacturer’s instructions and the study by Adellall et al. [6].
2.3.2. Lipoxygenase (LOX) Inhibition Assay
The potential of T. algeriensis and T. fontanesii extracts to inhibit lipoxygenase was evaluated using a lipoxygenase inhibitor screening assay kit (Cayman Chemical, AnnArbor, MI, USA) according to the manufacturer’s instructions and the study by Adellall et al. [6].
2.3.3. Total Antioxidant Capacity (TAC) Assay
The total antioxidant capacity of the extracts was evaluated against ascorbic acid as a reference standard using the commercially available TAC ELISA kit (MBS726896, my BioSource, Inc., San Diego, CA, USA) according to the manufacturer’s instructions and according to Sobeh et al. [7].
2.4. Animals
Male albino mice (20–25 g) and Wistar rats (200–220 g) obtained from the faculty of Veterinary Medicine, Zagazig University, Zagazig, Egypt, were used in the experiments. The animals were settled in cages at constant standard environmental conditions and had free access to food and water ad libitum. All experimental protocols were approved by Zagazig Ethical Committee for animal use and care, Zagazig university, Zagazig, Egypt (Approval number: ZU-IACUC/3/F/115/2018).
2.4.1. The Anti-Inflammatory Activity in Carrageenan-Induced Hind-Paw Edema Model
Nine groups of male rats (200–220 g) with five animals per group were used in this experiment. Induction of edema in the rats’ right hind paw was done by injecting 0.1 mL freshly prepared carrageenan solution (1% in 0.9% NaCl), into the sub-plantar tissue. An hour earlier, the rats received, orally, the vehicle (10 mL/kg), T. algeriensis and T. fontanesii extracts in three dose levels (200, 400, and 600 mg/kg), diclofenac (20 mg/kg), or dexamethasone (2 mg/kg). By the aid of a caliper ruler, the paw thickness (mm) was measured in the dorsal- plantar axis before and after injecting the carrageenan solution, and at hourly intervals for 5 h, and finally at 24 h. The cumulative anti-inflammatory effect during the whole observation period (0–24 h) was determined by calculating the area under the changes in paw thickness-time curve (AUC0–24).
2.4.2. Leukocytes Recruitment into Peritoneal Cavity in Mice
Swiss albino mice (n = 5–8/group), were treated orally with the vehicle (1 mL/100 g), or T. algeriensis and T. fontanesii extracts in three dose levels (200, 400, and 600 mg/kg), 30 min before the intraperitoneal injection of 0.1 mL carrageenan solution (500 µg/mice) or 0.1 mL sterile saline. Diclofenac (p.o., 20 mg/kg) and dexamethasone (p.o., 2 mg/kg) were used as reference standards. Three hours later, the mice were euthanized, and each peritoneal cavity was washed with 3 mL of phosphate-buffered saline (PBS) containing 1mM ethylenediaminetetraacetic acid (EDTA). The total leukocytes count was determined in each peritoneal cavity wash using a hemocytometer and presented as number of cells/mL.
2.4.3. Acetic Acid-Induced Vascular Permeability
Acetic acid-induced vascular permeability was done as described by Sobeh et al. [7]. In brief, mice were treated orally with either T. algeriensis or T. fontanesii extracts in three dose levels (200, 400, and 600 mg/kg), diclofenac (20 mg/kg), dexamethasone (2 mg/kg) or vehicle. Evans blue (0.25% solution in normal saline, 0.2 mL) was injected in the tail vein 1 h later. Acetic acid (0.6% in normal saline, 1 mL/100 g) was then injected after 30 min in the peritoneal cavity of the treated mice. One group of mice was injected with normal saline to serve as normal control. Mice were euthanized 30 min later by cervical dislocation, the abdominal cavities were washed with 3 mL saline solution, and the collected washings were then centrifuged at 3000 rpm for 10 min. The vascular permeability is proportional to the absorbance of Evans blue dye in the supernatant, which was detected at 610 nm using a plate reader (Biotech, Winooski, VT, USA).
2.4.4. Assay of Anti-Nociceptive Activity by Hot Plate Test
Evaluation of the possible central analgesic activity of the studied extracts was done by the hot plate test, according to Sobeh et al. [7]. Briefly, mice were divided into different groups (5 each) that received orally either the tested extracts in two dose levels (200 and 400 mg/kg), the vehicle (10 mL/kg), or the opioid analgesic nalbuphine (10 mg/kg) as a reference standard. One hour later, each individual mouse was placed on a hot plate pre-heated at 55 ± 1 °C and observed for any response to the heat-induced nociceptive pain (licking the fore and hind paws, hind paw lifting, or jumping). The latency time until the animal showed the first signs of discomfort was recorded, before (baseline) and at 1, 2, 3 and 4 h following the different treatments.
2.4.5. Assay of Anti-Nociceptive Activity by Acetic Acid-Induced Abdominal Writhing
The peripheral analgesic activity of T. algeriensis and T. fontanesii extracts was evaluated by the acetic acid-induced writhing model in mice, according to Sobeh et al. [7]. Briefly, mice were divided into 4 groups (5–7 mice) that received orally, either the vehicle (1% Tween 80, 10 mL/kg), the extracts in two dose levels (200 and 400 mg/kg), diclofenac (20 mg/kg), or dexamethasone (2 mg/kg), 1 h prior to the intraperitoneal injection of 0.7% acetic acid (1 mL/100 g). The number of writhes, manifested as extension of hind legs, constriction of abdomen, or turning of trunk was recorded within 25 min.
2.4.6. Anti-Pyretic Activity in Brewer’s Yeast Induced Pyrexia in Mice
Pyrexia in mice was induced as described by Liu et al. [8] with minor modifications. The initial rectum temperature of each animal was measured using a lubricated digital thermometer. Brewer’s yeast suspension was prepared in normal saline (30%) and injected subcutaneously behind the animal’s neck (1 mL/100 g). After 18 h, animals’ rectal temperatures were measured again (T0). Only animals that showed at least 0.5 °C rise in their rectal temperature were included in the study. Pyretic animals were treated orally with either T. algeriensis or T. fontanesii extracts in three dose levels (200, 400, and 600 mg/kg), paracetamol (150 mg/kg), or vehicle. Rectal temperatures were measured at 30 min, 1, 2, 3 and 24 h following the different treatments.
2.5. Molecular Modeling
Molecular modeling was performed through docking a sample of the extracts’ compounds to cyclooxygenase 1 (COX-1), cyclooxygenase 2 (COX-2), 5-lipoxygenase (5-LOX) and 5-lipoxygenase activating protein (FLAP). The X-ray crystallographic structures of the aforementioned enzymes (PDB codes: 5WBE, 5IKR, 3V99 and 2Q7M, respectively) were downloaded from the Protein Data Bank (www.rcsb.org). The docking protocol and visualization techniques were done using Molecular Operating Environment (2010.10; Chemical Computing Group Inc., Montreal, Canada). Downloaded proteins were cleared from all unnecessary repetitive amino acid chains or ligands, and proteins were protonated to ensure the availability of hydrogen atoms that were undetected during the crystallization processes. Docked compounds were either downloaded directly as sdf files from PubChem or drawn using MOE builder or saved as mol2 files, and all were compiled afterwards to one database. Compounds’ ionization was checked by washing them; bond lengths were scaled to reasonable values. Tautomeric states at pH 7.0 were checked and partial charges were adjusted. Energy minimization was done to all compounds using MMFF94x force field. In the docking protocol, structural water molecules within the vicinity of co-crystallized ligands were considered an integral part of the binding site, if available. Docking was done using the default settings of placement (Triangle Matcher) and scoring (London dG), and refinement was set to force field. The docked poses were evaluated based on various criteria; their root mean squared deviations from the co-crystallized ligand, their scores as an indication of their free energy of binding as well as their subsequent interactions with the surrounding amino acids.
2.6. Statistical Analysis
Analyzing data was done by the aid of GraphPad Prism software, version 6 (San Diego, CA, USA). Analysis of Variance (ANOVA) or repeated-measures analysis of variance (RM-ANOVA) followed by Tukey’s post hoc test and Student’s t-test were used to detect differences between groups. Data are presented as mean ± S.E.M.
3. Results and Discussion
The corresponding LC-MS chromatograms of the methanol extracts from T. algeriensis and T. fontanesii leaves are presented in Figure 1. Chemical structures were elucidated based on HPLC-PDA, together with electrospray ionization mass spectrometry in the negative mode (ESI-MS and MSn). Compound identification was done based on their molecular ion peaks, MS2 fragmentation and comparison with data in literature. Table 1 summarizes the observed MS and MS/MS data and the relative abundance for each analyte within the studied extracts. Altogether, 35 secondary metabolites were tentatively identified in the extracts. Phenolic acids, mainly rosmarinic acid and its derivatives dominated T. algeriensis extract while the phenolic diterpene, carnosol, and the methylated flavonoid, salvigenin, was the major secondary metabolite in the T. fontanesii extract.
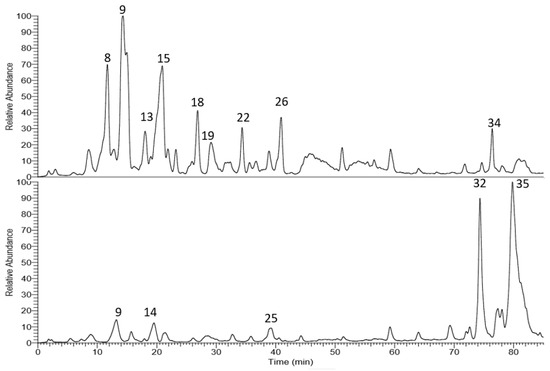
Figure 1.
LC-MS base peak chromatogram of T. algeriensis (top) and T. fontanesii (bottom) leaves methanol extracts.

Table 1.
Secondary metabolites from T. algeriensis and T. fontanesii leaves extracts.
In the T. algeriensis extract, the compound eluted at 17.76 min showed a molecular ion peak [M − H] m/z of 471 with daughter ions of 369 [M – H − 102], 327 [M − H − 144], and 309 [M − H − 162]. Losing the three fragments of 62, 102 and 144 amu marked the presence of 3-hydroxy-3-methylglutaryl, while the loss of 162 amu indicated the presence of caffeoyl moiety. The daughter ion at 165 suggested phloretic acid; therefore, the compound was assigned as phloretic acid caffeoyl 3-hydroxy-3-methylglutaroyl (Figure 2).
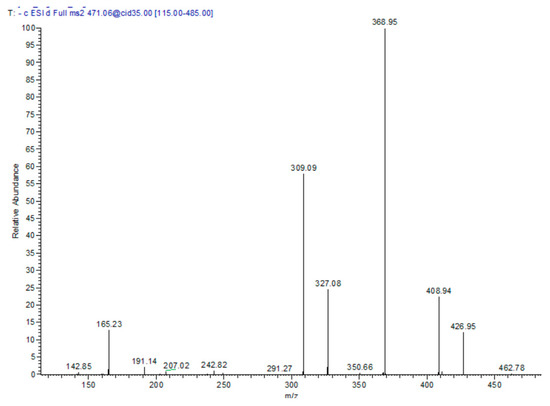
Figure 2.
MS/MS spectra of compound 13: phloretic acid caffeoyl 3-hydroxy-3-methylglutaroyl in the negative ion mode.
3.1. In Vitro Activities
3.1.1. Inhibition of Cyclooxygenase (COX-1/2), Lipoxygenase (5-LOX), and Total Antioxidant Capacity (TAC) Assay
As shown in Table 2, T. algeriensis extract showed a higher selectivity for COX-2 than for COX-1 in vitro with a selectivity index similar to that of the selective COX-2 inhibitor, celecoxib (SI value = 248 and 266.2, respectively) and higher than both indomethacin and diclofenac (p < 0.05). Noteworthy, T. fontanesii extract was more selective for COX-2 (SI = 322) than both T. algeriensis and celecoxib, however this difference was not statistically significant (p > 0.05). Both T. algeriensis and T. fontanesii extracts exhibited similar potency like diclofenac to inhibit lipoxygenase in vitro and were also similar to the reference 5-LOX inhibitor; zileuton, Table 2.
Table 2.
In vitro cyclooxygenase (COX-1 and COX-2) and lipoxygenase (5-LOX) inhibition (IC50) and the total antioxidant capacity (U/L) of T. algeriensis and T. fontanesii extracts.
Furthermore, T. algeriensis and T. fontanesii extracts revealed a high antioxidant potential: The total antioxidant capacity (TAC) of T. fontanesii was higher than that of T. algeriensis and ascorbic acid, the antioxidant reference standard, Table 2. The antioxidant and the anti-inflammatory effects of the extracts may be attributed to the reducing properties of the phenolic compounds which are dominant in the extracts. The major constituents of T. algeriensis are rosmarinic acid and its glucoside derivative (rosmarinic acid glucoside), luteolin glucuronide and salvianolic acid K. While the major constituents of T. fontanesii are carnosol and salvigenin. Both species contain flavonoids (quercetin, luteolin, apigenin and their derivatives) and phenolic acids (caffeic acid and phloretic acid and their derivatives).
3.1.2. Effects of T. algeriensis and T. fontanesii Extracts on Carrageenan-Induced Paw Edema in Rats
Several models to induce acute and chronic inflammation are widely reported. The most commonly used model of acute inflammation is carrageenan-induced paw edema that is commonly used for screening new anti-inflammatory drugs. The broad use of this model is attributed to the fact that it is sensitive to the cyclooxygenase inhibitors. The other reason is that this model was used to evaluate the effect of NSAIDs, which involves the inhibition of PGs synthesis. Several inflammatory mediators are released in subsequent phases to induce paw edema. In the initial or vascular phase, histamine, serotonin, and bradykinin are released [13]. They cause vasodilatation and extravasation. In the final or cellular phase, leukocytes migrate to the inflamed area [14]. Prostaglandins play a crucial role in the cellular phase, which takes place after about four hours following the intra-plantar administration of carrageenan [15]. The present study showed that the rats injected with carrageenan (0.1 mL, 1% in 0.9%, sub-planter) exhibited increased paw thickness, an indication of paw inflammation, when measured at hourly intervals for 5 h and at 24 h after injection. The later responses peaked at 3 h post-injection. Rats pretreated 1 h earlier with T. algeriensis or T. fontanesii extracts (200 and 400 mg/kg, p.o.) showed a mild reduction in edema thickness compared to the control rats. Increasing the dose of T. algeriensis extract to 600 mg/kg did not result in further inhibition of the measured edema thickness. On the other hand, T. fontanesii extract at the highest dose (600 mg/kg) produced a comparable effect to that obtained with the standard anti-inflammatory drug, diclofenac (20 mg/kg, p.o.) as both reduced paw thickness by 44% of the control AUC0-24 values. In addition, dexamethasone (2 mg/kg, p.o.) showed a 51% reduction in AUC0-24 values compared to the vehicle-treated rats (Figure 3). Carrageenan activates COX-2, which produces PGE2 using arachidonic acid as a precursor. PGE2 causes acute exudation, resulting in swelling [16]. The anti-inflammatory activities of both extracts are attributed to suppressing COX-2 and thus the inhibition of prostaglandin synthesis, which was confirmed by the in vitro and molecular docking studies. The higher potency of T. fontanesii extract relative to that of T. algeriensis could be explained by the higher selectivity of T. fontanesii extract towards COX-2 (SI = 322) than both T. algeriensis and celecoxib in vitro, however this difference was not statically significant (p > 0.05).
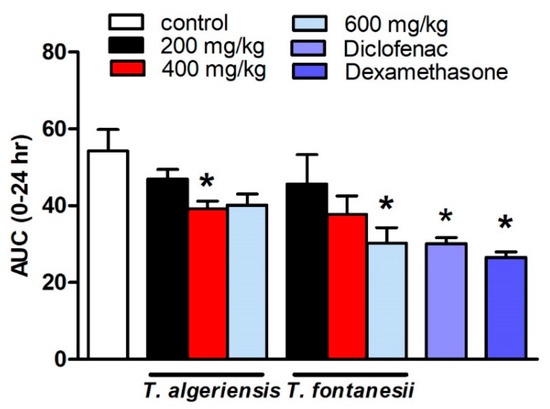
Figure 3.
Effect of the pretreatment with T. algeriensis or T. fontanesii (p.o., 200, 400, and 600 mg/kg,), diclofenac (p.o., 20 mg/kg) or dexamethasone (p.o., 2 mg/kg) on carrageenan- (1% suspension, 0.1 mL)-induced hind paw edema in rats. Edema thickness (mm) was measured before and hourly for 5 h and at 24 h following carrageenan injection. Data represents the AUC0-24 and is presented as the mean ± S.E.M (n = 5). * p < 0.05 vs. control values by one-way ANOVA followed by Tukey post hoc test.
The anti-inflammatory effect of T. algeriensis may be related to its major active constituents, rosmarinic acid and rosmarinic glucoside. Previous studies showed that rosmarinic acid has potent anti-inflammatory effect through inhibition of NF-κB activation [17]. On the other hand, salvigenin is the major active constituent of T. fontanesii. It has a wide range of biological effects, including antioxidant, antitumor, antibacterial and vasorelaxant activities in isolated rat aortas, immunomodulatory activities, inhibition of the growth of malarial parasites, and potent anti-inflammatory effects [18,19].
3.1.3. Effects on Carrageenan-Induced Leukocyte Migration into the Peritoneal Cavity in Mice
As shown in Figure 4, intraperitoneal injection of carrageenan- (500 μg/cavity, 0.1 mL)-induced leukocyte migration into the peritoneal cavity in mice. This can be shown as an increase in the total leukocyte number compared to the saline-treated mice (6.29 ± 0.95 vs 1.04 ± 0.06 leukocytes × 106 mL−1). Mice pretreated with T. algeriensis or T. fontanesii extract (200, 400 and 600 mg/kg, p.o.) before the carrageenan challenge showed a dose-dependent reduction in the total leukocyte number that reached up to 62 and 52%, respectively compared to the vehicle when the highest dose (600 mg/kg) was used. Notably, the previous effect was stronger than that of diclofenac or dexamethasone, which showed 39 and 30% reductions in leucocyte number, respectively. It was reported previously that inhibition of leukocyte migration into the peritoneal cavity could be caused by either inhibiting the chemotactic substances’ expression and/or suppressing the adhesion molecule production [20]. In carrageenan-induced peritonitis, the inflammatory mediators such as prostaglandins and the proinflammatory cytokines are released into the peritoneal cavity by resident and endothelial cells in the peritoneum, such as macrophages and mast cells [21]. Suppression of the synthesis and release of these inflammatory mediators is apparently responsible for the protective effect of both extracts.
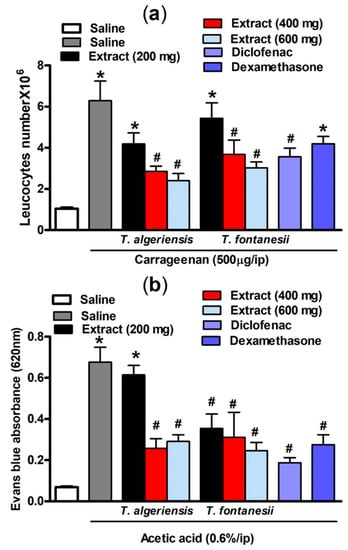
Figure 4.
(a) Carrageenan (500 µg, i.p.) effect on leukocytes migration into the peritoneal cavity in mice (total number ×106) with or without 1 h prior pretreatment with T. algeriensis, T. fontanesii (p.o., 200, 400, and 600 mg/kg), diclofenac (p.o., 20 mg/kg) or dexamethasone (p.o., 2 mg/kg). Data is presented as mean ± S.E.M (n = 5–7). * p < 0.05 vs. vehicle (saline) values, # p < 0.05 vs. control (carrageenan treated group). (b) Effect of T. algeriensis or T. fontanesii (p.o., 200, 400 and 600 mg/kg) on acetic acid-induced vascular permeability. The absorbance of Evans blue dye in the abdominal cavity exudate was measured to indicate the inflammation level. The values are presented as the mean ± SEM (n = 5–6). * p < 0.05 compared to saline group. # p < 0.05 compared to the saline group treated with acetic acid only by one-way ANOVA followed by Tukey post hoc test.
3.1.4. Effects on Acetic Acid-Induced Vascular Permeability in Mice
Acetic acid-induced vascular permeability was conducted to assess the extracts’ activity against the first phase of inflammation. Acetic acid strongly enhances vascular permeability and facilitates Evans blue dye vascular leakage. Our experimental results demonstrated that acetic acid injection (0.6%, i.p.) in mice resulted in an increased vascular permeability demonstrated by the significantly (p < 0.001) higher Evans blue absorbance compared to the saline-injected mice (0.68 ± 0.07 vs 0.07 ± 0.004). Acetic acid causes an increase in the level of prostaglandins, histamine, and serotonin in peritoneal fluids, which in turn leads to vasodilation and increased vascular permeability [22]. This effect was attenuated in mice pretreated 1 h prior acetic acid injection with T. algeriensis extract (400 or 600 mg/kg, p.o.) by 63 and 58%, respectively. On the other hand, the T. fontanesii extract was protective at all dose levels (200, 400 and 600 mg/kg, p.o.) by 50, 55 and 64%; and produced a greater reduction in Evans blue reading compared to T. algeriensis. This is matched with the in vitro results that showed a stronger effect for T. fontanesii extract than T. algeriensis extract on COX-2. Based on this outcome, the anti-inflammatory effect of both extracts on the acute inflammation phase might be attributed to the inhibition of the release of inflammatory mediators and inhibition of vasodilation. Notably, exudates from diclofenac (20 mg/kg) or dexamethasone (2 mg/kg) treated mice showed 73 and 60% lower Evans blue readings, respectively compared to the control (Figure 4).
3.1.5. Effects on Acetic Acid-Induced Writhing and Hot Plate Test in Mice
Acetic acid injection induced painful response in mice represented by the abdominal writhing response. The production of prostaglandins, specifically PGF2α and PGE2, in the peritoneal fluids from arachidonic acid that is mediated by cyclooxygenase enzymes, upon injecting acetic acid, stimulates the local peritoneal receptors leading to the abdominal writhing response. Leukotrienes are produced as well via the lipoxygenase enzyme from arachidonic acid [23]. Both prostaglandins and lipoxygenase products induce pain and inflammation and increase capillary penetrability. As shown in Figure 5, oral pretreatment of mice with T. algeriensis or T. fontanesii extracts in the two dose levels 1 h prior to acetic acid injection showed a similar significant peripheral analgesic activity represented as a dose-dependent decrease in acetic acid-induced writhes in mice. The effect achieved by the higher dose (400 mg/kg) of both extracts was superior to that observed by diclofenac (20 mg/kg), or dexamethasone (2 mg/kg) as almost 94% reduction of the writhing response was observed (Figure 5).
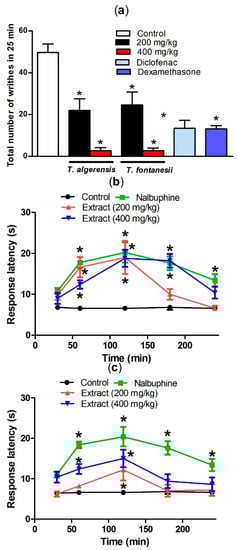
Figure 5.
Effect of T. algeriensis or T. fontanesii (p.o., 200 and 400 mg/kg), diclofenac (p.o., 20 mg/kg) or dexamethasone- (p.o., 2 mg/kg) on acetic acid (0.7%, 1 mL/100 g)-induced writhing in mice (a). Effect of T. algeriensis on hot plate response latency (b). Effect of T. fontanesii on hot plate response latency (c). Response latency in (s) was measured 1–4 h after the different extracts (200 and 400 mg/kg, p.o.), vehicle or nalbuphine (p.o., 10 mg/kg). Data is presented as mean ± S.E.M (n = 5–8). * p < 0.05 vs. control values by one-way ANOVA followed by Tukey post hoc test.
The analgesic effect of extracts in the present study may be mediated via inhibition of synthesis of prostaglandin and leukotrienes synthesis. These results strongly endorse the fact that both extracts exhibit peripheral analgesic effects, presumably, through locally inhibiting the peritoneal receptors, which contribute then to the inhibition of cyclooxygenase. Previous studies showed that salvigenin, the major active constituent of T. fontanesii, has a significant analgesic effect like morphine [18].
Hot plate test was done to evaluate the central anti-nociceptive activity. Both extracts showed a significant central analgesic effect suggesting the presence of centrally active anti-nociceptive components. The animals pretreated with any of the extracts (200 and 400 mg/kg, i.p.), showed a longer response latency in a dose-dependent manner. Surprisingly, T. algeriensis extract has greater central analgesic activity compared to T. fontanesii at both tried doses. Additionally, the higher dose (400 mg/kg) of T. algeriensis showed a similar effect to nalbuphine, the narcotic analgesic with central activity that was used as a reference standard in this experiment (Figure 5). It is well reported that flavonoids have a potential to cross the blood–brain barrier and affects the opioid and other receptor types in the CNS [18]. These data indicated that the opioid system could be involved in the antinociception exerted by both extracts.
3.1.6. Effect of Extracts on Brewer’s Yeast Induced Pyrexia in Mice
Fever represents a brain mediated response to injury or infections by elevating body temperature. This response is elicited by exogenous pyrogens and promoted by the endogenous ones such as IL-1β, IL-6, TNF-α, endothelin-1 (ET-1), corticotrophin release factor (CRF), bradykinin, preformed pyrogenic factor (PFPF), and prostaglandin E2 (PGE2) [24]. PGE2-dependent fever results mainly by the action of the activated cyclooxygenase enzymes in the preoptic zone of the hypothalamus [25]. Brewer’s yeast injection in mice raised their rectal body temperature when measured 18 h following the injection (Table 3). Mice treated with T. algeriensis (200, 400 and 600 mg/kg, p.o.) did not show any significant antipyretic effect compared to the vehicle-treated mice, although there is a trend to lower body temperatures at the highest used dose (600 mg/kg). On the other hand, mice treated with T. fontanesii (200 and 400 mg/kg, p.o.) showed mild antipyretic effect that started 24 h and 3 h post-treatment, respectively. The 600 mg/kg dose of the extract showed a much stronger antipyretic profile with a faster and prolonged effect that started 1 h post treatment and extended up to 24 h (Table 3). Carnosol, a major constituent of T. fontanesii, was reported to increase the gene expression of heat shock proteins namely, hsp-16.1 and hsp-16.2 and the antioxidant enzyme, SOD in Caenorhabditis elegans [26]. The increase in heat shock protein expression is beneficial to improve stress resistance under heat stress and other stresses [27]. Carnosol is the product of the oxidative degradation of carnosic acid [28]. The bioavailability and metabolism of carnosol is similar to carnosic acid [29]. Previous studies showed that it is well absorbed after oral administration and reachs the blood stream and is available for several hours after administration. This could explain why the antipyretic effect extended to 24 h post-treatment. In addition, carnosol inhibits protein kinase C pathway and blocks the binding of AP-1 to the COX-2 promoter, thus inhibits prostaglandin synthesis [30]. The ability of the studied extracts to reduce the mice’s body temperature indicates well regulation of the PGE2-dependent fever in the hypothalamus, an effect that was confirmed by the in vitro study.
Table 3.
Effect of T. algeriensis and T. fontanesii extracts on Brewer’s yeast induced pyrexia in mice.
3.2. Molecular Docking
Out of the compounds identified in our extracts, twenty-two compounds were selected as candidates for the docking study to estimate the anti-inflammatory potential of the studied extracts. The compounds selected for the docking process are listed in Table 4, along with their docking scores on the inflammatory proteins of concern. Compounds were selected based on either the abundance of the compound in the extract, or the structural features of the compound, particularly the presence of an acidic functional group as a reported key structural element in various anti-inflammatory lead compounds.
Table 4.
Docking scores retained from positioning selected compounds of T. algeriensis and T. fontanesii extracts into the binding sites of COX-1, COX-2, 5-LOX, and 5-Lipoxygenase Activating Protein (FLAP).
3.2.1. Cycloxygenase-1
Cycloxygenase active site is mainly created by a long hydrophobic channel, with Ser530 and Tyr385 at its apex [31]. Other important amino acids are Arg120, Tyr355, and Glu524, all of which form the constriction at the bottom part of the channel [32]. This constriction opens up paving the way for substrates and inhibitors entry to the channel. The catalytic activity of COX-1 is mainly mediated by trapping arachidonic acid (AA) between residues Arg120, Tyr355 and the catalytic Tyr385 [33].
Docking of the 22 compounds into the active site of COX-1 was performed (PDB code: 5WBE; complex of mofezolac-COX1). The co-crystallized ligand mofezolac, as well as diclofenac, were simultaneously docked for the purpose of validating our docking protocol. Mofezolac is reported to participate in a salt bridge interaction with the guanidium group of Arg120 located at the entrance of the hydrophobic active site channel, similar to arachidonic acid carboxylate which ion pairs with the same residue [34]. Furthermore, mofezolac is found to participate in hydrogen bonding to Tyr355. It is also surrounded by a rich set of hydrophobic residues in COX1 binding site, which explain its numerous van der Waal interactions [33].
The docking study was verified by examining the amino acids interacting with mofezolac and diclofenac, which were found to be Arg120, Tyr 355, Phe518 and Ile523. As for the molecules identified from the two plants extracts, the top scoring compounds were salvianolic acid A and apigenin 6,8 di-C-hexoside, the latter is relatively more abundant in the extract of T. algeriensis. The chosen docked poses for the two compounds scored −21.08 kcal/mol and −20.48 kcal/mol, respectively, relative to −13.08 kcal/mol for diclofenac and −14.60 kcal/mol for mofezolac. Salvianolic acid A binds to COX-1 through hydrogen bonding to Arg120 and hydrophobic interactions with Ser353. On the other hand, the binding of apigenin 6,8-di-C-hexosides inside COX-1 was fortified by the interactions with several surrounding amino acids including hydrogen bonds with Arg120, Ser 516, Ile 517 and Gln192 in addition to the hydrophobic interactions with Phe518 as well as Ile523 (Figure 6). Most of the interactions were found to be established by the two glucoside moieties.
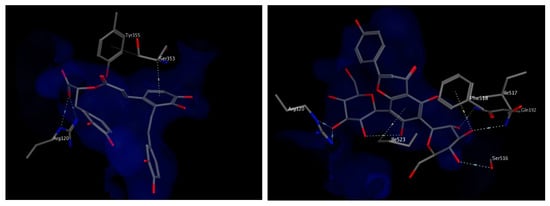
Figure 6.
3D view of interactions of salvianolic acid A (left) and apigenin 6,8-di-C-hexosides (right) with amino acid residues of COX-1. Side chains of amino acids were omitted for clarity, except for Ser353 (left) and Ile517 (right), whose backbones participate in hydrophobic interactions with the docked compounds.
3.2.2. Cycloxygenase-2 Protein
The crystal structure of mefenamic acid complexed with COX-2 enzyme (PDB ID: 5IKR) was utilized in the current docking process. The downloaded protein consists of 2 identical polypeptide chains, with 551 amino acid residues each [31]. It has been revealed in the structure of the non-productive complex of arachidonic acid with COX-2, that the substrate adopts an inverted conformation inside the binding site, where the carboxylate moiety interacts with Ser530 and Tyr385. Other inhibitors such as diclofenac and lumiracoxib, have been reported to bind in the same inverted conformation to Ser530 and Tyr385, highlighting the importance of those 2 residues in ligand association [32]. Contrary to COX-1, Arg120 mutation to an uncharged residue doesn’t lead to detrimental loss of complex stability of COX-2 inhibitors, suggesting that interaction of arachidonic acid with Arg120 does not play a great role in COX-2 as it does in the case of COX-1 [33].
Mefenamic acid binds to COX-2 enzyme through hydrogen bonding to Ser530 and Ty355. Re-docking mefenamic acid as well as the known COX-2 inhibitor, celecoxib retrieved binding modes that reproduced the interactions with the exact 2 amino acids. Docking the chosen compounds found in T. algeriensis and T. fontanesii revealed that the top scoring compound was rosmarinic acid glucoside. The free binding energy for the best docking pose scored −25.9 kcal/mol, relative to −11.53 kcal/mol and −15.28 kcal/mol for mefenamic acid and celecoxib, respectively. The complex of rosmarinic acid glucoside and COX-2 was stabilized by hydrogen bond interactions to Ser530 (directly and indirectly via structural water molecules) as well as Tyr385, it was further strengthened by ionic interaction of the carboxylate oxygen with Arg513 as well as hydrophobic interactions with Phe518 and Val89, (Figure 7). In view of the docking scores summarized in Table 4, it is obvious that COX-2 is plausibly the most important target for the docked compounds. This can be deduced from the better scores obtained for the compounds on COX-2 relative to the other involved enzymes. It is worth noting that the molecular docking results were supported by the in vitro results.
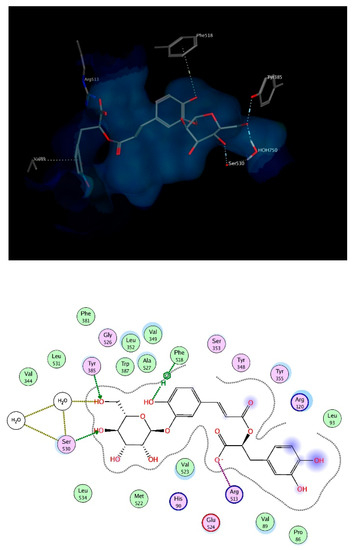
Figure 7.
3D (top) and 2D (bottom) interactions of rosmarinic acid glucoside with amino acid residues of COX-2. In the 3D view, side chains of amino acids were omitted for clarity.
3.2.3. -Lipoxygenase Protein
The only X-ray crystal structure which represents a substrate-bound form of 5-LOX was chosen for docking (PDB ID:3V99). In this complex, 5-LOX is bound to its natural substrate, arachidonic acid. The catalytic center of 5-LOX mainly consists of hydrophobic amino acids, such as Ile406, Ala410, Leu414, Ile425, Val604 and Leu607. The carboxylic group of arachidonic acid seems to interact with Phe177 of 5-LOX, in addition to the hydrophobic contacts [35].
The best chosen two compounds were salvianolic acid A and apigenin 6,8 di-C-hexosides, with binding free energy values of −20.87 and −22.19 kcal/mol, respectively. Those two compounds scored even better than the re-docked arachidonic acid (−11.6 kcal/mol) and the known inhibitor, Zileuton (−11.04 kcal/mol). Salvianolic acid A interacts via hydrogen bonding to Gln413 and via pi interactions with Phe177 and Leu607. It also interacts hydrophobically with Ala410. On the other hand, apigenin 6,8 di-C-hexoside interacts via pi-interactions to Phe177 as well as His367 which is in turn coordinated to the iron atom available in the middle of the active site. It also interacts by a hydrogen bond to Asn554, and indirectly to Ala561 through nearby water molecules. The interactions of both compounds within the active site of 5-LOX suggest their strong potential as high affinity inhibitors (Figure 8).
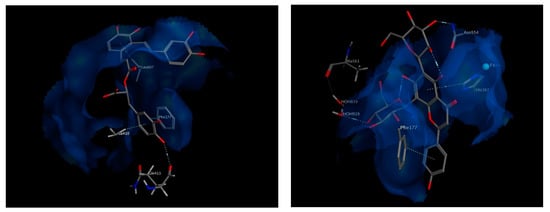
Figure 8.
3D view of interactions of Salvianolic acid A as well as Apigenin 6,8-di-C-hexosides with amino acid residues of 5-LOX. Side chains of amino acids were omitted for clarity, except for Gln413 and Ala561, whose backbones participate in hydrogen bonding with the docked compounds.
3.2.4. 5 Lipoxygenase Activating Protein (FLAP)
FLAP has a critical role in biosynthesis of leukotrienes. It delivers arachidonic acid to 5-lipoxygenase for subsequent conversion to leukotriene A4 followed by the generation of other pro-inflammatory leukotrienes. Reported crystal structures of FLAP reveal that it forms homotrimers, where each monomer contains four transmembrane α-helices. The binding site is embedded within the membrane, formed by the interface of α -helices 2 and 4 of one monomer and α -helix 1 of the neighboring monomer. Each ligand molecule is bound to the groove at the interface between two adjacent monomers [36,37].
Important amino acids forming hydrophobic interactions with the bound ligand include residues Val20, Val21, Gly24, Phe25, Ala27, Tyr112, Ile113, A63, Ile119, Leu120 and Phe123. Few polar interactions are also observed with residues Asn23 from transmembrane helix α1, residues Asp62 and Thr66 from transmembrane helix α2 and residue Lys116 from transmembrane helix α4 of the neighboring FLAP monomer [36].
The best chosen two compounds were salvianolic acid A and quercetin pentoside with binding free energy values of −17.37 and −16.79 kcal/mol, respectively. Re-docking the bound inhibitor MK-591 resulted in a score of −11.57 kcal/mol. Salvianolic acid A undergoes polar interactions with residues Lys116, Thr66, and Asn57, while quercetin pentoside interacts with Phe114 via hydrogen bonding with the glucosidic oxygen, in addition to hydrophobic interactions with Phe114 and Ile119. Interactions of both compounds are shown in Figure 9. Because the docked compounds are expected to be partially ionized in the physiological pH, the docking experimented were made for the ionizable forms which showed some ionic interactions with the basic amino acids in the binding sites of the target enzymes such as lysine and arginine.
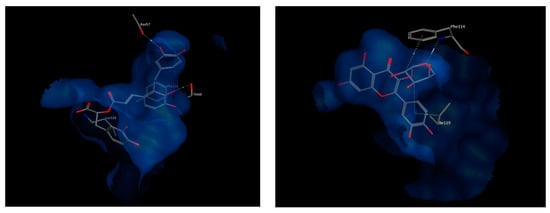
Figure 9.
3D view of interactions of Salvianolic acid A (left) as well as Quercetin pentoside (right) with amino acid residues of FLAP. Side chains of amino acids were omitted for clarity, except for Thr66 (right) and Phe114 (left), whose backbones participate in hydrogen bonding with the docked compounds.
4. Conclusions
The current investigation showed that the major constituents of T. algeriensis are rosmarinic acid and its glucoside derivative (rosmarinic acid glucoside), luteolin glucuronide and salvianolic acid K, while the major constituents of T. fontanesii are carnosol and salvigenin. Both species contain flavonoids (quercetin, luteolin, apigenin, and their derivatives) and phenolic acids (caffeic acid and phloretic acid and their derivatives). Both studied Thymus species exhibited antioxidant, anti-inflammatory, analgesic, and antipyretic effects in the performed in silico, in vitro, and in vivo experiments, which may be attributed to their phenolic compounds. They are a more potent antioxidant than ascorbic acid and more selective against COX-2. T. fontanesii tends to be a more potent COX-2 inhibitor than T. algeriensis and similar to celecoxib, the selective COX-2 inhibitor, indicating more potent anti-inflammatory, analgesic, and antipyretic effects. Molecular docking data showed that the docked compounds gave better scores on COX-2 than COX-1 and other enzymes involved in the study, which was supported by the in vitro results obtained. The docking poses retrieved in the binding sites of inflammatory proteins of concern were similar to co-crystallized ligands’ orientations and were able to reproduce the same interactions with surrounding amino acids. Top candidates from our in silico study included salvianolic acid A, rosmarininc acid glucoside, apigenin 6,8-di-C-hexosides as well as quercetin pentoside. These candidates represent leads of natural origin for developing safer anti-inflammatory alternatives to the currently in-use drugs. In conclusions, Thymus algeriensis and Thymus fontanesii are good candidates to counteract inflammation and reactive oxygen species-related diseases. Their pharmacologocical properties are still in need for further in vivo examinations.
Author Contributions
M.S. performed extraction and chemical characterization and wrote the manuscript. S.R. and M.F.M. performed the biological experiments and wrote the manuscript. M.A.O.A. and R.M.H.R. performed the molecular modeling studies and wrote the manuscript. M.C., A.M.E.-S. and A.Y. analyzed the data. M.S., M.F.M., A.M.E.-S. and M.W. designed and conceived the project. All authors revised the manuscript. All authors have read and agree to the published version of the manuscript.
Funding
We acknowledge financial support by Deutsche Forschungsgemeinschaft within the funding programme Open Access Publishing, by the Baden-Württemberg Ministry of Science, Research and the Arts and by Ruprecht-Karls-Universität Heidelberg.
Conflicts of Interest
The authors declare no conflict of interest.
References
- Nathan, C.F. Points of control in inflammation. Nature 2002, 420, 846–852. [Google Scholar] [CrossRef] [PubMed]
- Wang, Y.; Chen, P.; Tang, C.; Wang, Y.; Li, Y.; Zhang, H. Antinociceptive and anti-inflammatory activities of extract and two isolated flavonoids of Carthamus tinctorius L. J. Ethnopharmacol. 2014, 151, 944–950. [Google Scholar] [CrossRef] [PubMed]
- Ziani, B.E.; Heleno, S.A.; Bachari, K.; Dias, M.I.; Alves, M.J.; Barros, L.; Ferreira, I.C. Phenolic compounds characterization by LC-DAD-ESI/MSn and bioactive properties of Thymus algeriensis Boiss. & Reut. and Ephedra alata Decne. Food Res. Int. 2019, 116, 312–319. [Google Scholar] [PubMed]
- Guesmi, F.; Beghalem, H.; Tyagi, A.K.; Ben Ali, M.; Ben Mouhoub, R.; Bellamine, H.; Landoulsi, A. Prevention of H2O2 induced oxidative damages of rat testis by Thymus algeriensis. Biomed. Environ. Sci. 2016, 29, 275–285. [Google Scholar]
- Ghareeb, M.; Sobeh, M.; El-Maadawy, W.H.; Mohammed, H.S.; Khalil, H.; Botros, S.S.; Wink, M. Chemical profiling of polyphenolics in Eucalyptus globulus and evaluation of its hepato-renal protective potential against cyclophosphamide induced toxicity in mice. Antioxidants 2019, 8, 415. [Google Scholar] [CrossRef]
- AbdelAll, E.; Lamie, P.F.; Ali, W.A. Cyclooxygenase-2 and 15-lipoxygenase inhibition, synthesis, anti-inflammatory activity and ulcer liability of new celecoxib analogues: Determination of region-specific pyrazole ring formation by NOESY. Bioorganic Med. Chem. Lett. 2016, 26, 2893–2899. [Google Scholar] [CrossRef]
- Sobeh, M.; Mahmoud, M.F.; Rezq, S.; Alsemeh, A.E.; Sabry, O.M.; Mostafa, I.; Abdelfattah, M.A.O.; El-Allem, K.A.; Shazly, A.M.; Yasri, A.; et al. Salix tetrasperma Roxb. extract alleviates neuropathic pain in rats via modulation of the NF-κB/TNF-α/NOX/iNOS pathway. Antioxidants 2019, 8, 482. [Google Scholar] [CrossRef]
- Liu, C.; Su, H.; Wan, H.; Qin, Q.; Wu, X.; Kong, X.; Lin, N. Forsythoside A exerts antipyretic effect on yeast-induced pyrexia mice via inhibiting transient receptor potential vanilloid 1 function. Int. J. Biol. Sci. 2017, 13, 65–75. [Google Scholar] [CrossRef]
- Nabet, N.; Gilbert-Lopez, B.; Madani, K.; Herrero, M.; Ibáñez, E.; Mendiola, J.A. Optimization of microwave-assisted extraction recovery of bioactive compounds from Origanum glandulosum and Thymus fontanesii. Ind. Crop. Prod. 2019, 129, 395–404. [Google Scholar] [CrossRef]
- Vergara-Salinas, J.R.; Pérez-Jiménez, J.; Torres, J.L.; Agosin, E.; Pérez-Correa, J.R. Effects of temperature and time on polyphenolic content and antioxidant activity in the pressurized hot water extraction of deodorized Thyme (Thymus vulgaris). J. Agric. Food Chem. 2012, 60, 10920–10929. [Google Scholar] [CrossRef]
- El-Domiaty, M.M.; El-Shafae, A.M.; Abdel-Aal, M.M. A flavanol, flavanone and highly-oxygenated flavones from Thymus algeriensis Boiss. Alexanderia J. Pharm. Sci. 1997, 11, 13–17. [Google Scholar]
- Boutaoui, N.; Zaiter, L.; Benayache, S.; Benayache, S.; Carradori, S.; Cesa, S.; Giusti, A.M.; Campestre, C.; Menghini, L.; Innosa, D.; et al. Qualitative and quantitative phytochemical analysis of different extracts from Thymus algeriensis aerial parts. Molecules 2018, 23, 463. [Google Scholar] [CrossRef] [PubMed]
- Di Rosa, M.; Willoughby, D.A. Screens for anti-inflammatory drugs. J. Pharm. Pharmacol. 1971, 23, 297–298. [Google Scholar] [CrossRef] [PubMed]
- Vinegar, R.; Schreiber, W.; Hugo, R. Biphasic development of carrageenin edema in rats. J. Pharmacol. Exp. Ther. 1969, 166, 96–103. [Google Scholar]
- Meshram, G.G.; Kumar, A.; Rizvi, W.; Tripathi, C.; Khan, R. Evaluation of the anti-inflammatory activity of the aqueous and ethanolic extracts of the leaves of Albizzia lebbeck in rats. J. Tradit. Complement. Med. 2015, 6, 172–175. [Google Scholar] [CrossRef]
- Matsumoto, K.; Obara, S.; Kuroda, Y.; Kizu, J. Anti-inflammatory effects of linezolid on carrageenan-induced paw edema in rats. J. Infect. Chemother. 2015, 21, 889–891. [Google Scholar] [CrossRef]
- Wei, Y.; Chen, J.; Hu, Y.; Lu, W.; Zhang, X.; Wang, R.; Chu, K. Rosmarinic acid mitigates lipopolysaccharide-induced neuroinflammatory responses through the inhibition of TLR4 and CD14 expression and NF-κB and NLRP3 inflammasome activation. Inflammation 2018, 41, 732–740. [Google Scholar] [CrossRef]
- Mansourabadi, A.H.; Sadeghi, H.M.; Razavi, N.; Rezvani, E. Anti-inflammatory and analgesic properties of Salvigenin, Salvia officinalis flavonoid extracted. Adv. Herb. Med. 2015, 1, 31–34. [Google Scholar]
- Noori, S.; Hassan, Z.M.; Yaghmaei, B.; Dolatkhah, M. Antitumor and immunomodulatory effects of salvigenin on tumor bearing mice. Cell. Immunol. 2013, 286, 16–21. [Google Scholar] [CrossRef]
- Sherwood, E.R.; Tolliver-Kinsky, T. Mechanisms of the inflammatory response. Best Pr. Res. Clin. Anaesthesiol. 2004, 18, 385–405. [Google Scholar] [CrossRef]
- Ikeda, Y.; Ueno, A.; Naraba, H.; Oh-Ishi, S.; Ikeda-Matsuo, Y. Involvement of vanilloid receptor VR1 and prostanoids in the acid-induced writhing responses of mice. Life Sci. 2001, 69, 2911–2919. [Google Scholar] [CrossRef]
- Nidavani, R.B.; Mahalakshmi, A.M.; Shalawadi, M. Vascular permeability and evans blue dye: A physiological and pharmacological approach. J. Appl. Pharm. Sci. 2014, 4, 106–113. [Google Scholar]
- Khan, H.; Saeed, M.; Gilani, A.-H.; Khan, M.; Dar, A.; Khan, I. The antinociceptive activity of Polygonatum verticillatum rhizomes in pain models. J. Ethnopharmacol. 2010, 127, 521–527. [Google Scholar] [CrossRef] [PubMed]
- Malvar, D.D.C.; Soares, D.; Fabricio, A.S.C.; Kanashiro, A.; Machado, R.R.; Figueiredo, M.J.; Rae, G.A.; Souza, G. The antipyretic effect of dipyrone is unrelated to inhibition of PGE2 synthesis in the hypothalamus. Br. J. Pharmacol. 2011, 162, 1401–1409. [Google Scholar] [CrossRef]
- Malvar, D.D.C.; Aguiar, F.A.; Vaz, A.D.L.L.; Assis, D.C.R.; De Melo, M.C.C.; Jabor, V.A.P.; Kalapothakis, E.; Ferreira, S.H.; Clososki, G.; Souza, G. Dipyrone metabolite 4-MAA induces hypothermia and inhibits PGE2-dependent and -independent fever while 4-AA only blocks PGE2-dependent fever. Br. J. Pharmacol. 2014, 171, 3666–3679. [Google Scholar] [CrossRef]
- Lin, C.; Zhang, X.; Su, Z.; Xiao, J.; Lv, M.; Cao, Y.; Chen, Y. Carnosol improved lifespan and healthspan by promoting antioxidant capacity in Caenorhabditis elegans. Oxidative Med. Cell. Longev. 2019, 2019, 5958043. [Google Scholar] [CrossRef]
- Hsu, A.-L.; Murphy, C.T.; Kenyon, C. Regulation of aging and age-related disease by DAF-16 and heat-shock factor. Science 2003, 300, 1142–1145. [Google Scholar] [CrossRef]
- Munné-Bosch, S.; Schwarz, K.; Alegre, L. Response of abietane diterpenes to stress in Rosmarinus officinalis L.: New insights into the function of diterpenes in plants. Free. Radic. Res. 1999, 31, 107–112. [Google Scholar] [CrossRef]
- Johnson, J.J. Carnosol: A promising anti-cancer and anti-inflammatory agent. Cancer Lett. 2011, 305, 1–7. [Google Scholar] [CrossRef]
- Subbaramaiah, K.; A Cole, P.; Dannenberg, A.J. Retinoids and carnosol suppress cyclooxygenase-2 transcription by CREB-binding protein/p300-dependent and -independent mechanisms. Cancer Res. 2002, 62, 2522–2530. [Google Scholar]
- Orlando, B.J.; Malkowski, M. Substrate-selective Inhibition of cyclooxygeanse-2 by fenamic acid derivatives is dependent on peroxide tone. J. Biol. Chem. 2016, 291, 15069–15081. [Google Scholar] [CrossRef] [PubMed]
- Blobaum, A.L.; Marnett, L.J. Structural and functional basis of cyclooxygenase inhibition. J. Med. Chem. 2007, 50, 1425–1441. [Google Scholar] [CrossRef] [PubMed]
- Cingolani, G.; Panella, A.; Perrone, M.G.; Vitale, P.; Di Mauro, G.; Fortuna, C.G.; Scilimati, A. structural basis for selective inhibition of cyclooxygenase-1 (COX-1) by diarylisoxazolesmofezolac and 3-(5-chlorofuran-2-yl)-5-methyl-4-phenylisoxazole (P6). Eur. J. Med. Chem. 2017, 138, 661–668. [Google Scholar] [CrossRef] [PubMed]
- Rowlinson, S.W.; Crews, B.C.; Lanzo, C.A.; Marnett, L.J. The binding of arachidonic acid in the cyclooxygenase active site of mouse prostaglandin endoperoxide synthase-2 (COX-2) a putative L-shaped binding conformation utilizing the top channel region. J. Biol. Chem. 1999, 274, 23305–23310. [Google Scholar] [CrossRef]
- Tsolaki, E.; Eleftheriou, P.; Kartsev, V.; Geronikaki, A.; Saxena, A. Application of docking analysis in the prediction and biological evaluation of the lipoxygenase inhibitory action of thiazolyl derivatives of mycophenolic acid. Molecules 2018, 23, 1621. [Google Scholar] [CrossRef]
- Blevitt, J.M.; Hack, M.D.; Herman, K.; Chang, L.; Keith, J.M.; Mirzadegan, T.; Rao, N.L.; Lebsack, A.D.; Milla, M.E. A single amino acid difference between mouse and human 5-Lipoxygenase activating protein (FLAP) explains the speciation and differential pharmacology of novel FLAP inhibitors. J. Biol. Chem. 2016, 291, 12724–12731. [Google Scholar] [CrossRef]
- Evans, J.F.; Ferguson, A.D.; Mosley, R.T.; Hutchinson, J.H. What’s all the FLAP about? 5-Lipoxygenase-activating protein inhibitors for inflammatory diseases. Trends Pharmacol. Sci. 2008, 29, 72–78. [Google Scholar] [CrossRef]


© 2020 by the authors. Licensee MDPI, Basel, Switzerland. This article is an open access article distributed under the terms and conditions of the Creative Commons Attribution (CC BY) license (http://creativecommons.org/licenses/by/4.0/).