
New Insights to Regulation of Fructose-1,6-bisphosphatase during Anoxia in Red-Eared Slider, Trachemys scripta elegans


Abstract
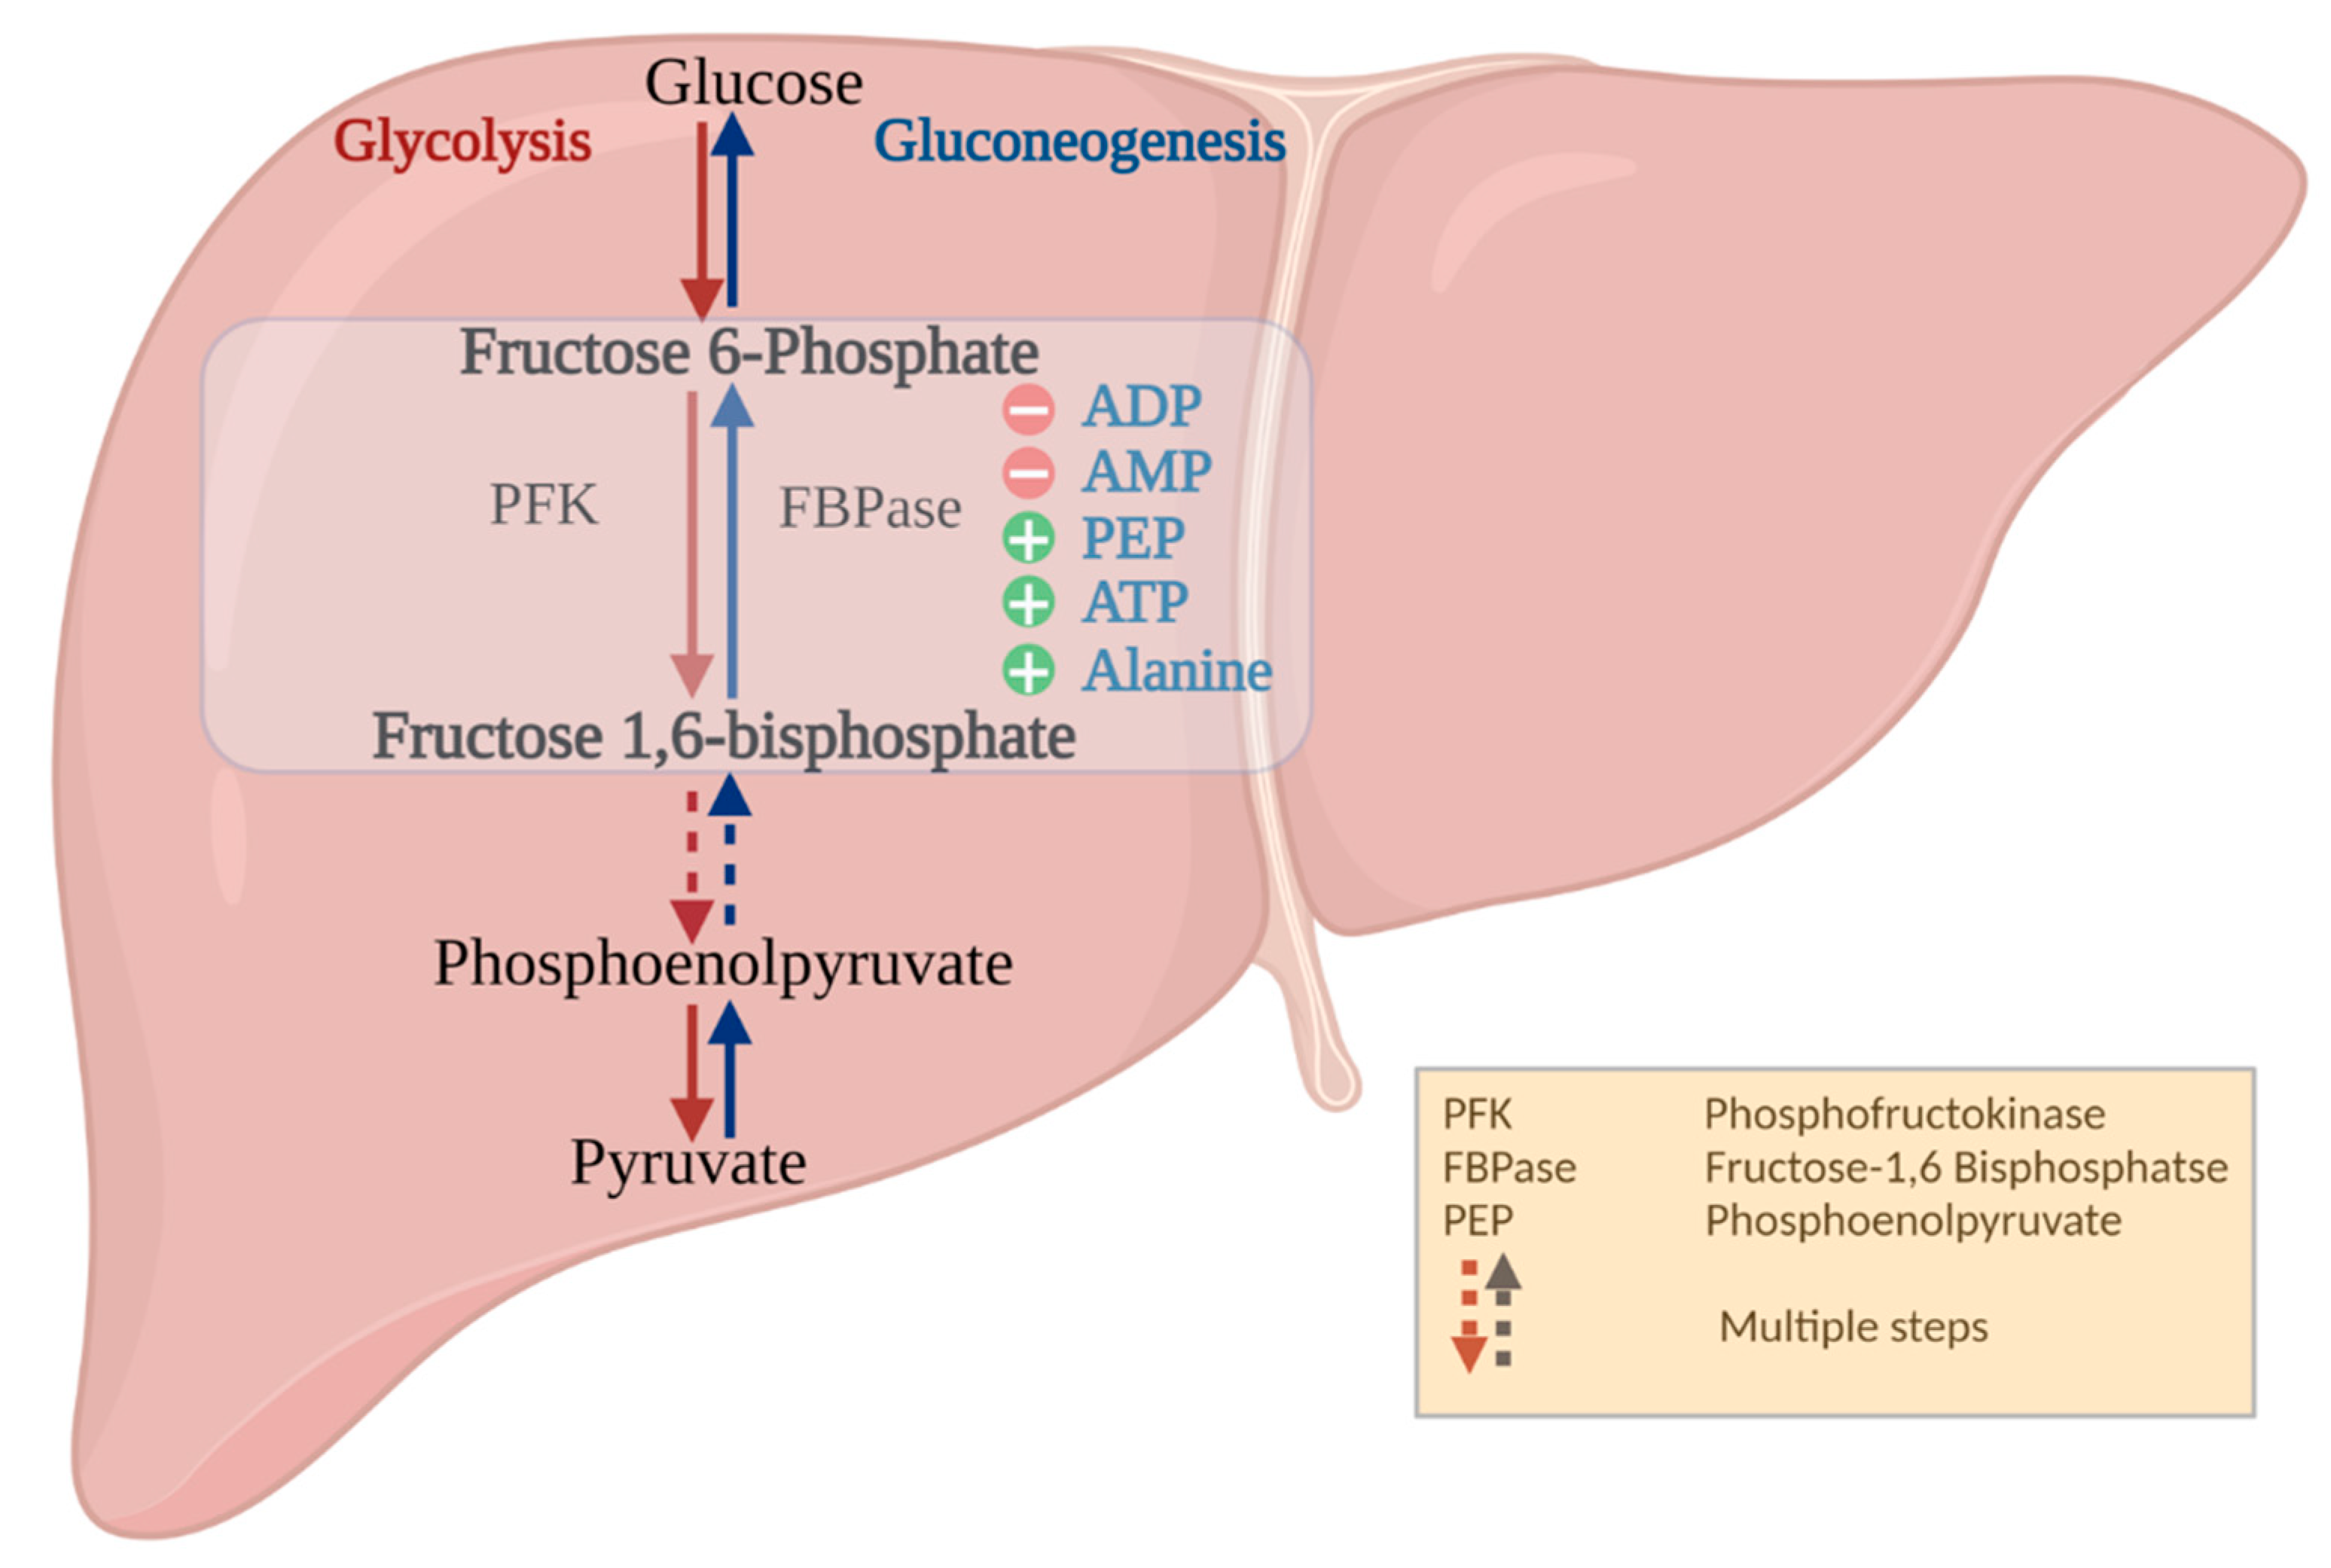
:1. Introduction
2. Materials and Methods
2.1. Animals
2.2. Sample Preparation
2.3. FBPase Purification
2.4. SDS PAGE and Coomassie Staining
2.5. FBPase Assay
2.6. Post-Translational Modification Analysis via Western Blotting
2.7. In Silico FBPase 3D Homology Modelling
2.8. Quantification and Statistical Analysis
3. Results
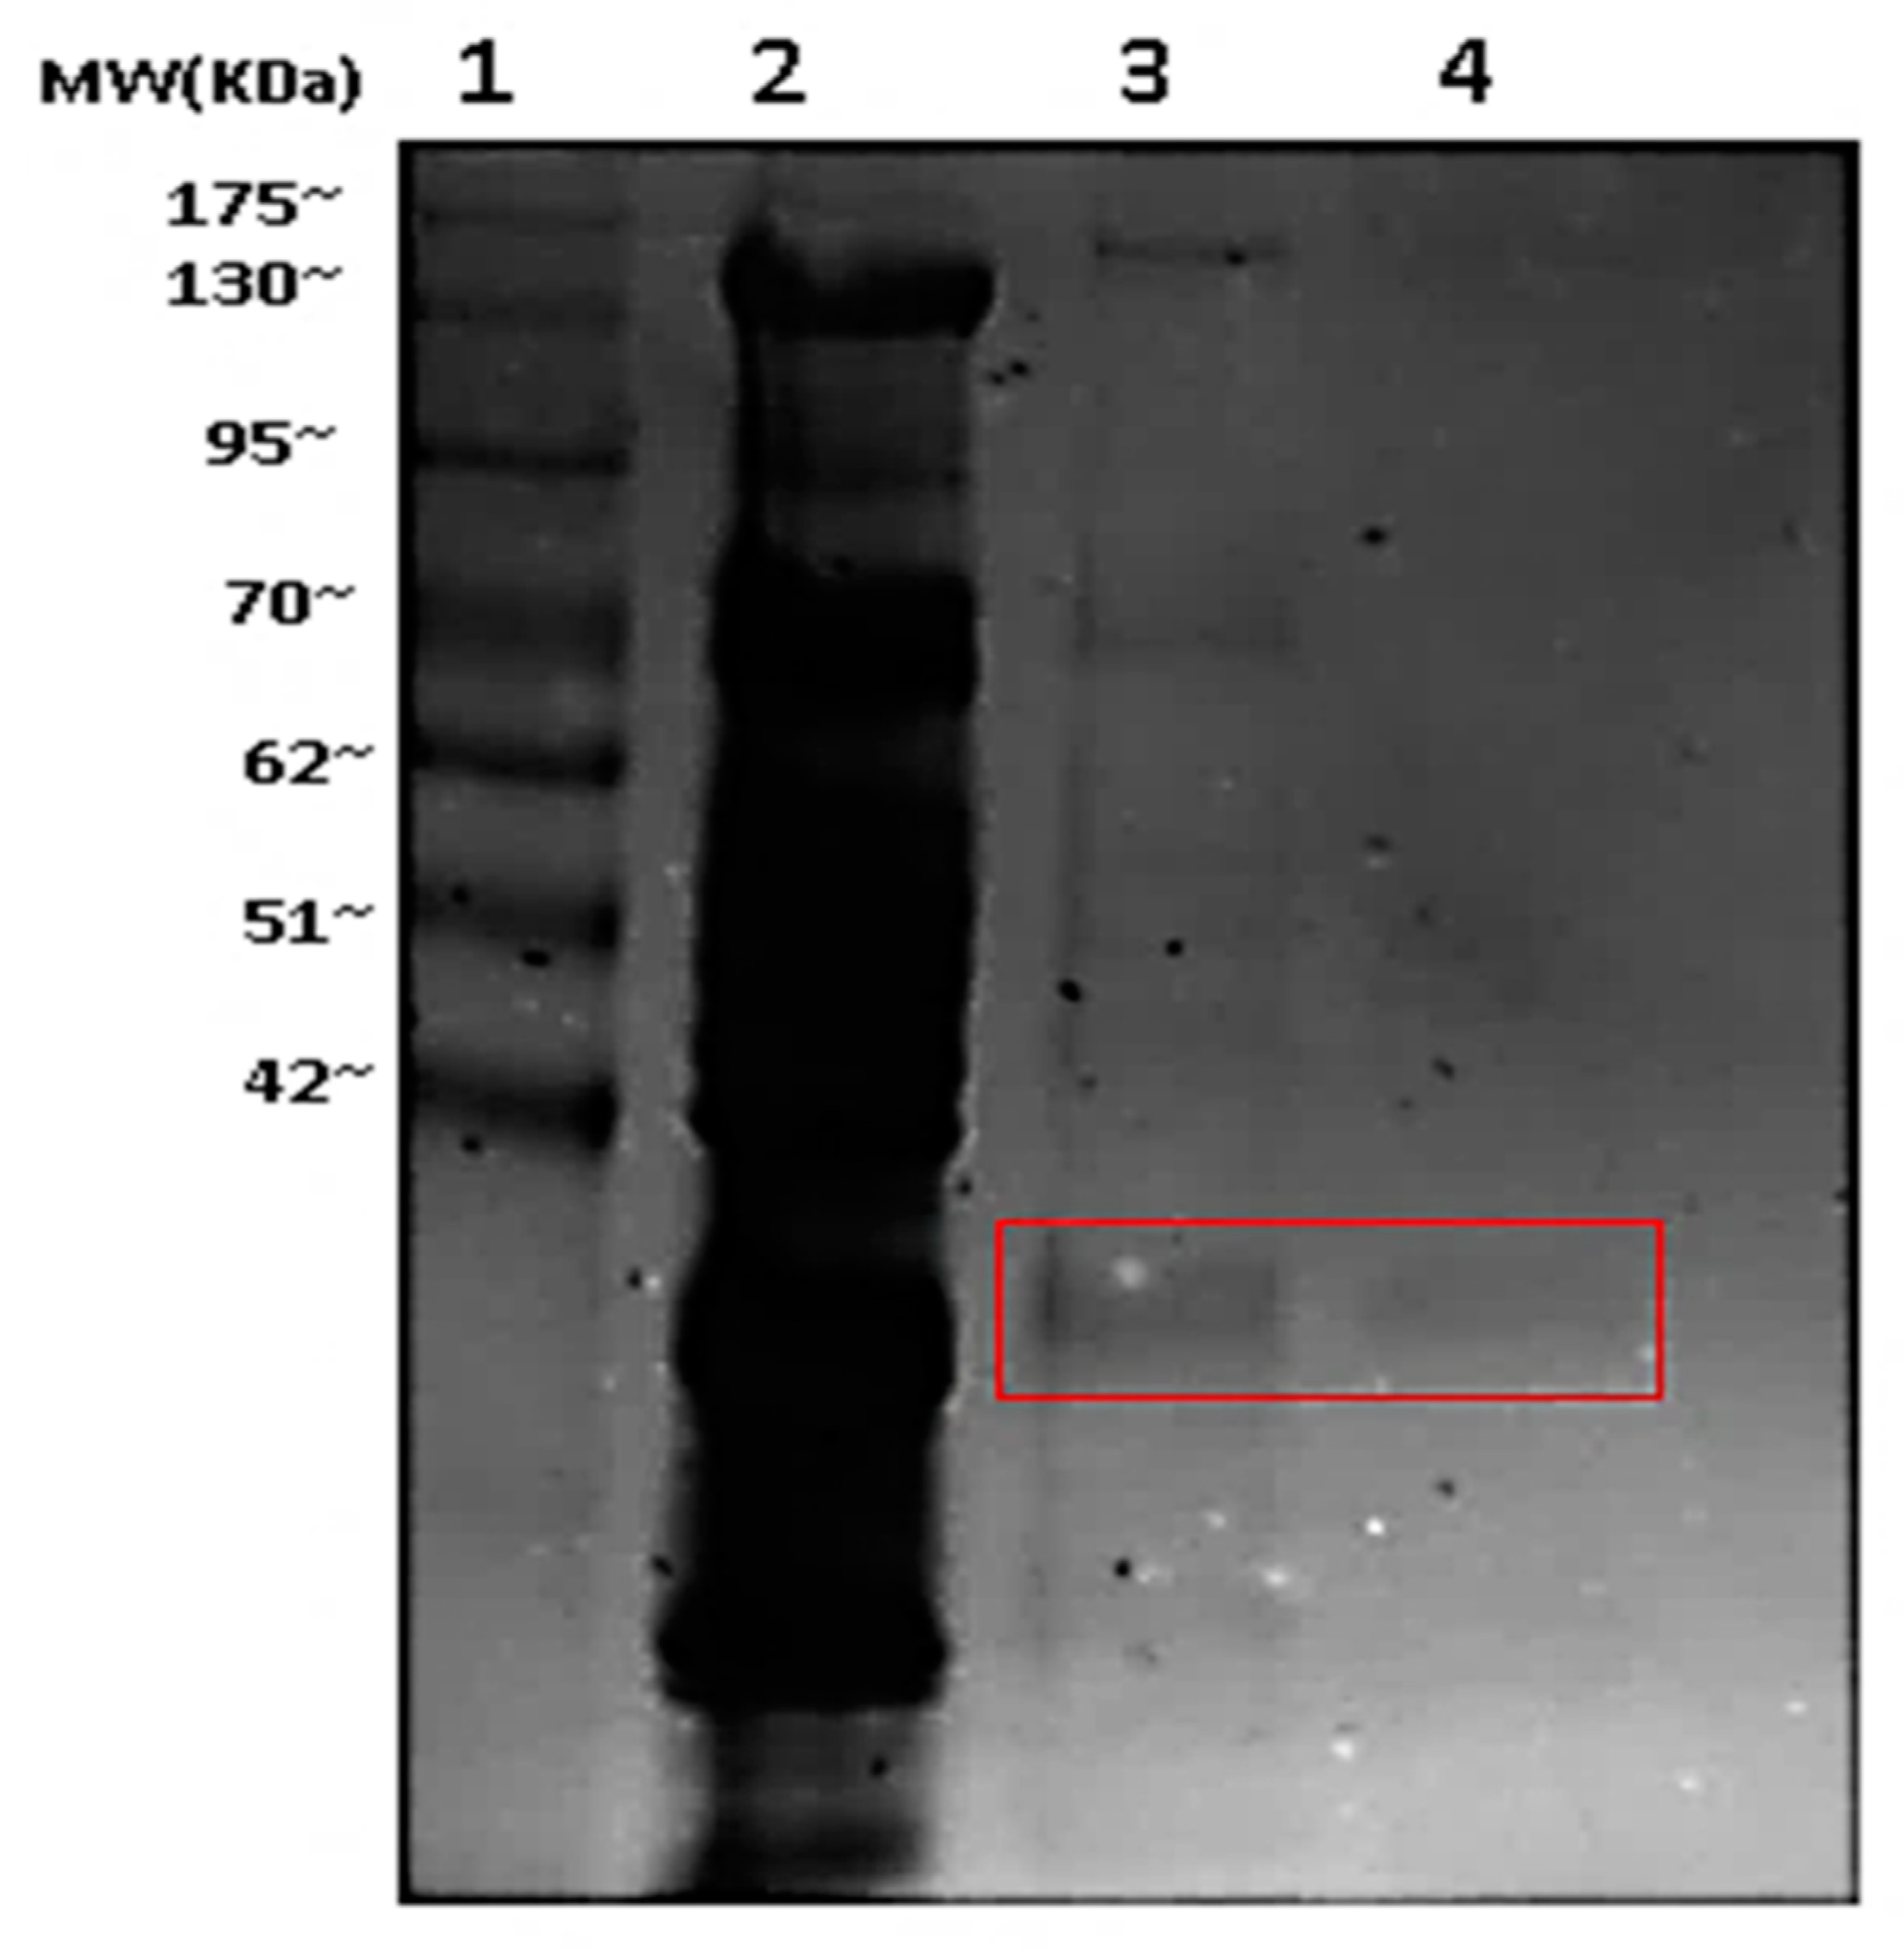
3.1. Purification of Fructose-1,6-bisphosphatase
3.2. Kinetic Properties of FBPase
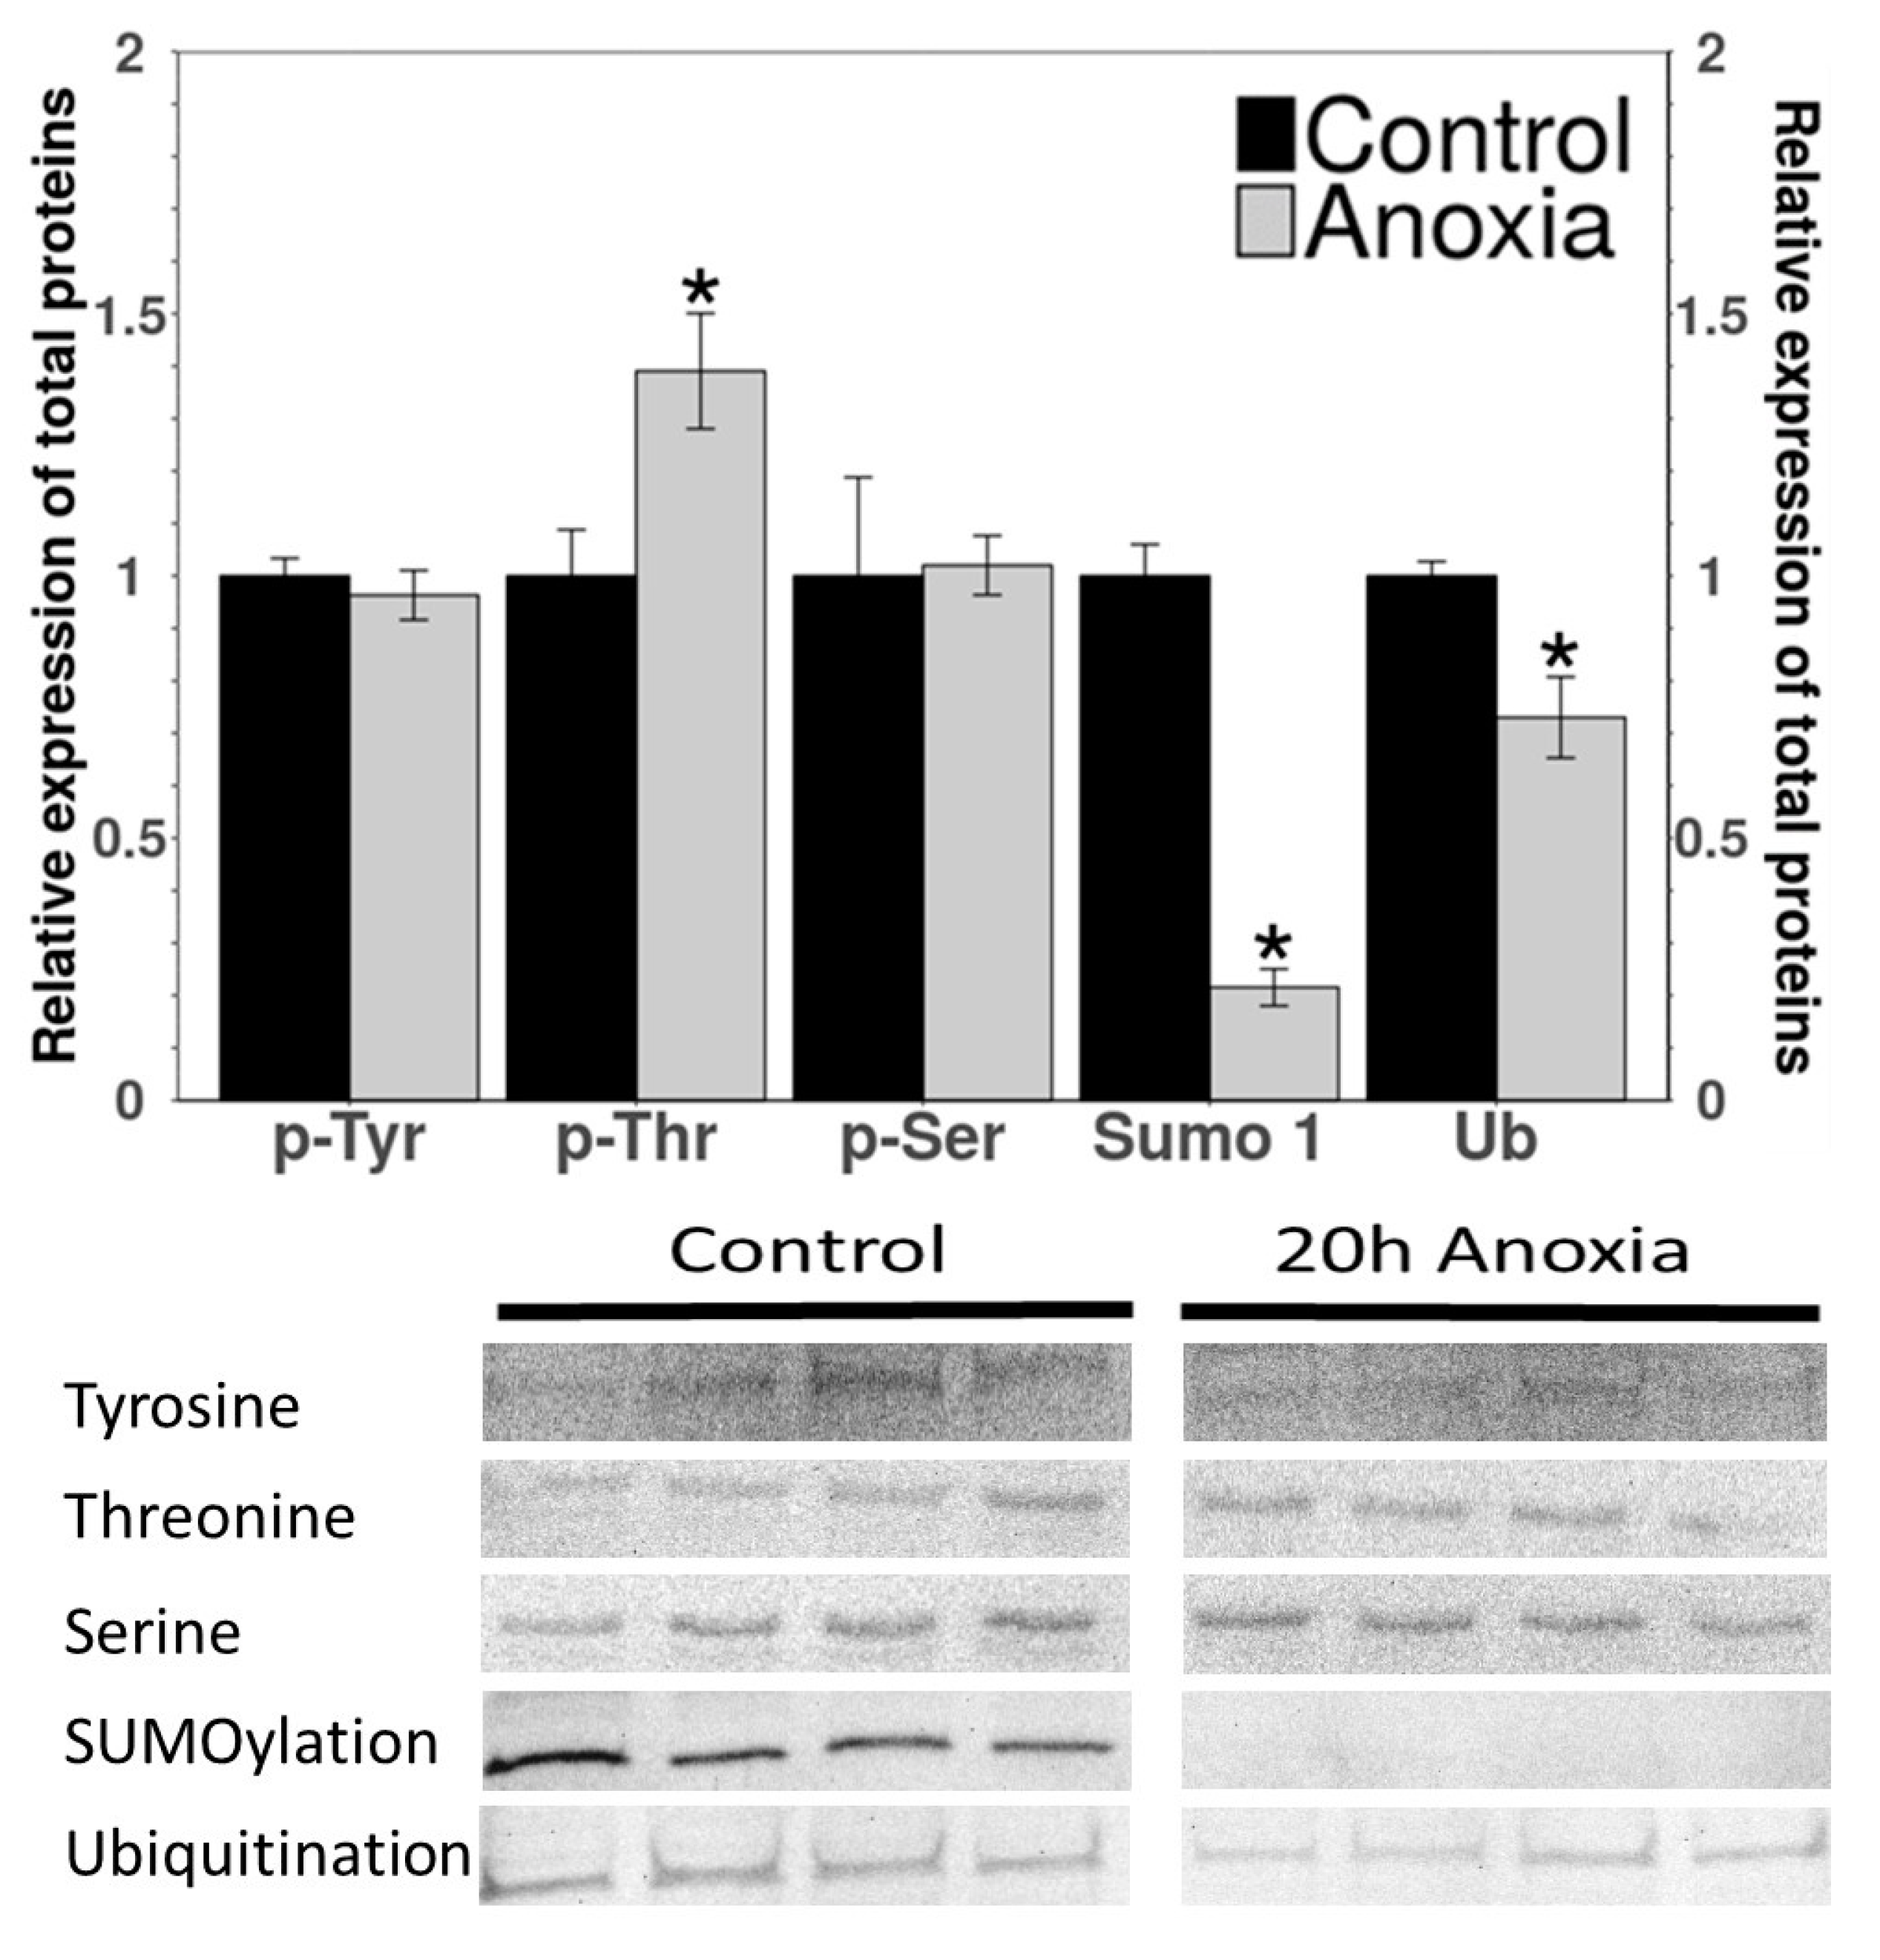
3.3. PTM Western Blots
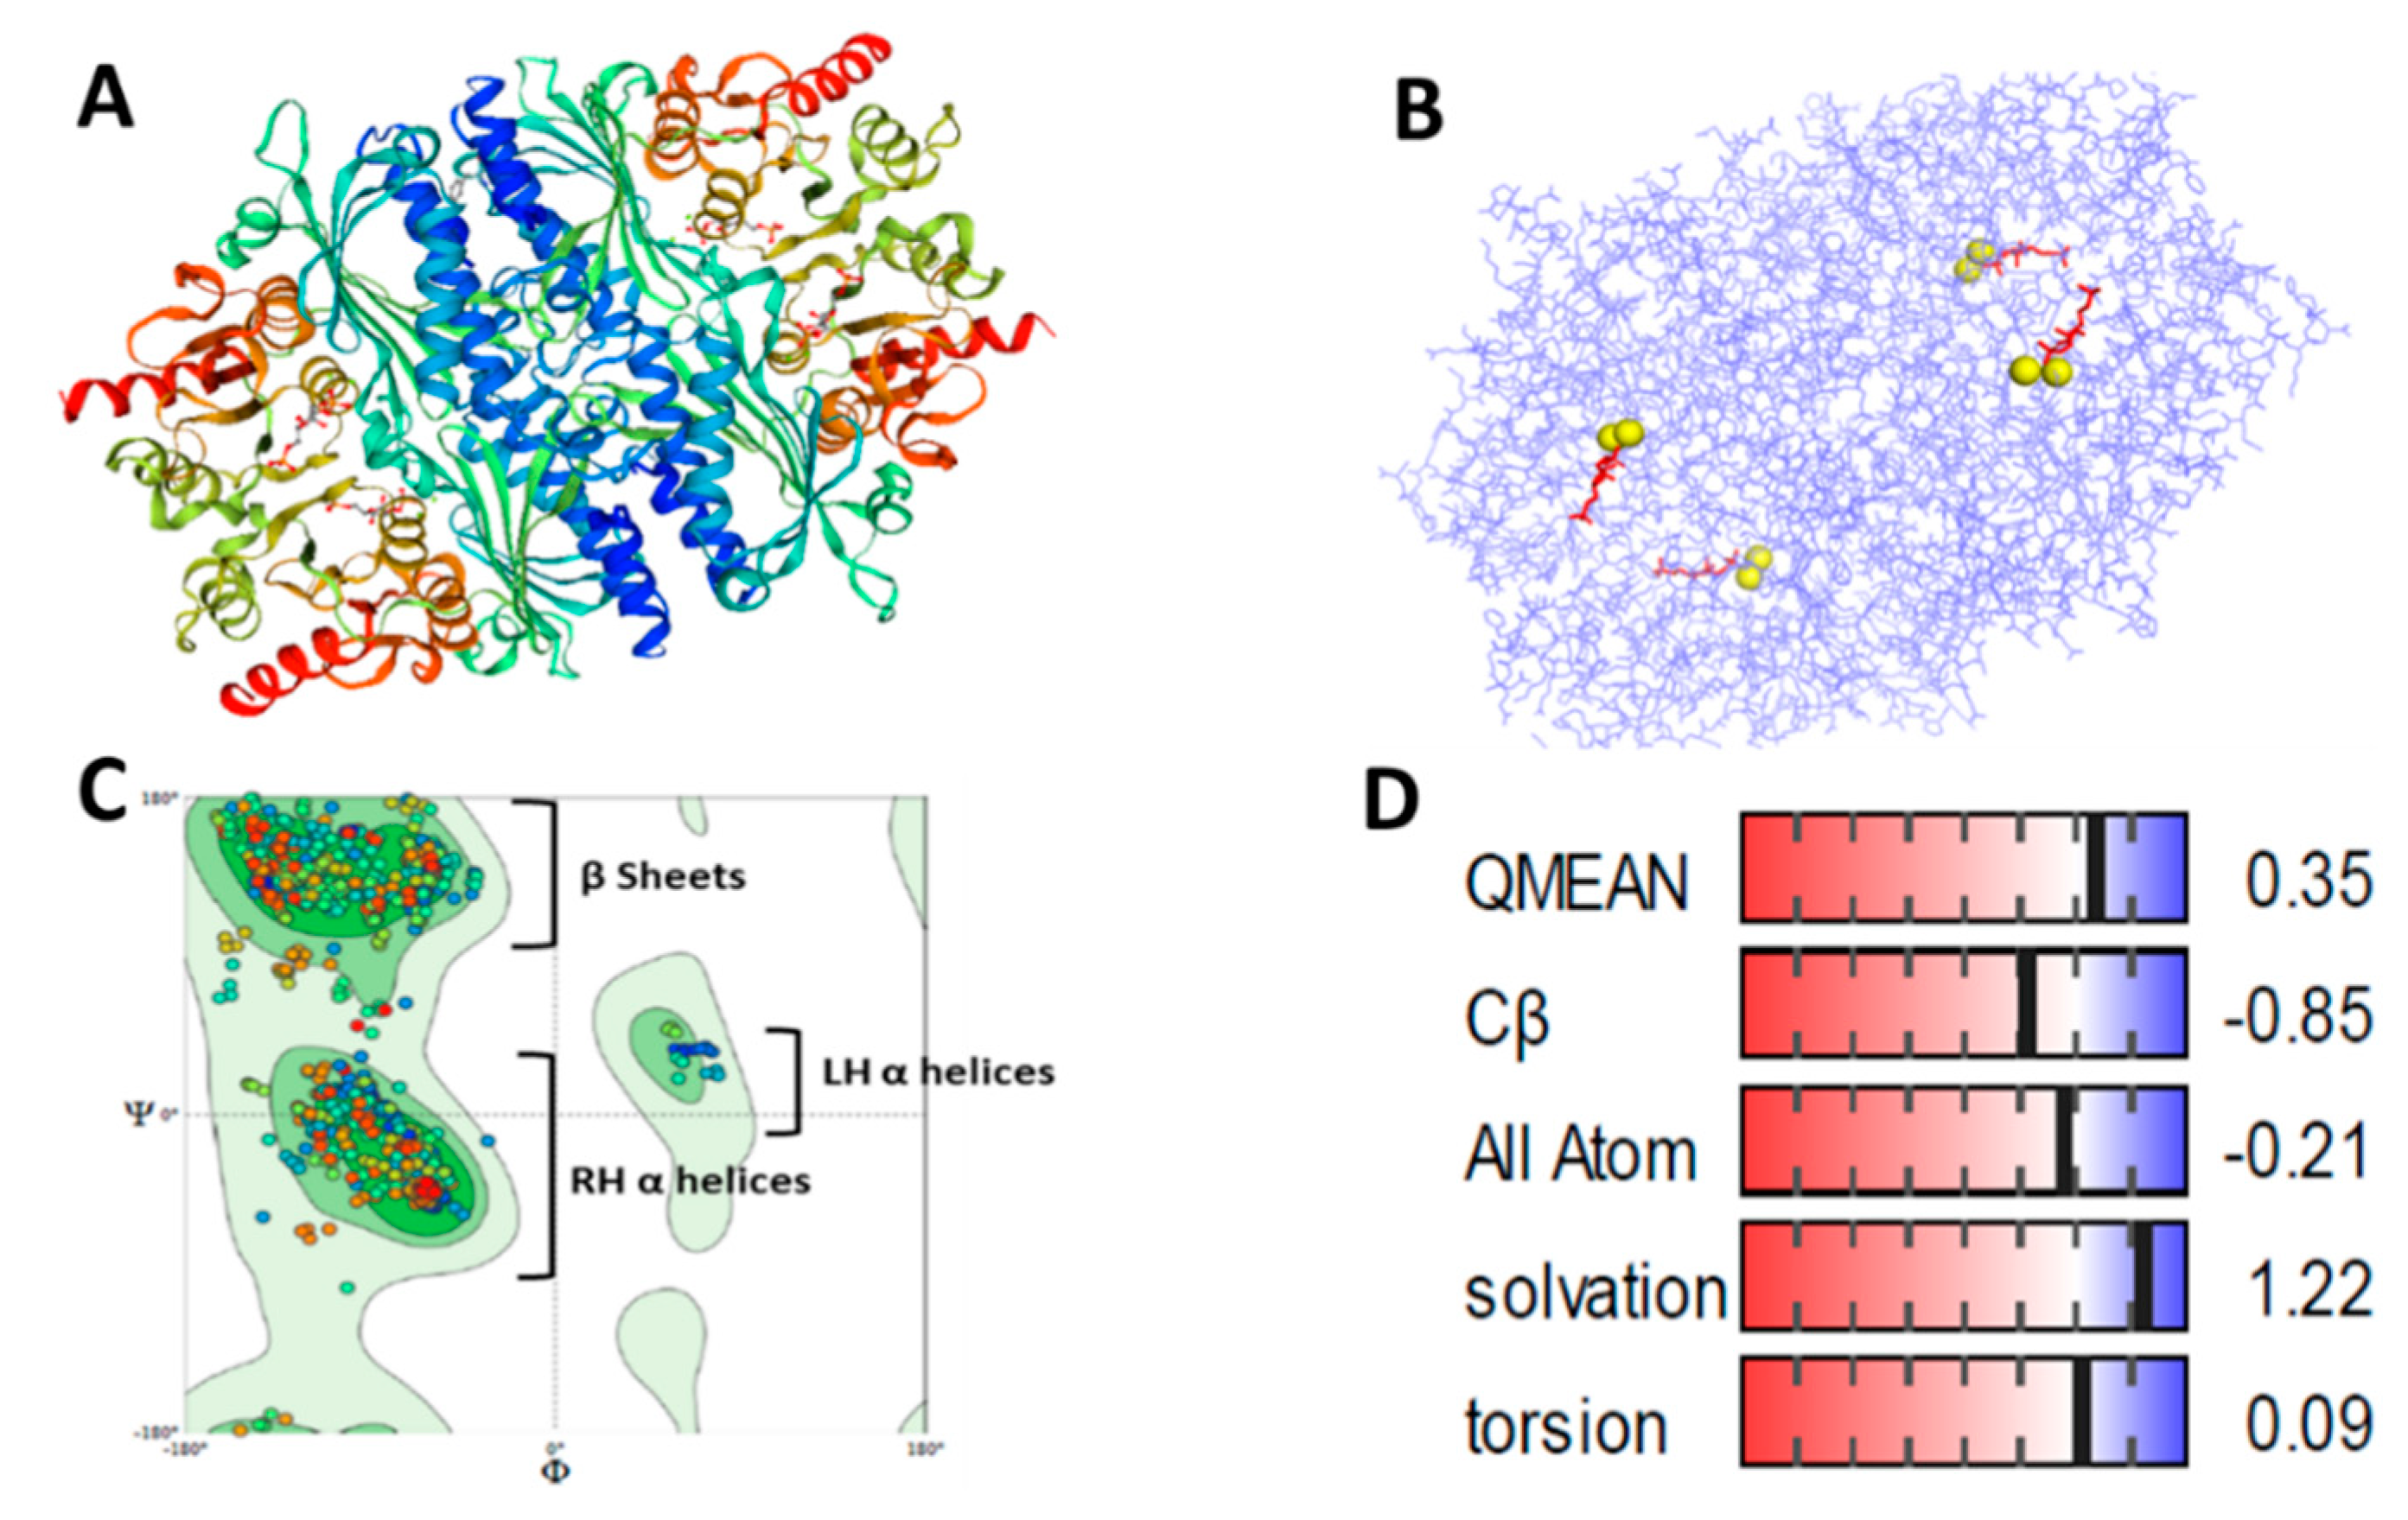
3.4. Bioinformatics
4. Discussion
5. Conclusions
Author Contributions
Funding
Institutional Review Board Statement
Informed Consent Statement
Data Availability Statement
Acknowledgments
Conflicts of Interest
Abbreviations
| FBPase | Fructose-1,6-bisphosphatase |
| FBP | Fructose-1,6-bisphosphate |
| PFK | phosphofructokinase |
| PEP | Phosphoenolpyruvate |
References
- Ultsch, G.R. The viability of nearctic freshwater turtles submerged in anoxia and normoxia at 3 and 10 °C. Comp. Biochem. Physiol. Part A Physiol. 1985, 81, 607–611. [Google Scholar] [CrossRef]
- Breedon, S.A.; Hadj-Moussa, H.; Storey, K.B. Nrf2 activates antioxidant enzymes in the anoxia-tolerant red-eared slider turtle, Trachemys scripta elegans. J. Exp. Zool. Part A Ecol. Integr. Physiol. 2021, 335, 426–435. [Google Scholar] [CrossRef] [PubMed]
- Warren, D.E.; Jackson, D.C. Lactate metabolism in anoxic turtles: An integrative review. J. Comp. Physiol. B 2008, 178, 133–148. [Google Scholar] [CrossRef]
- Storey, K.B. Anoxia tolerance in turtles: Metabolic regulation and gene expression. Comp. Biochem. Physiol.—Part A Mol. Integr. Physiol. 2007, 147, 263–276. [Google Scholar] [CrossRef] [PubMed]
- Storey, K.B. Molecular mechanisms of anoxia tolerance. Int. Congr. Ser. 2004, 1275, 47–54. [Google Scholar] [CrossRef]
- Krivoruchko, A.; Storey, K.B. Turtle anoxia tolerance: Biochemistry and gene regulation. Biochim. Biophys. Acta—Gen. Subj. 2015, 1850, 1188–1196. [Google Scholar] [CrossRef] [PubMed]
- Brooks, S.P.J.; Storey, K.B. Regulation of glycolytic enzymes during anoxia in the turtle Pseudemys scripta. Am. J. Physiol. Integr. Comp. Physiol. 1989, 257, R278–R283. [Google Scholar] [CrossRef] [PubMed]
- Xiong, Z.J.; Storey, K.B. Regulation of liver lactate dehydrogenase by reversible phosphorylation in response to anoxia in a freshwater turtle. Comp. Biochem. Physiol. Part B Biochem. Mol. Biol. 2012, 163, 221–228. [Google Scholar] [CrossRef]
- Willmore, W.G.; Cowan, K.J.; Storey, K.B. Effects of anoxia exposure and aerobic recovery on metabolic enzyme activities in the freshwater turtle Trachemys scripta elegans. Can. J. Zool. 2001, 79, 1822–1828. [Google Scholar] [CrossRef] [Green Version]
- Dawson, N.J.; Biggar, K.K.; Storey, K.B. Characterization of Fructose-1,6-Bisphosphate Aldolase during Anoxia in the Tolerant Turtle, Trachemys scripta elegans: An Assessment of Enzyme Activity, Expression and Structure. PLoS ONE 2013, 8, e68830. [Google Scholar] [CrossRef] [PubMed] [Green Version]
- Mehrani, H.; Storey, K.B. Enzymatic control of glycogenolysis during anoxic submergence in the freshwater turtle Trachemys scripta. Int. J. Biochem. Cell Biol. 1995, 27, 821–830. [Google Scholar] [CrossRef]
- Storey, K.B. Metabolic adaptations supporting anoxia tolerance in reptiles: Recent advances. Comp. Biochem. Physiol.—Part B Biochem. Mol. Biol. 1996, 113, 23–35. [Google Scholar] [CrossRef]
- Willmore, W.G.; Storey, K.B. Antioxidant systems and anoxia tolerance in a freshwater turtle Trachemys scripta elegans. Mol. Cell. Biochem. 1997, 170, 177–185. [Google Scholar] [CrossRef] [PubMed]
- Brooks, S.P.; Storey, K.B. Glycolytic Enzyme Binding and Metabolic Control in Estivation and Anoxia in the Land Snail Otala lactea. J. Exp. Biol. 1990, 151, 193–204. [Google Scholar] [CrossRef]
- Brooks, S.P.J.; Storey, K.B. Chapter 13 Is glycolytic rate controlled by the reversible binding of enzymes to subcellular structures? In Biochemistry and Molecular Biology of Fishes; Elsevier: Amsterdam, The Netherlands, 1995; pp. 291–307. [Google Scholar]
- Brooks, S.P.J.; Storey, K.B. Properties of Pyruvate Dehydrogenase from the Land Snail, Otala lactea: Control of Enzyme Activity during Estivation. Physiol. Zool. 1992, 65, 620–633. [Google Scholar] [CrossRef]
- Storey, K.B.; Brooks, S.P.J. Chapter 6 The basis of enzymatic adaptation. In Principles of Medical Biology; Elsevier: Amsterdam, The Netherlands, 1995; pp. 147–169. [Google Scholar]
- Warren, D.E.; Reese, S.A.; Jackson, D.C. Tissue Glycogen and Extracellular Buffering Limit the Survival of Red-Eared Slider Turtles during Anoxic Submergence at 3 °C. Physiol. Biochem. Zool. 2006, 79, 736–744. [Google Scholar] [CrossRef] [Green Version]
- Benkovic, S.J.; DeMaine, M.M. Mechanism of Action of Fructose-1,6-bisphosphatase. In Advances in Enzymology and Related Areas of Molecular Biology; Elsevier: Amsterdam, The Netherlands, 2006; pp. 45–82. [Google Scholar]
- Hanson, R.W.; Owen, O.E. Gluconeogenesis. In Encyclopedia of Biological Chemistry; Lennarz, W.J., Lane, M.D., Eds.; Elsevier: Amsterdam, The Netherlands, 2013; pp. 381–386. ISBN 9780123786319. [Google Scholar]
- Ekdahl, K.N. In vitro phosphorylation of fructose-1,6-bisphosphatase from rabbit and pig liver with cyclic AMP-dependent protein kinase. Arch. Biochem. Biophys. 1988, 262, 27–31. [Google Scholar] [CrossRef]
- Rakus, D.; Zarzycki, M.; Dzugaj, A. Rabbit muscle fructose-1,6-bisphosphatase is phosphorylatedin vivo. Acta Biochim. Pol. 2003, 50, 115–121. [Google Scholar] [CrossRef]
- Smolinski, M.B.; Varma, A.; Green, S.R.; Storey, K.B. Purification and Regulation of Pyruvate Kinase from the Foot Muscle of the Anoxia and Freeze Tolerant Marine Snail, Littorina littorea. Protein J. 2020, 39, 531–541. [Google Scholar] [CrossRef]
- Celis, J.; Trentemolle, S.; Gromov, P. Gel-Based ProteomicsHigh-Resolution Two-Dimensional Gel Electrophoresis of Proteins. Isoelectric Focusing and Nonequilibrium pH Gradient Electrophoresis. In Cell Biology; Elsevier: Amsterdam, The Netherlands, 2006; pp. 165–174. ISBN 9780121647308. [Google Scholar]
- Gupta, A.; Storey, K.B. Regulation of antioxidant systems in response to anoxia and reoxygenation in Rana sylvatica. Comp. Biochem. Physiol. Part B Biochem. Mol. Biol. 2020, 243–244, 110436. [Google Scholar] [CrossRef]
- Jackson, D.C. Living without oxygen: Lessons from the freshwater turtle. Comp. Biochem. Physiol. Part A Mol. Integr. Physiol. 2000, 125, 299–315. [Google Scholar] [CrossRef]
- Jackson, D.C. Hibernating without Oxygen: Physiological Adaptations of the Painted Turtle. J. Physiol. 2002, 543, 731–737. [Google Scholar] [CrossRef]
- Bundgaard, A.; James, A.M.; Gruszczyk, A.V.; Martin, J.; Murphy, M.P.; Fago, A. Metabolic adaptations during extreme anoxia in the turtle heart and their implications for ischemia-reperfusion injury. Sci. Rep. 2019, 9, 2850. [Google Scholar] [CrossRef] [PubMed] [Green Version]
- Pilkis, S.J.; Granner, D.K. Molecular Physiology of the Regulation of Hepatic Gluconeogenesis and Glycolysis. Annu. Rev. Physiol. 1992, 54, 885–909. [Google Scholar] [CrossRef] [PubMed]
- Storey, K.B. Metabolic regulation in mammalian hibernation: Enzyme and protein adaptations. Comp. Biochem. Physiol. Part A Physiol. 1997, 118, 1115–1124. [Google Scholar] [CrossRef]
- Ferguson, R.A.; Storey, K.B. Gluconeogenesis in trout (Oncorhynchus mykiss) white muscle: Purification and characterization of fructose-1,6-bisphosphatase activity in vitro. Fish Physiol. Biochem. 1992, 10, 201–212. [Google Scholar] [CrossRef] [PubMed]
- Storey, K.B. Regulation of liver metabolism by enzyme phosphorylation during mammalian hibernation. J. Biol. Chem. 1987, 262, 1670–1673. [Google Scholar] [CrossRef]
- Storey, K.B. Investigations of the mechanisms of glycolytic control during hibernation. Can. J. Zool. 1987, 65, 3079–3083. [Google Scholar] [CrossRef]
- Rui, L. Energy Metabolism in the Liver. In Comprehensive Physiology; Wiley: Hoboken, NJ, USA, 2014; pp. 177–197. [Google Scholar]
- Cowan, K.J.; Storey, K.B. Freeze-Thaw Effects on Metabolic Enzymes in Wood Frog Organs. Cryobiology 2001, 43, 32–45. [Google Scholar] [CrossRef]
- Williamson, J.R.; Wright, P.H.; Malaisse, W.J.; Ashmore, J. Control of gluconeogenesis by acetyl CoA in rats treated with glucagon and anti-insulin serum. Biochem. Biophys. Res. Commun. 1966, 24, 765–770. [Google Scholar] [CrossRef]
- Pilkis, S.J.; El-Maghrabi, M.R.; McGrane, M.M.; Pilkis, J.; Claus, T.H. The role of fructose 2,6-bisphosphate in regulation of fructose-1,6-bisphosphatase. J. Biol. Chem. 1981, 256, 11489–11495. [Google Scholar] [CrossRef]
- Hers, H.G.; Hue, L. Gluconeogenesis and Related Aspects of Glycolysis. Annu. Rev. Biochem. 1983, 52, 617–653. [Google Scholar] [CrossRef]
- Sistare, F.D.; Haynes, R.C. The interaction between the cytosolic pyridine nucleotide redox potential and gluconeogenesis from lactate/pyruvate in isolated rat hepatocytes. Implications for investigations of hormone action. J. Biol. Chem. 1985, 260, 12748–12753. [Google Scholar] [CrossRef]
- Haynes, R.C.; Picking, R.A. The role of inhibition of pyruvate kinase in the stimulation of gluconeogenesis by glucagon: A reevaluation. Arch. Biochem. Biophys. 1990, 283, 51–59. [Google Scholar] [CrossRef]
- Engstrom, L. The Regulation of Liver Pyruvate Kinase by Phosphorylation—Dephosphorylation. Curr. Top. Cell. Regul. 1978, 13, 29–51. [Google Scholar]
- Feliu, J.E.; Hue, L.; Hers, H.G. Hormonal control of pyruvate kinase activity and of gluconeogenesis in isolated hepatocytes. Proc. Natl. Acad. Sci. USA 1976, 73, 2762–2766. [Google Scholar] [CrossRef] [PubMed] [Green Version]
- Storey, K.B.; Storey, J.M. Tribute to P. L. Lutz: Putting life on ’pause’—Molecular regulation of hypometabolism. J. Exp. Biol. 2007, 210, 1700–1714. [Google Scholar] [CrossRef] [PubMed] [Green Version]
- Whitwam, R.E.; Storey, K.B. Pyruvate Kinase from the Land Snail Otala Lactea: Regulation by Reversible Phosphorylation during Estivation and Anoxia. J. Exp. Biol. 1990, 154, 321–337. [Google Scholar] [CrossRef]
- Mattice, A.M.S.; MacLean, I.A.; Childers, C.L.; Storey, K.B. Characterization of pyruvate kinase from the anoxia tolerant turtle, Trachemys scripta elegans: A potential role for enzyme methylation during metabolic rate depression. PeerJ 2018, 6, e4918. [Google Scholar] [CrossRef] [Green Version]
- Plaxton, W.C.; Storey, K.B. Purification and properties of aerobic and anoxic forms of pyruvate kinase from the hepatopancreas of the channelled whelk, Busycotypus canaliculatum. Arch. Biochem. Biophys. 1985, 243, 195–205. [Google Scholar] [CrossRef]
- Storey, K.B. Regulation of hypometabolism: Insights into epigenetic controls. J. Exp. Biol. 2015, 218, 150–159. [Google Scholar] [CrossRef] [Green Version]
- Gomes, A.V.; Zong, C.; Ping, P. Protein Degradation by the 26S Proteasome System in the Normal and Stressed Myocardium. Antioxid. Redox Signal. 2006, 8, 1677–1691. [Google Scholar] [CrossRef] [PubMed]
- Alva, N.; Panisello-Roselló, A.; Flores, M.; Roselló-Catafau, J.; Carbonell, T. Ubiquitin-proteasome system and oxidative stress in liver transplantation. World J. Gastroenterol. 2018, 24, 3521–3530. [Google Scholar] [CrossRef]
- Enserink, J.M. Sumo and the cellular stress response. Cell Div. 2015, 10, 1–13. [Google Scholar] [CrossRef] [Green Version]
- Dawson, N.J.; Bell, R.A.V.; Storey, K.B. Purification and Properties of White Muscle Lactate Dehydrogenase from the Anoxia-Tolerant Turtle, the Red-Eared Slider, Trachemys scripta elegans. Enzyme Res. 2013, 2013, 1–8. [Google Scholar] [CrossRef] [Green Version]
- Geiss-Friedlander, R.; Melchior, F. Concepts in sumoylation: A decade on. Nat. Rev. Mol. Cell Biol. 2007, 8, 947–956. [Google Scholar] [CrossRef]
- Hochachka, P.W.; Buck, L.T.; Dollt, C.J.; Landt, S.C. Unifying theory of hypoxia tolerance: Molecular/metabolic defense and rescue mechanisms for surviving oxygen lack (oxygen sensing/hypoxia defense/turtle hepatocytes/turtle brain). Biochemistry 1996, 93, 9493–9498. [Google Scholar]
- Krivoruchko, A.; Storey, K.B. Forever Young: Mechanisms of Natural Anoxia Tolerance and Potential Links to Longevity. Oxid. Med. Cell. Longev. 2010, 3, 186–198. [Google Scholar] [CrossRef] [PubMed]
- Biggar, K.K.; Storey, K.B. The emerging roles of microRNAs in the molecular responses of metabolic rate depression. J. Mol. Cell Biol. 2011, 3, 167–175. [Google Scholar] [CrossRef] [PubMed] [Green Version]
- Childers, C.L.; Storey, K.B. Post-translational Regulation of Hexokinase Function and Protein Stability in the Aestivating Frog Xenopus laevis. Protein J. 2016, 35, 61–71. [Google Scholar] [CrossRef] [PubMed]
- Green, S.R.; Storey, K.B. Regulation of the α-ketoglutarate dehydrogenasecomplex during hibernation in a small mammal, the Richardson’s ground squirrel (Urocitellus richardsonii). Biochim. Biophys. Acta—Proteins Proteomics 2020, 1868, 140448. [Google Scholar] [CrossRef] [PubMed]
- Smolinski, M.B.; Green, S.R.; Storey, K.B. Glucose-6-phosphate dehydrogenase is posttranslationally regulated in the larvae of the freeze-tolerant gall fly, Eurosta solidaginis, in response to freezing. Arch. Insect Biochem. Physiol. 2019, 102. [Google Scholar] [CrossRef] [PubMed]

| Purification Step | Total Protein (mg) | Total Activity (mU) | Specific Activity (mU/mg) | Fold Purification | % Yield |
|---|---|---|---|---|---|
| Crude | 21.07 | 94.25 | 4.47 | --- | --- |
| PC | 2.87 | 48.75 | 16.97 | 3.80 | 51.72 |
| CM | 0.59 | 23.4 | 39.13 | 8.75 | 24.82 |
| Substrate | Enzyme Parameters | Control | Anoxic |
|---|---|---|---|
| Vmax (U/mg) | 0.34 ± 0.010 | 0.25 ± 0.00 * | |
| FBP(µM) | Km | 26.9 ± 3.0 | 59.8 ± 5.2 * |
| ADP (µM) | I50 | 11.8 ± 0.3 | 8.3 ± 0.6 * |
| AMP (µM) | I50 | 6.1 ± 0.1 | 3.6 ± 0.3 * |
| Alanine (µM) | Ka | 2.85 ± 0.24 | 3.3 ± 0.1 |
| Fold Activation | 2.5 ± 0.08 | 2.9 ± 0.03 * | |
| PEP (µM) | Ka | 0.33 ± 0.09 | 3.3 ± 0.2 * |
| Fold Activation | 2.5 ± 0.05 | 3.0 ± 0.03 * | |
| ATP.Mg (µM) | Ka | 144.5 ± 7.0 | 25.0 ± 0.9 * |
| Fold Activation | 1.9 ± 0.1 | 4.0 ± 0.02 * |
Publisher’s Note: MDPI stays neutral with regard to jurisdictional claims in published maps and institutional affiliations. |
© 2021 by the authors. Licensee MDPI, Basel, Switzerland. This article is an open access article distributed under the terms and conditions of the Creative Commons Attribution (CC BY) license (https://creativecommons.org/licenses/by/4.0/).
Share and Cite
Gupta, A.; Varma, A.; Storey, K.B. New Insights to Regulation of Fructose-1,6-bisphosphatase during Anoxia in Red-Eared Slider, Trachemys scripta elegans. Biomolecules 2021, 11, 1548. https://doi.org/10.3390/biom11101548
Gupta A, Varma A, Storey KB. New Insights to Regulation of Fructose-1,6-bisphosphatase during Anoxia in Red-Eared Slider, Trachemys scripta elegans. Biomolecules. 2021; 11(10):1548. https://doi.org/10.3390/biom11101548
Chicago/Turabian StyleGupta, Aakriti, Anchal Varma, and Kenneth B. Storey. 2021. "New Insights to Regulation of Fructose-1,6-bisphosphatase during Anoxia in Red-Eared Slider, Trachemys scripta elegans" Biomolecules 11, no. 10: 1548. https://doi.org/10.3390/biom11101548