
The Effect of Metformin in Diabetic and Non-Diabetic Rats with Experimentally-Induced Chronic Kidney Disease

 , , , ,
Abstract
1. Introduction
2. Materials and Methods
2.1. Animals
2.2. Induction of Diabetes
2.3. Experimental Design
- Control (CON) group continued to receive the same diet without treatment until the end of the study.
- Adenine (A) group was switched to a powdered diet containing adenine (0.25% w/w in feed given daily).
- Diabetes (STZ) group was induced by injecting the rats i.p. with STZ, as described above.
- Adenine + Diabetes (A + STZ) group was treated with adenine and STZ, as mentioned in the second and third groups.
- Metformin (MF) group was treated daily by oral gavage with metformin (200 mg/kg/day) dissolved in distilled water.
- Adenine + Metformin (A + MF) group was treated with adenine and metformin as mentioned in the second and fifth groups.
- Diabetes + Metformin (STZ + MF) group was treated with STZ and metformin, as mentioned in the third and fifth groups.
- Adenine + Diabetes + Metformin (A + STZ + MF) group was treated with adenine, STZ and metformin, as mentioned in second, third and fifth groups, respectively.
2.4. Drugs, Chemicals, and Biochemical Analysis
2.5. Histopathological Analysis
2.6. Western Blotting
2.7. Statistical Analysis
3. Results
3.1. Physiological Data
3.2. Renal Variables
3.3. Histopathology Results
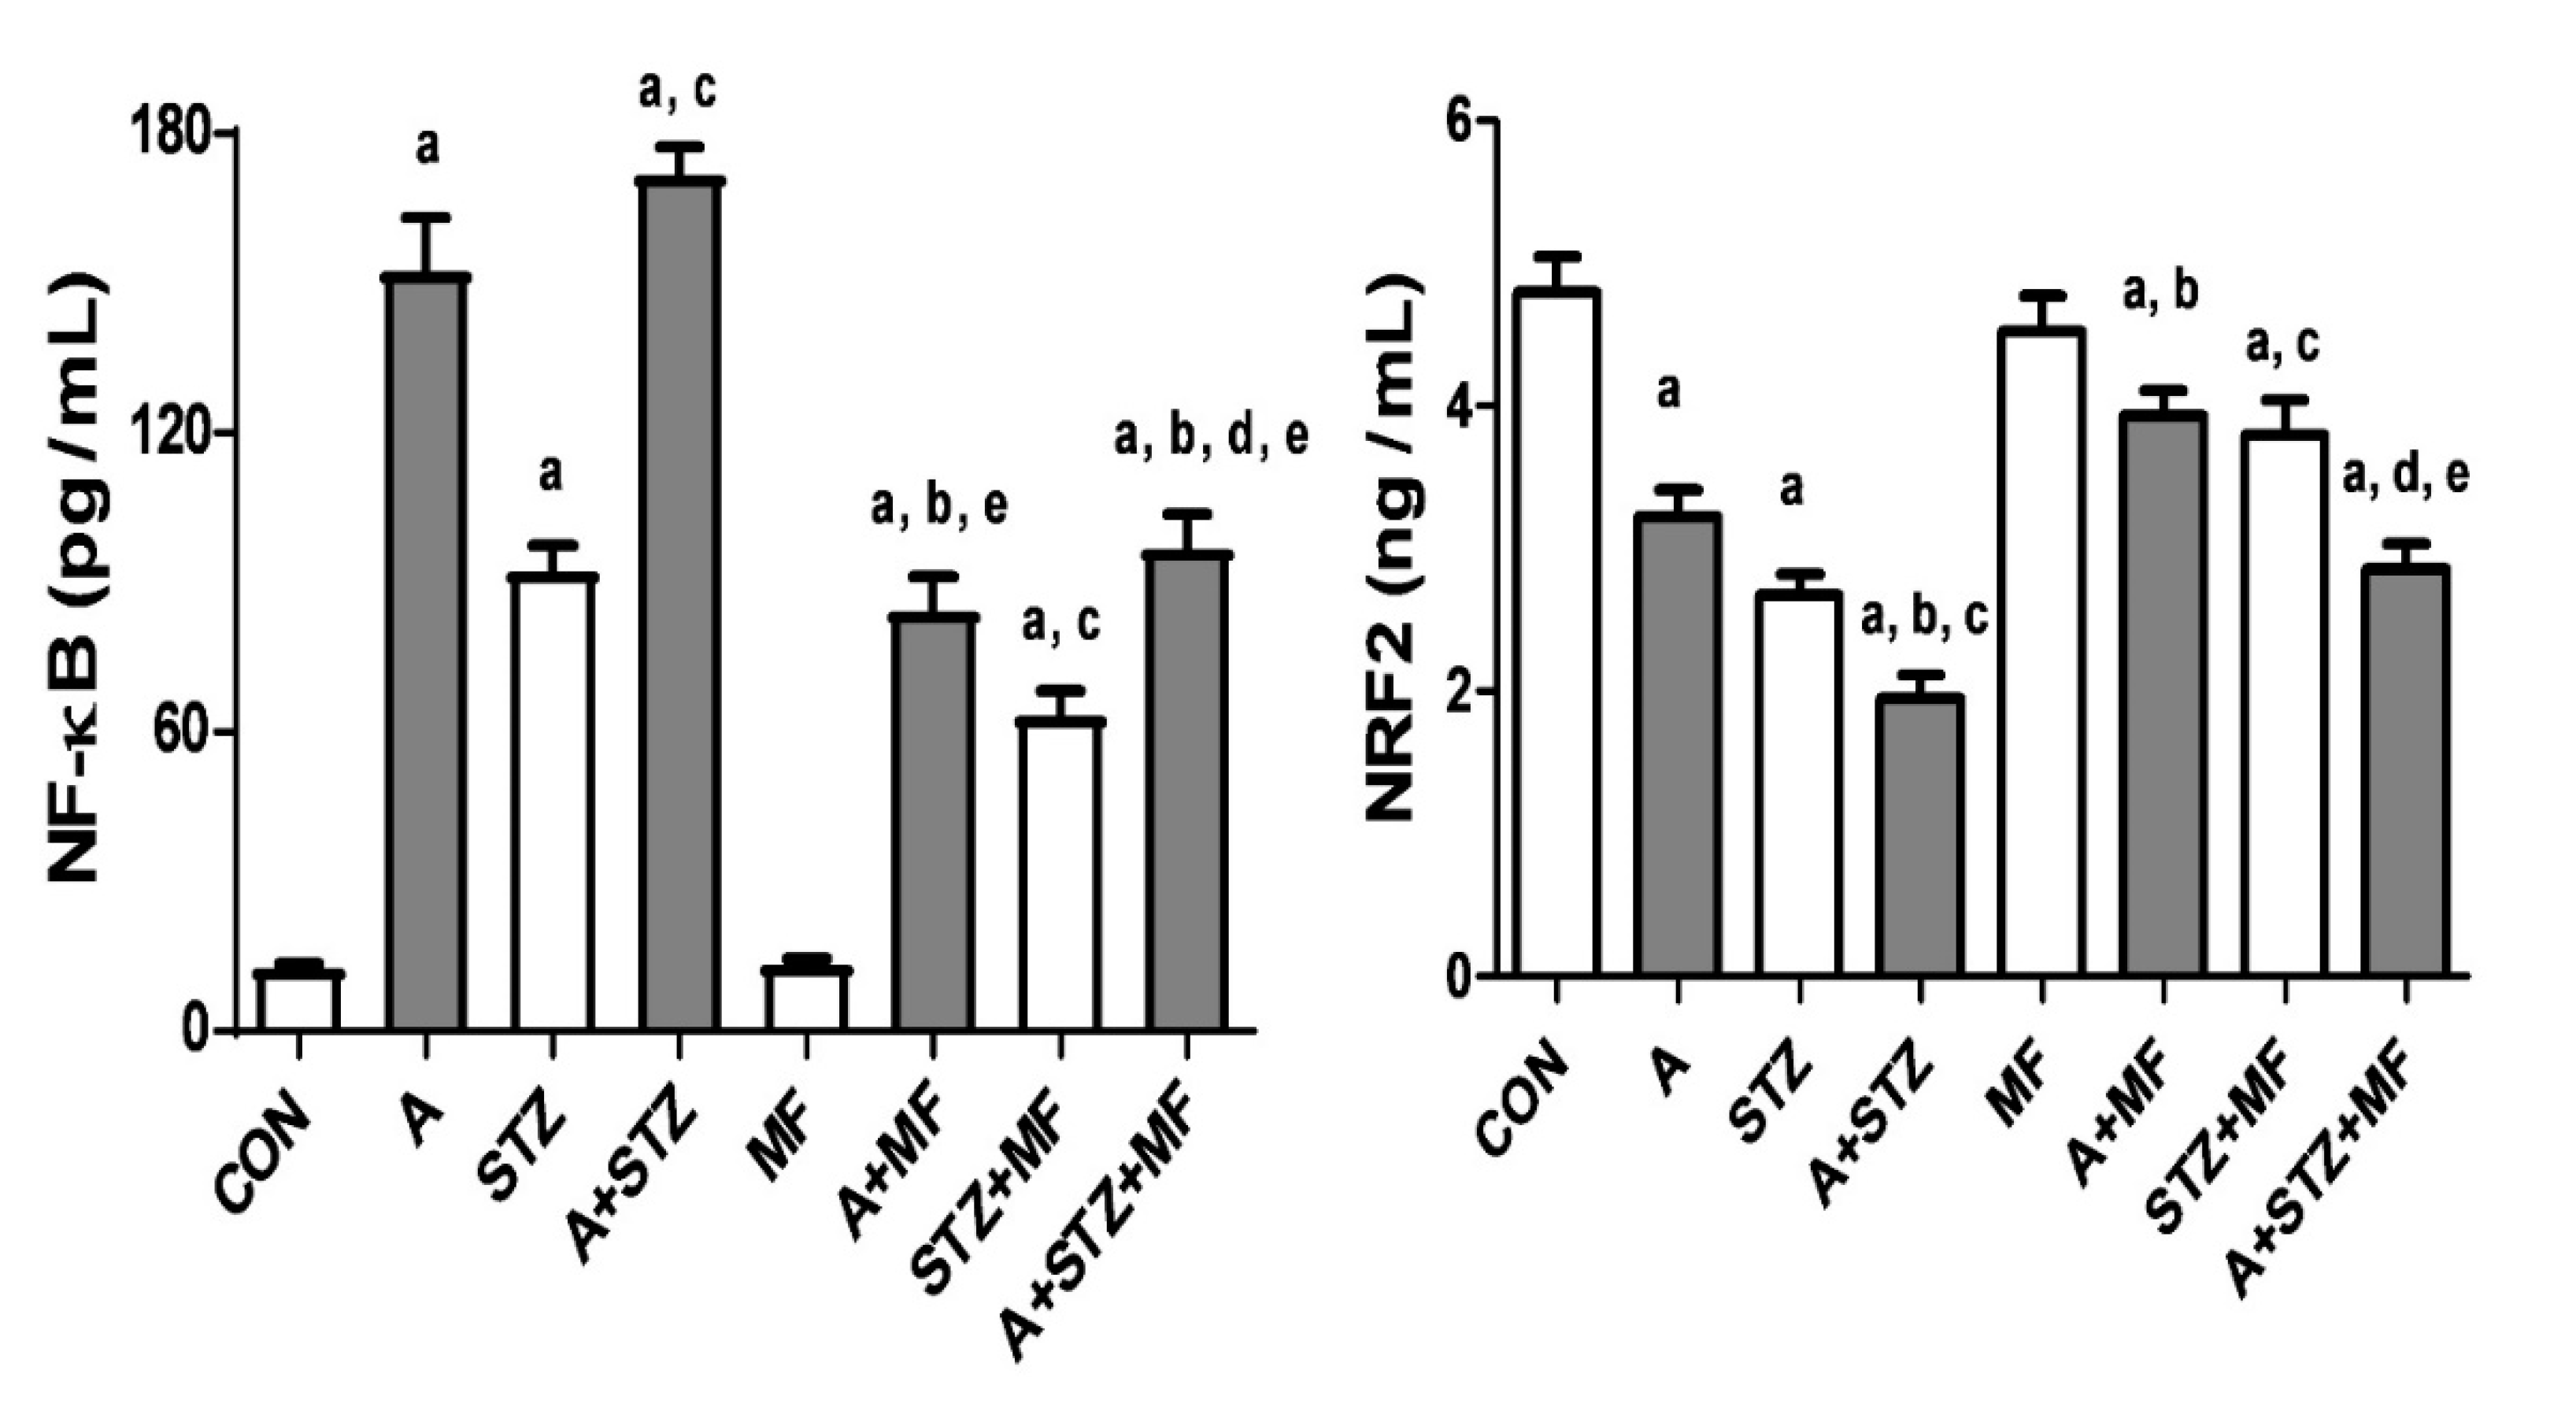
3.4. Western Blotting
4. Discussion
Author Contributions
Funding
Institutional Review Board Statement
Informed Consent Statement
Data Availability Statement
Acknowledgments
Conflicts of Interest
References
- Luyckx, V.A.; Tonelli, M.; Stanifer, J.W. The global burden of kidney disease and the sustainable development goals. Bull. World Health Organ. 2018, 96, 414–422D. [Google Scholar] [CrossRef]
- Foresto, R.D.; Pestana, O.M. Novel treatment options for chronic kidney disease complications. Rev. Assoc. Med. Bras. 2020, 66 (Suppl. 1), s68–s74. [Google Scholar] [CrossRef]
- Tantisattamo, E.; Kalantar-Zadeh, K. Novel therapeutic approaches in chronic kidney disease and uremia management. Curr. Opin. Nephrol. Hypertens. 2020, 29, 1–3. [Google Scholar] [CrossRef]
- Tantisattamo, E.; Kalantar-Zadeh, K. Novel therapeutic approaches in chronic kidney disease, uremia, and kidney transplantation: Past, present and future. Curr. Opin. Nephrol. Hypertens. 2021, 30, 1–4. [Google Scholar] [CrossRef]
- Ali, B.H.; Al-Salam, S.; Al Za’Abi, M.; Waly, M.I.; Ramkumar, A.; Beegam, S.; Al-Lawati, I.; Adham, S.A.; Nemmar, A. New model for adenine-induced chronic renal failure in mice, and the effect of gum acacia treatment thereon: Comparison with rats. J. Pharmacol. Toxicol. Methods 2013, 68, 384–393. [Google Scholar] [CrossRef] [PubMed]
- Diwan, V.; Brown, L.; Gobe, G.C. Adenine-induced chronic kidney disease in rats. Nephrology 2018, 23, 5–11. [Google Scholar] [CrossRef]
- Yokozawa, T.; Zheng, P.D.; Oura, H.; Koizumi, F. Animal model of adenine-induced chronic renal failure in rats. Nephron 1986, 44, 230–234. [Google Scholar] [CrossRef] [PubMed]
- Ali, B.H.; Al-Husseni, I.; Beegam, S.; Al-Shukaili, A.; Nemmar, A.; Schierling, S.; Queisser, N.; Schupp, N. Effect of gum arabic on oxidative stress and inflammation in adenine-induced chronic renal failure in rats. PLoS ONE 2013, 8, e55242. [Google Scholar] [CrossRef]
- Ali, B.H.; Inuwa, I.; Al Za’Abi, M.; Al Bahlani, S.; Al Issaei, H.; Ramkumar, A.; Madanagopal, T.; Nemmar, A.; Malheiros, D.M.; Zatz, R. Renal and myocardial histopathology and morphometry in rats with adenine-induced chronic renal failure: Influence of gum acacia. Cell. Physiol. Biochem. 2014, 34, 818–828. [Google Scholar] [CrossRef] [PubMed]
- Lakshmanan, A.P.; Al Za’Abi, M.; Ali, B.H.; Terranegra, A. The influence of the prebiotic gum acacia on the intestinal microbiome composition in rats with experimental chronic kidney disease. Biomed. Pharmacother. 2021, 133, 110992. [Google Scholar] [CrossRef] [PubMed]
- Ali, B.H.; Al Salam, S.; Al Suleimani, Y.; Al Za’Abi, M.; Abdelrahman, A.M.; Ashique, M.; Manoj, P.; Adham, S.A.; Hartmann, C.; Schupp, N.; et al. Effects of the SGLT-2 inhibitor canagliflozin on adenine-induced chronic kidney disease in rats. Cell. Physiol. Biochem. 2019, 52, 27–39. [Google Scholar] [CrossRef]
- Hu, Y.; Lei, M.; Ke, G.; Huang, X.; Peng, X.; Zhong, L.; Fu, P. Metformin use and risk of all-cause mortality and cardiovascular events in patients with chronic kidney disease—a systematic review and meta-analysis. Front. Endocrinol. 2020, 11, 559446. [Google Scholar] [CrossRef] [PubMed]
- Al Za’abi, M.; Al Salam, S.; Al Suleimani, Y.; Manoj, P.; Nemmar, A.; Ali, B.H. Gum acacia improves renal function and ameliorates systemic inflammation, oxidative and nitrosative stress in STZ-induced diabetes in rats with adenine-induced chronic kidney disease. Cell Physiol. Biochem. 2018, 45, 2293–2304. [Google Scholar] [CrossRef] [PubMed]
- Winocour, P.H. Diabetes and chronic kidney disease: An increasingly common multi-morbid disease in need of a paradigm shift in care. Diabet. Med. 2018, 35, 300–305. [Google Scholar] [CrossRef]
- Gökçay Canpolat, A.; Şahin, M. Glucose lowering treatment modalities of type 2 diabetes mellitus. Adv. Exp. Med. Biol. 2021, 1307, 7–27. [Google Scholar]
- Horakova, O.; Kroupova, P.; Bardova, K.; Buresova, J.; Janovska, P.; Kopecky, J.; Rossmeisl, M. Metformin acutely lowers blood glucose levels by inhibition of intestinal glucose transport. Sci. Rep. 2019, 9, 1–11. [Google Scholar] [CrossRef] [PubMed]
- Mostafa, D.K.; Khedr, M.M.; Barakat, M.K.; Abdellatif, A.A.; Elsharkawy, A.M. Autophagy blockade mechanistically links proton pump inhibitors to worsened diabetic nephropathy and aborts the renoprotection of metformin/enalapril. Life Sci. 2021, 265, 118818. [Google Scholar] [CrossRef] [PubMed]
- Satriano, J.; Sharma, K.; Blantz, R.C.; Deng, A. Induction of AMPK activity corrects early pathophysiological alterations in the sub-total nephrectomy model of chronic kidney disease. Am. J. Physiol. Renal Physiol. 2013, 30, F727–F733. [Google Scholar] [CrossRef] [PubMed]
- De Broe, M.E.; Jouret, F. Does metformin do more benefit or harm in chronic kidney disease patients? Kidney Int. 2020, 98, 1098–1101. [Google Scholar] [CrossRef]
- Jones, V.C.; Dietze, E.C.; Jovanovic-Talisman, T.; McCune, J.S.; Seewaldt, V.L. Metformin and chemoprevention: Potential for heart-healthy targeting of biologically aggressive breast cancer. Front. Public Health 2020, 8, 509714. [Google Scholar] [CrossRef]
- Hassanabad, A.F.; MacQueen, K.T. Molecular mechanisms underlining the role of metformin as a therapeutic agent in lung cancer. Cell. Oncol. 2021, 44, 1–18. [Google Scholar] [CrossRef]
- Chang, J.-E.; Choi, M.S. A Molecular perspective on the potential benefits of metformin for the treatment of inflammatory skin disorders. Int. J. Mol. Sci. 2020, 21, 8960. [Google Scholar] [CrossRef]
- Demaré, S.; Kothari, A.; Calcutt, N.A.; Fernyhough, P. Metformin as a potential therapeutic for neurological disease: Mobilizing AMPK to repair the nervous system. Expert Rev. Neurother. 2021, 21, 45–63. [Google Scholar] [CrossRef]
- Borges, C.M.; Fujihara, C.K.; Malheiros, D.M.A.C.; de Ávila, V.F.; Formigari, G.P.; de Faria, J.B.L. Metformin arrests the progression of established kidney disease in the subtotal nephrectomy model of chronic kidney disease. Am. J. Physiol. Physiol. 2020, 318, F1229–F1236. [Google Scholar] [CrossRef] [PubMed]
- Manni, M.L.; Czajka, C.A.; Oury, T.D.; Gilbert, T.W. Extracellular matrix powder protects against bleomycin-induced pulmonary fibrosis. Tissue Eng. Part A 2011, 17, 2795–2804. [Google Scholar] [CrossRef]
- Lopez-De, L.; Rojkind, M. A simple micro method for collagen and total protein determination in formalin-fixed paraf-fin-embedded sections. J. Histochem. Cytochem. 1985, 33, 737–743. [Google Scholar] [CrossRef] [PubMed]
- Gascon-Barre, M.; Huet, P.M.; Belgiorno, J.; Plourde, V.; Coulombe, P.A. Estimation of collagen content of liver specimens. Varia-tion among animals and among hepatic lobes in cirrhotic rats. J. Histochem. Cytochem. 1989, 37, 377–381. [Google Scholar] [CrossRef]
- Alvarado-Kristensson, M.; Andersson, T. Protein phosphatase 2A regulates apoptosis in neutrophils by dephosphorylating both p38 MAPK and its substrate caspase 3. J. Biol. Chem. 2005, 280, 6238–6244. [Google Scholar] [CrossRef] [PubMed]
- Bando, K.; Ochiai, S.; Kunimatsu, T.; Deguchi, J.; Kimura, J.; Funabashi, H.; Seki, T. Comparison of potential risks of lactic acidosis induction by biguanides in rats. Regul. Toxicol. Pharmacol. 2010, 58, 155–160. [Google Scholar] [CrossRef]
- Quaile, M.P.; Melich, D.H.; Jordan, H.L.; Nold, J.B.; Chism, J.P.; Polli, J.W.; Smith, G.A.; Rhodes, M.C. Toxicity and toxicokinetics of metformin in rats. Toxicol. Appl. Pharmacol. 2010, 243, 340–347. [Google Scholar] [CrossRef]
- Lu, W.R.; Defilippi, J.; Braun, A. Unleash metformin. Ann. Pharmacother. 2013, 47, 1488–1497. [Google Scholar] [CrossRef] [PubMed]
- Pan, Q.; Xu, Y.; Yang, N.; Gao, X.; Liu, J.; Yang, W.; Wang, G. Comparison of acarbose and metformin on albumin excretion in patients with newly diagnosed type 2 diabetes. Medicine 2016, 95, e3247. [Google Scholar] [CrossRef]
- Fiseha, T.; Tamir, Z. Urinary markers of tubular injury in early diabetic nephropathy. Int. J. Nephrol. 2016, 2016, 1–10. [Google Scholar] [CrossRef]
- Bosomworth, M.P.; Aparicio, S.R.; Hay, A.W. Urine N-acetyl-beta-D-glucosaminidase-a marker of tubular damage? Nephrol. Dial. Transplant. 1999, 14, 620–626. [Google Scholar] [CrossRef]
- Zhang, Q.; Davis, K.J.; Hoffmann, D.; Vaidya, V.S.; Brown, R.P.; Goering, P.L. Urinary biomarkers track the progression of nephropathy in hypertensive and obese rats. Biomarkers. Med. 2014, 8, 85–94. [Google Scholar] [CrossRef]
- Hebert, L.A.; Greene, T.; Levey, A.; Falkenhain, M.E.; Klahr, S. High urine volume and low urine osmolality are risk factors for faster progression of renal disease. Am. J. Kidney Dis. 2003, 41, 962–971. [Google Scholar] [CrossRef]
- Lee, M.J.; Chang, T.I.; Lee, J.; Kim, Y.H.; Oh, K.H.; Lee, S.W.; Kim, S.W.; Park, J.T.; Yoo, T.H.; Kang, S.W.; et al. Urine osmolal-ity and renal outcome in patients with chronic kidney disease. Kidney Blood Press Res. 2019, 44, 1089–1100. [Google Scholar] [CrossRef] [PubMed]
- Efe, O.; Klein, J.D.; LaRocque, L.M.; Ren, H.; Sands, J.M. Metformin improves urine concentration in rodents with nephrogenic diabetes insipidus. JCI Insight 2016, 1, e88409. [Google Scholar] [CrossRef] [PubMed]
- Ling, X.C.; Kuo, K.-L. Oxidative stress in chronic kidney disease. Ren. Replace. Ther. 2018, 4, 53. [Google Scholar] [CrossRef]
- Rapa, S.F.; Di Iorio, B.R.; Campiglia, P.; Heidland, A.; Marzocco, S. Inflammation and oxidative stress in chronic kidney dis-ease-potential therapeutic role of minerals, vitamins and plant-derived metabolites. Int. J. Mol. Sci. 2019, 21, 263. [Google Scholar] [CrossRef]
- Sanz, A.B.; Santamaría, B.; Ruiz-Ortega, M.; Egido, J.; Ortiz, A. Mechanisms of renal apoptosis in health and disease. J. Am. Soc. Nephrol. 2008, 19, 1634–1642. [Google Scholar] [CrossRef] [PubMed]
- Checa, J.; Aran, J.M. Reactive oxygen species: Drivers of physiological and pathological processes. J. Inflamm. Res. 2020, 13, 1057–1073. [Google Scholar] [CrossRef]
- Clark, L.E.; Khan, I. Outcomes in CKD: What we know and what we need to know. Nephron Clin. Pract. 2010, 114, c95–c103. [Google Scholar] [CrossRef] [PubMed]
- Podkowińska, A.; Formanowicz, D. Chronic kidney disease as oxidative stress- and inflammatory-mediated cardiovascular dis-ease. Antioxidants 2020, 9, 752. [Google Scholar] [CrossRef]
- Dehkordi, A.H.; Abbaszadeh, A.; Mir, S.; Hasanvand, A. Metformin and its anti-inflammatory and anti-oxidative effects; new concepts. J. Renal Inj. Prev. 2019, 8, 54–61. [Google Scholar] [CrossRef]
- Ali, B.H.; Al Za’Abi, M.; Adham, S.A.; Al Suleimani, Y.; Karaca, T.; Manoj, P.; Al Kalbani, J.; Yasin, J.; Nemmar, A. The effect of sildenafil on rats with adenine-induced chronic kidney disease. Biomed. Pharmacother. 2018, 108, 391–402. [Google Scholar] [CrossRef]
- Thakur, R.; Sharma, A.; Lingaraju, M.C.; Begum, J.; Kumar, D.; Mathesh, K.; Kumar, P.; Singh, T.U.; Kumar, D. Ameliorative effect of ursolic acid on renal fibrosis in adenine-induced chronic kidney disease in rats. Biomed. Pharmacother. 2021, 101, 972–980. [Google Scholar] [CrossRef]
- Zhao, L.; Zou, Y.; Liu, F. Transforming growth factor-beta1 in diabetic kidney disease. Front. Cell Dev. Biol. 2020, 8, 187. [Google Scholar] [CrossRef]
- Xiao, H.; Zhang, J.; Xu, Z.; Feng, Y.; Zhang, M.; Liu, J.; Chen, R.; Shen, J.; Wu, J.; Lu, Z.; et al. Metformin is a novel suppressor for transforming growth factor (TGF)-β1. Sci Rep. 2016, 6, 28597. [Google Scholar] [CrossRef]
- Hammoud, S.H.; AlZaim, I.; Mougharbil, N.; Koubar, S.; Eid, A.H.; Eid, A.A.; El-Yazbi, A.F. Peri-renal adipose inflammation contributes to renal dysfunction in a non-obese prediabetic rat model: Role of anti-diabetic drugs. Biochem. Pharmacol. 2021, 186, 114491. [Google Scholar] [CrossRef]
- Cavaglieri, R.C.; Day, R.T.; Feliers, D.; Abboud, H.E. Metformin prevents renal interstitial fibrosis in mice with unilateral ureteral obstruction. Mol. Cell. Endocrinol. 2015, 412, 116–122. [Google Scholar] [CrossRef]
- Al-Sawaf, O.; Clarner, T.; Fragoulis, A.; Kan, Y.W.; Pufe, T.; Streetz, K.; Wruck, C.J. Nrf2 in health and disease: Current and future clinical implications. Clin. Sci. 2015, 129, 989–999. [Google Scholar] [CrossRef]
- Rahman, A.; Fazal, F. Blocking NF-κB: An inflammatory issue. Proc. Am. Thorac. Soc. 2021, 8, 497–503. [Google Scholar] [CrossRef]
- Tan, X.; Cao, X.; Zou, J.; Shen, B.; Zhang, X.; Liu, Z.; Lv, W.; Teng, L.J.; Ding, X. Indoxyl sulfate, a valuable biomarker in chronic kidney disease and dialysis. Hemodial. Int. 2017, 21, 161–167. [Google Scholar] [CrossRef]
- Graille, M.; Wild, P.; Sauvain, J.-J.; Hemmendinger, M.; Canu, I.G.; Hopf, N.B. Urinary 8-OHdG as a biomarker for oxidative stress: A systematic literature review and meta-analysis. Int. J. Mol. Sci. 2020, 21, 3743. [Google Scholar] [CrossRef]
- El-Rashid, M.; Nguyen-Ngo, D.; Minhas, N.; Meijles, D.N.; Li, J.; Ghimire, K.; Julovi, S.; Rogers, N.M. Repurposing of metformin and colchicine reveals differential modulation of acute and chronic kidney injury. Sci. Rep. 2020, 10, 21968. [Google Scholar] [CrossRef] [PubMed]
- Hung, S.-C.; Chang, Y.-K.; Liu, J.-S.; Kuo, K.-L.; Chen, Y.-H.; Hsu, C.-C.; Tarng, D.-C. Metformin use and mortality in patients with advanced chronic kidney disease: National, retrospective, observational, cohort study. Lancet Diabetes Endocrinol. 2015, 3, 605–614. [Google Scholar] [CrossRef]
- Ren, Q.; Guo, F.; Tao, S.; Huang, R.; Ma, L.; Fu, P. Flavonoid fisetin alleviates kidney inflammation and apoptosis via inhibiting Src-mediated NF-κB p65 and MAPK signaling pathways in septic AKI mice. Biomed. Pharmacother. 2020, 122, 109772. [Google Scholar] [CrossRef] [PubMed]


| Parameters/Treatments | Control | A | STZ | A + STZ | MF | A + MF | STZ + MF | A+ MF + STZ |
|---|---|---|---|---|---|---|---|---|
| Body weight Change (%) | 14.97 ±0.86 | 0.26 ± 0.91 a | −26.69 ±3.63 a | −27.55 ±3.89 a,b | 2.81 ± 0.92 | 2.78 ±3.02 | −17.47 ± 1.78 a,e | −19.43 ± 5.70 a,b,e |
| Relative kidney weight (%) | 0.57 ± 0.02 | 0.94 ± 0.03 a | 0.98 ± 0.03 a | 1.40 ± 0.07 a,b,c | 0.58 ± 0.03 | 0.60 ± 0.04 b | 0.84 ± 0.02 e | 1.07 ± 0.18 a,e |
| Water intake (mL) | 19.33 ± 1.05 | 51.0 ±1.91 a | 109.17 ± 4.27 a | 132.0 ± 10.80 a,b | 13.33 ± 1.93 | 14.67 ± 1.09 b | 42.17 ± 5.48 a,c,e | 72.33 ± 7.20 a,c,d,e |
| Urine output (mL) | 11.83 ± 0.83 | 40.33 ± 0.76 a | 92.33 ± 2.17 a | 111.0 ± 9.07 a,b | 6.25 ± 0.57 | 9.08 ± 0.58 b | 29.67 ±4.36 a,c,e | 35.83 ± 5.79 a,c,d,e |
| Parameters/Treatments | Control | A | STZ | A + STZ | MF | A + MF | STZ + MF | A+ STZ + MF |
|---|---|---|---|---|---|---|---|---|
| Urea (mmol/L) | 3.0 ± 0.61 | 18.0 ± 1.57 a | 14.1 ± 1.56 a | 24.2 ± 3.32 a | 1.1 ± 0.18 | 5.8 ± 1.38 b | 5.4 ± 1.26 c | 7.8 ± 1.54 b–e |
| Creatinine(μmol/L) | 20.5 ± 1.6 | 58.2 ± 5.1 a | 50.3 ± 8.8 a | 61.9 ± 5.4 a | 11.7 ± 2.5 | 37.3 ± 6.3 b,d,e | 32.5 ± 5.4 d,e | 38.2 ± 4.5 b,d,e |
| Uric acid (μmol/L) | 20.8 ± 1.2 | 52.4 ± 6.9 a | 35.4 ± 1.7 a | 52.9 ± 3.3 a,c | 26.4 ± 4.2 a | 23.3 ± 2.8 b | 19.8 ± 2.4 c | 23.9 ± 3.0 b–,d |
| Phosphorus (mmol/L) | 0.54 ± 0.08 | 1.52 ± 0.19 a | 0.97 ± 0.28 | 1.42 ± 0.18 a | 0.66 ± 0.07 | 0.71 ± 0.12 b | 0.70 ± 0.10 | 0.80 ± 0.05 b,d |
| Calcium (mmol/L) | 0.80 ± 0.08 | 0.37 ± 0.11 a | 0.54 ± 0.04 a | 0.47 ± 0.10 a | 0.81 ± 0.06 a | 0.53 ± 0.05 a,e | 0.64 ± 0.05 | 0.57 ± 0.06 |
| IS (μmol) | 4.2 ± 0.30 | 34.8 ± 1.68 a | 19.6 ± 1.20 a | 39.2 ± 1.81 a,c | 4.1 ± 0.24 a | 22.4 ± 1.09 a,b | 14.4 ± 0.94 a,c | 31.9 ± 2.40 a,d,e |
| Adiponectin (µg/mL) | 3.39 ± 0.14 | 8.91 ± 0.86 a | 6.56 ± 0.22 a | 9.11 ± 0.80 a,c | 2.56 ± 0.42 | 4.44 ± 0.41 b | 4.49 ± 0.26 | 5.51 ± 0.61 b,d,e |
| Cystatin C (ng/mL) | 9.63 ± 1.66 | 25.0 ± 2.45 a | 14.2 ± 1.43 | 24.3 ± 2.11 a,c | 7.01 ± 0.73 | 12.0 ± 2.12 b,e | 7.39 ± 1.03 | 11.4 ± 2.14 b,d |
| NGAL (ng/mL) | 27.9 ± 2.17 | 80.1 ± 7.61 a | 44.8 ± 2.76 a | 74.3 ± 3.92 a,c | 23.3 ± 0.95 | 40.7 ± 1.62 b,e | 29.3 ± 3.55 | 36.0 ± 3.12 b,d |
| Parameters/Treatments | Control | A | STZ | A + STZ | MF | A + MF | STZ + MF | A+ MF + STZ |
|---|---|---|---|---|---|---|---|---|
| Creatinine (µmol/L) | 4258.7 ± 80.5 | 908.3 ± 166.7 a | 294.3 ± 28.7 a | 150.7 ± 38.2 a,c | 5326.2 ± 317.6 | 3578.2 ± 269.5 b | 2209.7 ± 660.2 a,c,d | 2390 ± 408.5 a–d |
| Creatinine clearance (mL/min) | 1.77 ± 0.22 | 0.44 ± 0.08 a | 0.5 ± 0.14 a | 0.18 ± 0.03 a | 2.67 ± 0.66 | 0.85 ± 0.30 e | 1.40 ± 0.52 e | 1.56 ± 0.03 a,d,e |
| Albumin/creatinine ratio (mg/µmol) | 0.52 ± 0.03 | 4.2 ± 0.7 a | 3.23 ± 0.32 | 5.97 ± 2.48 a | 0.69 ± 0.05 | 0.74 ± 0.10 b | 1.61 ± 0.47 | 1.30 ± 0.58 b,d,e |
| Osmolality (mOsmol/kg) | 2125.0 ± 74 | 421.0 ± 25 a | 752.3 ± 37 a | 527.8 ± 58 a | 2174.7 ± 91 | 1247.0 ± 110 a,b,e | 1478.0 ± 92 a,c,e | 1254.3 ± 32 a–e |
| NAG activity (nmol/min/mL) | 4.42 ± 0.50 | 22.01 ± 1.99 a | 14.42 ± 0.68 a | 23.74 ± 2.48 a,c | 3.99 ± 0.31 | 8.86 ± 1.03 b,e | 7.74 ± 0.67 c | 10.55 ± 1.25 a,b,d,e |
| Parameters/Treatments | Control | A | STZ | A + STZ | MF | A + MF | STZ + MF | A + STZ+ MF |
|---|---|---|---|---|---|---|---|---|
| IL-1β (pg/mL) | 47.4 ± 1.4 | 158.8 ± 10.5 a | 66.8 ± 2.7 | 174.4 ± 14.4 a,c | 30.6 ± 0.9 | 65.5 ± 4.4 b,e | 49.6 ± 3.3 | 88.7 ± 3.1 a,b,d,e |
| IL-6 (pg/mL) | 49.9 ± 3.9 | 151.9 ± 5.2 a | 110.3 ± 5.8 a | 166.6 ± 8.1 a | 42.1 ± 8.4 | 100.6 ± 10.4 a,b,e | 63.4 ± 5.2 c | 101.9 ± 5.8 a,b,d,e |
| IL-10 (pg/mL) | 630.2 ± 19.3 | 216.8 ± 10.8 a | 360.8 ± 26.9 a | 238.2 ± 16.7 a | 674 ± 26.0 | 444.2 ± 30.4 a,b,e | 495.8 ± 19.8 a,c,e | 399.4 ± 20.2 a–e |
| TGF-β1 (ng/mL) | 32.8 ± 1.0 | 73.4 ± 3.6 a | 51.1 ± 1.6 a | 74.8 ± 3.6 a,b,c | 30.1 ± 1.6 a | 50.3 ± 4.8 a,b,e | 33.7 ± 1.6 c | 53.8 ± 0.8 a,b,d,e |
| Parameters/Treatments | Control | A | STZ | A + STZ | MF | A + MF | STZ + MF | A + MF + STZ |
|---|---|---|---|---|---|---|---|---|
| Renal GR (nmol/min/mL) | 80.0 ± 2.8 | 24.7 ± 1.5 a | 42.7 ± 5.4 a | 38.3 ± 4.9 a | 91.6 ± 3.2 | 57.9 ± 6.4 a,b,e | 63.2 ± 3.6 e | 53.1 ± 2.9 a,b,d,e |
| Renal SOD (% relative activity) | 100 ± 0.0 | 34.8 ± 1.8 a | 42.1 ± 6.5 a | 29.6 ± 2.4 a | 115.6 ± 3.1 | 77.7 ± 5.4 a,b,e | 78.6 ± 3.3 a,c,e | 52.1 ± 3.8 a,b,d,e |
| Renal TAC (nmol/µL) | 0.85 ± 0.06 | 0.30 ± 0.01 a | 0.43 ± 0.02 a | 0.29 ± 0.02 a | 1.10 ± 0.04 a | 0.70 ± 0.06 b,e | 0.79 ± 0.07 c,e | 0.69 ± 0.04 b–e |
| Plasma 8-OHdG (ng/mL) | 0.23 ± 0.02 | 1.06 ± 0.07 a | 2.76 ± 0.18 a | 4.53 ± 0.33 a,b,c | 0.25 ± 0.02 a | 0.59 ± 0.03 | 1.26 ± 0.12 a,c,e | 2.26 ± 0.19 a,b,e |
| Plasma 8-Isoprostane (ng/mL) | 6.5 ± 0.06 | 16.4 ± 0.83 a | 19.4 ± 0.85 a | 21.2 ± 1.30 a,b,c | 6.9 ± 0.07 a | 11.7 ± 0.62 | 13.7 ± 0.81 a,c,e | 16.4 ± 0.47 a,b,e |
| Assessment/Treatment | Acute Tubular Necrosis | Fibrosis Index % | |
|---|---|---|---|
| Percentage (%) | Lesion Score | ||
| Control | 0.00 ± 0.0 | 0 | 5.2 |
| A | 81.1 ± 2.22 a | 4 | 34.3 |
| STZ | 20.6 ± 2.00 a | 2 | 13.4 |
| A + STZ | 78.9 ± 3.30 c | 4 | 33.2 |
| MF | 0.6 ± 0.56 | 0 | 7.2 |
| A + MF | 48.9 ± 1.41 a,b,e | 3 | 26.2 |
| STZ + MF | 7.8 ± 1.11 a,c,e | 1 | 6.8 |
| A + STZ + MF | 0.00 ± 0.0 b,c,d | 0 | 6.3 |
Publisher’s Note: MDPI stays neutral with regard to jurisdictional claims in published maps and institutional affiliations. |
© 2021 by the authors. Licensee MDPI, Basel, Switzerland. This article is an open access article distributed under the terms and conditions of the Creative Commons Attribution (CC BY) license (https://creativecommons.org/licenses/by/4.0/).
Share and Cite
Za’abi, M.A.; Ali, B.H.; Al Suleimani, Y.; Adham, S.A.; Ali, H.; Manoj, P.; Ashique, M.; Nemmar, A. The Effect of Metformin in Diabetic and Non-Diabetic Rats with Experimentally-Induced Chronic Kidney Disease. Biomolecules 2021, 11, 814. https://doi.org/10.3390/biom11060814
Za’abi MA, Ali BH, Al Suleimani Y, Adham SA, Ali H, Manoj P, Ashique M, Nemmar A. The Effect of Metformin in Diabetic and Non-Diabetic Rats with Experimentally-Induced Chronic Kidney Disease. Biomolecules. 2021; 11(6):814. https://doi.org/10.3390/biom11060814
Chicago/Turabian StyleZa’abi, Mohammed Al, Badreldin H. Ali, Yousuf Al Suleimani, Sirin A. Adham, Haytham Ali, Priyadarsini Manoj, Mohammed Ashique, and Abderrahim Nemmar. 2021. "The Effect of Metformin in Diabetic and Non-Diabetic Rats with Experimentally-Induced Chronic Kidney Disease" Biomolecules 11, no. 6: 814. https://doi.org/10.3390/biom11060814
APA StyleZa’abi, M. A., Ali, B. H., Al Suleimani, Y., Adham, S. A., Ali, H., Manoj, P., Ashique, M., & Nemmar, A. (2021). The Effect of Metformin in Diabetic and Non-Diabetic Rats with Experimentally-Induced Chronic Kidney Disease. Biomolecules, 11(6), 814. https://doi.org/10.3390/biom11060814