1. Introduction
Standard cell culture procedures originating in the mid-20th century remain widely used today for investigating cell biology, including toxicity testing, and drug development. However, it has become increasingly clear that media composition, including oxygen, affects many aspects of cell biology, including metabolism and drug efficacy [
1,
2,
3]. Cancer drugs are typically discovered and studied, at least initially, using cell culture models, and the media environment has been shown to affect the outcome of these studies (e.g., [
3,
4]). The most commonly used medium for culturing human cancer cells is Dulbecco’s Modified Eagle Medium (DMEM) [
5]. DMEM has a base nutrient formulation substantially different from human plasma [
6], but can also be formulated with a range of glucose, pyruvate, and L-glutamine concentrations. Specific formulations used are often not reported. The recent formulation of more “physiologic” media, such as Human Plasma-Like Medium (HPLM) [
3] and Plasmax [
4], which are based on the human plasma metabolome [
7], has focused attention on this topic.
Similarly, under standard cell culture conditions, O
2 is unregulated and equilibrates in the CO
2 incubator at 18–19%. This is much higher than the 1–6% O
2 levels that have been measured in mammalian tissues in vivo (see [
8] for a comprehensive review of this topic). Several regulatory systems within human cells directly sense oxygen tensions and consequently influence physiology. Despite that, almost all present knowledge (including the initial characterizations of HPLM and Plasmax) related to the action of various stimuli (e.g., cytokines, growth factors, drugs) on cancer cells (e.g., [
9,
10]) is based on experiments done under non-physiological, near-atmospheric oxygen levels.
Media nutrients and O
2 in culture have broad effects on cancer cell metabolism and these influence experimental outcomes [
3,
4,
11,
12,
13]. For example, culture in HPLM significantly changes the cellular redox state relative to culture of the same cells in RPMI [
3]. Physiological levels of uric acid in HPLM influence pyrimidine synthesis and remarkably reduce the efficacy of 5-fluorouracil (common chemotherapeutic drug) [
3]. Consistent with that, we have shown that the concentration of even one single constituent (e.g., glucose concentration in DMEM) in culture medium significantly affected the effects of two well-characterized anti-cancer molecules: resveratrol and rapamycin on multiple human cancer cell lines (e.g., LNCaP, Huh7) [
5].
Interestingly, in triple negative breast cancer cells (TNBC), pyruvate triggers a pseudohypoxic response even under atmospheric oxygen, leading to stabilization of hypoxia-inducible factor 1α (HIF1α) at the concentrations found in some commercial media (0.5–1 mM). Likewise, the high concentrations of arginine in RPMI reverse the direction of the reaction catalyzed by the urea cycle enzyme, arginosuccinate lyase. In addition, the metabolic profile of TNBC spheroids grown in Plasmax for only four days resembled the metabolic landscape of orthotopic xenografts more closely than those in RPMI [
4]. Collectively, these results demonstrate that physiologic media such as HPLM and Plasmax alter cellular metabolism and the response to specific drugs. However, detailed information on the effects of media on cellular bioenergetics, including mitochondrial form and function, are presently lacking.
Here, we investigated the effects of the Plasmax formulation used by VandeVoorde et al. [
4] vs. DMEM, on cellular energy metabolism and mitochondrial network characteristics. Four well-studied cancer cell lines, MCF7 breast cancer cells, SaOS2 osteosarcoma cells, LNCaP androgen-sensitive human prostate adenocarcinoma cells, and Huh7 human hepatoma cells, were included in the investigation. Cells were cultured for a minimum of two weeks to acclimatize them to one of four different cell culture conditions: (1) the most common condition used for cancer cell culture, i.e., high-glucose DMEM supplemented with 10% FBS and unregulated O
2 (thus ~18%); (2) this same medium but with O
2 regulated at 5%; (3) the Plasmax formulation of VandeVoorde et al. [
4]; (4) this same medium but with O
2 regulated at 5%. Under these four conditions, we evaluated cellular bioenergetics, mitochondrial abundance, and mitochondrial network morphology in all four cell lines. We found that mitochondrial form and function were significantly influenced by cell culture conditions, with both medium formulation and O
2 levels driving different bioenergetic phenotypes. These results indicate the importance of considering culture conditions in studies of energy metabolism and mitochondrial function in vitro.
2. Materials and Methods
2.1. Materials
Dulbecco’s Modified Eagle Medium with glucose (4500 mg/L), L-glutamine, and sodium pyruvate (Cat. #D6429), and supplement-free Dulbecco’s Modified Eagle Medium powdered media (Cat. #5030), Dimethylsufoxide (DMSO), L-glutamine, HEPES ((4-(2- hydroxyethyl)-1 piperazineethane-sulfonic acid), DL-dithiothreitol (DTT), Bradford reagent, and Trypan Blue were obtained from BioShop (Burlington, ON, Canada). FBS (Cat. #F1051), nonessential amino acids (100X) (Cat. #M7145), penicillin/streptomycin solution, and 0.25% trypsin/EDTA solution were obtained from Sigma-Aldrich (St. Louis, MO, USA). Tissue culture dishes (100 × 20 mm and 60 × 15 mm) were obtained from Sarstedt, Inc (Newton, SC, USA). MatTek glass bottom dishes (35 mm) were purchased from MatTek corporation (Ashland, MA, USA). All cell lines were purchased from the American Type Culture Collection (Manassas, VA, USA). Plasmax media constituents are shown in Table S1 of [
4]. α-Aminobutyrate (L-2-Aminobutyric acid; Cat. #438371), L-carnosine (Cat. #535080), and DL-3-Hydroxybutyric acid sodium salt (Cat. #A11613-06) were purchased from CEDARLANE (Burlington, ON, Canada). 2-Hydroxybutyrate (2-Hydroxybutyric acid sodium salt; Cat. #S509425) and Ammonium Metavanadate (Cat. #A634095) were purchased from Toronto Research Chemicals Inc (Toronto, ON, Canada). Agilent Seahorse Calibrant XF (Cat. #100840-000), XFe 96 Extracellular Flux assay kit (Cat. #W17619), and XFe 96 cell culture microplate (Cat. #101085-004) were purchased from Agilent Technologies (Mississauga, ON, Canada). Carbonyl cyanide-4-(trifluoromethoxy) phenylhydrazone (FCCP) (Cat. #C2920), Oligomycin (Cat. #579-13-5), Rotenone (Cat. #83-79-4), sulfite (Na
2SO
3 (Cat. #S0505), and Antimycin A (Cat. #1397-94-0) were purchased from Sigma-Aldrich (St. Louis, MO, USA). Unless otherwise stated, all other chemicals, reagents, and solutions (mainly used to make Plasmax) were purchased from Sigma-Aldrich (St. Louis, MO, USA), BioSHOP (Burlington, ON, Canada), or Fisher Scientific (Mississauga, ON, Canada).
2.2. Cell Culture
To acclimatise the cells to the experimental conditions, all cell lines were cultured in either DMEM supplemented with 10% fetal bovine serum (FBS), 2× MEM nonessential amino acid solution, or penicillin (50 I.U./mL)/streptomycin (50 μg/mL) solution, or in Plasmax media supplemented with 2.5% FBS [
4] and penicillin (50 I.U./mL)/streptomycin (50 μg/mL) solution for two weeks prior to initiation of experiments (a minimum of 3–4 passages). Cells were maintained within a humidified 5% CO
2 atmosphere at 37 °C inside one of two Forma 3110 water-jacketed incubators with O
2 control (ThermoFisher, Waltham, MA, USA). In one incubator, O
2 was not regulated (standard cell culture approach) and thus equilibrated to ~18% O
2 (superphysiologic). In the other incubator, O
2 was regulated at 5% (physiological). All media were conditioned in the corresponding incubator for 24 h prior to use to ensure equilibration with the ambient condition.
2.3. Sample Preparation for Measuring Cellular Respiration at 18% O2
Cellular respiration parameters were measured using a Seahorse Extracellular Flux Analyzer XF96 Mito Stress test (Agilent, Santa Clara, CA, USA). Cells were seeded at a concentration of 15 × 10
3/well (MCF7, SaOS2, Huh7) and 20 × 10
3/well (LNCaP), in a XF96-well microplate 14 h prior to OCR measurements as in [
14] with some modifications. This optimal cell density per cell line was selected following titration assay to determine the optimal cell number. Cells were seeded in an 80 µL final volume of media. Wells on the four corners of the plate were medium-only to serve as background correction wells. When cells are seeded at room temperature and then transferred immediately into a tissue culture incubator (~37 °C), the environmental condition of the edge wells changes more rapidly than the environmental conditions of the interior wells with respect to temperature, humidity, and CO
2 %. Thus, to avoid the effect of edge effect on cell growth, cells were left at room temperature for 60 min prior to transferring them to the incubator. Hydration of a flux analyser sensor cartridge probe plate was done by adding 200 µL milliQ water into each well of the utility plate and putting the cartridge back onto the utility microplate. The utility plate was then placed in a non-CO
2 incubator at 37 °C overnight. At least one hour prior to commencing the assay, 200 μL of the Seahorse Bioscience XF96 Calibrant pH 7.4 solution was added to each well of the utility plate (after removing the milliQ water from the wells). Prior to analysis, the culture media were replaced with either unbuffered (lacking sodium bicarbonate) DMEM pH 7.4 or Plasmax pH 7.4, and cells were then allowed to equilibrate in a non-CO
2 incubator at 37 °C to allow for precise measurement (45 min). One hour prior to measurement, the following compounds were added to the hydrated sensor cartridges: Oligomycin (1.0 μM), FCCP (1.0 μM), and rotenone/antimycin A (0.5 μM). These concentrations were selected following titration experiments (according to Agilent Seahorse XF Cell Mito Stress guideline). Then, the sensor cartridges were loaded into the Seahorse Analyzer. After calibration, the sensor cartridges were replaced with the XF96 microplates and the measurement program was resumed to obtain the following OCR parameters: basal, maximal, spare respiratory capacity, proton leak, and ATP linked. Extracellular acidification rates (ECAR) as measure of glycolysis were also measured [
15]. Wave Desktop 2.6V Software (Agilent) was used for data acquisition and data analysis for assays. The OCR and ECAR values were normalised to the protein concentration per well and were presented as pmol/min/μg protein.
2.4. Sample Preparation for Measuring Cellular Respiration Measurements at 5% O2
For experiments at non-atmospheric O2 conditions, the XF Analyzer was placed within a gas flow controlled Hypoxic Glove chamber (Coy Laboratories, Grass Lake, MI, USA). The atmosphere was CO2-free and O2 levels were set to 5%. During the assay, temperature was controlled within the Seahorse analyser, and the air circulation within the chamber was maintained by a fan. Media and other reagents were pre-equilibrated to the 5% O2 atmosphere 24 h prior to the assay. To avoid reoxygenation, cell culture plates were transported from their incubators to the Hypoxic Glove chamber, where all washes were carried out. In compliance with Agilent Seahorse XF guidelines for experiments under lower-than-atmosphere O2 levels, seeding density was reduced to 12 × 103/well (MCF7), 17 × 103/well (LNCaP), 17 × 103/well (SaOS2), and 12 × 103/well (Huh7). Furthermore, the last column of wells (in addition to background wells) was refilled with XF calibrant solution without any cells to serve as “zero” oxygen reference, as specified by the manufacturer. To scavenge the oxygen, sodium sulfite (Na2SO3) was injected into “zero” wells and XF Hypoxia Rate Calculator Software (V2.6) was used to calculate OCR measurements. The OCR values were normalised to the protein concentration per well and were presented as pmol/min/μg protein.
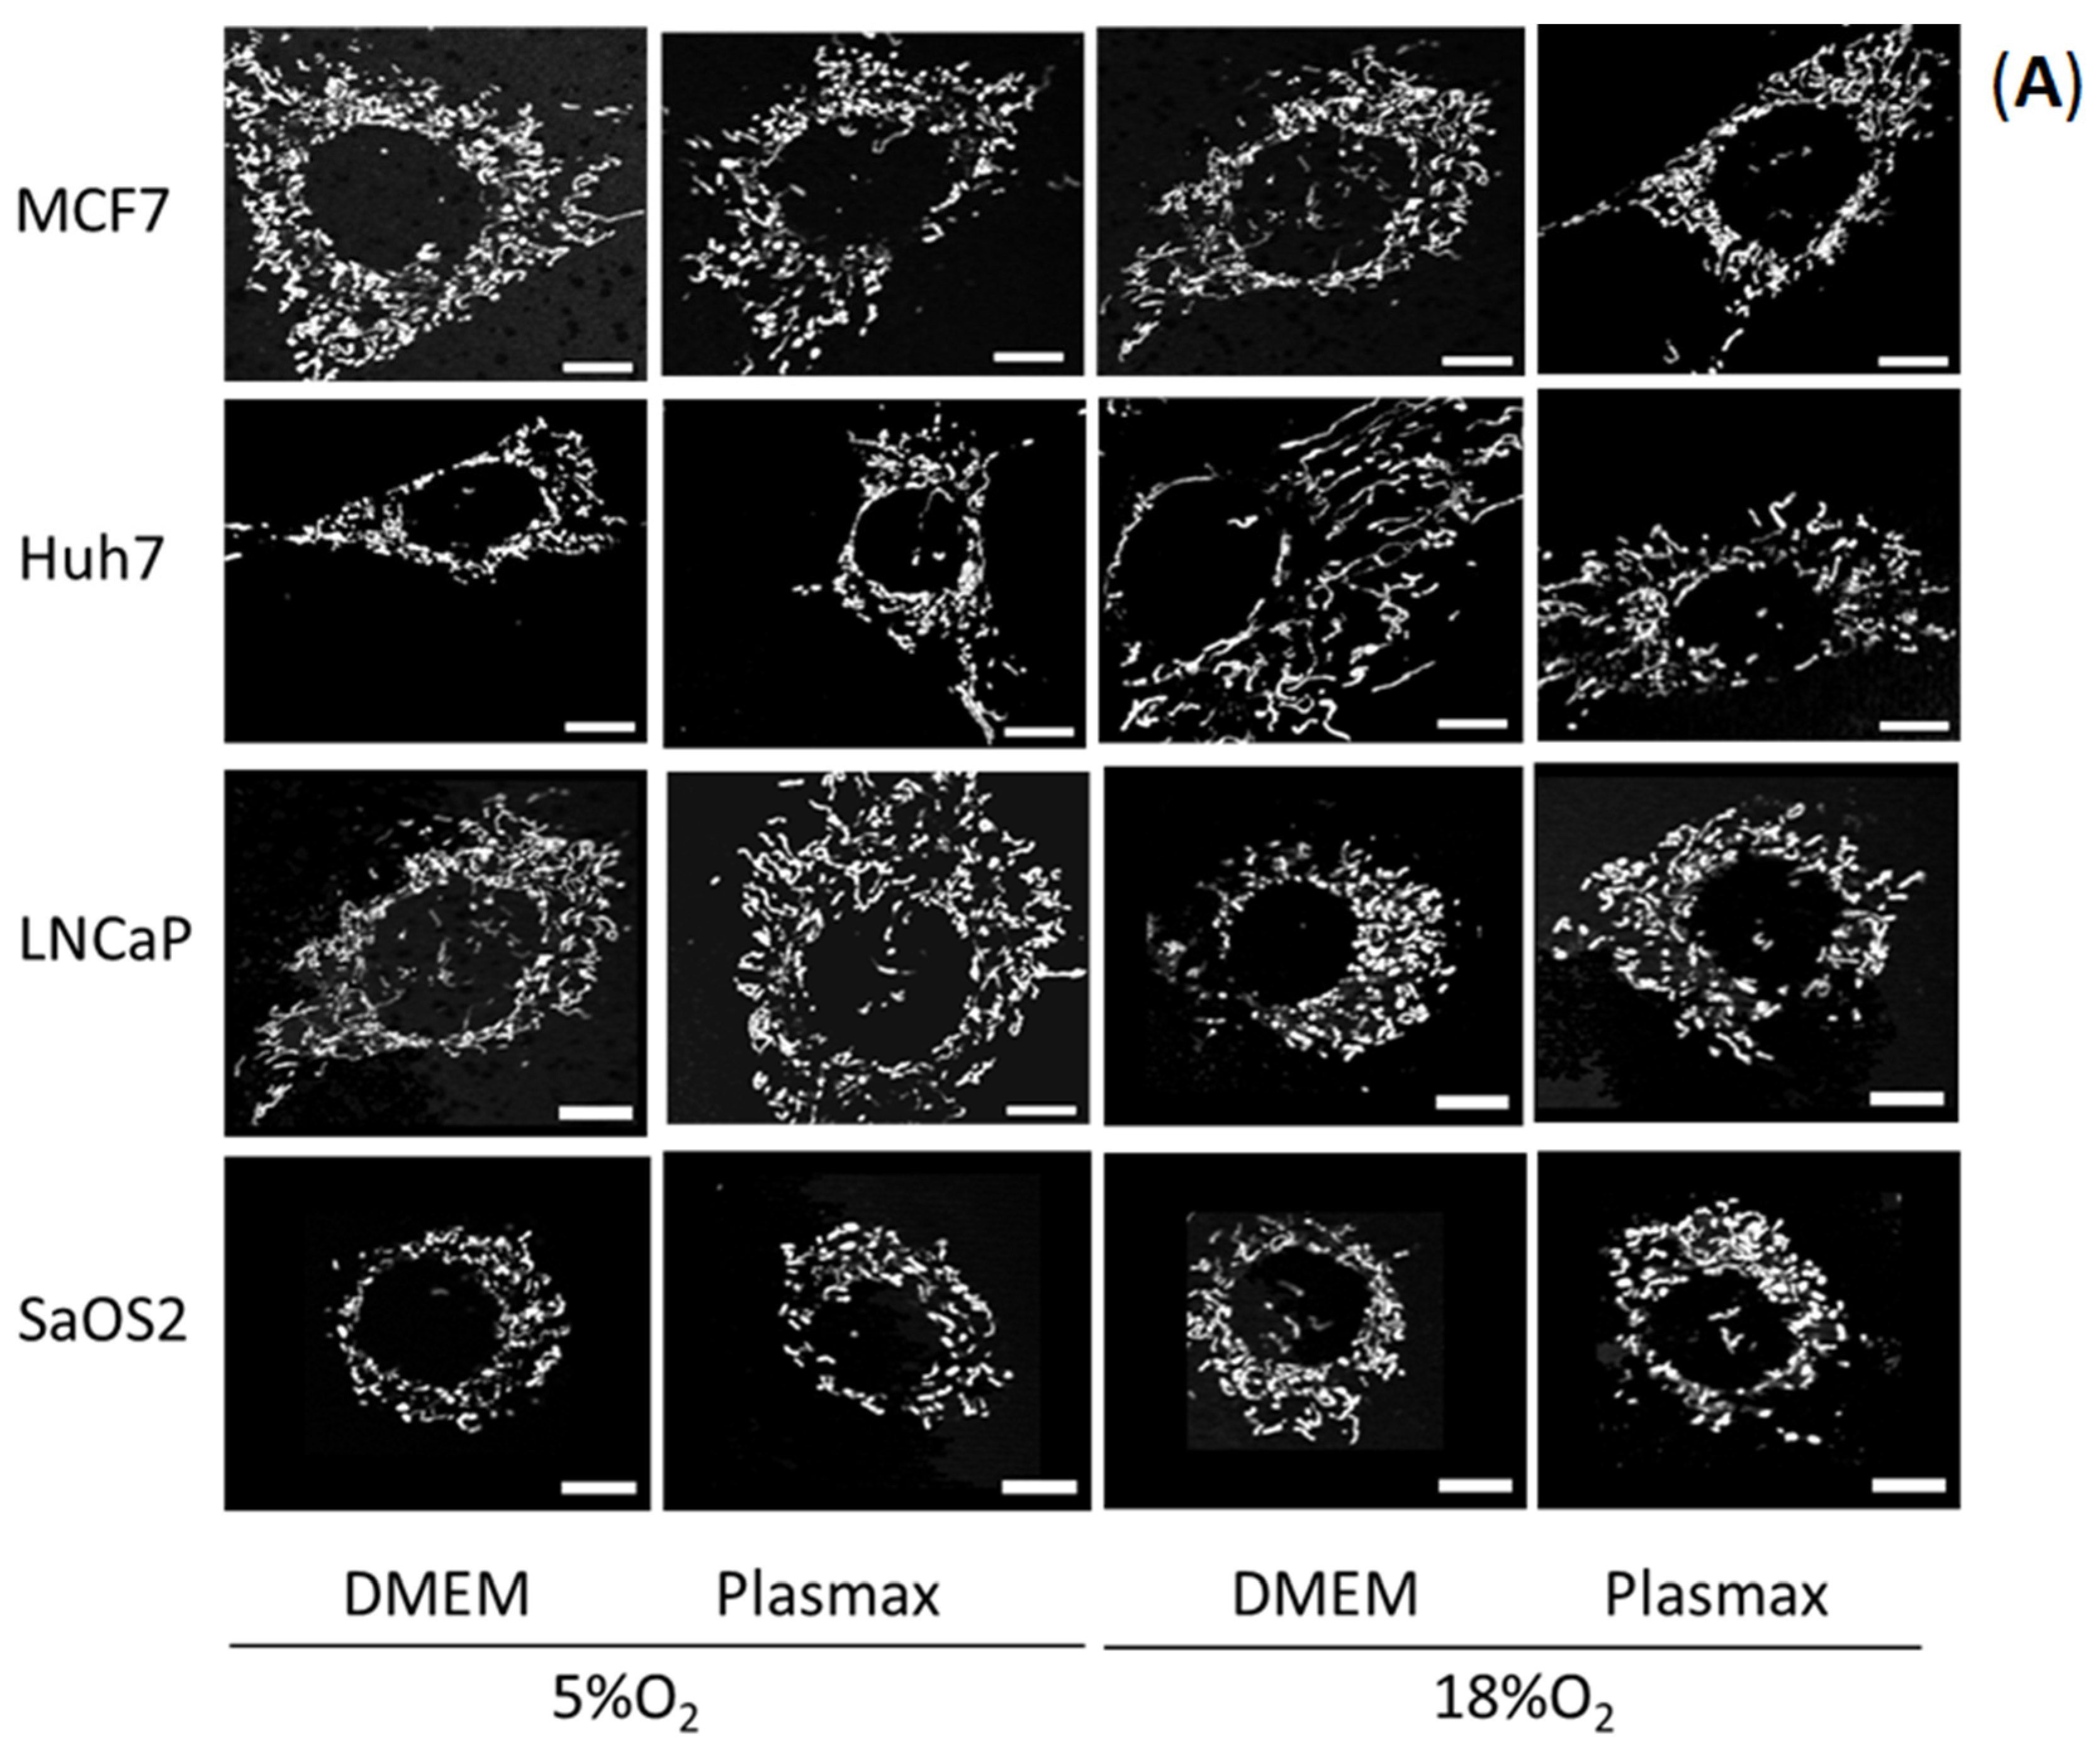
2.5. Fluorescence Microscopy
Fluorescence micrographs of live cells were obtained using a Carl Zeiss Axio Observerl, Z1-inverted light/epifluorescence microscope equipped with ApoTome.2 optical sectioning, and a Hamamatsu ORCA-Flash 4.0 V2 digital camera (sourced through Carl Zeiss Canada, Toronto, Canada). A total of 1 × 10³ cells were cultured on Matek 35mm poly-D-lysine-coated glass bottom culture dishes for 48 h. Cells were switched to phenol red-free DMEM or Plasmax media containing 50 nM MitoTracker Red and maintained at 37 °C in humidified 5% CO2, 18% O2 atmosphere or 5% O2 for 30 min. Then, cells were washed three times with fresh medium to remove the free dye and kept in DMEM or Plasmax for imaging. Images were collected with a Plan-Apochromat 63x/NA1.40 Oil DIC M27 microscope objective. The microscope stage and objective were maintained with temperature control achieved through a TempModule S-controlled stage heater and an objective heater (PeCon, Erbach, Germany) at 37 °C, and a humidified 5% CO2 environment with either 18% or 5% O2 throughout the experiments. During experiments conducted at 5% O2, a humidified 5% O2/5% CO2/90% N2 gas mix was continuously delivered through the TempModule on-stage heater. The MitoTracker Red CMXRos signal was imaged with set excitation and emission wavelengths of 587 nm and 610 nm, respectively. The intensity of fluorescence illumination by an X-Cite 120LED light source and camera exposure times were both held constant across experiments. Z-stack series were rendered into single 2D images using the “extended depth of focus” processing tool in the Zeiss Zen 2 software. (Blue edition V2.1) Z-stacks consisted of 20 slices, each 0.25 µm apart. Maximum intensity projections were generated for each stack using the Fiji distribution of ImageJ.
2.6. Image Analysis
Mitochondrial morphology was analysed and quantified using the Mitochondrial Network Analysis tool (MiNA), a macro tool developed for use with the FIJI distribution of ImageJ [
16]. Cells were selected randomly for each experimental condition, and fluorescence images were loaded into the program in their native format using the Bio-Formats plug-in. To improve contrast between all mitochondrial structures and background, the following pre-processing steps were performed: contrast limited adaptive histogram equalisation (CLAHE), median filtering (a 2-pixel radius), and “unsharp mask”. In the processed image, the fluorescent mitochondrial signal was subjected to thresholding in order to eliminate background signal, which could generate an artifact. A binary image was generated by thresholding, the level of which was determined using Otsu’s algorithm. From the binary, the mitochondrial footprint was calculated from the total area of mitochondrial signal-positive pixels. For the purpose of estimating the lengths of mitochondrial structures and the degree of branching, the Ridge detection plugin was applied [
17,
18]. Ridge detection uses florescence intensity to produce binary images, from the binary iamge morphological skeleton was generated using the Skeletonize3D plugin. The topology is then captured by the AnalyzeSkeleton plug in, the results of which are used by MiNA to generate quantitative parameters. The information extracted from the morphological skeleton is the mean of the branch lengths for each independent feature and the number of branches in each network. Mean branch length is calculated as the average length of a mitochondrial structure between two nodes. Mitochondria appear as interconnected branching networks in which branches are connected at a node. Mean network size was calculated by computing the sum of all branch lengths within an independent network and dividing this by the total number of individual networks within a cell. A total of 35 cells per condition were selected randomly from at least three separate experiments.
2.7. Statistical Analyses
All statistical analyses were performed using GraphPad Prism 5 software (San Diego, CA, USA). One-way ANOVAs were performed for datasets. When statistical significance in datasets was observed from one-way ANOVAs, post-hoc analysis was performed using Tukey’s honestly significant difference (HSD) test. A p-value of <0.05 was considered significant for all statistical tests. All data are presented as means ± standard error of mean (SEM).
4. Discussion
Our results clearly indicate the extent to which the energy metabolism of cancer cell lines is affected by culture conditions. In all four cell lines investigated, ECAR was significantly elevated when cells were growing in standard cell culture conditions, compared to physiologic media and O
2 levels. This appeared to be driven by the culture media since, for any given O
2 concentration, ECAR tended to be greater in DMEM than in Plasmax. Concomitant with this effect, in three of the four cell lines (MCF7, Huh7, LNCaP), basal and maximal OCR were lower in DMEM. Together, these results suggested that energy metabolism was shifted toward dependence on glucose fermentation to lactate in cells growing in DMEM, whereas cells growing in Plasmax had a more oxidative metabolism. Here, we used a formulation of DMEM containing 25 mM glucose, whereas Plasmax contains 5.5 mM glucose. Although most published papers do not report the actual formulation of DMEM used [
5], and therefore not the concentration of glucose, it is likely that DMEM with 25 mM glucose is used commonly to avoid glucose depletion during multi-day cell culture. Although cancer cells are generally characterised by elevated rates of glucose consumption, this can be further promoted when they are grown in hyperglycemic media [
21,
22,
23].
Increasing the reliance of cancer cells on glucose fermentation to lactic acid is problematic, particularly for experiments in which lactate dehydrogenase (LDH) is targeted. RNAi-mediated knockdown of the A-isoform of LDH, which favours pyruvate reduction to lactic acid, has toxic effects on several cancer cell lines (LDH knockdown inhibits in vitro and in vivo growth of various cancer cell lines [
24,
25,
26]. Similar observations have been made in experiments targeting LDHA activity pharmacologically. For example, 1-(Phenylseleno)-4-(Trifuoromethyl) Benzene (PSTMB) inhibits LDHA activity while causing cell death in a range of cancer cell lines [
27]. NCI-006 potently inhibits LDH in vitro and in vivo [
28], and is considered a promising prospective drug for targeting tumour metabolism. Given the significant attention currently focused on metabolic inhibition strategies to combat cancers, it is particularly important to avoid non-physiological cancer cell culture approaches that alter energy metabolism in ways that may artifactually augment vulnerability to LDHA-inhibiting drugs.
It is important to note that, although the use of media modeled after the human blood plasma metabolome represents a step forward in the development of a more in vivo-like cell culture environment, the extracellular environment of many cancer cells in vivo is depleted of many nutrients relative to plasma (reviewed in [
29]). For example, in murine pancreatic cancer tumours, interstitial fluid glucose concentration can be ~50% lower than in plasma [
30]. Thus, arguably an even lower glucose concentration medium should be used in studies of LDH inhibitors, or indeed of any metabolic inhibitor.
It is surprising that, even in studies characterising physiologic media such as Plasmax and HPLM, experiments were performed at non-physiological O
2. Hypoxia-inducible factor-1 (HIF-1) is a well-characterised mediator of aerobic glycolysis, via transcriptional stimulation of genes encoding glucose transporters and glycolytic enzymes (reviewed in [
31]). Although the vast majority of studies examining the O
2-regulated α-subunit (HIF-1α) have compared standard cell culture O
2 (18%) with hypoxia (typically 1%), a more physiologically relevant comparison might be between 5% (physioxia) and 1% (hypoxia). Notably, HIF-1α is present in relatively low amounts in the physiological range from 2–5% O
2 [
32] where effects on transcription of glycolytic enzymes are likely significant. Alternatively, since cellular reactive oxygen species (ROS) production can be influenced by environmental O
2 levels ([
33]; reviewed in [
34]) and concomitantly affects cellular metabolism and other functions, it is important to consider this parameter. Our data indicate that, within a given medium, O
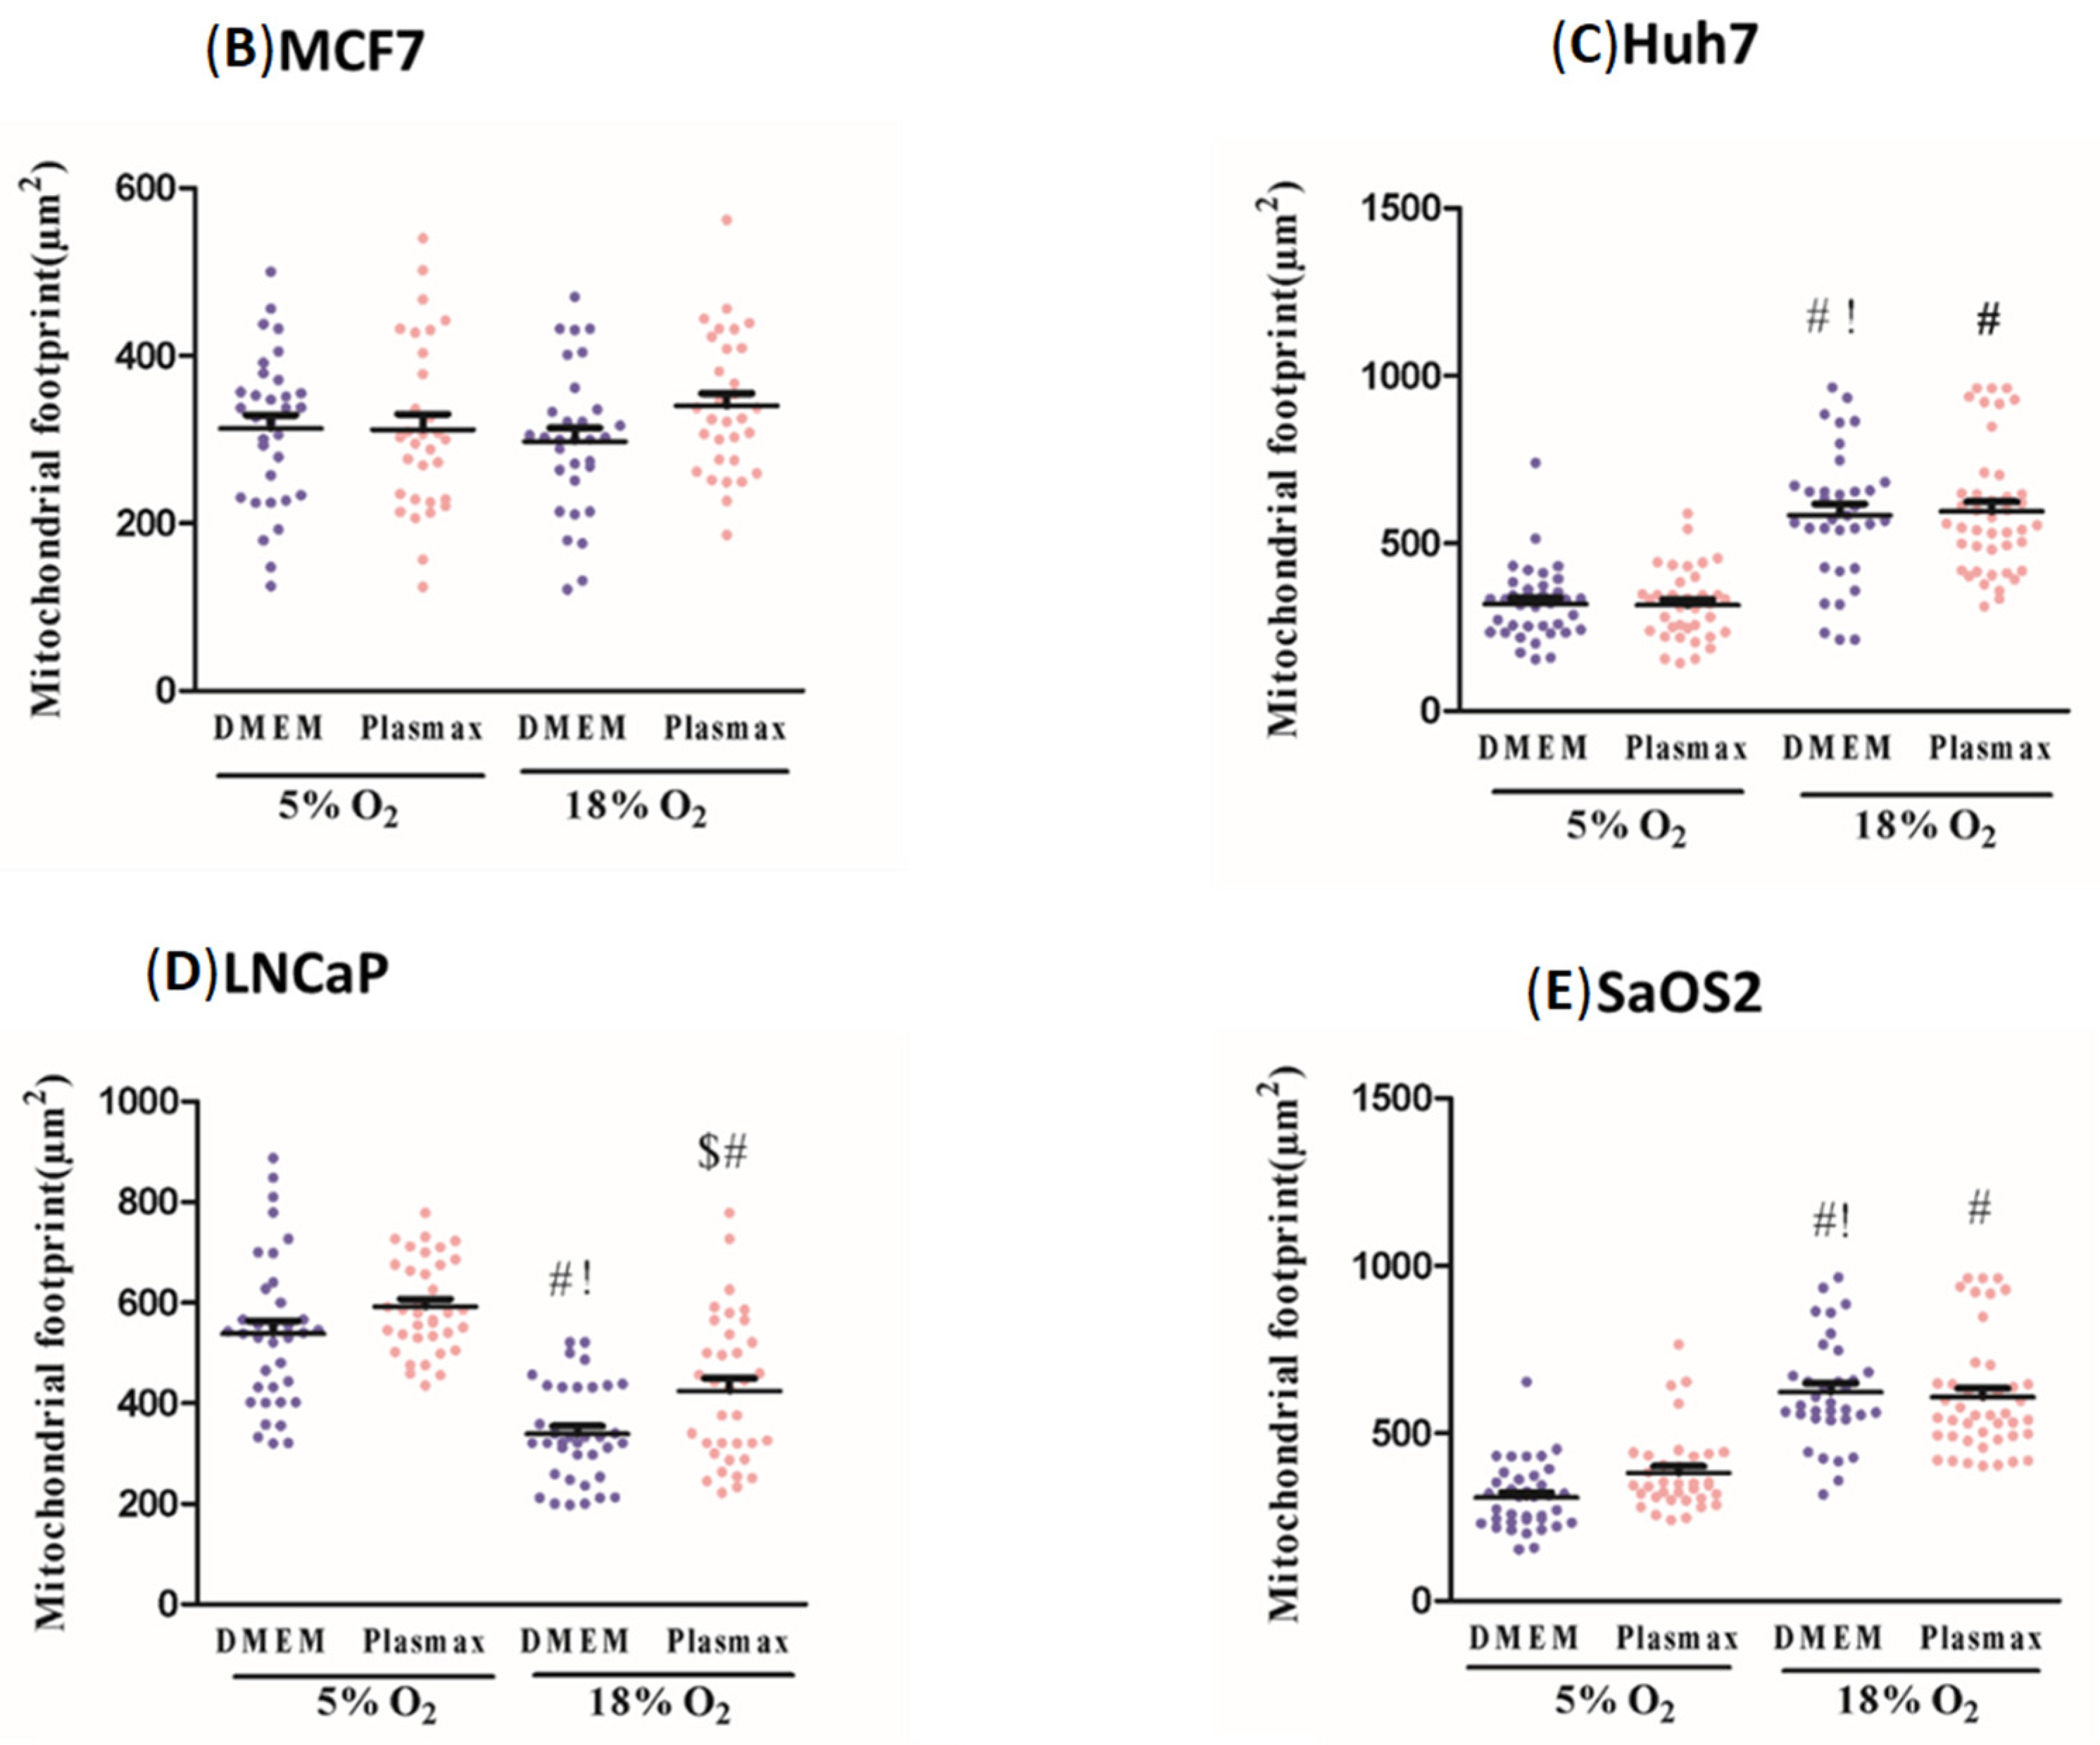
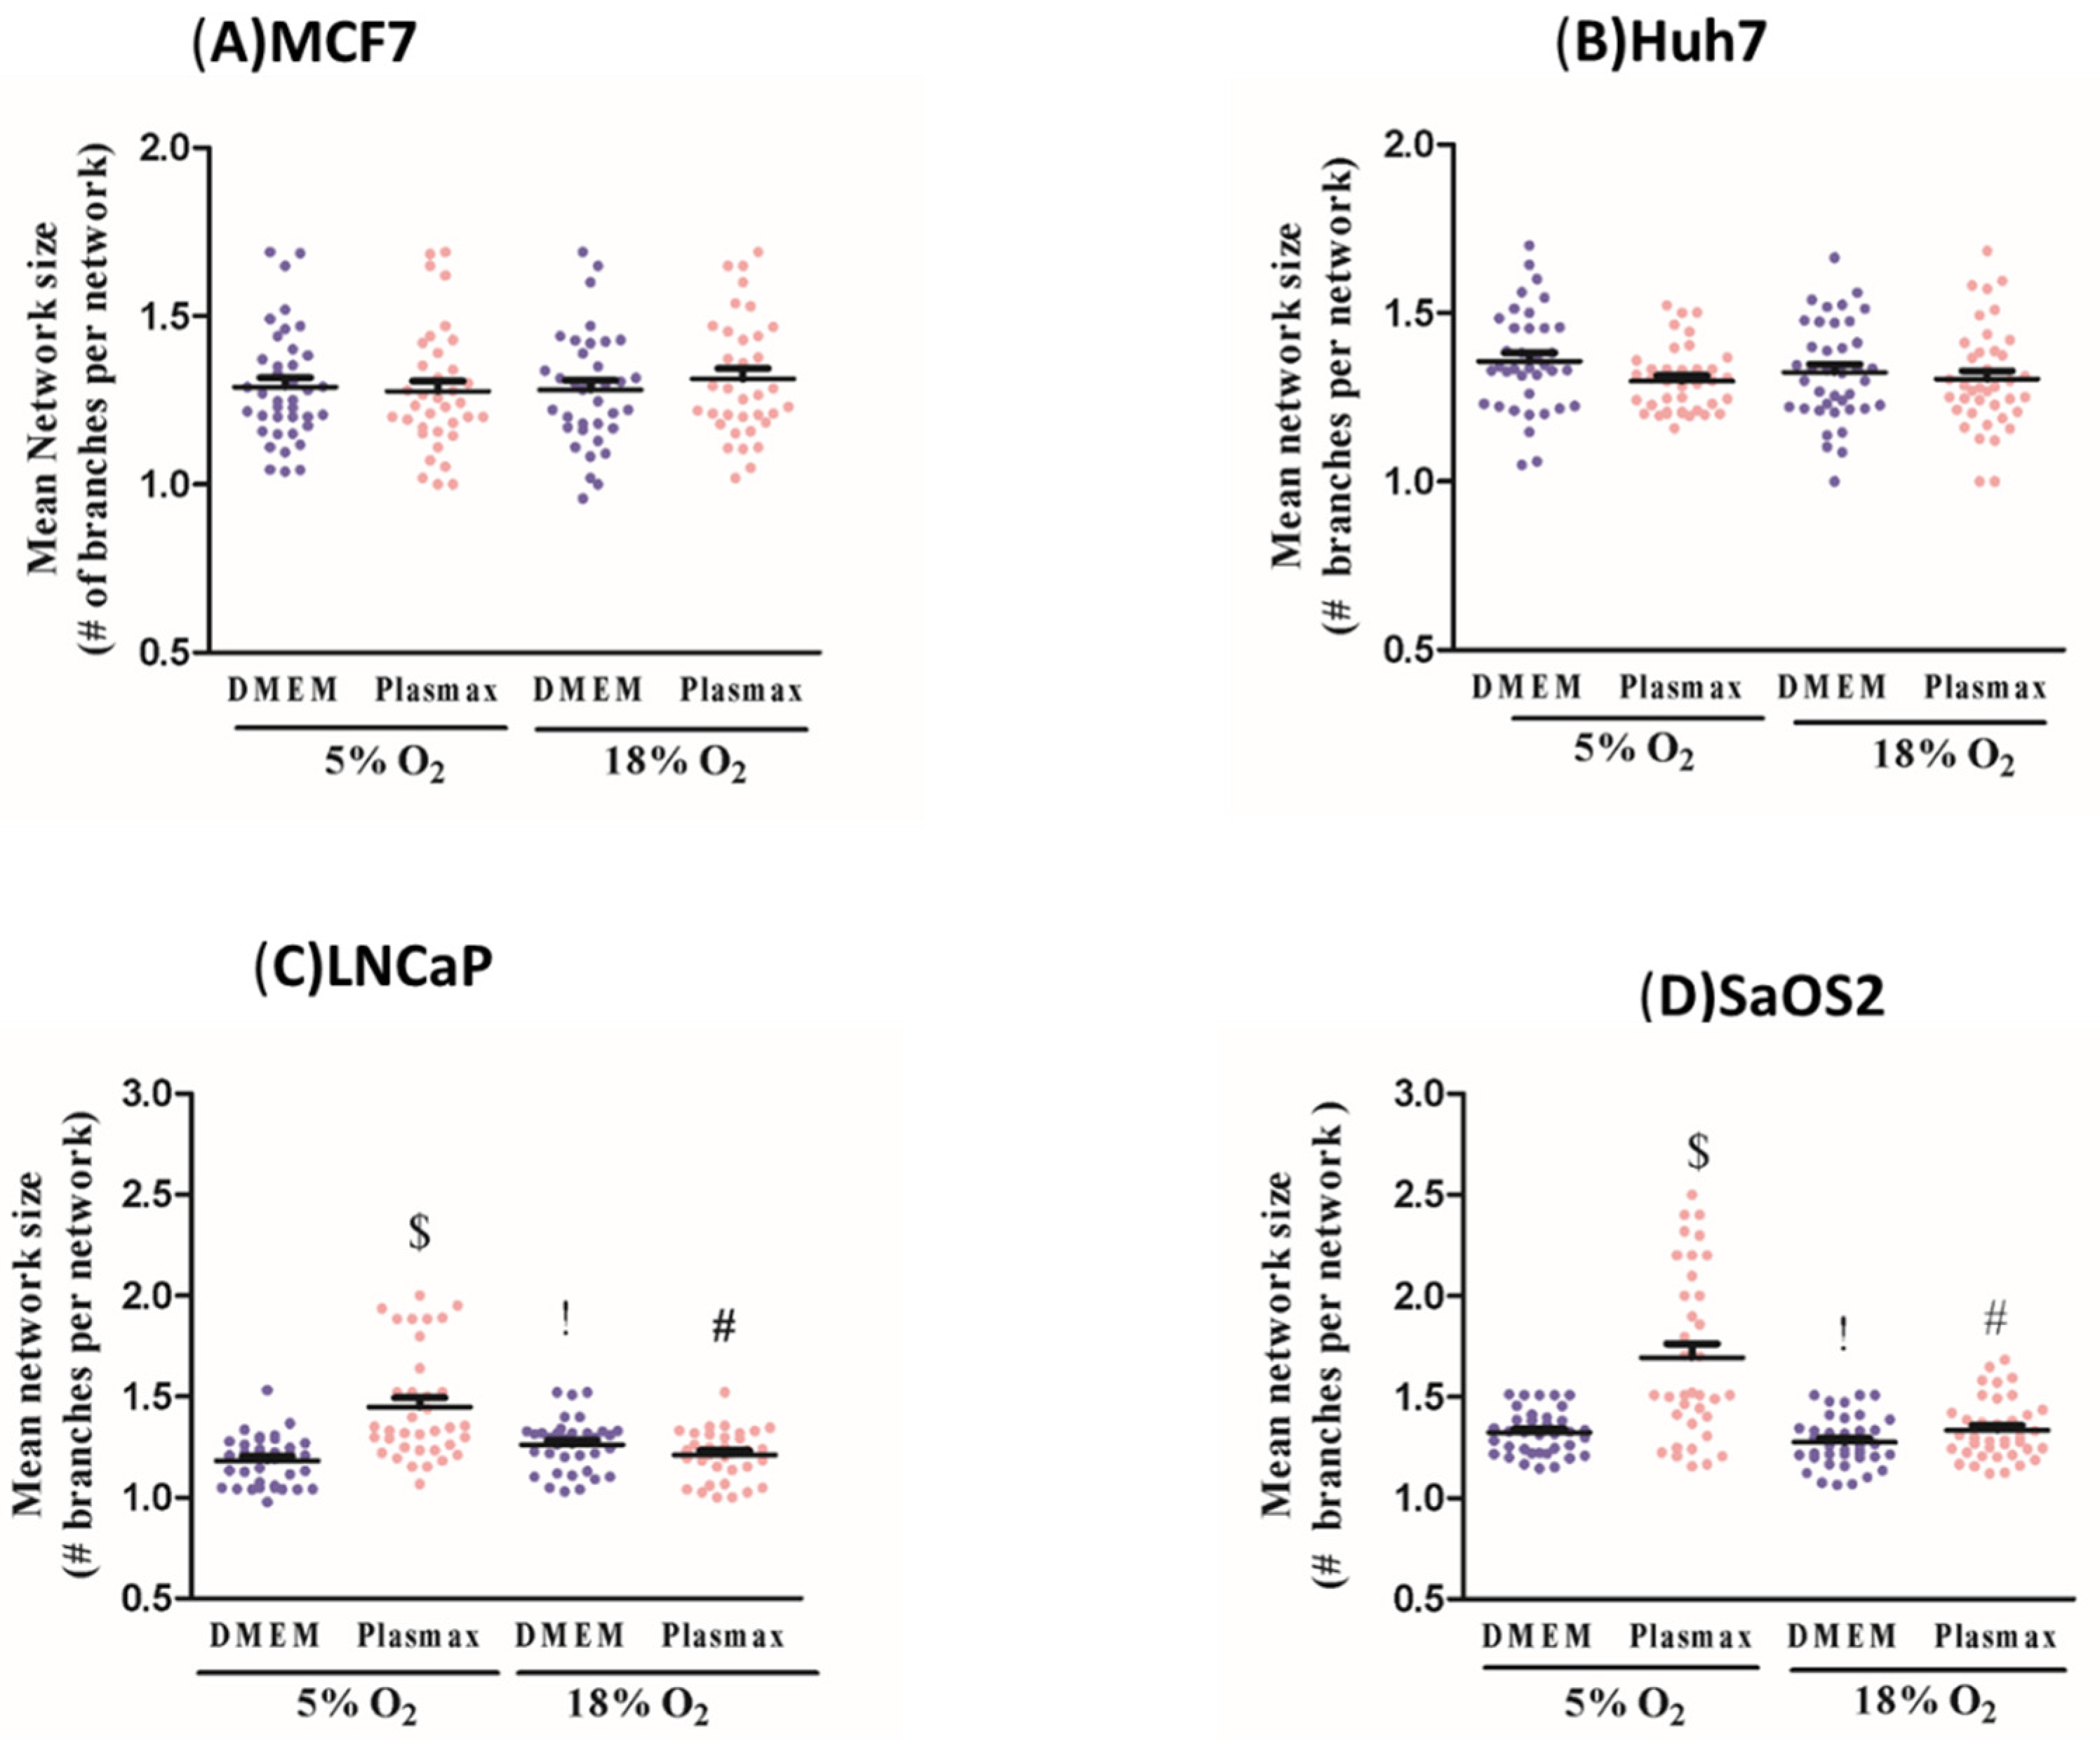
2 levels during cell culture can affect energy metabolism, apparent mitochondrial abundance and, to a lesser extent, mitochondrial network characteristics. Taken together, these effects of environmental O
2 levels on metabolic and mitochondrial characteristics of cancer cells emphasise the importance of this variable in experimental design. As noted above for glucose, although we used 5% O
2, which is typical of many normal human tissues [
8], the O
2 levels in tumours are often lower. Certainly, unregulated O
2 that equilibrates to around 18% is inappropriate for cancer cell culture. Maintaining O
2 at 5% or lower will better mimic the in vivo environment.
In summary, here we have described the metabolic effects of the cell culture environment on several well-studied cancer cell lines. These effects are substantial and may affect experiments aiming to identify or characterize metabolic inhibitors for targeting cancer cells in vivo. Given these observations, it is important to consider maintaining physiologically relevant nutrient concentrations, including O2, in vitro.


