Abstract
Cardiovascular disease is currently the leading cause of death worldwide. Atherosclerosis is an important pathological basis of cardiovascular disease, and its early diagnosis is of great significance. Urine bears no need nor mechanism to be stable, so it accumulates many small changes and is therefore a good source of biomarkers in the early stages of disease. In this study, ApoE-/- mice were fed a high-fat diet for 5 months. Urine samples from the experimental group and control group (C57BL/6 mice fed a normal diet) were collected at seven time points. Proteomic analysis was used for comparison within the experimental group and for comparison between the experimental group and the control group. The results of the comparison within the experimental group showed a significant difference in the urinary proteome before and after a one-week high-fat diet, and several of the differential proteins have been reported to be associated with atherosclerosis and/or as biomarker candidates. The results of the comparison between the experimental group and the control group indicated that the biological processes enriched by the GO analysis of the differential proteins correspond to the progression of atherosclerosis. The differences in chemical modifications of urinary proteins have also been reported to be associated with the disease. This study demonstrates that urinary proteomics has the potential to sensitively monitor changes in the body and provides the possibility of identifying early biomarkers of atherosclerosis.
1. Introduction
Atherosclerosis (AS) is the primary pathological basis of cardiovascular disease (CVD) [1], which is the leading cause of death in the world today [2]. In 2015, more than 17 million people died of cardiovascular disease, accounting for 31% of all deaths worldwide [3]. The impact of atherosclerosis is more significant during its late stages, during which it induces a series of fatal consequences such as myocardial infarction and stroke [4]. Therefore, its early diagnosis is of vital importance.
Urine is an ideal source of early biomarkers because biomarkers are measurable changes related to biological processes regulated by homeostasis mechanisms, and urine can accumulate these early changes [5]. This conclusion has been confirmed by many related studies. For example, in a glioblastoma animal model constructed by injecting tumour cells into the brains of rats, changes in the urine proteome occurred before magnetic resonance imaging reflected the changes caused by the tumour [6]. Similarly, studies have confirmed that even if only approximately 10 cells are subcutaneously inoculated in rats, the urinary proteome can change significantly [7]. In addition, urine is more accessible and non-invasive to obtain [8].
The use of animal models avoids the influence of genetic, environmental and other factors on the urinary proteome, and it is easier to judge the early stages of atherosclerosis and identify biomarkers [9]. Apolipoprotein E (ApoE) plays an important role in maintaining the normal levels of cholesterol and triglycerides in serum by transporting lipids in the blood [10]. Mice lacking ApoE function develop hypercholesterolemia, increased very-low-density lipoprotein (VLDL) and decreased high-density lipoprotein (HDL), exhibiting spontaneous formation of plaques, and a high-fat diet can greatly accelerate the formation of plaques [11].
Although the early diagnosis of atherosclerosis is important and a large number of biomarkers have been identified, few works involve urinary biomarkers. Further, urine is an ideal source of early biomarkers and has the potential to reflect the changes in early stages of atherosclerosis. Therefore, there is an urgent need to explore the changes to the urinary proteome in high-fat-diet ApoE−/− mice.
In this experiment, ApoE−/− mice were fed a high-fat diet for five months. At different timepoints (week 0, week 1, month 1, month 2, month 3, month 4 and month 5) of the experiment, urine samples were collected and analysed by mass spectrometry. Comparison within the experimental group was conducted, as well as comparison between the experimental group and the control group using urine samples of normal-diet C57BL/6 mice. The changes in the proteome and chemical modifications that occur during disease progression provide clues in the search for biomarkers.
2. Materials and Methods
2.1. Experimental Animals
Six 4-week-old male ApoE−/− mice were purchased from the Laboratory Animal Science Department of Peking University Health Science Centre and fed a high-fat diet (21% fat and 0.15% cholesterol, Beijing Keao Xieli Feed Co., Ltd., Beijing, China) for 5 months. The animal licence is SCXK (Beijing) 2016-0010. A 12 h normal light–dark cycle and standard temperature (22°C ± 1°C) and humidity (65%–70%) conditions were used. All animal protocols governing the experiments in this study were approved by the Institute of Basic Medical Sciences Animal Ethics Committee, Peking Union Medical College (approved ID: ACUC-A02-2014-007). The study was carried out in compliance with the ARRIVE guidelines.
2.2. Histopathology
Six 6-month-old ApoE−/− mice in the experimental group and four 6-month-old normal-diet C57BL/6 mice (purchased from Beijing Vital River Laboratory Animal Technology Co., Ltd., Beijing, China) were euthanized together. Whole arteries were dissected and stained with Oil Red O [12]. The aortas were fixed in 4% paraformaldehyde and dehydrated with isopropanol. After longitudinal incision, they were stained with Oil Red O dye solution (Biotopped, Beijing, China) for 20 min and rinsed three times with isopropanol. A digital camera (Canon, Tokyo, Japan) was then used to obtain images of the aortas, which were analysed using ImageJ software (1.52a, NIH, Bethesda, MD, USA).
2.3. Urine Collection and Sample Preparation
To identify the short-term effects of a high-fat diet on animals, urine samples of experimental group mice were collected during week 0 and week 1. To monitor changes in the urinary proteome during the whole process, urine samples of the experimental group at months 1, 2, 3, 4 and 5 were also collected. The urine of four C57BL/6 mice fed a normal diet (all purchased from Beijing Vital River Laboratory Animal Technology Co., Ltd., Beijing, China) corresponding to the age of ApoE−/− mice was collected as a control group (not the same batch). All mice were placed in metabolic cages individually for 12 h to collect urine without any treatment. The collected urine samples were immediately stored at -80°C. The experimental process is shown in Figure 1.
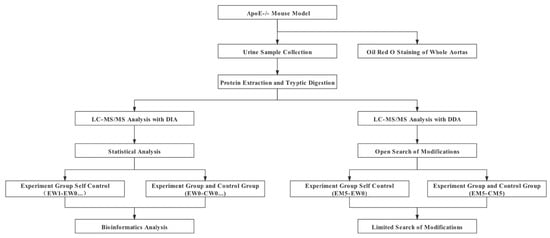
Figure 1.
Experimental flow graph.
The urine samples were centrifuged at 12,000 g for 40 min to remove the supernatant, precipitated using 3 times their volume of ethanol overnight, and then centrifuged at 12,000 g for 30 min. The protein was resuspended in lysis buffer (8 mol/L urea, 2 mol/L thiourea, 25 mmol/L dithiothreitol and 50 mmol/L Tris). The protein concentration was measured using the Bradford method. Urine proteolysis was performed using the filter-aided sample preparation (FASP) method [13]. The urine protein was loaded on the filter membrane of a 10 kDa ultrafiltration tube (PALL, Port Washington, NY, USA) and washed twice with UA (8 mol/L urea, 0.1 mol/L Tris-HCl, pH 8.5) and 25 mmol/L NH4HCO3 solution; 20 mmol/L dithiothreitol (DTT, Sigma, St. Louis, MO, USA) was added for reduction at 37°C for 1 h, and then 50 mmol/L iodoacetamide (IAA, Sigma, St. Louis, MO, USA) was used for alkylation in the dark for 30 min. After washing twice with UA and NH4HCO3 solutions, trypsin (Promega, Fitchburg, WI, USA) was added at a ratio of 1:50 for digestion at 37°C for 14 h. The peptides were passed through Oasis HLB cartridges (Waters, Milford, MA, USA) for desalting and then dried by vacuum evaporation (Thermo Fisher Scientific, Bremen, Germany).
2.4. Spin-Column Peptide Fractionation
The digested samples were redissolved in 0.1% formic acid and diluted to 0.5 μg/μL. Each sample was used to prepare a mixed peptide sample, and a high-pH reversed-phase fractionation spin column (Thermo Fisher Scientific, Waltham, MA, USA) was used for separation. The mixed peptide samples were added to the chromatographic column and eluted with a step gradient of 8 increasing acetonitrile concentrations (5, 7.5, 10, 12.5, 15, 17.5, 20 and 50% acetonitrile). Ten effluents were finally collected by centrifugation and were dried with vacuum evaporation and resuspended in 0.1% formic acid. In this study, iRT reagent (Biognosis, Schlieren, Switzerland) was used to calibrate the retention time of the extracted peptide peaks, which were added to ten components and each sample at a volume ratio of 10:1.
2.5. LC-MS/MS Analysis
An EASY-nLC 1200 chromatography system (Thermo Fisher Scientific, Waltham, MA, USA) and Orbitrap Fusion Lumos Tribrid mass spectrometer (Thermo Fisher Scientific, Waltham, MA, USA) were used for mass spectrometry acquisition and analysis. The peptide sample was loaded onto the precolumn (75 μm×2 cm, C18, 2 μm, Thermo Fisher) at a flowrate of 400 nL/min and then separated using a reversed-phase analysis column (50 μm × 15 cm, C18, 2 μm, Thermo Fisher) for 120 min. The mobile phase with a gradient of 4%–35% (80% acetonitrile + 0.1% formic acid + 20% water) was used for elution. A full MS scan was acquired within a 350–1500 m/z range with the resolution set to 120,000. The MS/MS scan was acquired in Orbitrap mode with a resolution of 30,000. The HCD collision energy was set to 30%. The mass spectrum data of 10 components separated by the reversed-phase column and all the samples obtained by enzymatic hydrolysis were collected in DDA mode.
2.6. Label-free DIA Quantification
The DDA collection results of the above 10 components were imported into the Proteome Discoverer software (version 2.1, Thermo Scientific, Waltham, MA, USA) search database using the following parameters: mouse database (released in 2019, containing 17,038 sequences) with the iRT peptide sequence attached, trypsin digestion, a maximum of two missing cleavage sites, parent ion mass tolerance of 10 ppm, fragment ion mass tolerance of 0.02 Da, methionine oxidation set as variable modification, cysteine carbamidomethylation set as fixed modification, and protein false discovery rate (FDR) set to 1%. The PD search result was used to establish the DIA acquisition method, and the window width and number were calculated according to the m/z distribution density.
Sixty-nine peptide samples were put into DIA mode to collect mass spectrometry data. Spectronaut™ Pulsar X (Biognosys, Biognosis, Switzerland) software was used to process and analyse mass spectrometry data [14]. Based on the DDA search result pdResult file and the 10 DDA raw files, we created a spectrum library; the raw files collected by DIA were imported for each sample to search the library. The high-confidence protein standard was a peptide q value < 0.01, and the peak area of all fragment ions of the secondary peptide was used for protein quantification.
2.7. Protein Chemical Modifications Search
PFind Studio software (version 3.1.6, Institute of Computing Technology, Chinese Academy of Sciences, Beijing, China) was used to perform label-free quantitative analysis of the DDA collection results of enzymatic hydrolysis samples [15]. The target search database was from the Mus musculus database downloaded by UniProt (updated September 2020). During the search process, the instrument type was set as HCD-FTMS, the enzyme was fully specific trypsin, and up to 2 missed cleaved sites were allowed. The “open-search” mode was selected, and the screening condition was that the FDR at the peptide level was less than 1%. The data were analysed using both forward and reverse database search strategies. After the initial screening, a restricted search method was used for verification.
2.8. Statistical Analysis
The missing abundance values were determined (KNN method) [16], and CV value screening (CV < 0.3) [17] was performed on the mass spectrometry results. The two-sided unpaired t-test was used for the comparison between each set of data. Comparison within the experimental group and comparison between the experimental group and the control group at the same time points were screened for differential proteins. The screening criteria were as follows: fold change (FC) between the two groups ≥1.5 or ≤0.67 and p < 0.05. At the same time, the samples in each two groups were randomly combined, and the average number of differential proteins in all permutations and combinations was calculated according to the same criteria as normal screening (Table S1), ensuring that differential proteins were generated by differences between groups rather than random production.
The proportions of different types of chemical modification sites out of the total number of modification sites were calculated, and the data between each two groups were compared by two-sided unpaired t-tests. The screening criteria were FC between the two groups ≥1.5 or ≤0.67 and p < 0.05.
The DAVID database (https://url.cy/0E13rJ) [18] was used to perform functional enrichment analysis on the differential proteins that were screened. The significance threshold of p < 0.05 was adopted. All methods were performed in accordance with the relevant guidelines and regulations.
3. Results
3.1. Histopathology
The Oil Red O staining results of the whole aortas of 6-month-old ApoE−/− mice fed a high-fat diet for 5 months were compared to those of 6-month-old mice fed a normal diet. The average percentage of stained areas in the experimental group was 17.78 ± 2.14% (n = 6), and the average percentage in the control group was 0.88 ± 0.34% (n = 4), p = 0.0004 (Figure 2).
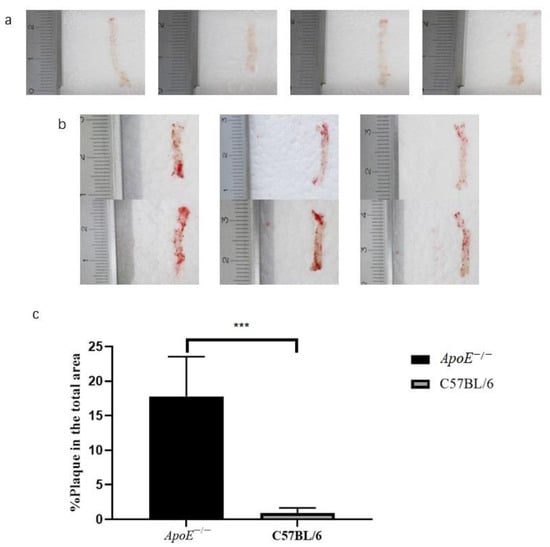
Figure 2.
Results and quantitative analysis of oil red O staining of the whole aorta in the (a) control group and (b) experimental group, and (c) comparison of the staining area ratio, ***, p < 0.001.
3.2. Differential Protein Screening and Functional Annotation
The experimental group and the control group had 69 samples from seven time points (W0/W1/M1/M2/M3/M4/M5) for non-labelled LC-MS/MS quantification (one sample in the experimental group for W0 was insufficient). A total of 592 proteins identified with at least 2 unique peptides with FDR < 1% were identified, and an average of 360 urine proteins were identified for each sample. The heatmap (Figure S1) of all the samples shows that it is hard to discriminate samples of different time points or groups as a whole, which indicates that there are great differences among individuals. The mass spectrometry proteomics data have been deposited to the ProteomeXchange Consortium (https://url.cy/qevTk1 (accessed on 10 August 2022)) via the iProX partner repository [19] with the dataset identifier PXD027610.
3.2.1. Comparison within the Experimental Group
Short-Term Effects of a High-Fat Diet
To identify the effects of a high-fat diet, after a week of a high-fat diet in ApoE−/− mice, urine samples collected from W0 and W1 were compared and analysed. The volcano plot of proteins is shown in Figure S2. A total of 12 proteins were significantly upregulated and 15 proteins were significantly downregulated at W1 (Table 1). Among them, 21 proteins or their family members have been reported to be associated with lipids.
GO analysis of these 27 proteins by DAVID showed that most of the annotated biological processes were related to lipid metabolism and glucose metabolism (Figure 3). At the same time, the differential proteins between W1 and W0 in the control group (Table S2) did not enrich for any significant changes in biological processes, indicating that the physiological state of mice did not change significantly at W1, while only a week of a high-fat diet induced huge changes in the animal urinary proteome, further demonstrating that the urinary proteome sensitively reflects changes in the body.
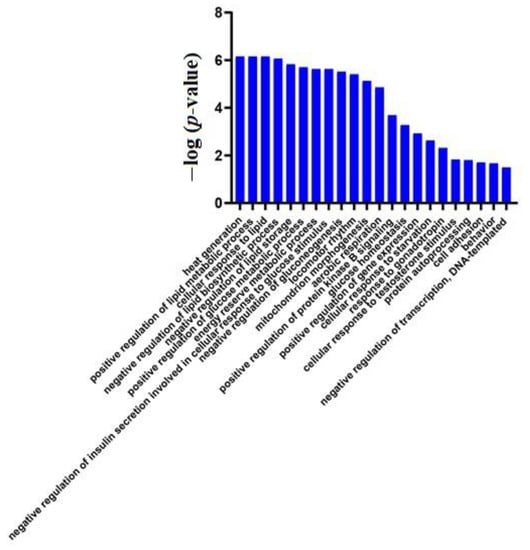
Figure 3.
Biological processes enriched in differential proteins between week 1 and week 0 samples of the experimental group (p < 0.05).
Urinary Proteome Changes in the Whole Process
Compared to W0, 51/69/86/65/88 proteins changed significantly at M1/M2/M3/M4/M5 in the experimental group, respectively. The volcano plots of proteins are shown in Figure S2. The Venn diagram (Figure 4) shows that a total of 17 proteins changed significantly at all five time points, and the DIA quantitative results show that these 17 proteins exhibited the same change trend at these time points. Another 18 proteins changed significantly at the last four time points, and the trend of change was the same at each time point (Table S3). Among them, 26 proteins or their family members have been previously reported to be related to lipid metabolism or cardiovascular diseases.
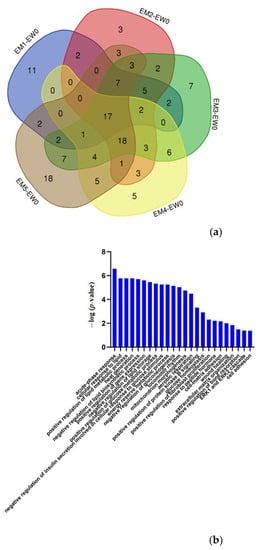
Figure 4.
Differential proteins in the whole process. (a) Venn diagram of differential proteins among the other time points (M1/M2/M3/M4/M5) and week 0 samples in the experimental group. (b) Biological processes enriched by continuously changing proteins in the comparison within the experimental group (p < 0.05).
Major urinary proteins (MUPs) are members of the lipocalcin family, which can be isolated and transport various lipophilic molecules in the blood and other body fluids [20]. Knockout of mouse trefoil factor 2 protects against obesity in response to a high-fat diet [21]. Angiotensinogen plays a key role in fat cell metabolism and inflammation development [22]. Alpha1-antitrypsin has been reported as a biomarker of atherosclerosis [23]. It has been reported that CCN4 (cellular communication network factor 4) promotes the migration and proliferation of vascular smooth muscle cells by interacting with α5β1 integrin [24], which plays a vital role in the occurrence and development of atherosclerosis. Regular monitoring of vitamin B12 status may help prevent atherosclerosis-related diseases, and anticobalamin 2 can carry vitamin B12 [25]. Regenerated islet-derived protein 3β, an inflammatory marker, is of great significance for the recruitment of macrophages and for tissue repair [26]. The level of α-2-HS-glycoprotein is positively correlated with atherosclerotic substitution parameters, such as intima–media thickness (IMT) and arteriosclerosis [27]. The literature shows that gelsolin stabilizes actin filaments by binding to the ends of filaments, preventing monomer exchange. Its downregulation indicates that the cytoskeleton of vascular smooth muscle cells in the human coronary atherosclerotic medium is dysregulated [28]. It has been reported that SCUBE2 may play an important role in the progression of atherosclerotic plaques through Hh signal transduction [29]. Type I collagen is an early biomarker of atherosclerosis [23].
Igκ chain V-III region PC 7043, Igκ chain V-II region 26–10 and immunoglobulin κ constant are all involved in the adaptive immune response. The haptoglobin polymorphism is related to the prevalence and clinical evolution of many inflammatory diseases, including atherosclerosis [30]. MHCII antigen presentation has an important protective function in atherosclerosis [31]. Interleukin-18 plays a key role in atherosclerosis and plays a role in appetite control and the development of obesity [32]. According to the literature, compared to healthy controls, LAMP-2 gene expression and protein levels in peripheral blood leukocytes of patients with coronary heart disease are significantly increased [33]. T-cadherin is essential for the accumulation of adiponectin in neointima and atherosclerotic plaque lesions [34]. Kidney androgen-regulated protein has also been reported in the urine of ApoE−/− mice fed a high-fat diet [23]. Fibronectin is an indicator of connective tissue formation during atherosclerosis [35]. Peripheral arterial occlusive disease (PAOD) is one of the primary manifestations of systemic atherosclerosis, and transthyretin and complement factor B are potential markers for monitoring plasma PAOD disease [36]. Serotransferrin plays an important role in atherosclerosis [37]. The differential expression of serine protease inhibitor A3 in blood vessels is significantly related to human atherosclerosis [38]. Prolactin plays a role in the proliferation of vascular smooth muscle cells, and the proliferation of vascular smooth muscle cells is a characteristic of cardiovascular diseases such as hypertension and atherosclerosis [39].
The abovementioned differential proteins that continually changed during the whole process were analysed using DAVID for GO analysis (Figure 4), and the enriched biological processes are also shown in the figure.
The major urinary protein-induced lipid metabolism- and glucose metabolism-related biological processes changed significantly; the acute phase reaction has been reported in the literature to be related to atherosclerosis [40]. The positive regulation of fibroblast proliferation also changed significantly, and vascular damage and dysfunction of adipose tissue around blood vessels promotes vasodilation, fibroblast activation and myofibroblast differentiation [41]. Wound healing is also related to atherosclerosis [42]. The extracellular matrix gives atherosclerotic lesion areas tensile strength, viscoelasticity, and compressibility [43]. There are also reports showing correlation between osteoporosis and atherosclerosis [44]. The ERK1/ERK2 pathway is involved in insulin (INS) and thrombin-induced vascular smooth muscle cells, which play important roles in proliferation [45]. Cell adhesion also plays an important role in atherosclerosis [46].
The comparison within the experimental group avoids the influence of genetic and dietary differences on the experimental results to the greatest extent, but the influence of biological growth and development is difficult to avoid. The results show that there are a variety of proteins that change continually throughout the progression of the disease and that are closely related to the disease. It is worth noting that the differential proteins obtained using this comparison method and the biological processes and pathways enriched by them exhibit a high degree of overlap at different time points, which may make it difficult to enhance early diagnosis of the disease, so follow-up comparison between the experimental group and control group was performed.
3.2.2. Comparison between the Experimental Group and the Control Group
Comparison of the results between the experimental group and the control group at the same time points showed that 44/16/54/23/48/57/46 differential proteins were obtained at W0/W1/M1/M2/M3/M4/M5, respectively. The details of the proteins are shown in Table 2, the volcano plots of proteins are shown in Figure S2, and the overlap of differential proteins at different time points is shown in Figure S3. Comparing between the experimental group and control group, there were significant differences in the differential proteins at each time point, but they were all closely related to lipids and cardiovascular diseases.
The differential proteins were analysed by DAVID for GO analysis, and the biological processes that changed significantly at different time points are shown in Figure 5. The biological processes related to lipid metabolism and glucose metabolism in the experimental group were significantly different from those in the control group at W0. At W0 and M4, the immune-related processes were significantly different. Differential proteins at M1 were primarily enriched in cell adhesion-related processes, while at M2, they were primarily enriched in redox reaction-related processes. At M3, wound healing began to appear, and there were many adhesion-related processes. In addition to a large number of immune-related processes, the positive regulation of fibroblast proliferation and the negative regulation of angiogenesis also appeared at M4. The processes related to phagocytosis and proteolysis began to appear at M5.
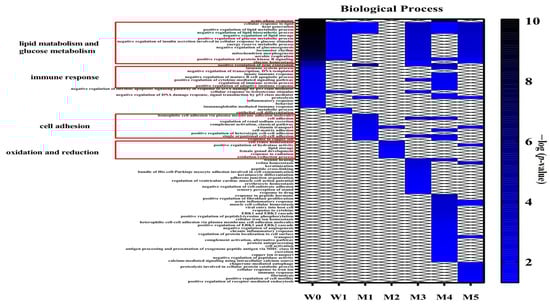
Figure 5.
Functional annotation of differential proteins at different time points between the experimental and control groups (p < 0.05). When the experimental group is compared to the control group, there is a large difference in W0, demonstrating that the urinary proteome reflects even slight difference between the groups. In the subsequent control results at each time point, the degree of overlap in the differential proteins is small, but they are mostly related to lipids and cardiovascular diseases. The enriched biological processes also correspond to the progression of atherosclerosis, indicating that the urinary proteome is useful to monitor the disease process. However, as mentioned before, this type of comparison does not take the influence of diet and other factors into account.3.3. Chemical Modifications of Proteins.
Effects of Genetic Factors
At W0, before a high-fat diet was administered to the experimental group, the only difference between the two groups was genetic factors. There were already significant differences in the biological processes related to lipid and glycometabolism, indicating that ApoE gene knockout greatly affects the lipid transport in mice in the experimental group, which is reflected by the urinary proteome very early. Acute phase reactions, immune responses, cytokines and proteolysis are also closely related to atherosclerosis [47,48,49,50].
Urinary Proteome Changes during Whole Process
The literature shows that during the early stages of atherosclerosis, low-density lipoprotein (LDL) particles accumulate in the arterial intima, and are thereby protected from plasma antioxidants and undergo oxidation and other modifications and have proinflammatory and immunogenic properties. Classic monocytes circulating in the blood can exhibit anti-inflammatory functions and bind to the adhesion molecules expressed by activated endothelial cells to enter the inner membrane. Once in the inner membrane, monocytes can mature into macrophages, which express scavenger receptors that bind to lipoprotein particles and then become foam cells, finally forming the core of atherosclerotic plaques. T lymphocytes can also enter the inner membrane to regulate the functions of natural immune cells, endothelial cells and smooth muscle cells. The smooth muscle cells in the media can migrate to the inner membrane under the action of leukocytes to secrete extracellular matrix and form a fibrous cap [51]. During the exploration of this experiment, at week 1, the differentially expressed proteins between the experimental and control groups were related to the differentiation of epithelial cells, and cell adhesion was enriched in M1 macrophages, which may be related to the adhesion of monocytes. Differential proteins between the experimental and control groups at M2 were related to biological processes associated with redox, which may be related to the redox of LDL particles. Cell adhesion also changes at M3, which may involve the recruitment of phagocytes. Numerous immune-related biological processes changed in M4, indicating the participation of immune cells such as T cells. The regulation of fibroblast proliferation may be related to the formation of fibrous caps. Enriched results revealed that proteolysis changed significantly at M5. It has been reported that activated macrophages can secrete proteolytic enzymes and degrade matrix components. The loss of matrix components may subsequently lead to plaque instability and increase the risk of plaque rupture and thrombosis [52]. Fibrin dissolution also plays an important role in the development of atherosclerosis [53].
The biological processes of the enrichment of differential proteins at different time points can correspond to the occurrence and development of atherosclerosis, indicating that the urinary proteome has the potential to be used to monitor the disease process.
After a week of a high-fat diet in the experimental group, the protein kinase B signalling pathway changed. It has been reported to play an important role in the survival, proliferation and migration of macrophages and may affect the development of atherosclerosis [54]. After a month of a high-fat diet, many biological processes underwent significant changes. Studies have shown that urinary sodium excretion is the decisive factor in carotid intima–media thickness, which is an indicator of atherosclerosis [55]. The classical pathway of complement activation is also related to atherosclerosis [56]. Copper and isotypic cysteine can interact to generate free radicals, thereby oxidizing LDL, which has been found in atherosclerotic plaques [57]. At M2, oestrogen is also reported to have a variety of anti-atherosclerotic properties, including affecting plasma lipoprotein levels and stimulating the production of prostacyclin and nitric oxide [58]. At M3, wound healing is also associated with atherosclerosis [42]. For the biological processes that changed at M4, the ERK1/ERK2 pathway plays an important role in the proliferation of vascular smooth muscle cells induced by insulin (INS) and thrombin [45]. Alternative pathways of complement activation and major histocompatibility complex family II have been reported to be associated with atherosclerosis [59,60]. In the enrichment of differential proteins at M5, chaperone-mediated autophagy (CMA) plays an important upstream regulatory role in lipid metabolism [61].
To further explore the effect of high-fat diet on chemical modifications of urine proteins, a total of 15 samples were selected at three time points (EW0/EM5/CM5). After data retrieval (.raw) based on open-pFind software, the analysis results were exported in pBuild.
A total of 923 different chemical modification types were identified in 15 samples, of which 468 chemical modification types were identified in the EW0 group, 748 chemical modification types were identified in the EM5 group, and 611 chemical modification types were identified in the CM5 group.
An unsupervised cluster analysis of all modifications found that the CM5 group was well distinguished from the other two groups (Figure 6). The percentages of different modification types in the EW0 group and the EM5 group were quantified to identify the modification changes that occurred in the comparison within the experimental group. Among them, one modification type was unique to the EW0 group and existed in more than four samples (the total number of samples was five), 23 modification types were unique to the EM5 group and existed in more than five samples (the total number of samples was six); there are 68 types of modifications shared by the two groups, and there had significant differences (FC ≥ 1.5 or ≤0.67, p < 0.05). At the same time, the proportions of different types of modified sites in the CM5 group and the EM5 group were quantified, and the difference between the experimental group and the control group was analysed. Among them, eight modification types were unique to the CM5 group and existed in more than three samples (the total number of samples was four), and 19 modification types were unique to the EM5 group and existed in more than five samples (the total number of samples was six). There were 72 types of modifications that were shared by the two groups that had significant differences (FC ≥ 1.5 or ≤0.67, p < 0.05) (see Table S5 for details).
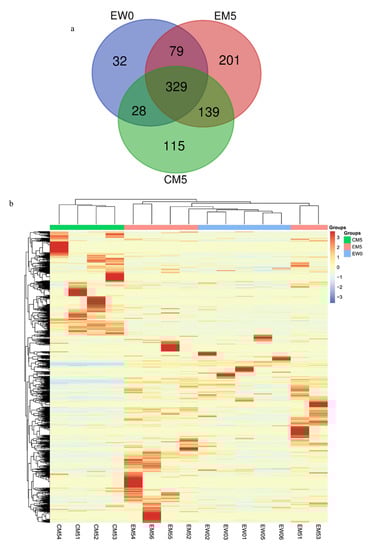
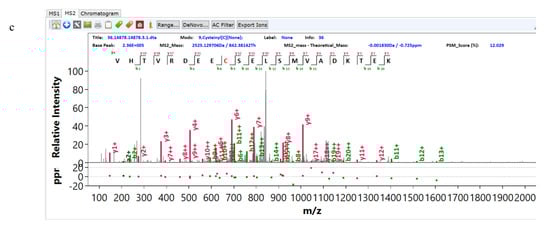
Figure 6.
Chemical modifications among the three groups. (a) Venn diagram of modification types among the three groups. (b) Unsupervised clustering of all the modification types in the three groups. (c) An exemplary spectrum of modifications.
To reduce the false negative influence caused by the open search mode, a restricted search method was used for verification. Modification types that accounted for the top five modification sites in the open search were fixed; modification types that were unique in a group and existed in each sample and modification types that had been reported related to lipids in the literature were selected. Twenty modifications in the EM5-EW0 group and 25 modifications in the EW5-CM5 group were selected, and the proportion of modified sites in the total number of sites was calculated (Table S6). The screening criteria were FC ≥ 1.5 or ≤ 0.67 and p < 0.05. Finally, in the comparison within the experimental group (EM5-EW0), N-terminal carbamylation (Carbamyl[AnyN-term]), CHDH modification of aspartic acid (CHDH[D]), tryptophan to kynurenine acid substitution (Trp- > Kynurenin[W]), oxidation modification of proline (Oxidation[P]), cysteine modification of cysteine (Cysteinyl[C]), sulphur dioxide modification of cysteine (SulfurDioxide[C]), NO_SMX_SIMD modification of cysteine (NO_SMX_SIMD[C]) and Delta_H(2)C(3) modification of lysine (Delta_H(2)C(3)[K]) significantly changed. In the comparison between the experimental and control groups (EM5–CM5), guanidine modification of lysine (Guanidinyl[K]), phosphouridine modification of tyrosine (PhosphoUridine[Y]), N-terminal carbamoyl modification (Carbamyl[AnyN-term]), Delta_H(2)C(2) modification (Delta_H(2)C(2)[AnyN-term]) at the N-terminus and Dihydroxyimidazolidine modification of arginine (Dihydroxyimidazolidine) [R]) showed significant changes.

Table 1.
Details of differential proteins between week 1 and week 0 samples in the experimental group.
Table 1.
Details of differential proteins between week 1 and week 0 samples in the experimental group.
| UniProt | Human UniProt | Protein Name | p-Value | Fold Change | References |
|---|---|---|---|---|---|
| B5X0G2 | No | Major urinary protein 17 | 0.0008 | 7.92 | [20] |
| P11588 | No | Major urinary protein 1 | 0.0007 | 7.84 | [20] |
| A2BIM8 | No | Major urinary protein 18 | 0.0014 | 3.19 | [20] |
| Q9JI02 | No | Secretoglobin family 2B member 20 | 0.0488 | 2.75 | — |
| Q5FW60 | No | Major urinary protein 20 | 0.0121 | 2.65 | [20] |
| Q07797 | Q08380 | Galectin-3-binding protein | 0.0077 | 2.59 | [62,63] |
| Q61838 | No | Pregnancy zone protein | 0.0411 | 2.46 | [64] |
| P11591 | No | Major urinary protein 5 | 0.0136 | 2.40 | [20] |
| Q64695 | Q9UNN8 | Endothelial protein C receptor | 0.0150 | 2.23 | [65] |
| Q91WR8 | P59796 | Glutathione peroxidase 6 | 0.0469 | 1.99 | [66] |
| P06797 | P07711 | Cathepsin L1 | 0.0146 | 1.84 | [67] |
| P13597 | P05362 | Intercellular adhesion molecule 1 | 0.0432 | 1.66 | [68,69] |
| Q9JK39 | A8MVZ5 | Butyrophilin-like protein 10 | 0.0446 | 0.60 | — |
| P01898 | P01891 | H-2 class I histocompatibility antigen, Q10 alpha chain | 0.0429 | 0.59 | [70] |
| P55292 | Q02487 | Desmocollin-2 | 0.0160 | 0.57 | [71,72] |
| P23780 | P16278 | Beta-galactosidase | 0.0384 | 0.56 | — |
| Q60648 | P17900 | Ganglioside GM2 activator | 0.0382 | 0.56 | [73] |
| P00688 | P04746 | Pancreatic alpha-amylase | 0.0311 | 0.55 | [74] |
| P70269 | P14091 | Cathepsin E | 0.0299 | 0.54 | [75] |
| P11859 | P01019 | Angiotensinogen | 0.0338 | 0.51 | [22] |
| Q6UGQ3 | No | Secretoglobin family 2B member 2 | 0.0270 | 0.49 | — |
| O88322 | Q14112 | Nidogen-2 | 0.0004 | 0.43 | — |
| O88968 | P20062 | Transcobalamin-2 | 0.0155 | 0.39 | [25] |
| P11087 | P02452 | Collagen alpha-1(I) chain | 0.0080 | 0.34 | [23] |
| Q4KML4 | Q9P1F3 | Costars family protein ABRACL | 0.0181 | 0.28 | — |
| P35230 | Q06141 | Regenerating islet-derived protein 3-beta | 0.0012 | 0.24 | [26] |
| A2AEP0 | No | Odorant-binding protein 1b | 0.0213 | 0.20 | [76] |
Table 2.
Details of differential proteins between the experimental group and the control group at different time points.
Table 2.
Details of differential proteins between the experimental group and the control group at different time points.
| UniProt | Human UniProt | Protein Name | Fold Change | References | ||||||
|---|---|---|---|---|---|---|---|---|---|---|
| EW0-CW0 | EW1-CW1 | EM1-CM1 | EM2-CM2 | EM3-CM3 | EM4-CM4 | EM5-CM5 | ||||
| P35230 | Q06141 | Regenerating islet-derived protein 3-beta | 5.22 | — | — | — | — | — | — | [26] |
| P13020 | P06396 | Gelsolin | 2.83 | — | — | — | — | — | — | [28] |
| P97426 | P12724 | Eosinophil cationic protein 1 | 2.57 | — | — | — | 1.77 | 7.57 | — | [77] |
| O88322 | Q14112 | Nidogen-2 | 2.32 | 1.96 | — | — | — | — | 0.39 | — |
| P29699 | P02765 | Alpha-2-HS-glycoprotein | 2.27 | — | — | — | — | — | — | [27] |
| P07758 | P01009 | Alpha-1-antitrypsin 1-1 | 2.11 | — | — | — | 0.58 | 0.25 | — | [23] |
| P07309 | P02766 | Transthyretin | 2.06 | — | — | — | — | — | — | [78] |
| P49183 | P24855 | Deoxyribonuclease-1 | 1.79 | — | 0.47 | — | — | — | — | [79] |
| P01864 | No | Ig gamma-2A chain C region secreted form | 1.55 | — | 0.30 | — | — | — | — | — |
| P19221 | P00734 | Prothrombin | 0.63 | — | — | — | — | — | 0.54 | [80] |
| P61110 | P61109 | Kidney androgen-regulated protein | 0.62 | — | — | — | — | 6.55 | — | [23] |
| Q9Z0M9 | O95998 | Interleukin-18-binding protein | 0.60 | — | — | — | 2.11 | — | — | [32] |
| P05533 | No | Lymphocyte antigen 6A-2/6E-1 | 0.60 | — | — | — | — | — | — | — |
| O09043 | O96009 | Napsin-A | 0.59 | — | — | — | 0.42 | — | — | — |
| P03953 | P00746 | Complement factor D | 0.59 | — | — | — | — | 2.60 | — | [81] |
| Q91VW3 | Q9H299 | SH3 domain-binding glutamic acid-rich-like protein 3 | 0.58 | — | — | 2.22 | — | — | — | — |
| P15379 | P16070 | CD44 antigen | 0.58 | — | 0.25 | — | — | 3.43 | — | [82] |
| P04441 | P04233 | H-2 class II histocompatibility antigen gamma chain | 0.54 | — | — | — | 4.59 | 13.02 | — | [31] |
| P25119 | P20333 | Tumour necrosis factor receptor superfamily member 1B | 0.54 | — | — | — | 1.74 | — | — | [83] |
| Q00993 | P30530 | Tyrosine-protein kinase receptor UFO | 0.53 | — | — | 0.51 | 2.16 | 3.62 | — | [84] |
| P07361 | P02763 | Alpha-1-acid glycoprotein 2 | 0.52 | — | — | — | — | 0.13 | — | [85] |
| P09470 | P12821 | Angiotensin-converting enzyme | 0.51 | — | — | — | — | — | — | [86] |
| Q91WR8 | P59796 | Glutathione peroxidase 6 | 0.47 | — | — | — | — | 3.34 | — | [66] |
| Q62395 | Q07654 | Trefoil factor 3 | 0.46 | — | — | — | — | — | — | [21] |
| Q9DAK9 | Q9NRX4 | 14 kDa phosphohistidine phosphatase | 0.46 | — | — | — | — | — | 2.02 | [87] |
| O88188 | O95711 | Lymphocyte antigen 86 | 0.45 | — | — | — | — | — | — | — |
| Q60932 | P21796 | Voltage-dependent anion-selective channel protein 1 | 0.44 | 0.45 | — | 3.68 | — | — | — | [88] |
| P11589 | No | Major urinary protein 2 | 0.44 | — | 3.82 | — | 1.98 | 6.19 | 3.16 | [20] |
| Q62266 | No | Cornifin-A | 0.43 | 0.49 | — | — | — | — | — | — |
| P17047 | P13473 | Lysosome-associated membrane glycoprotein 2 | 0.42 | — | — | — | 2.19 | 3.45 | 2.44 | [33] |
| P0CW03 | No | Lymphocyte antigen 6C2 | 0.41 | — | — | — | — | — | — | — |
| Q60590 | P02763 | Alpha-1-acid glycoprotein 1 | 0.41 | — | — | — | — | 0.08 | — | [85] |
| P01665 | No | Ig kappa chain V-III region PC 7043 | 0.41 | — | — | — | — | 7.91 | 2.38 | — |
| P04939 | No | Major urinary protein 3 | 0.39 | — | — | — | — | — | — | [20] |
| Q6SJQ5 | Q6UXZ3 | CMRF35-like molecule 3 | 0.35 | — | — | — | — | — | 0.56 | — |
| Q64695 | Q9UNN8 | Endothelial protein C receptor | 0.31 | — | — | — | — | — | — | [65] |
| E9Q557 | P15924 | Desmoplakin | 0.29 | — | — | — | 3.82 | — | — | — |
| P11591 | No | Major urinary protein 5 | 0.27 | — | — | — | — | 4.49 | 2.30 | [20] |
| P51437 | P49913 | Cathelicidin antimicrobial peptide | 0.24 | — | — | — | — | — | — | [89] |
| Q5FW60 | No | Major urinary protein 20 | 0.23 | — | — | — | — | — | 2.14 | [20] |
| A2BIM8 | No | Major urinary protein 18 | 0.20 | 0.50 | 6.10 | — | 2.10 | — | — | [20] |
| Q61646 | P00738 | Haptoglobin | 0.14 | — | — | — | — | 0.09 | — | [30] |
| P11588 | No | Major urinary protein 1 | 0.07 | 0.45 | — | — | 2.17 | — | — | [20] |
| B5X0G2 | No | Major urinary protein 17 | 0.06 | 0.34 | 28.79 | — | — | — | 4.06 | [20] |
| Q9JI02 | No | Secretoglobin family 2B member 20 | — | 2.83 | — | — | 0.23 | — | — | — |
| Q01279 | P00533 | Epidermal growth factor receptor | — | 1.52 | — | — | — | — | — | [90] |
| P10605 | P07858 | Cathepsin B | — | 0.63 | 0.44 | — | — | — | — | [91] |
| P50429 | P15848 | Arylsulfatase B | — | 0.56 | — | — | — | — | — | [92] |
| Q571E4 | P34059 | N-acetylgalactosamine-6-sulfatase | — | 0.52 | — | — | — | 3.57 | — | — |
| Q9JK39 | A8MVZ5 | Butyrophilin-like protein 10 | — | 0.50 | — | — | — | — | — | — |
| P23780 | P16278 | Beta-galactosidase | — | 0.48 | 0.15 | — | 0.28 | — | — | — |
| P70269 | P14091 | Cathepsin E | — | 0.42 | — | — | — | 2.14 | — | [75] |
| O35887 | O43852 | Calumenin | — | 0.40 | — | — | 2.88 | 4.38 | 1.88 | [93] |
| Q9EP95 | Q9BQ08 | Resistin-like alpha | — | 0.27 | — | — | — | — | 0.20 | [94] |
| P20152 | P08670 | Vimentin | — | — | 16.24 | — | — | — | — | [95] |
| Q8K0E8 | P02675 | Fibrinogen beta chain | — | — | 8.28 | — | — | — | — | [96] |
| P16858 | P04406 | Glyceraldehyde-3-phosphate dehydrogenase | — | — | 4.72 | — | — | — | — | [97] |
| Q9WTR5 | P55290 | Cadherin-13 | — | — | 2.78 | — | — | — | — | [34] |
| Q00897 | P01009 | Alpha-1-antitrypsin 1-4 | — | — | 2.57 | — | — | — | 3.27 | [23] |
| O09164 | P08294 | Extracellular superoxide dismutase [Cu–Zn] | — | — | 2.11 | 1.56 | — | 3.37 | — | [98] |
| P11276 | P02751 | Fibronectin | — | — | 0.58 | — | — | 2.15 | — | [35] |
| Q9Z0J0 | P61916 | NPC intracellular cholesterol transporter 2 | — | — | 0.57 | — | — | — | — | [99] |
| Q8BPB5 | Q12805 | EGF-containing fibulin-like extracellular matrix protein 1 | — | — | 0.53 | 0.46 | — | — | — | — |
| Q8BZT5 | Q9H756 | Leucine-rich repeat-containing protein 19 | — | — | 0.52 | 0.50 | 0.55 | — | — | [100] |
| P21614 | P02774 | Vitamin D-binding protein | — | — | 0.50 | — | — | — | 0.49 | [101] |
| P16675 | P10619 | Lysosomal protective protein | — | — | 0.49 | — | — | — | 2.51 | — |
| Q61147 | P00450 | Ceruloplasmin | — | — | 0.49 | — | — | 0.35 | — | [102] |
| P23953 | No | Carboxylesterase 1C | — | — | 0.48 | — | — | — | — | — |
| Q61398 | Q15113 | Procollagen C-endopeptidase enhancer 1 | — | — | 0.48 | — | — | — | — | [103] |
| O35664 | P48551 | Interferon alpha/beta receptor 2 | — | — | 0.47 | — | — | — | — | [104] |
| P11859 | P01019 | Angiotensinogen | — | — | 0.45 | — | — | 0.15 | — | [22] |
| P01898 | P01891 | H-2 class I histocompatibility antigen, Q10 alpha chain | — | — | 0.45 | — | — | — | 2.03 | [70] |
| C0HKG5 | No | Ribonuclease T2-A | — | — | 0.42 | 0.60 | — | — | — | — |
| Q61271 | P36896 | Activin receptor type-1B | — | — | 0.42 | — | — | 3.64 | — | — |
| O88968 | P20062 | Transcobalamin-2 | — | — | 0.40 | — | — | — | — | [25] |
| Q9Z0L8 | Q92820 | Gamma-glutamyl hydrolase | — | — | 0.39 | — | — | — | — | [105,106] |
| P35459 | Q14210 | Lymphocyte antigen 6D | — | — | 0.39 | 0.57 | — | — | — | — |
| Q61129 | P05156 | Complement factor I | — | — | 0.38 | — | — | — | — | — |
| P01878 | No | Ig alpha chain C region | — | — | 0.38 | — | 5.03 | — | — | — |
| P55292 | Q02487 | Desmocollin-2 | — | — | 0.38 | — | 3.72 | — | — | [71,72] |
| Q9JJS0 | Q9NQ36 | Signal peptide, CUB and EGF-like domain-containing protein 2 | — | — | 0.35 | — | — | — | — | [29] |
| Q9Z319 | Q9Y5Q5 | Atrial natriuretic peptide-converting enzyme | — | — | 0.35 | — | — | — | — | [107] |
| P09036 | P00995 | Serine protease inhibitor Kazal-type 1 | — | — | 0.34 | — | — | — | — | — |
| Q4KML4 | Q9P1F3 | Costars family protein ABRACL | — | — | 0.33 | — | 2.18 | — | — | — |
| Q925F2 | Q96AP7 | Endothelial cell-selective adhesion molecule | — | — | 0.32 | — | — | — | 0.48 | [108] |
| O89020 | P43652 | Afamin | — | — | 0.31 | 0.50 | — | — | — | [109] |
| Q9DAU7 | Q14508 | WAP four-disulfide core domain protein 2 | — | — | 0.31 | — | — | — | — | — |
| Q8BND5 | O00391 | Sulfhydryl oxidase 1 | — | — | 0.30 | 0.40 | — | — | 0.61 | — |
| P09803 | P12830 | Cadherin-1 | — | — | 0.29 | — | 2.78 | 2.34 | — | [30] |
| P02816 | P12273 | Prolactin-inducible protein homolog | — | — | 0.27 | — | 0.45 | — | — | [39] |
| Q91WR6 | Q9NU53 | Glycoprotein integral membrane protein 1 | — | — | 0.26 | 0.59 | — | — | 0.45 | — |
| Q3UDR8 | Q9GZM5 | Protein YIPF3 | — | — | 0.26 | — | — | — | — | — |
| Q6UGQ3 | No | Secretoglobin family 2B member 2 | — | — | 0.25 | — | — | — | 2.03 | — |
| Q9D3H2 | No | Odorant-binding protein 1a | — | — | 0.25 | — | 1.75 | — | — | [76] |
| P20060 | P07686 | Beta-hexosaminidase subunit beta | — | — | 0.23 | — | 0.35 | — | — | — |
| Q8K1H9 | Q9NY56 | Odorant-binding protein 2a | — | — | 0.21 | — | 0.31 | 0.21 | — | [76] |
| A2AEP0 | No | Odorant-binding protein 1b | — | — | 0.20 | — | — | — | — | [76] |
| Q8C6C9 | Q6P5S2 | Protein LEG1 homolog | — | — | 0.15 | — | 0.44 | — | — | — |
| P00688 | P04746 | Pancreatic alpha-amylase | — | — | 0.14 | — | — | 0.32 | — | [74] |
| P10287 | P22223 | Cadherin-3 | — | — | 0.13 | — | 3.19 | 5.62 | — | [30] |
| P56386 | P60022 | Beta-defensin 1 | — | — | — | 3.94 | — | 5.25 | 1.90 | [110] |
| P10639 | P10599 | Thioredoxin | — | — | — | 3.63 | — | — | — | [111] |
| O88844 | O75874 | Isocitrate dehydrogenase [NADP] cytoplasmic | — | — | — | 2.71 | — | — | — | [112] |
| Q00623 | P02647 | Apolipoprotein A-I | — | — | — | 2.07 | — | — | 0.36 | [113] |
| P0CG49 | P0CG47 | Polyubiquitin-B | — | — | — | 1.98 | — | — | — | [114] |
| Q03404 | Q03403 | Trefoil factor 2 | — | — | — | 1.69 | 2.11 | 8.94 | — | [21] |
| P15947 | P06870 | Kallikrein-1 | — | — | — | 0.66 | — | 1.74 | — | [115] |
| O55186 | P13987 | CD59A glycoprotein | — | — | — | 0.61 | — | 2.53 | — | [116] |
| Q921I1 | P02787 | Serotransferrin | — | — | — | 0.57 | 0.43 | 0.09 | 0.21 | [37] |
| Q60648 | P17900 | Ganglioside GM2 activator | — | — | — | 0.51 | — | — | 2.27 | [74] |
| O88792 | Q9Y624 | Junctional adhesion molecule A | — | — | — | 0.49 | — | — | — | [117] |
| P07724 | P02768 | Albumin | — | — | — | 0.38 | — | 0.38 | 0.43 | [118] |
| O70554 | No | Small proline-rich protein 2B | — | — | — | — | 7.98 | — | 3.26 | [119,120] |
| Q62267 | No | Cornifin-B | — | — | — | — | 5.69 | — | — | — |
| P35700 | Q06830 | Peroxiredoxin-1 | — | — | — | — | 3.75 | — | — | [121] |
| P18761 | P23280 | Carbonic anhydrase 6 | — | — | — | — | 3.37 | — | — | [122] |
| P01631 | No | Ig kappa chain V-II region 26-10 | — | — | — | — | 3.29 | 3.00 | — | — |
| P11087 | P02452 | Collagen alpha-1(I) chain | — | — | — | — | 3.21 | — | — | [23] |
| P01837 | P01834 | Immunoglobulin kappa constant | — | — | — | — | 3.19 | — | — | — |
| Q99N23 | No | Carbonic anhydrase 15 | — | — | — | — | 2.91 | — | — | [122] |
| P10126 | P68104 | Elongation factor 1-alpha 1 | — | — | — | — | 2.90 | — | — | [123] |
| P70663 | Q14515 | SPARC-like protein 1 | — | — | — | — | 2.74 | — | — | — |
| Q60847 | Q99715 | Collagen alpha-1(XII) chain | — | — | — | — | 2.68 | — | — | [23] |
| P29533 | P19320 | Vascular cell adhesion protein 1 | — | — | — | — | 2.62 | 2.12 | — | [124] |
| O55135 | P56537 | Eukaryotic translation initiation factor 6 | — | — | — | — | 2.55 | — | — | — |
| O54775 | O95388 | CCN family member 4 | — | — | — | — | 2.47 | — | 0.47 | [24] |
| P01843 | No | Ig lambda-1 chain C region | — | — | — | — | 2.45 | — | — | — |
| Q9DBV4 | Q9BRK3 | Matrix remodelling-associated protein 8 | — | — | — | — | 1.70 | — | 1.80 | — |
| O35608 | O15123 | Angiopoietin-2 | — | — | — | — | 1.61 | — | — | [125] |
| Q07797 | Q08380 | Galectin-3-binding protein | — | — | — | — | 1.59 | — | — | [62] |
| Q04519 | P17405 | Sphingomyelin phosphodiesterase | — | — | — | — | 0.57 | — | 1.89 | [126] |
| Q61838 | No | Pregnancy zone protein | — | — | — | — | 0.52 | — | — | [64] |
| Q08423 | P04155 | Trefoil factor 1 | — | — | — | — | — | 12.79 | — | [21] |
| O08997 | O00244 | Copper transport protein ATOX1 | — | — | — | — | — | 8.07 | — | [127] |
| P03977 | No | Ig kappa chain V-III region 50S10.1 | — | — | — | — | — | 4.79 | — | — |
| P42567 | P42566 | Epidermal growth factor receptor substrate 15 | — | — | — | — | — | 4.53 | — | [90] |
| Q91X17 | P07911 | Uromodulin | — | — | — | — | — | 4.22 | — | [128] |
| P57096 | O43653 | Prostate stem cell antigen | — | — | — | — | — | 3.53 | — | — |
| P70699 | P10253 | Lysosomal alpha-glucosidase | — | — | — | — | — | 3.37 | — | [129] |
| P01132 | P01133 | Pro-epidermal growth factor | — | — | — | — | — | 3.13 | — | — |
| P32507 | Q92692 | Nectin-2 | — | — | — | — | — | 3.03 | — | [130] |
| Q5SSE9 | Q86UQ4 | ATP-binding cassette sub-family A member 13 | — | — | — | — | — | 2.92 | — | — |
| P06797 | O60911 | Cathepsin L1 | — | — | — | — | — | 2.63 | — | [67,75] |
| Q8R242 | Q01459 | Di-N-acetylchitobiase | — | — | — | — | — | 2.47 | — | — |
| Q9Z0K8 | O95497 | Pantetheinase | — | — | — | — | — | 2.32 | 3.65 | — |
| O54782 | Q9Y2E5 | Epididymis-specific alpha-mannosidase | — | — | — | — | — | 1.99 | — | — |
| P22599 | P01009 | Alpha-1-antitrypsin 1-2 | — | — | — | — | — | 0.50 | — | [23] |
| P13634 | P00915 | Carbonic anhydrase 1 | — | — | — | — | — | 0.39 | 3.37 | [122] |
| P20918 | P00747 | Plasminogen | — | — | — | — | — | 0.32 | 0.63 | [131] |
| P07759 | P01011 | Serine protease inhibitor A3K | — | — | — | — | — | 0.26 | — | [38] |
| P02088 | P68871 | Hemoglobin subunit beta-1 | — | — | — | — | — | 0.24 | — | — |
| P01027 | P01024 | Complement C3 | — | — | — | — | — | 0.20 | — | [56] |
| Q00898 | P01009 | Alpha-1-antitrypsin 1-5 | — | — | — | — | — | 0.18 | — | [23] |
| P11672 | P80188 | Neutrophil gelatinase-associated lipocalin | — | — | — | — | — | 0.04 | — | [132] |
| P01887 | P61769 | Beta-2-microglobulin | — | — | — | — | — | — | 3.07 | [133] |
| O09114 | P41222 | Prostaglandin-H2 D-isomerase | — | — | — | — | — | — | 2.41 | [134] |
| Q9WUU7 | Q9UBR2 | Cathepsin Z | — | — | — | — | — | — | 2.32 | [135] |
| Q8BHC0 | Q9Y5Y7 | Lymphatic vessel endothelial hyaluronic acid receptor 1 | — | — | — | — | — | — | 0.61 | — |
| O70570 | P01833 | Polymeric immunoglobulin receptor | — | — | — | — | — | — | 0.55 | — |
| P26041 | P26038 | Moesin | — | — | — | — | — | — | 0.53 | [136] |
| Q7TMJ8 | Q96FE7 | Phosphoinositide-3-kinase-interacting protein 1 | — | — | — | — | — | — | 0.52 | [137] |
| P01660 | No | Ig kappa chain V-III region PC 3741/TEPC 111 | — | — | — | — | — | — | 0.43 | — |
| Q60928 | P19440 | Glutathione hydrolase 1 proenzyme | — | — | — | — | — | — | 0.39 | [106] |
| P61971 | P61970 | Nuclear transport factor 2 | — | — | — | — | — | — | 0.36 | — |
| P06330 | No | Ig heavy chain V region AC38 205.12 | — | — | — | — | — | — | 0.36 | — |
| Q921W8 | Q8WVN6 | Secreted and transmembrane protein 1A | — | — | — | — | — | — | 0.35 | — |
| Q8BX43 | Q969Z4 | Tumour necrosis factor receptor superfamily member 19L | — | — | — | — | — | — | 0.33 | [83] |
| Proteoglycan 4 | ||||||||||
| Q9JM99 | Q92954 | — | — | — | — | — | — | 0.26 | [137] | |
Among the changes observed in the comparison within the experimental group, many studies have shown that carbamylated proteins are involved in the occurrence of diseases, especially atherosclerosis and chronic renal failure [138]. The kynurenine pathway is the primary pathway of tryptophan metabolism and plays an important role in early atherosclerosis [139]. The oxidation of proline can form glutamate semialdehyde, and glutamate semialdehyde is closely related to lipid peroxidation [140]. Elevated plasma homocysteine has also been widely studied as an independent risk factor for atherosclerosis [141]. Obstruction of the sulphur dioxide/aspartate aminotransferase pathway is also known to be involved in the pathogenesis of many cardiovascular diseases [142]. The Delta_H(2)C(3) modification of lysine also refers to acrolein addition +38, and acrolein and other α- and β-unsaturated aldehydes are considered to be mediators of inflammation and vascular dysfunction [143]. CHDH modification of aspartic acid and NO_SMX_SIMD modification of cysteine have not been reported to be related to atherosclerosis and may act as potential modification sites.
Although it was not verified in a restricted search, there are also studies claiming that the interruption of cell signals mediated by electrophiles is related to the occurrence of atherosclerosis and cancer. HNE and ONE and their derivatives are both active lipid electrophile reagents that inhibit the release of proinflammatory factors to a certain extent [144]. Nε-carboxymethyl-lysine (CML) has been reported to accumulate in large amounts in the tissues of diabetes and atherosclerosis, and glucosone aldehyde is related to its formation [145]. Benzyl isothiocyanate salt has been reported to inhibit lipid production and fatty liver formation in obese mice fed a high-fat diet [146]. It has been reported in the literature that thiazolidine derivatives have a positive effect in the treatment of LDLR(-/-) atherosclerotic mice [147]. In addition, the carboxyethylation of lysine has also changed, and some research indicates that the degree of carboxymethylation and carboxyethylation of lysine in the plasma of diabetic mice is significantly increased [148]. Changes in the expression of fucosylated oligosaccharides have been observed in pathological processes such as atherosclerosis [149]. In addition, the phosphorylation modification of tyrosine is related to the formation of esters, which may also be involved in lipid metabolism and the occurrence and progression of diseases [150].
In the differential modifications between the experimental group and the control group, some of the significantly changed modifications also changed in the comparison within the experimental group. In addition, the Delta_H(2)C(2) modification at the N-terminus of the amino acid also refers to acetaldehyde +26. In addition, acetaldehyde stimulates the growth of vascular smooth muscle cells in a notch-dependent manner, promoting the occurrence of atherosclerosis [151]. Advanced protein glycosylation is an important mechanism for the development of advanced complications of diabetes, including atherosclerosis. Hydroimidazolone-1 derived from methylglyoxal is the most abundant advanced glycosylation end-product in human plasma [152]. In addition, the guanidine modification of lysine may also be related to atherosclerosis [153].
Although not verified in the restricted search, an increasing number of studies have shown that short-chain fatty acids and their homologous acylation are involved in cardiovascular disease, and the proportions of 2-hydroxyisobutyrylation, malonylation and crotonylation in the experimental group were significantly increased [154]. Nε-carboxymethyl-lysine (CML) has been reported to accumulate in large amounts in the tissues in diabetes and atherosclerosis, and its induced PI3K/Akt signal inhibition promotes foam cell apoptosis and the progression of atherosclerosis [155]. In addition, glucosone is closely related to its formation, the proportion of which also increased significantly in the experimental group. Oxidation of tyrosine produces dihydroxyphenylalanine (DOPA), and the protein binding DOPA in tissues is elevated in many age-related pathological diseases, such as atherosclerosis and cataract formation [156].
As mentioned above, the comparison within the experimental group avoids the influence of genes, diet and other factors on the urinary proteome, but it may be affected by the growth and development of the organisms themselves. Comparison between the experimental group and control group avoids the influence of development but cannot avoid factors such as diet. The identification results of chemical modifications of urine proteins showed that regardless of whether comparison within the experimental group was adopted, the modification status changed greatly and was closely related to lipids and cardiovascular diseases. In comparison, differences between the experimental group and control group may be more obvious.
4. Conclusions
This study explored changes in urinary proteomics of high-fat-diet-fed ApoE−/− mice. The results of comparison within the experimental group showed that even after only one week of a high-fat diet, while the urinary proteome of the control group had not significantly changed, the urinary proteome of the experimental group had changed significantly, and most of the enriched biological pathways were related to lipid metabolism and glycometabolism, indicating that the urinary proteome has the potential for early and sensitive monitoring of biological changes. Most of the proteins and their family members that change continually in disease progression have been reported to be related to cardiovascular diseases and/or can be used as biomarkers. The results of the comparison between the experimental group and the control group show that the biological processes enriched by differential proteins at different time points correspond to the occurrence and development of atherosclerosis, indicating that the urinary proteome has the potential to be used to monitor the disease process. The differential modification types in the comparison within the experimental group and the comparison between the experimental and control groups have also been reported to be related to lipids and cardiovascular diseases and can be used as a reference for identifying new biomarkers.
Supplementary Materials
The following supporting information can be downloaded at: https://www.mdpi.com/article/10.3390/biom12111569/s1: Table S1, Screening results of random combinations of urine samples; Table S2, Differential proteins between week 1 and week 0 samples in the control group; Table S3, Details of continuously changing differential proteins in the comparison within the experimental group; Table S4, Differential proteins between adjacent time points of the experimental group; Table S5, Details of differential modifications in two comparisons by open search; Table S6, Results of limited search of modifications; Figure S1, Venn diagram of differential proteins at different time points between the experimental group and the control group; Figure S2, Volcano plots of proteins; Figure S3, Venn diagram of differential proteins at different time points between the experimental group and the control group.
Author Contributions
Y.H. performed the experiments, analysed the data, contributed reagents/materials/analysis tools, prepared figures and/or tables, authored or reviewed drafts of the paper and approved the final draft. W.M. and J.W. performed the experiments and contributed reagents/materials/analysis tools. Y.L. analysed the data and contributed reagents/materials/analysis tools. Y.G. conceived and designed the experiments, authored or reviewed drafts of the paper, and approved the final draft. All authors have read and agreed to the published version of the manuscript.
Funding
This work was supported by the Beijing Cooperative Construction Project (110651103); the Beijing Normal University (11100704).
Institutional Review Board Statement
All animal protocols governing the experiments in this study were approved by the Institute of Basic Medical Sciences Animal Ethics Committee, Peking Union Medical College (approved ID: ACUC-A02-2014-007).
Informed Consent Statement
Not applicable.
Data Availability Statement
The mass spectrometry proteomics data have been deposited to the ProteomeXchange Consortium (http://proteomecentral.proteomexchange.org (accessed on 10 August 2022)) via the iProX partner repository with the dataset identifier PXD027610.
Conflicts of Interest
The authors declare that they have no known competing financial interests or personal relationships that could have appeared to influence the work reported in this paper.
References
- Rahman, M.S.; Woollard, K. Atherosclerosis. Adv. Exp. Med. Biol. 2017, 1003, 121–144. [Google Scholar] [CrossRef]
- Tabas, I.; Garcia-Cardena, G.; Owens, G.K. Recent insights into the cellular biology of atherosclerosis. J. Cell Biol. 2015, 209, 13–22. [Google Scholar] [CrossRef] [PubMed]
- World Health Organization. Cardiovascular Diseases (CVDs) Fact Sheet; World Health Organization: Geneva, Switzerland, 2017. [Google Scholar]
- Barr, T.L.; VanGilder, R.L.; Seiberg, R.; Petrone, A.; Chantler, P.D.; Huang, C.C. Systemic Transcriptional Alterations of Innate and Adaptive Immune Signaling Pathways in Atherosclerosis, Ischemia Stroke, and Myocardial Infarction. J. Bioanal. Biomed. 2015, 7, 29–34. [Google Scholar] [CrossRef]
- Gao, Y. Urine-an untapped goldmine for biomarker discovery? Sci. China Life Sci. 2013, 56, 1145–1146. [Google Scholar] [CrossRef] [PubMed]
- Ni, Y.; Zhang, F.; An, M.; Yin, W.; Gao, Y. Early candidate biomarkers found from urine of glioblastoma multiforme rat before changes in MRI. Sci. China Life Sci. 2018, 61, 982–987. [Google Scholar] [CrossRef] [PubMed]
- Wei, J.; Meng, W.; Gao, Y. Urine proteome changes in rats subcutaneously inoculated with approximately ten tumor cells. PeerJ 2019, 7, e7717. [Google Scholar] [CrossRef]
- Qin, W.; Wang, T.; Huang, H.; Gao, Y. Profiling of lysine-acetylated proteins in human urine. Sci. China Life Sci. 2019, 62, 1514–1520. [Google Scholar] [CrossRef]
- Zhao, M.; Li, M.; Li, X.; Shao, C.; Yin, J.; Gao, Y. Dynamic changes of urinary proteins in a focal segmental glomerulosclerosis rat model. Proteome Sci. 2014, 12, 42. [Google Scholar] [CrossRef]
- Hatters, D.M.; Peters-Libeu, C.A.; Weisgraber, K.H. Apolipoprotein E structure: Insights into function. Trends Biochem. Sci. 2006, 31, 445–454. [Google Scholar] [CrossRef]
- Rosenfeld, M.E.; Polinsky, P.; Virmani, R.; Kauser, K.; Rubanyi, G.; Schwartz, S.M. Advanced atherosclerotic lesions in the innominate artery of the ApoE knockout mouse. Arter. Thromb. Vasc. Biol. 2000, 20, 2587–2592. [Google Scholar] [CrossRef]
- Qu, G.; Wu, Q.; Zhao, B.; Miao, J.; Su, L. The promotion effect of novel magnetic nanoparticles on atherosclerotic plaque vulnerability in apolipoprotein E(-/-) mice. Toxicology 2019, 419, 24–31. [Google Scholar] [CrossRef] [PubMed]
- Wisniewski, J.R.; Zougman, A.; Nagaraj, N.; Mann, M. Universal sample preparation method for proteome analysis. Nat. Methods 2009, 6, 359–362. [Google Scholar] [CrossRef] [PubMed]
- Bruderer, R.; Bernhardt, O.M.; Gandhi, T.; Miladinovic, S.M.; Cheng, L.Y.; Messner, S.; Ehrenberger, T.; Zanotelli, V.; Butscheid, Y.; Escher, C.; et al. Extending the limits of quantitative proteome profiling with data-independent acquisition and application to acetaminophen-treated three-dimensional liver microtissues. Mol. Cell. Proteom. 2015, 14, 1400–1410. [Google Scholar] [CrossRef]
- Chi, H.; Liu, C.; Yang, H.; Zeng, W.F.; Wu, L.; Zhou, W.J.; Wang, R.M.; Niu, X.N.; Ding, Y.H.; Zhang, Y.; et al. Comprehensive identification of peptides in tandem mass spectra using an efficient open search engine. Nat. Biotechnol. 2018, 36, 1059–1061. [Google Scholar] [CrossRef] [PubMed]
- Armitage, E.G.; Godzien, J.; Alonso-Herranz, V.; Lopez-Gonzalvez, A.; Barbas, C. Missing value imputation strategies for metabolomics data. Electrophoresis 2015, 36, 3050–3060. [Google Scholar] [CrossRef]
- Wang, S.; Li, W.; Hu, L.; Cheng, J.; Yang, H.; Liu, Y. NAguideR: Performing and prioritizing missing value imputations for consistent bottom-up proteomic analyses. Nucleic Acids Res. 2020, 48, e83. [Google Scholar] [CrossRef]
- Huang, D.W.; Sherman, B.T.; Lempicki, R.A. Systematic and integrative analysis of large gene lists using DAVID bioinformatics resources. Nat. Protoc. 2009, 4, 44–57. [Google Scholar] [CrossRef]
- Ma, J.; Chen, T.; Wu, S.; Yang, C.; Bai, M.; Shu, K.; Li, K.; Zhang, G.; Jin, Z.; He, F.; et al. iProX: An integrated proteome resource. Nucleic Acids Res. 2019, 47, D1211–D1217. [Google Scholar] [CrossRef]
- Kwak, J.; Strasser, E.; Luzynski, K.; Thoss, M.; Penn, D.J. Are MUPs a Toxic Waste Disposal System? PLoS ONE 2016, 11, e0151474. [Google Scholar] [CrossRef]
- De Giorgio, M.R.; Yoshioka, M.; Riedl, I.; Moreault, O.; Cherizol, R.G.; Shah, A.A.; Blin, N.; Richard, D.; St-Amand, J. Trefoil factor family member 2 (Tff2) KO mice are protected from high-fat diet-induced obesity. Obesity 2013, 21, 1389–1395. [Google Scholar] [CrossRef]
- Carroll, W.X.; Kalupahana, N.S.; Booker, S.L.; Siriwardhana, N.; Lemieux, M.; Saxton, A.M.; Moustaid-Moussa, N. Angiotensinogen gene silencing reduces markers of lipid accumulation and inflammation in cultured adipocytes. Front. Endocrinol. 2013, 4, 10. [Google Scholar] [CrossRef] [PubMed]
- von zur Muhlen, C.; Schiffer, E.; Sackmann, C.; Zurbig, P.; Neudorfer, I.; Zirlik, A.; Htun, N.; Iphofer, A.; Jansch, L.; Mischak, H.; et al. Urine proteome analysis reflects atherosclerotic disease in an ApoE-/- mouse model and allows the discovery of new candidate biomarkers in mouse and human atherosclerosis. Mol. Cell. Proteom. 2012, 11, M111.013847. [Google Scholar] [CrossRef]
- Liu, H.; Dong, W.; Lin, Z.; Lu, J.; Wan, H.; Zhou, Z.; Liu, Z. CCN4 regulates vascular smooth muscle cell migration and proliferation. Mol. Cells 2013, 36, 112–118. [Google Scholar] [CrossRef] [PubMed]
- Celik, S.F.; Celik, E. Subclinical atherosclerosis and impaired cardiac autonomic control in pediatric patients with Vitamin B12 deficiency. Niger. J. Clin. Pract. 2018, 21, 1012–1016. [Google Scholar] [CrossRef] [PubMed]
- K, M.; Adole, P.S.; Vinod, K.V.; Balamurugan, N. Association of serum regenerating islet-derived protein 3-beta and oncostatin-M levels with the risk of acute coronary syndrome in patients with type 2 diabetes mellitus—A pilot study. Diabetes Metab. Syndr. 2020, 14, 1087–1092. [Google Scholar] [CrossRef]
- Muendlein, A.; Stark, N.; Rein, P.; Saely, C.H.; Geller-Rhomberg, S.; Geiger, K.; Vonbank, A.; Drexel, H. Are AHSG polymorphisms directly associated with coronary atherosclerosis? Clin. Chim. Acta 2012, 413, 287–290. [Google Scholar] [CrossRef]
- de la Cuesta, F.; Zubiri, I.; Maroto, A.S.; Posada, M.; Padial, L.R.; Vivanco, F.; Alvarez-Llamas, G.; Barderas, M.G. Deregulation of smooth muscle cell cytoskeleton within the human atherosclerotic coronary media layer. J. Proteom. 2013, 82, 155–165. [Google Scholar] [CrossRef]
- Ali, H.; Emoto, N.; Yagi, K.; Vignon-Zellweger, N.; Nakayama, K.; Hatakeyama, K.; Asada, Y.; Rikitake, Y.; Hirata, K. Localization and characterization of a novel secreted protein, SCUBE2, in the development and progression of atherosclerosis. Kobe J. Med. Sci. 2013, 59, E122–E131. [Google Scholar]
- Langlois, M.R.; Delanghe, J.R. Biological and clinical significance of haptoglobin polymorphism in humans. Clin. Chem. 1996, 42, 1589–1600. [Google Scholar] [CrossRef]
- Wigren, M.; Rattik, S.; Yao Mattisson, I.; Tomas, L.; Gronberg, C.; Soderberg, I.; Alm, R.; Sundius, L.; Ljungcrantz, I.; Bjorkbacka, H.; et al. Lack of Ability to Present Antigens on Major Histocompatibility Complex Class II Molecules Aggravates Atherosclerosis in ApoE(-/-) Mice. Circulation 2019, 139, 2554–2566. [Google Scholar] [CrossRef]
- Dinarello, C.A. Interleukin-18 and the pathogenesis of inflammatory diseases. Semin. Nephrol. 2007, 27, 98–114. [Google Scholar] [CrossRef]
- Wu, G.; Huang, J.; Wei, G.; Liu, L.; Pang, S.; Yan, B. LAMP-2 gene expression in peripheral leukocytes is increased in patients with coronary artery disease. Clin. Cardiol. 2011, 34, 239–243. [Google Scholar] [CrossRef] [PubMed]
- Fujishima, Y.; Maeda, N.; Matsuda, K.; Masuda, S.; Mori, T.; Fukuda, S.; Sekimoto, R.; Yamaoka, M.; Obata, Y.; Kita, S.; et al. Adiponectin association with T-cadherin protects against neointima proliferation and atherosclerosis. FASEB J. 2017, 31, 1571–1583. [Google Scholar] [CrossRef] [PubMed]
- Stenman, S.; von Smitten, K.; Vaheri, A. Fibronectin and atherosclerosis. Acta Med. Scand. Suppl. 1980, 642, 165–170. [Google Scholar] [CrossRef]
- Ichiki, T. Thyroid hormone and atherosclerosis. Vasc. Pharmacol. 2010, 52, 151–156. [Google Scholar] [CrossRef]
- Kibel, A.; Belovari, T.; Drenjancevic-Peric, I. The role of transferrin in atherosclerosis. Med. Hypotheses 2008, 70, 793–797. [Google Scholar] [CrossRef] [PubMed]
- Wagsater, D.; Johansson, D.; Fontaine, V.; Vorkapic, E.; Backlund, A.; Razuvaev, A.; Mayranpaa, M.I.; Hjerpe, C.; Caidahl, K.; Hamsten, A.; et al. Serine protease inhibitor A3 in atherosclerosis and aneurysm disease. Int. J. Mol. Med. 2012, 30, 288–294. [Google Scholar] [CrossRef] [PubMed]
- Sauro, M.D.; Zorn, N.E. Prolactin induces proliferation of vascular smooth muscle cells through a protein kinase C-dependent mechanism. J. Cell Physiol. 1991, 148, 133–138. [Google Scholar] [CrossRef]
- Hartman, J.; Frishman, W.H. Inflammation and atherosclerosis: A review of the role of interleukin-6 in the development of atherosclerosis and the potential for targeted drug therapy. Cardiol. Rev. 2014, 22, 147–151. [Google Scholar] [CrossRef]
- Tinajero, M.G.; Gotlieb, A.I. Recent Developments in Vascular Adventitial Pathobiology: The Dynamic Adventitia as a Complex Regulator of Vascular Disease. Am. J. Pathol. 2020, 190, 520–534. [Google Scholar] [CrossRef]
- Natarelli, L.; Schober, A. MicroRNAs and the response to injury in atherosclerosis. Hamostaseologie 2015, 35, 142–150. [Google Scholar] [CrossRef] [PubMed]
- Wight, T.N. The extracellular matrix and atherosclerosis. Curr. Opin. Lipidol. 1995, 6, 326–334. [Google Scholar] [CrossRef] [PubMed]
- Fernandez-Murga, M.L.; Vinue, A.; Caeiro, J.R.; Guede, D.; Tarin, J.J.; Andres, V.; Cano, A. Impact of estrogens on atherosclerosis and bone in the apolipoprotein E-deficient mouse model. Menopause 2015, 22, 428–436. [Google Scholar] [CrossRef] [PubMed]
- Isenovic, E.R.; Soskic, S.; Trpkovic, A.; Dobutovic, B.; Popovic, M.; Gluvic, Z.; Putnikovic, B.; Marche, P. Insulin, thrombine, ERK1/2 kinase and vascular smooth muscle cells proliferation. Curr. Pharm. Des. 2010, 16, 3895–3902. [Google Scholar] [CrossRef] [PubMed]
- Chi, Z.; Melendez, A.J. Role of cell adhesion molecules and immune-cell migration in the initiation, onset and development of atherosclerosis. Cell Adhes. Migr. 2007, 1, 171–175. [Google Scholar] [CrossRef]
- Whicher, J.; Biasucci, L.; Rifai, N. Inflammation, the acute phase response and atherosclerosis. Clin. Chem. Lab. Med. 1999, 37, 495–503. [Google Scholar] [CrossRef]
- van Dijk, R.A.; Rijs, K.; Wezel, A.; Hamming, J.F.; Kolodgie, F.D.; Virmani, R.; Schaapherder, A.F.; Lindeman, J.H. Systematic Evaluation of the Cellular Innate Immune Response During the Process of Human Atherosclerosis. J. Am. Heart Assoc. 2016, 5, e002860. [Google Scholar] [CrossRef]
- Tedgui, A.; Mallat, Z. Cytokines in atherosclerosis: Pathogenic and regulatory pathways. Physiol. Rev. 2006, 86, 515–581. [Google Scholar] [CrossRef]
- Garcia-Touchard, A.; Henry, T.D.; Sangiorgi, G.; Spagnoli, L.G.; Mauriello, A.; Conover, C.; Schwartz, R.S. Extracellular proteases in atherosclerosis and restenosis. Arter. Thromb. Vasc. Biol. 2005, 25, 1119–1127. [Google Scholar] [CrossRef]
- Libby, P.; Buring, J.E.; Badimon, L.; Hansson, G.K.; Deanfield, J.; Bittencourt, M.S.; Tokgozoglu, L.; Lewis, E.F. Atherosclerosis. Nat. Rev. Dis. Prim. 2019, 5, 56. [Google Scholar] [CrossRef]
- Hansson, G.K.; Robertson, A.K.; Soderberg-Naucler, C. Inflammation and atherosclerosis. Annu. Rev. Pathol. 2006, 1, 297–329. [Google Scholar] [CrossRef]
- Sueishi, K.; Ichikawa, K.; Kato, K.; Nakagawa, K.; Chen, Y.X. Atherosclerosis: Coagulation and fibrinolysis. Semin. Thromb. Hemost. 1998, 24, 255–260. [Google Scholar] [CrossRef] [PubMed]
- Linton, M.F.; Moslehi, J.J.; Babaev, V.R. Akt Signaling in Macrophage Polarization, Survival, and Atherosclerosis. Int. J. Mol. Sci. 2019, 20, 2703. [Google Scholar] [CrossRef]
- Ustundag, S.; Yilmaz, G.; Sevinc, C.; Akpinar, S.; Temizoz, O.; Sut, N.; Ustundag, A. Carotid intima media thickness is independently associated with urinary sodium excretion in patients with chronic kidney disease. Ren. Fail. 2015, 37, 1285–1292. [Google Scholar] [CrossRef] [PubMed]
- Drapkina, O.M.; Gegenava, B.B.; Fomin, V.V. The role of the mLDL-induced activation of the complement system classical pathway and C3 expression stimulation in atherosclerosis. Ter. Arkhiv 2018, 90, 100–104. [Google Scholar] [CrossRef] [PubMed]
- Jomova, K.; Valko, M. Advances in metal-induced oxidative stress and human disease. Toxicology 2011, 283, 65–87. [Google Scholar] [CrossRef]
- Nathan, L.; Chaudhuri, G. Estrogens and atherosclerosis. Annu. Rev. Pharmacol. Toxicol. 1997, 37, 477–515. [Google Scholar] [CrossRef]
- Wunderer, F.; Traeger, L.; Sigurslid, H.H.; Meybohm, P.; Bloch, D.B.; Malhotra, R. The role of hepcidin and iron homeostasis in atherosclerosis. Pharmacol. Res. 2020, 153, 104664. [Google Scholar] [CrossRef] [PubMed]
- Williams, J.W.; Elvington, A.; Kessler, S.; Wohltmann, M.; Wu, G.F.; Randolph, G.J. B Cell-Mediated Antigen Presentation through MHC Class II Is Dispensable for Atherosclerosis Progression. Immunohorizons 2019, 3, 37–44. [Google Scholar] [CrossRef]
- Qiao, L.; Wang, H.F.; Xiang, L.; Ma, J.; Zhu, Q.; Xu, D.; Zheng, H.; Peng, J.Q.; Zhang, S.; Lu, H.X.; et al. Deficient Chaperone-Mediated Autophagy Promotes Lipid Accumulation in Macrophage. J. Cardiovasc. Transl. Res. 2020, 14, 661–669. [Google Scholar] [CrossRef]
- Sano, H.; Hsu, D.K.; Yu, L.; Apgar, J.R.; Kuwabara, I.; Yamanaka, T.; Hirashima, M.; Liu, F.T. Human galectin-3 is a novel chemoattractant for monocytes and macrophages. J. Immunol. 2000, 165, 2156–2164. [Google Scholar] [CrossRef] [PubMed]
- Papaspyridonos, M.; McNeill, E.; de Bono, J.P.; Smith, A.; Burnand, K.G.; Channon, K.M.; Greaves, D.R. Galectin-3 is an amplifier of inflammation in atherosclerotic plaque progression through macrophage activation and monocyte chemoattraction. Arter. Thromb. Vasc. Biol. 2008, 28, 433–440. [Google Scholar] [CrossRef] [PubMed]
- Sanchez, M.C.; Chiabrando, G.A.; Vides, M.A. Pregnancy zone protein-tissue-type plasminogen activator complexes bind to low-density lipoprotein receptor-related protein (LRP). Arch. Biochem. Biophys. 2001, 389, 218–222. [Google Scholar] [CrossRef] [PubMed]
- Navarro, S.; Bonet, E.; Estelles, A.; Montes, R.; Hermida, J.; Martos, L.; Espana, F.; Medina, P. The endothelial cell protein C receptor: Its role in thrombosis. Thromb. Res. 2011, 128, 410–416. [Google Scholar] [CrossRef]
- Lin, M.S.; Hsu, H.C.; Lin, L.C.; Li, H.Y.; Lee, B.C.; Lee, Y.T.; Chen, M.F. Higher glutathione peroxidase expression in thoracic aorta as a protective factor against oxidative stress and atherosclerosis in rabbits. Cardiology 2007, 108, 381–386. [Google Scholar] [CrossRef]
- Li, W.; Kornmark, L.; Jonasson, L.; Forssell, C.; Yuan, X.M. Cathepsin L is significantly associated with apoptosis and plaque destabilization in human atherosclerosis. Atherosclerosis 2009, 202, 92–102. [Google Scholar] [CrossRef]
- Ohta, T.; Saku, K.; Takata, K.; Adachi, N. Soluble vascular cell-adhesion molecule-1 and soluble intercellular adhesion molecule-1 correlate with lipid and apolipoprotein risk factors for coronary artery disease in children. Eur. J. Pediatr. 1999, 158, 592–598. [Google Scholar] [CrossRef]
- Rashad, N.M.; El-Shal, A.S.; Abomandour, H.G.; Aboelfath, A.; Rafeek, M.; Badr, M.S.; Ali, A.E.; Yousef, M.S.; Fathy, M.A.; Sharaf El Din, M. Intercellular adhesion molecule-1 expression and serum levels as markers of pre-clinical atherosclerosis in polycystic ovary syndrome. J. Ovarian Res. 2019, 12, 97. [Google Scholar] [CrossRef]
- Fortin, C.F.; McDonald, P.P.; Lesur, O.; Fulop, T., Jr. Aging and neutrophils: There is still much to do. Rejuvenation Res. 2008, 11, 873–882. [Google Scholar] [CrossRef]
- Li, Y.B.; Zhang, Q.H.; Chen, Z.; He, Z.J.; Yi, G.H. Oxidized low-density lipoprotein attenuated desmoglein 1 and desmocollin 2 expression via LOX-1/Ca(2+)/PKC-beta signal in human umbilical vein endothelial cells. Biochem. Biophys. Res. Commun. 2015, 468, 380–386. [Google Scholar] [CrossRef]
- Jiang, K.; Rankin, C.R.; Nava, P.; Sumagin, R.; Kamekura, R.; Stowell, S.R.; Feng, M.; Parkos, C.A.; Nusrat, A. Galectin-3 regulates desmoglein-2 and intestinal epithelial intercellular adhesion. J. Biol. Chem. 2014, 289, 10510–10517. [Google Scholar] [CrossRef] [PubMed]
- Yanai, H.; Yoshida, H.; Tomono, Y.; Tada, N.; Chiba, H. The possible contribution of a general glycosphingolipid transporter, GM2 activator protein, to atherosclerosis. J. Atheroscler. Thromb. 2006, 13, 281–285. [Google Scholar] [CrossRef] [PubMed][Green Version]
- Ozkok, A.; Elcioglu, O.C.; Cukadar, T.; Bakan, A.; Sasak, G.; Atilgan, K.G.; Alisir, S.; Kanbay, M.; Covic, A.; Odabas, A.R. Low serum pancreatic enzyme levels predict mortality and are associated with malnutrition-inflammation-atherosclerosis syndrome in patients with chronic kidney disease. Int. Urol. Nephrol. 2013, 45, 477–484. [Google Scholar] [CrossRef] [PubMed]
- Kadowaki, T.; Kido, M.A.; Hatakeyama, J.; Okamoto, K.; Tsukuba, T.; Yamamoto, K. Defective adipose tissue development associated with hepatomegaly in cathepsin E-deficient mice fed a high-fat diet. Biochem. Biophys. Res. Commun. 2014, 446, 212–217. [Google Scholar] [CrossRef]
- Grolli, S.; Merli, E.; Conti, V.; Scaltriti, E.; Ramoni, R. Odorant binding protein has the biochemical properties of a scavenger for 4-hydroxy-2-nonenal in mammalian nasal mucosa. FEBS J. 2006, 273, 5131–5142. [Google Scholar] [CrossRef]
- Niccoli, G.; Ferrante, G.; Cosentino, N.; Conte, M.; Belloni, F.; Marino, M.; Baca, M.; Montone, R.A.; Sabato, V.; Schiavino, D.; et al. Eosinophil cationic protein: A new biomarker of coronary atherosclerosis. Atherosclerosis 2010, 211, 606–611. [Google Scholar] [CrossRef]
- Yang, C.S.; Wei, Y.S.; Tsai, H.L.; Cheong, I.S.; Chang, S.J.; Chou, H.C.; Lee, Y.R.; Chan, H.L. Proteomic analysis of prognostic plasma biomarkers in peripheral arterial occlusive disease. Mol. Biosyst. 2017, 13, 1297–1303. [Google Scholar] [CrossRef]
- Josefs, T.; Barrett, T.J.; Brown, E.J.; Quezada, A.; Wu, X.; Voisin, M.; Amengual, J.; Fisher, E.A. Neutrophil extracellular traps promote macrophage inflammation and impair atherosclerosis resolution in diabetic mice. JCI Insight 2020, 5, e134796. [Google Scholar] [CrossRef]
- Posma, J.J.; Posthuma, J.J.; Spronk, H.M. Coagulation and non-coagulation effects of thrombin. J. Thromb. Haemost. 2016, 14, 1908–1916. [Google Scholar] [CrossRef]
- Shin, S.K.; Ha, T.Y.; McGregor, R.A.; Choi, M.S. Long-term curcumin administration protects against atherosclerosis via hepatic regulation of lipoprotein cholesterol metabolism. Mol. Nutr. Food Res. 2011, 55, 1829–1840. [Google Scholar] [CrossRef]
- Krolikoski, M.; Monslow, J.; Pure, E. The CD44-HA axis and inflammation in atherosclerosis: A temporal perspective. Matrix Biol. 2019, 78–79, 201–218. [Google Scholar] [CrossRef]
- Smeets, E.; Meiler, S.; Lutgens, E. Lymphocytic tumor necrosis factor receptor superfamily co-stimulatory molecules in the pathogenesis of atherosclerosis. Curr. Opin. Lipidol. 2013, 24, 518–524. [Google Scholar] [CrossRef] [PubMed][Green Version]
- van der Meer, J.H.; van der Poll, T.; van ‘t Veer, C. TAM receptors, Gas6, and protein S: Roles in inflammation and hemostasis. Blood 2014, 123, 2460–2469. [Google Scholar] [CrossRef] [PubMed]
- Puerta, A.; Diez-Masa, J.C.; Martin-Alvarez, P.J.; Martin-Ventura, J.L.; Barbas, C.; Tunon, J.; Egido, J.; de Frutos, M. Study of the capillary electrophoresis profile of intact alpha-1-acid glycoprotein isoforms as a biomarker of atherothrombosis. Analyst 2011, 136, 816–822. [Google Scholar] [CrossRef]
- Jiang, F.; Yang, J.; Zhang, Y.; Dong, M.; Wang, S.; Zhang, Q.; Liu, F.F.; Zhang, K.; Zhang, C. Angiotensin-converting enzyme 2 and angiotensin 1-7: Novel therapeutic targets. Nat. Rev. Cardiol. 2014, 11, 413–426. [Google Scholar] [CrossRef] [PubMed]
- Wieland, T.; Attwood, P.V. Alterations in reversible protein histidine phosphorylation as intracellular signals in cardiovascular disease. Front. Pharmacol. 2015, 6, 173. [Google Scholar] [CrossRef] [PubMed]
- Chen, H.; Gao, W.; Yang, Y.; Guo, S.; Wang, H.; Wang, W.; Zhang, S.; Zhou, Q.; Xu, H.; Yao, J.; et al. Inhibition of VDAC1 prevents Ca(2)(+)-mediated oxidative stress and apoptosis induced by 5-aminolevulinic acid mediated sonodynamic therapy in THP-1 macrophages. Apoptosis 2014, 19, 1712–1726. [Google Scholar] [CrossRef]
- Edfeldt, K.; Agerberth, B.; Rottenberg, M.E.; Gudmundsson, G.H.; Wang, X.B.; Mandal, K.; Xu, Q.; Yan, Z.Q. Involvement of the antimicrobial peptide LL-37 in human atherosclerosis. Arter. Thromb. Vasc. Biol. 2006, 26, 1551–1557. [Google Scholar] [CrossRef]
- Wang, L.; Huang, Z.; Huang, W.; Chen, X.; Shan, P.; Zhong, P.; Khan, Z.; Wang, J.; Fang, Q.; Liang, G.; et al. Inhibition of epidermal growth factor receptor attenuates atherosclerosis via decreasing inflammation and oxidative stress. Sci. Rep. 2017, 8, 45917. [Google Scholar] [CrossRef]
- Zhao, C.F.; Herrington, D.M. The function of cathepsins B, D, and X in atherosclerosis. Am. J. Cardiovasc. Dis. 2016, 6, 163–170. [Google Scholar]
- Biros, E.; Moran, C.S.; Maguire, J.; Holliday, E.; Levi, C.; Golledge, J. Upregulation of arylsulfatase B in carotid atherosclerosis is associated with symptoms of cerebral embolization. Sci. Rep. 2017, 7, 4338. [Google Scholar] [CrossRef] [PubMed]
- Hernandez-Romero, D.; Ruiz-Nodar, J.M.; Marin, F.; Tello-Montoliu, A.; Roldan, V.; Mainar, L.; Perez-Andreu, V.; Anton, A.I.; Bonaque, J.C.; Valdes, M.; et al. CALU A29809G polymorphism in coronary atherothrombosis: Implications for coronary calcification and prognosis. Ann. Med. 2010, 42, 439–446. [Google Scholar] [CrossRef] [PubMed]
- Asano, T.; Sakosda, H.; Fujishiro, M.; Anai, M.; Kushiyama, A.; Horike, N.; Kamata, H.; Ogihara, T.; Kurihara, H.; Uchijima, Y. Physiological significance of resistin and resistin-like molecules in the inflammatory process and insulin resistance. Curr. Diabetes Rev. 2006, 2, 449–454. [Google Scholar] [CrossRef] [PubMed]
- Haversen, L.; Sundelin, J.P.; Mardinoglu, A.; Rutberg, M.; Stahlman, M.; Wilhelmsson, U.; Hulten, L.M.; Pekny, M.; Fogelstrand, P.; Bentzon, J.F.; et al. Vimentin deficiency in macrophages induces increased oxidative stress and vascular inflammation but attenuates atherosclerosis in mice. Sci. Rep. 2018, 8, 16973. [Google Scholar] [CrossRef] [PubMed]
- Oszajca, K.; Wronski, K.; Janiszewska, G.; Bienkiewicz, M.; Panek, M.; Bartkowiak, J.; Szemraj, J. Association analysis of genetic polymorphisms of factor V, factor VII and fibrinogen beta chain genes with human abdominal aortic aneurysm. Exp. Ther. Med. 2012, 4, 514–518. [Google Scholar] [CrossRef] [PubMed][Green Version]
- Li, Y.Q.; Ngo, A.; Hoffmann, P.; Ferrante, A.; Hii, C.S. Regulation of endothelial cell survival and death by the MAP kinase/ERK kinase kinase 3-glyceraldehyde-3-phosphate dehydrogenase signaling axis. Cell Signal. 2019, 58, 20–33. [Google Scholar] [CrossRef]
- Fukai, T.; Galis, Z.S.; Meng, X.P.; Parthasarathy, S.; Harrison, D.G. Vascular expression of extracellular superoxide dismutase in atherosclerosis. J. Clin. Investig. 1998, 101, 2101–2111. [Google Scholar] [CrossRef]
- Yu, X.H.; Jiang, N.; Yao, P.B.; Zheng, X.L.; Cayabyab, F.S.; Tang, C.K. NPC1, intracellular cholesterol trafficking and atherosclerosis. Clin. Chim. Acta 2014, 429, 69–75. [Google Scholar] [CrossRef]
- Sun, J.; Wang, Z.; Wang, X. Suppression of LRRC19 promotes cutaneous wound healing in pressure ulcers in mice. Organogenesis 2018, 14, 13–24. [Google Scholar] [CrossRef]
- Gouni-Berthold, I.; Krone, W.; Berthold, H.K. Vitamin D and cardiovascular disease. Curr. Vasc. Pharmacol. 2009, 7, 414–422. [Google Scholar] [CrossRef]
- Arenas de Larriva, A.P.; Alonso, A.; Norby, F.L.; Roetker, N.S.; Folsom, A.R. Circulating ceruloplasmin, ceruloplasmin-associated genes and the incidence of venous thromboembolism in the Atherosclerosis Risk in Communities study. J. Thromb. Haemost. 2019, 17, 818–826. [Google Scholar] [CrossRef] [PubMed]
- Pollard, R.D.; Blesso, C.N.; Zabalawi, M.; Fulp, B.; Gerelus, M.; Zhu, X.; Lyons, E.W.; Nuradin, N.; Francone, O.L.; Li, X.A.; et al. Procollagen C-endopeptidase Enhancer Protein 2 (PCPE2) Reduces Atherosclerosis in Mice by Enhancing Scavenger Receptor Class B1 (SR-BI)-mediated High-density Lipoprotein (HDL)-Cholesteryl Ester Uptake. J. Biol. Chem. 2015, 290, 15496–15511. [Google Scholar] [CrossRef] [PubMed]
- Teunissen, P.F.; Boshuizen, M.C.; Hollander, M.R.; Biesbroek, P.S.; van der Hoeven, N.W.; Mol, J.Q.; Gijbels, M.J.; van der Velden, S.; van der Pouw Kraan, T.C.; Horrevoets, A.J.; et al. MAb therapy against the IFN-alpha/beta receptor subunit 1 stimulates arteriogenesis in a murine hindlimb ischaemia model without enhancing atherosclerotic burden. Cardiovasc. Res. 2015, 107, 255–266. [Google Scholar] [CrossRef] [PubMed]
- Bachhawat, A.K.; Yadav, S. The glutathione cycle: Glutathione metabolism beyond the gamma-glutamyl cycle. IUBMB Life 2018, 70, 585–592. [Google Scholar] [CrossRef] [PubMed]
- Presnell, C.E.; Bhatti, G.; Numan, L.S.; Lerche, M.; Alkhateeb, S.K.; Ghalib, M.; Shammaa, M.; Kavdia, M. Computational insights into the role of glutathione in oxidative stress. Curr. Neurovasc. Res. 2013, 10, 185–194. [Google Scholar] [CrossRef]
- Ichiki, T.; Izumi, R.; Cataliotti, A.; Larsen, A.M.; Sandberg, S.M.; Burnett, J.C., Jr. Endothelial permeability in vitro and in vivo: Protective actions of ANP and omapatrilat in experimental atherosclerosis. Peptides 2013, 48, 21–26. [Google Scholar] [CrossRef]
- Inoue, M.; Ishida, T.; Yasuda, T.; Toh, R.; Hara, T.; Cangara, H.M.; Rikitake, Y.; Taira, K.; Sun, L.; Kundu, R.K.; et al. Endothelial cell-selective adhesion molecule modulates atherosclerosis through plaque angiogenesis and monocyte-endothelial interaction. Microvasc. Res. 2010, 80, 179–187. [Google Scholar] [CrossRef]
- Franca, K.C.; Martinez, P.A.; Prado, M.L.; Lo, S.M.; Borges, B.E.; Zanata, S.M.; San Martin, A.; Nakao, L.S. Quiescin/sulfhydryl oxidase 1b (QSOX1b) induces migration and proliferation of vascular smooth muscle cells by distinct redox pathways. Arch. Biochem. Biophys. 2020, 679, 108220. [Google Scholar] [CrossRef]
- Bian, T.; Li, H.; Zhou, Q.; Ni, C.; Zhang, Y.; Yan, F. Human beta-Defensin 3 Reduces TNF-alpha-Induced Inflammation and Monocyte Adhesion in Human Umbilical Vein Endothelial Cells. Mediat. Inflamm. 2017, 2017, 8529542. [Google Scholar] [CrossRef]
- Couchie, D.; Vaisman, B.; Abderrazak, A.; Mahmood, D.F.D.; Hamza, M.M.; Canesi, F.; Diderot, V.; El Hadri, K.; Negre-Salvayre, A.; Le Page, A.; et al. Human Plasma Thioredoxin-80 Increases With Age and in ApoE(-/-) Mice Induces Inflammation, Angiogenesis, and Atherosclerosis. Circulation 2017, 136, 464–475. [Google Scholar] [CrossRef]
- Fu, X.; Huang, X.; Li, P.; Chen, W.; Xia, M. 7-Ketocholesterol inhibits isocitrate dehydrogenase 2 expression and impairs endothelial function via microRNA-144. Free Radic. Biol. Med. 2014, 71, 1–15. [Google Scholar] [CrossRef] [PubMed]
- Smith, J.D. Apolipoprotein A-I and its mimetics for the treatment of atherosclerosis. Curr. Opin. Investig. Drugs 2010, 11, 989–996. [Google Scholar] [PubMed]
- Hewing, B.; Ludwig, A.; Dan, C.; Potzsch, M.; Hannemann, C.; Petry, A.; Lauer, D.; Gorlach, A.; Kaschina, E.; Muller, D.N.; et al. Immunoproteasome subunit ss5i/LMP7-deficiency in atherosclerosis. Sci. Rep. 2017, 7, 13342. [Google Scholar] [CrossRef] [PubMed]
- Zhang, Y.; Huang, H.; Ma, Y.; Sun, Y.; Wang, G.; Tang, L. Association of the KLK1 rs5516 G allele and the ACE D allele with aortic aneurysm and atherosclerotic stenosis. Medicine 2016, 95, e5120. [Google Scholar] [CrossRef] [PubMed]
- Lewis, R.D.; Jackson, C.L.; Morgan, B.P.; Hughes, T.R. The membrane attack complex of complement drives the progression of atherosclerosis in apolipoprotein E knockout mice. Mol. Immunol. 2010, 47, 1098–1105. [Google Scholar] [CrossRef]
- Karshovska, E.; Zhao, Z.; Blanchet, X.; Schmitt, M.M.; Bidzhekov, K.; Soehnlein, O.; von Hundelshausen, P.; Mattheij, N.J.; Cosemans, J.M.; Megens, R.T.; et al. Hyperreactivity of junctional adhesion molecule A-deficient platelets accelerates atherosclerosis in hyperlipidemic mice. Circ. Res. 2015, 116, 587–599. [Google Scholar] [CrossRef]
- Allawi, A.A.D. Malnutrition, inflamation and atherosclerosis (MIA syndrome) in patients with end stage renal disease on maintenance hemodialysis (a single centre experience). Diabetes Metab. Syndr. 2018, 12, 91–97. [Google Scholar] [CrossRef]
- Segedy, A.K.; Pyle, A.L.; Li, B.; Zhang, Y.; Babaev, V.R.; Jat, P.; Fazio, S.; Atkinson, J.B.; Linton, M.F.; Young, P.P. Identification of small proline-rich repeat protein 3 as a novel atheroprotective factor that promotes adaptive Akt signaling in vascular smooth muscle cells. Arter. Thromb. Vasc. Biol. 2014, 34, 2527–2536. [Google Scholar] [CrossRef][Green Version]
- Burke, R.M.; Lighthouse, J.K.; Quijada, P.; Dirkx, R.A., Jr.; Rosenberg, A.; Moravec, C.S.; Alexis, J.D.; Small, E.M. Small proline-rich protein 2B drives stress-dependent p53 degradation and fibroblast proliferation in heart failure. Proc. Natl. Acad. Sci. USA 2018, 115, E3436–E3445. [Google Scholar] [CrossRef]
- Madrigal-Matute, J.; Fernandez-Garcia, C.E.; Blanco-Colio, L.M.; Burillo, E.; Fortuno, A.; Martinez-Pinna, R.; Llamas-Granda, P.; Beloqui, O.; Egido, J.; Zalba, G.; et al. Thioredoxin-1/peroxiredoxin-1 as sensors of oxidative stress mediated by NADPH oxidase activity in atherosclerosis. Free Radic. Biol. Med. 2015, 86, 352–361. [Google Scholar] [CrossRef]
- Yuan, L.; Wang, M.; Liu, T.; Lei, Y.; Miao, Q.; Li, Q.; Wang, H.; Zhang, G.; Hou, Y.; Chang, X. Carbonic Anhydrase 1-Mediated Calcification Is Associated With Atherosclerosis, and Methazolamide Alleviates Its Pathogenesis. Front. Pharmacol. 2019, 10, 766. [Google Scholar] [CrossRef] [PubMed]
- Zhang, P.; Riazy, M.; Gold, M.; Tsai, S.H.; McNagny, K.; Proud, C.; Duronio, V. Impairing eukaryotic elongation factor 2 kinase activity decreases atherosclerotic plaque formation. Can. J. Cardiol. 2014, 30, 1684–1688. [Google Scholar] [CrossRef] [PubMed]
- Habas, K.; Shang, L. Alterations in intercellular adhesion molecule 1 (ICAM-1) and vascular cell adhesion molecule 1 (VCAM-1) in human endothelial cells. Tissue Cell 2018, 54, 139–143. [Google Scholar] [CrossRef] [PubMed]
- Yu, H.; Moran, C.S.; Trollope, A.F.; Woodward, L.; Kinobe, R.; Rush, C.M.; Golledge, J. Angiopoietin-2 attenuates angiotensin II-induced aortic aneurysm and atherosclerosis in apolipoprotein E-deficient mice. Sci. Rep. 2016, 6, 35190. [Google Scholar] [CrossRef] [PubMed]
- Adada, M.; Luberto, C.; Canals, D. Inhibitors of the sphingomyelin cycle: Sphingomyelin synthases and sphingomyelinases. Chem. Phys. Lipids 2016, 197, 45–59. [Google Scholar] [CrossRef]
- Kohno, T.; Urao, N.; Ashino, T.; Sudhahar, V.; McKinney, R.D.; Hamakubo, T.; Iwanari, H.; Ushio-Fukai, M.; Fukai, T. Novel role of copper transport protein antioxidant-1 in neointimal formation after vascular injury. Arter. Thromb. Vasc. Biol. 2013, 33, 805–813. [Google Scholar] [CrossRef]
- Then, C.; Then, H.L.; Lechner, A.; Thorand, B.; Meisinger, C.; Heier, M.; Peters, A.; Koenig, W.; Rathmann, W.; Scherberich, J.; et al. Serum uromodulin and risk for cardiovascular morbidity and mortality in the community-based KORA F4 study. Atherosclerosis 2020, 297, 1–7. [Google Scholar] [CrossRef]
- Zhang, J.; Ma, L.; Zhang, J.; Huang, J.; Wei, G.; Liu, L.; Zhang, J.; Yan, B. Altered expression of lysosomal hydrolase, acid alpha-glucosidase, gene in coronary artery disease. Coron. Artery Dis. 2016, 27, 104–108. [Google Scholar] [CrossRef]
- Tawa, H.; Rikitake, Y.; Takahashi, M.; Amano, H.; Miyata, M.; Satomi-Kobayashi, S.; Kinugasa, M.; Nagamatsu, Y.; Majima, T.; Ogita, H.; et al. Role of afadin in vascular endothelial growth factor- and sphingosine 1-phosphate-induced angiogenesis. Circ. Res. 2010, 106, 1731–1742. [Google Scholar] [CrossRef]
- Kremen, M.; Krishnan, R.; Emery, I.; Hu, J.H.; Slezicki, K.I.; Wu, A.; Qian, K.; Du, L.; Plawman, A.; Stempien-Otero, A.; et al. Plasminogen mediates the atherogenic effects of macrophage-expressed urokinase and accelerates atherosclerosis in apoE-knockout mice. Proc. Natl. Acad. Sci. USA 2008, 105, 17109–17114. [Google Scholar] [CrossRef]
- Hemdahl, A.L.; Gabrielsen, A.; Zhu, C.; Eriksson, P.; Hedin, U.; Kastrup, J.; Thoren, P.; Hansson, G.K. Expression of neutrophil gelatinase-associated lipocalin in atherosclerosis and myocardial infarction. Arter. Thromb. Vasc. Biol. 2006, 26, 136–142. [Google Scholar] [CrossRef] [PubMed]
- Amighi, J.; Hoke, M.; Mlekusch, W.; Schlager, O.; Exner, M.; Haumer, M.; Pernicka, E.; Koppensteiner, R.; Minar, E.; Rumpold, H.; et al. Beta 2 microglobulin and the risk for cardiovascular events in patients with asymptomatic carotid atherosclerosis. Stroke 2011, 42, 1826–1833. [Google Scholar] [CrossRef] [PubMed]
- Ragolia, L.; Palaia, T.; Hall, C.E.; Maesaka, J.K.; Eguchi, N.; Urade, Y. Accelerated glucose intolerance, nephropathy, and atherosclerosis in prostaglandin D2 synthase knock-out mice. J. Biol. Chem. 2005, 280, 29946–29955. [Google Scholar] [CrossRef] [PubMed]
- Sena, B.F.; Figueiredo, J.L.; Aikawa, E. Cathepsin S As an Inhibitor of Cardiovascular Inflammation and Calcification in Chronic Kidney Disease. Front. Cardiovasc. Med. 2017, 4, 88. [Google Scholar] [CrossRef]
- Baeyens, N.; Latrache, I.; Yerna, X.; Noppe, G.; Horman, S.; Morel, N. Redundant control of migration and adhesion by ERM proteins in vascular smooth muscle cells. Biochem. Biophys. Res. Commun. 2013, 441, 579–585. [Google Scholar] [CrossRef]
- Nahon, J.E.; Hoekstra, M.; Van Eck, M. Total body proteoglycan 4 (Prg4) deficiency increases atherosclerosis susceptibility in apolipoprotein E knockout and low-density lipoprotein receptor knockout mice. Atherosclerosis 2018, 278, 315–316. [Google Scholar] [CrossRef]
- Jaisson, S.; Pietrement, C.; Gillery, P. Carbamylation-derived products: Bioactive compounds and potential biomarkers in chronic renal failure and atherosclerosis. Clin. Chem. 2011, 57, 1499–1505. [Google Scholar] [CrossRef]
- Wang, Q.; Liu, D.; Song, P.; Zou, M.H. Tryptophan-kynurenine pathway is dysregulated in inflammation, and immune activation. Front. Biosci. Landmark Ed. 2015, 20, 1116–1143. [Google Scholar] [CrossRef]
- Pamplona, R.; Dalfo, E.; Ayala, V.; Bellmunt, M.J.; Prat, J.; Ferrer, I.; Portero-Otin, M. Proteins in human brain cortex are modified by oxidation, glycoxidation, and lipoxidation. Effects of Alzheimer disease and identification of lipoxidation targets. J. Biol. Chem. 2005, 280, 21522–21530. [Google Scholar] [CrossRef] [PubMed]
- Nehler, M.R.; Taylor, L.M., Jr.; Porter, J.M. Homocysteinemia as a risk factor for atherosclerosis: A review. Cardiovasc. Surg. 1997, 5, 559–567. [Google Scholar] [CrossRef]
- Chen, S.S.; Tang, C.S.; Jin, H.F.; Du, J.B. Sulfur dioxide acts as a novel endogenous gaseous signaling molecule in the cardiovascular system. Chin. Med. J. 2011, 124, 1901–1905. [Google Scholar] [PubMed]
- Lee, S.E.; Park, Y.S. Korean Red Ginseng water extract inhibits COX-2 expression by suppressing p38 in acrolein-treated human endothelial cells. J. Ginseng Res. 2014, 38, 34–39. [Google Scholar] [CrossRef]
- McGrath, C.E.; Tallman, K.A.; Porter, N.A.; Marnett, L.J. Structure-activity analysis of diffusible lipid electrophiles associated with phospholipid peroxidation: 4-hydroxynonenal and 4-oxononenal analogues. Chem. Res. Toxicol. 2011, 24, 357–370. [Google Scholar] [CrossRef] [PubMed]
- Nagai, R.; Unno, Y.; Hayashi, M.C.; Masuda, S.; Hayase, F.; Kinae, N.; Horiuchi, S. Peroxynitrite induces formation of N( epsilon )-(carboxymethyl) lysine by the cleavage of Amadori product and generation of glucosone and glyoxal from glucose: Novel pathways for protein modification by peroxynitrite. Diabetes 2002, 51, 2833–2839. [Google Scholar] [CrossRef] [PubMed]
- Chuang, W.T.; Liu, Y.T.; Huang, C.S.; Lo, C.W.; Yao, H.T.; Chen, H.W.; Lii, C.K. Benzyl Isothiocyanate and Phenethyl Isothiocyanate Inhibit Adipogenesis and Hepatosteatosis in Mice with Obesity Induced by a High-Fat Diet. J. Agric. Food Chem. 2019, 67, 7136–7146. [Google Scholar] [CrossRef]
- Soares, E.S.A.K.; de Oliveira Cipriano Torres, D.; Santos Rocha, S.W.; dos Santos Gomes, F.O.; dos Santos Silva, B.; Donato, M.A.; Raposo, C.; Santos, A.C.; de Lima Mdo, C.; Galdino, S.L.; et al. Effect of new thiazolidine derivatives LPSF/GQ-02 and LPSF/GQ-16 on atherosclerotic lesions in LDL receptor-deficient mice (LDLR(-/-)). Cardiovasc. Pathol. 2013, 22, 81–90. [Google Scholar] [CrossRef]
- Liu, A.; Li, K.; Xu, L.; Si, M.; Teng, G.; Li, G.; Xue, J.; Liang, S.; Song, W. Metformin Delays the Development of Atherosclerosis in Type 1 Diabetes Mellitus via the Methylglyoxal Pathway. Diabetes Ther. 2020, 11, 633–642. [Google Scholar] [CrossRef]
- Becker, D.J.; Lowe, J.B. Fucose: Biosynthesis and biological function in mammals. Glycobiology 2003, 13, 41R–53R. [Google Scholar] [CrossRef]
- Yin, Z.; Zou, Y.; Wang, D.; Huang, X.; Xiong, S.; Cao, L.; Zhang, Y.; Sun, Y.; Zhang, N. Regulation of the Tec family of non-receptor tyrosine kinases in cardiovascular disease. Cell Death Discov. 2022, 8, 119. [Google Scholar] [CrossRef]
- Hatch, E.; Morrow, D.; Liu, W.; Cahill, P.A.; Redmond, E.M. Differential effects of alcohol and its metabolite acetaldehyde on vascular smooth muscle cell Notch signaling and growth. Am. J. Physiol. Heart Circ. Physiol. 2018, 314, H131–H137. [Google Scholar] [CrossRef]
- Heier, M.; Margeirsdottir, H.D.; Torjesen, P.A.; Seljeflot, I.; Stensaeth, K.H.; Gaarder, M.; Brunborg, C.; Hanssen, K.F.; Dahl-Jorgensen, K. The advanced glycation end product methylglyoxal-derived hydroimidazolone-1 and early signs of atherosclerosis in childhood diabetes. Diabetes Vasc. Dis. Res. 2015, 12, 139–145. [Google Scholar] [CrossRef] [PubMed]
- Picard, S.; Parthasarathy, S.; Fruebis, J.; Witztum, J.L. Aminoguanidine inhibits oxidative modification of low density lipoprotein protein and the subsequent increase in uptake by macrophage scavenger receptors. Proc. Natl. Acad. Sci. USA 1992, 89, 6876–6880. [Google Scholar] [CrossRef] [PubMed]
- Chen, X.F.; Chen, X.; Tang, X. Short-chain fatty acid, acylation and cardiovascular diseases. Clin. Sci. 2020, 134, 657–676. [Google Scholar] [CrossRef] [PubMed]
- Wang, Z.; Bao, Z.; Ding, Y.; Xu, S.; Du, R.; Yan, J.; Li, L.; Sun, Z.; Shao, C.; Gu, W. Nepsilon-carboxymethyl-lysine-induced PI3K/Akt signaling inhibition promotes foam cell apoptosis and atherosclerosis progression. Biomed. Pharmacother. 2019, 115, 108880. [Google Scholar] [CrossRef]
- Rodgers, K.J.; Dean, R.T. Metabolism of protein-bound DOPA in mammals. Int. J. Biochem. Cell Biol. 2000, 32, 945–955. [Google Scholar] [CrossRef]


Publisher’s Note: MDPI stays neutral with regard to jurisdictional claims in published maps and institutional affiliations. |
© 2022 by the authors. Licensee MDPI, Basel, Switzerland. This article is an open access article distributed under the terms and conditions of the Creative Commons Attribution (CC BY) license (https://creativecommons.org/licenses/by/4.0/).