Article

Functional and Conformational Plasticity of an Animal Group 1 LEA Protein

Department of Biology, University of Louisville, Louisville, KY 40292, USA
*
Author to whom correspondence should be addressed.
Biomolecules 2022, 12(3), 425; https://doi.org/10.3390/biom12030425
Submission received: 15 January 2022 / Revised: 2 March 2022 / Accepted: 7 March 2022 / Published: 10 March 2022

Abstract

:
Group 1 (Dur-19, PF00477, LEA_5) Late Embryogenesis Abundant (LEA) proteins are present in organisms from all three domains of life, Archaea, Bacteria, and Eukarya. Surprisingly, Artemia is the only genus known to include animals that express group 1 LEA proteins in their desiccation-tolerant life-history stages. Bioinformatics analysis of circular dichroism data indicates that the group 1 LEA protein AfLEA1 is surprisingly ordered in the hydrated state and undergoes during desiccation one of the most pronounced disorder-to-order transitions described for LEA proteins from A. franciscana. The secondary structure in the hydrated state is dominated by random coils (42%) and β-sheets (35%) but converts to predominately α-helices (85%) when desiccated. Interestingly, AfLEA1 interacts with other proteins and nucleic acids, and RNA promotes liquid–liquid phase separation (LLPS) of the protein from the solvent during dehydration in vitro. Furthermore, AfLEA1 protects the enzyme lactate dehydrogenase (LDH) during desiccation but does not aid in restoring LDH activity after desiccation-induced inactivation. Ectopically expressed in D. melanogaster Kc167 cells, AfLEA1 localizes predominantly to the cytosol and increases the cytosolic viscosity during desiccation compared to untransfected control cells. Furthermore, the protein formed small biomolecular condensates in the cytoplasm of about 38% of Kc167 cells. These findings provide additional evidence for the hypothesis that the formation of biomolecular condensates to promote water stress tolerance during anhydrobiosis may be a shared feature across several groups of LEA proteins that display LLPS behaviors.

1. Introduction

Since their discovery in cotton seeds by Dure et al. [1], the importance of late embryogenesis abundant (LEA) proteins in the abiotic stress tolerance of plants has been firmly established. However, their actual function(s) are still largely unresolved [2,3,4]. Research over the past two decades has extended the role(s) of these intrinsically disordered proteins (IDPs) in promoting desiccation tolerance to animals [5,6]. Based on conserved sequence motifs, several LEA classifications schemes have been proposed, resulting in 6 to 11 distinct protein groups or families [7]. Using the classification proposed by Tunnacliffe and Wise, most investigated anhydrobiotic animals express LEA proteins from Group 3 (PF02987) [3]. The only exception is the brine shrimp, Artemia franciscana, which expresses LEA proteins from two additional families. These LEA proteins are from Group 1 (PF00477) and Group 6 (PF04927) and are also only expressed in the anhydrobiotic encysted embryos [5,8,9,10]. Compared to other anhydrobiotic animals, the reasons for the more extensive LEA repertoire in Artemia are still unresolved. However, despite a uniquely broad range of expressed LEA proteins, the knockdown of Group 1 LEA proteins by RNAi reduced the cyst desiccation tolerance by over 90% [11]. Therefore, expressed proteins from other groups do not readily substitute the anhydrobiotic functions performed by Group 1 LEA proteins in A. franciscana. Understanding the mechanism(s) by which AfLEA1 improves water-stress tolerance in A. franciscana may facilitate the development of methods to engineer anhydrobiotic research cell lines and water-stress tolerant medical stem cells.
A minimum of five similar Group 1 LEA proteins are concurrently expressed in A. franciscana and localize to the cytosol and the mitochondrion [10,11,12,13]. These proteins contain 2 to 8 repeats of a Group 1 amino acid motif (GGOTRREQLGEEGYSQMGRK) and, based on the EST data available at the National Center for Biotechnology Information (NCBI), are composed of 62 to 217 amino acids [10]. The observation of Group 1 LEA proteins being present in both the cytosol and the mitochondria may offer insight into their role(s) in desiccation tolerance. The occurrence of nearly identical protein variants in several cellular locations makes it unlikely that these proteins are highly selective in the targets they protect and may indicate a more general mechanism of protection conferred to multiple compartments and targets [10,11]. Furthermore, the reason(s) for similar proteins of varying sizes have not been explained. The observed variations in length may indicate that the number of repeating Group 1 motifs is not critical to the protein’s overall function. Alternatively, the number of repeats may regulate the behavior of a specific Group 1 protein during desiccation. Increased numbers of Group 1 motifs in each polypeptide could increase the odds of protein folding during water removal or increase the number of binding sites for desiccation-sensitive targets. On the other hand, shorter proteins should be more mobile in the drying cell’s increasingly crowded milieu than large polymers. The presence of protective proteins with different mobilities might be advantageous for reaching desiccation-sensitive targets at varying hydration levels and cytoplasmic viscosity [14,15,16].
Despite over a decade of study focused on Group 1 LEA proteins in Artemia, little is known about their functional mechanism(s) of protection. The sequence features of AfLEA1 have been investigated using bioinformatics, and in vivo experiments have been performed by transfecting E. coli and S. cerevisiae cells with AfLEA1 variants [13,17]. In these experiments, no improvements in osmotic stress tolerance could be detected for E. coli, and modest improvements in viability after freezing and drying were observed in yeast [13]. Similar observations were made after expressing a mitochondrial-targeted AfLEA1 variant from A. franciscana in Kc167 cells from D. melanogaster. In this system, the protein led to modest improvements in osmotic stress tolerance and conferred some protection to mitochondrial functions during freezing [12]. As with other LEA proteins, determining the mechanism by which Group 1 LEA proteins confer desiccation tolerance and identifying their desiccation-sensitive targets is more straightforward using in vitro techniques than transgenic animals [18]. However, the unique challenge of performing biochemistry at low water contents or in the desiccated state has led to limited progress on all fronts.
Nonetheless, methods have been developed to deduce the secondary structure of LEA proteins in the desiccated state using bioinformatics and circular dichroism [19,20]. Recently, the liquid–liquid phase separation (LLPS) behavior of a Group 6 LEA protein was investigated using a combination of light microscopy, scanning electron microscopy, atomic force microscopy, and drying procedures in the presence of osmolytes found in the anhydrobiotic cyst of A. franciscana [21]. Utilizing similar techniques and guided by computation tools, we performed a comprehensive analysis of the behavior of AfLEA1 during desiccation, and our findings provide new insights into two specific hypotheses regarding LEA protein functions: molecular shielding [22] and hydration buffering [23].

2. Material and Methods

2.1. Chemicals

All chemicals, including those for transgenic protein expression, preparation of buffer solutions, and measuring lactate dehydrogenase activity, were purchased from Sigma-Aldrich (St. Louis, MO, USA) or obtained from VWR (Atlanta, GA, USA). Water for solution preparation was purified with a custom-built reverse osmosis water system (Culligan Water, Clarksville, IN, USA). Water for molecular biology applications was purchased from VWR (Atlanta, GA, USA).

2.2. Protein Cloning, Expression, and Purification

DNA encoding for the 180 amino acids-long AfLEA1 (highly similar to ABR67402; described in: [12]) polypeptide was cloned into the Ptxb1 (NEB Biolabs, Ipswich, MA, USA) vector and expressed using isopropyl-β-1-thiogalactopyranoside (IPTG) induction as previously described [24]. Briefly, BL21 Star strain Escherichia coli cells transformed with this vector were cultured on agarose plates containing 100 µg/mL ampicillin in Luria Bertani (LB) medium. For protein induction, single colonies were grown to an optical density of ~0.6 at λ = 595 nm overnight at 37 °C and cells were harvested 2 h after adding 0.4 mM IPTG. The bacteria were harvested at 5000× g for 30 min at 4 °C and the pellets were resuspended in buffer A (500 mM NaCl, 50 mM Tris-HCl, pH 8.5) containing 1 mM phenylmethylsulphonyl fluoride (PMSF) and stored at −80°C until protein purification.
For protein purification, the bacterial pellets were thawed and sonicated (Q500, Qsonica, Newtown, CT, USA), then centrifuged at 20,000× g for 30 min at 4 °C to remove cellular debris. The resulting supernatant was applied to a column containing 15 mL chitin resin (NEB Biolabs, Ipswich, MA, USA) and the column was washed with 3 column volumes of buffer A. Self-cleavage of the intein protein was induced by adding 50 mM dithiothreitol at 4 °C for 48 h and the eluted protein was dialyzed overnight against 20 mM TRIS-HCl at a pH of 8.0. Further purification was performed using a fast-performance liquid chromatography (FPLC) system (AKTA, Cytiva Life Sciences, Marlborough, MA, USA) and a 1 mL Resource Q anion exchange column (Cytiva Life Sciences, Marlborough, MA, USA). Bound AfLEA1 was eluted from the column using a gradient of 20 mM TRIS-HCl at pH 8.0 and NaCl concentrations from 0 to 125 mM over 10 column volumes. AfLEA1 eluted from the column was 99% pure based on band intensity measured using SDS PAGE and the protein was dialyzed against 50 mM phosphate buffer, pH 7.0. Aliquots of purified AfLEA1 were snap-frozen in liquid N2 and stored at −80 °C until used for experimentation.

2.3. Size-Exclusion Chromatography

Size-exclusion chromatography was performed using a Superdex 75® 10/300 column on an FPLC instrument (AKTA, Cytiva Life Sciences, Marlborough, MA, USA). A volume of 100 µL AfLEA1 protein in 50 mM phosphate buffer at pH 7.0 was injected at a 0.1 mL/min flow rate. Low molecular weight standards (Cytiva Life Sciences, Marlborough, MA, USA), including aprotinin (6.5 kDa), ribonuclease A (13.7 kDa), carbonic anhydrase (29 kDa), ovalbumin (44 kDa), conalbumin (75 kDa), and a blue dextran 2000 tracking polymer, were used as molecular weight markers.

2.4. Circular Dichroism

AfLEA1 protein (100 µg/mL in 20 mM phosphate buffer at a pH of 7.0) was measured in a sealed quartz cuvette with a path length 0.1 cm (Starna Scientific, Atascadero, CA, USA) using a wavelength range from 280 nm to 185 nm using a J-1500 circular dichroism spectrophotometer (Jasco, Easton, MD, USA). To reduce the light-scattering associated with a dried sample, AfLEA1 was dialyzed into ultrapure water three times at a ratio of 1:1000 protein solution to water. Next, AfLEA1 at 1 mg/mL in water was repeatedly plated on an open 0.01 cm path-length quartz cuvette (Starna Scientific, Atascadero, CA, USA). Each layer was rapidly dried by incubating them for 1 h at 0% relative humidity over anhydrous calcium sulfate. The rapid drying process produced an amorphous protein glass with minimal light scattering. Once the protein layer reached the thickness of the 0.01 cm path length, 1 µL of ultrapure water was added, allowing the cuvette to be assembled. A final incubation for 24 h at 25 °C and 0% relative humidity produced a protein glass of AfLEA1 without observable light scattering. Data were averaged over 5 measurements taken in 1 nm intervals. Secondary structure predictions were performed using the CONTIN and SELCON 3 predictors from DichroWeb (http://dichroweb.cryst.bbk.ac.uk/html/home.shtml, last accessed on 20 February 2022) with data sets 4 and 7 as references.

2.5. Bioinformatics Structural Predictions

I-Tasser (https://zhanggroup.org/I-TASSER/, last accessed on 20 February 2022) predicts the structure of proteins by comparing the portions of known crystal structures available from the protein data bank (PDB, https://www.rcsb.org, last accessed on 20 February 2022) to the queried polypeptide and combining them into models using a hierarchical ranking system [25,26,27]. The protein modeling software Swiss PDBViewer (DeepView) (https://spdbv.unil.ch, last accessed on 20 February 2022) was used to visualize the potential hydrophobic face of the AfLEA1’s α-helices [28]. The potential for phase separation of AfLEA1 was evaluated using catGranule (http://service.tartaglialab.com, last accessed on 20 February 2022) [29].

2.6. Sample Preparation for Light Microscopy and Electron Scanning Microscopy (SEM)

A droplet of AfLEA1 in H2O was plated onto microscope slides directly adjacent to a droplet of ultrapure water. The droplets were then connected to allow diffusion of the protein and produce a protein gradient over 10 min at ambient relative humidity and 25 °C. The samples were dried at 0% relative humidity over anhydrous calcium sulfate at 25 °C to remove any residual water. Glass coverslips were placed above the samples and sealed with nail polish after desiccation-preserving the samples. The samples were stored in a sealed container at 0% RH until viewed using a specimen microscope. Sample preparation for SEM was performed as described above, with the difference that an aluminum SEM stage was used to deposit the protein solution. Once completely dried, the samples were sputter-coated with a 10 nm layer of gold to prevent sample rehydration reduce charging artifacts. The samples were stored at 0% RH until viewed using an electron microscope (Jeol, Peabody, MA, USA).

2.7. Lactate Dehydrogenase Activity Assays

Cell lysates were obtained by sonication of 20 × 106 Kc167 cells (Drosophila melanogaster) in 100 mM phosphate buffer at a pH of 6.4. Cell debris was removed by centrifugation at 15,000× g for 10 min. The supernatant was diluted to a total protein concentration of 2 mg/mL with phosphate buffer, and the total protein concentrations were confirmed via Bradford assays. AfLEA1 or BSA was then added to the lysate to yield a total concentration of 400 μg/mL of AfLEA1 or BSA, and the endogenous LDH activity was recorded. Aliquots of 50 μL were then desiccated for 7 days in a sealed container at 25 °C and 0% RH. Samples were rehydrated with 100 μL phosphate buffer, and activity was measured using UV-VIS spectrophotometry (UV-1800, Shimadzu, Tokyo, Japan). Absorbance was monitored at λ = 340 nm using the kinetics mode while the sample was stirred at 500 rpm, and the sample temperature was maintained at 25 °C.
To distinguish between protection of LDH and repair of LDH by AfLEA1, pure LDH was desiccated in the presence or absence of 400 μg/mL AfLEA1 or BSA in 100 mM sodium phosphate buffer at a pH of 6.4. Commercially obtained LDH (Millipore-Sigma, St. Louis, MO, USA) was diluted to 0.2 mg/mL with H2O and dialyzed against 100 mM phosphate buffer, pH 6.5. Initial LDH activity was determined, and 25 μL aliquots of samples containing LDH, LDH plus BSA, or LDH plus AfLEA1 were placed in microtubes and desiccated for 7 days at 0% RH. Samples were rehydrated with 50 μL of phosphate buffer. Additional samples of purified LDH were desiccated in the absence of AfLEA1 and BSA for 7 days at 0% RH and rehydrated on ice with either 50 μL of phosphate buffer or phosphate buffer containing AfLEA1 or BSA at 400 μg/mL to investigate the potential repair mechanisms. LDH activity after rehydration was measured as described above.

2.8. Screening AfLEA1 for RNA-Induced Liquid-Liquid Phase Separation

A solution resembling the crowded cytoplasm of the diapause cysts of A. franciscana (32 mM NaCl, 98 mM KCl, 11 mM K2PO4, 5 mM CaCl2, 340 mM trehalose, 2.9% w/v glycerol, and 25% Ficoll 400, pH of 6.5) was prepared, and 150 μg/mL of AfLEA1 was added to determine whether AfLEA1 undergoes LLPS during desiccation. The protein solution was deposited onto microscope slides, and the solutions were allowed to desiccate at ambient humidity (83% RH) and temperature (22–26 °C) while observed using an inverted microscope. RNA (20 ng/mL final concentration) isolated from A. franciscana using a total RNA isolation kit (Qiagen, Germantown, MD, USA) was added to the protein droplet to determine the impact on the LLPS behavior of AfLEA1.

2.9. SDS-PAGE

Samples of AfLEA1 obtained after affinity or ion-exchange chromatography were dialyzed against 50 mM phosphate buffer at a pH of 7.0 and frozen in 10 mL aliquots. Before electrophoresis, the protein was boiled in Laemmli buffer (Bio-Rad, Hercules, CA, USA), and 2 μg of AfLEA1 was run per lane of a 10% SDS-PAGE (37.5:1, Bio-Rad, Hercules, CA, USA). A kaleidoscope protein ladder was used as a molecular weight standard (Bio-Rad, Hercules, CA, USA). The gel was run at 90 V for 1 h using a running buffer containing 25 mM Tris, 192 mM glycine, and 0.1% SDS at a pH of 8.3, and gels were destained overnight with 30% methanol and 10% glacial acetic acid in H2O.

2.10. Cell Culture, Transgenic Cell Line, and Confocal Microscopy

Cell culture, transgenic cell line development, and confocal microscopy were performed as previously described for AfrLEA6 with the following differences [21]. In place of Schneider’s media, IPL-41 insect culture media (Gibco, Waltham, MA, USA) was supplemented with 2 g/L tryptone phosphate broth (VWR, Atlanta, GA, USA) and 10% heat-inactivated FBS (Atlanta Biologicals, Flowery Branch, GA, USA) and used to culture the Kc167 cells. In addition, transfected and control cell lines were stained for only 2 min with Nile Red to prevent fluorescence saturation in AfLEA1-expressing cells. Cells co-expressing AfLEA1-mCherry and GFP were stained with 200 µL of 100 nM MitoView Blue in DPBS (Biotium, Fremont, CA, USA) for 10 min. The following primers were used to clone and amplify untagged AfLEA1: 5′-CGGAATTCCAAACATGGAACTGTCGTCGAGTAAGCTG-3′ and 5′-TAATTGCGGCCGCATTTCTGTCTTGCGAGACCTCCTTTTTG-3′. The following primers were used to clone and amplify a chimeric protein composed of AfLEA1 and mCherry at the c-terminus: 5′-CGGCGAATTCATGGAACTGTCGTCGAGTAAGCTG-3′ and 5′-AGGGCGGCCGCATTTCTGTCTTGCGAGACCTCCTTTTTG-3′.

3. Results and Discussion

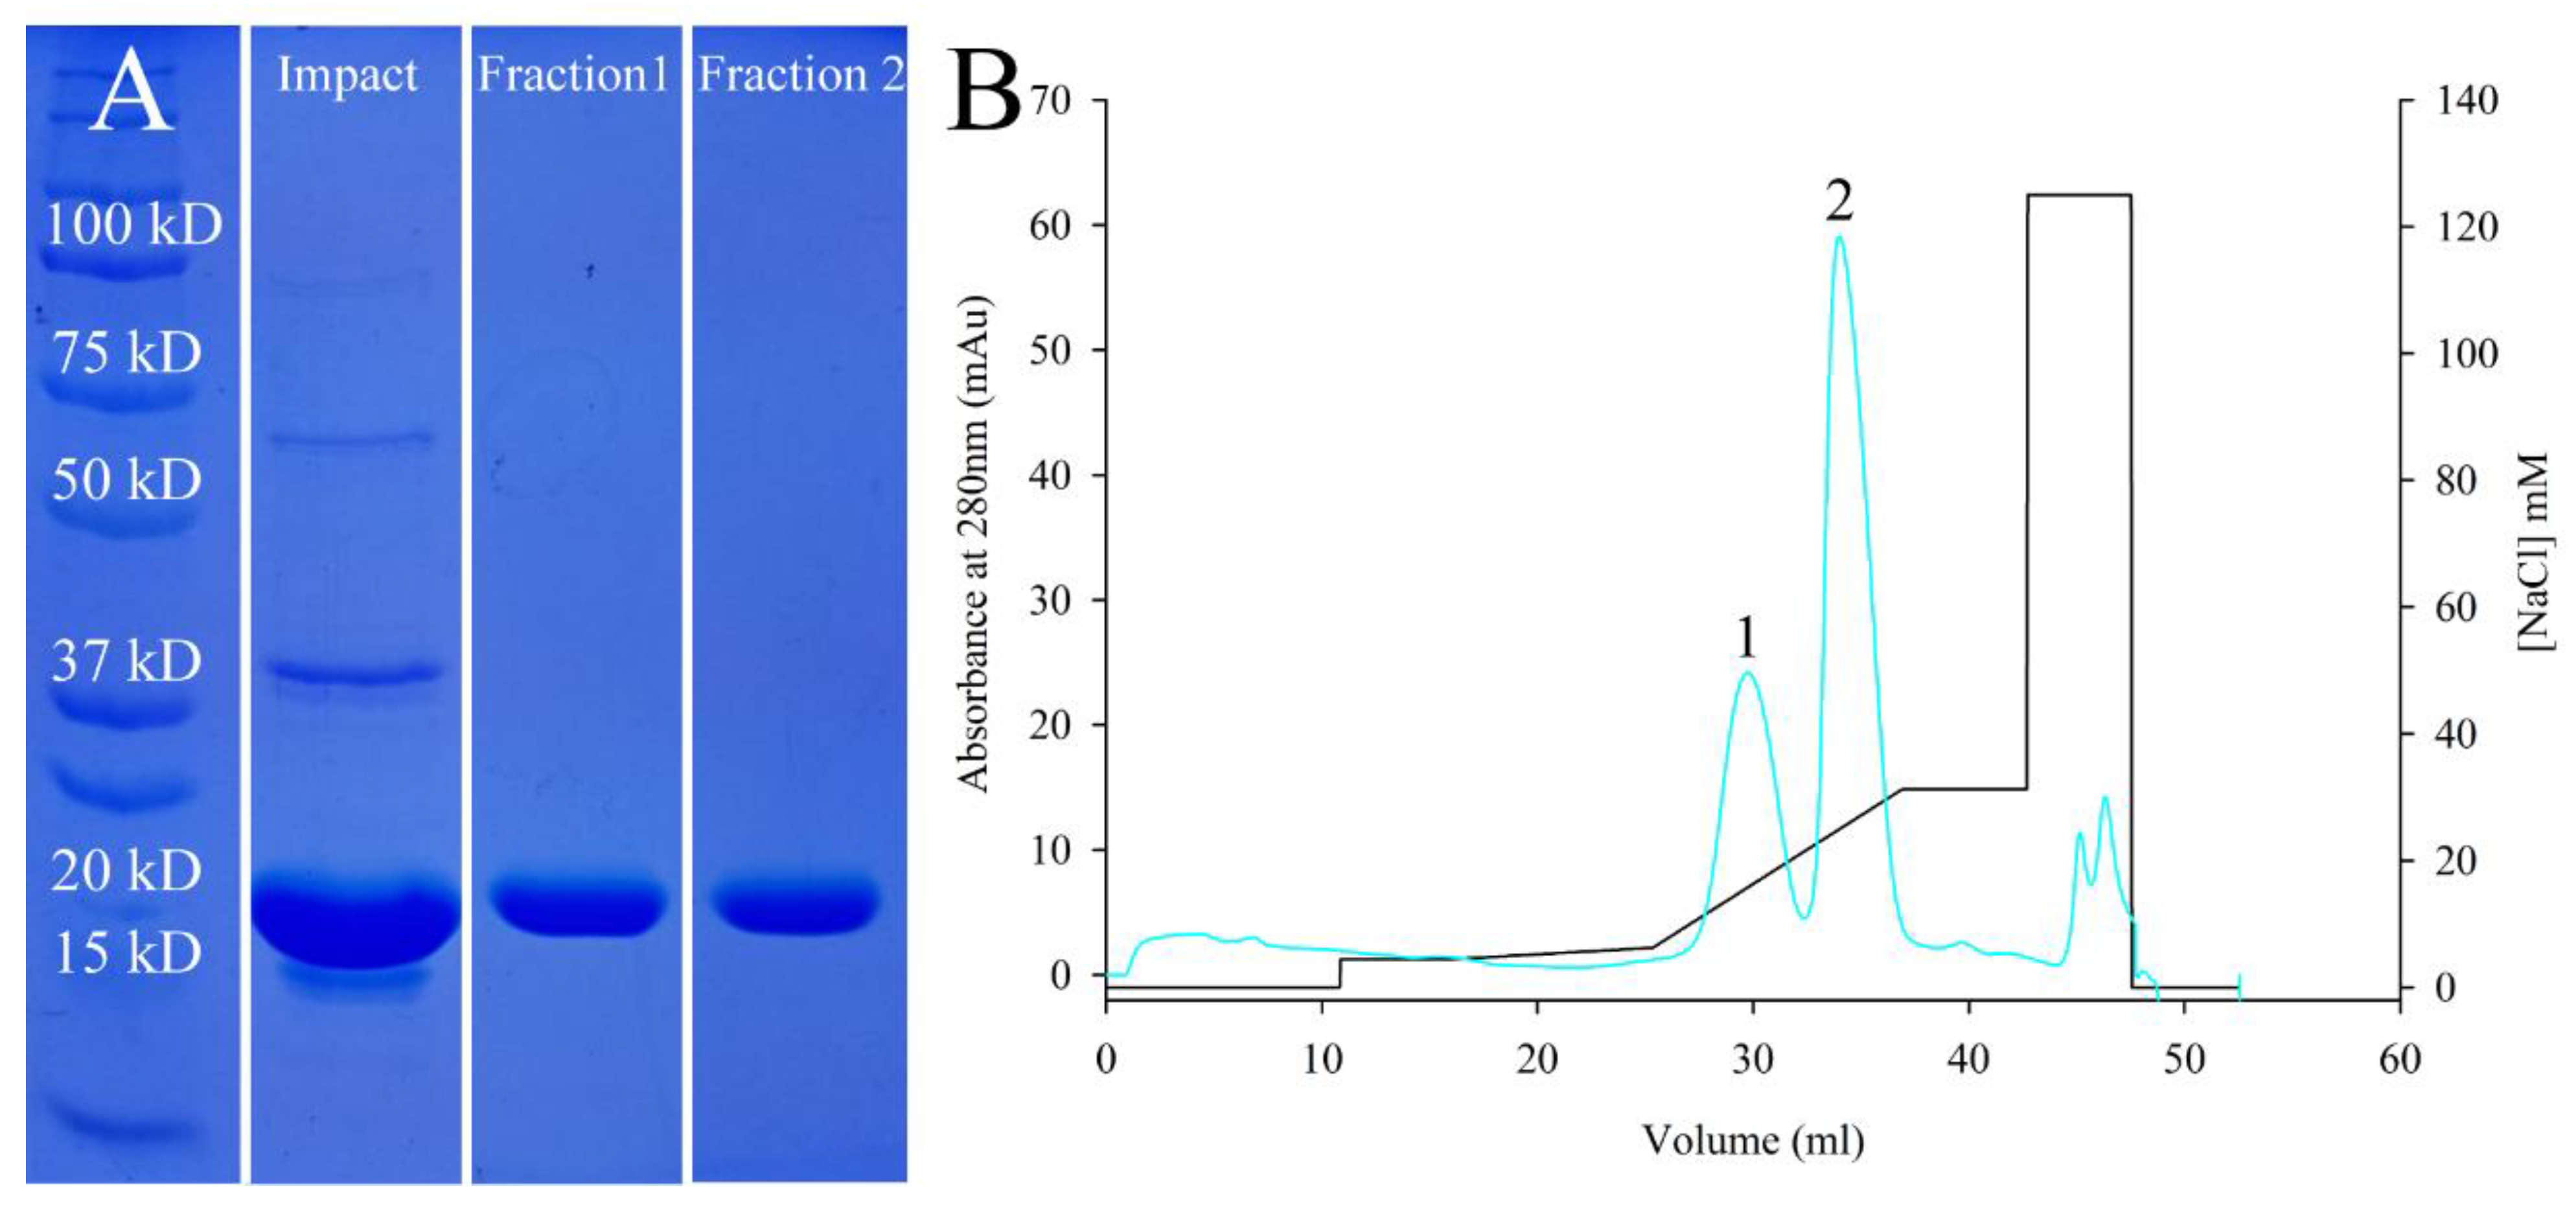
3.1. Protein Cloning, Expression, and Purification

The protein AfLEA1 was readily expressed in E. coli, and an approximately 90% purity could be reached using chitin-affinity chromatography, as shown by SDS-PAGE (Figure 1A). Surprisingly, when the crude protein sample was further purified using a strong anion exchanger, AfLEA1 elutes in two distinct fractions (Figure 1B). Still, the protein in both fractions migrates identically during SDS-PAGE and has a purity of over 99% (Figure 1A). The presence of two elution peaks containing AfLEA1 protein that behaves identically during electrophoresis may indicate higher-order assemblies that are lost during the denaturation step in electrophoresis or distinct conformational states undetectable by SDS-PAGE.
Bioinformatics suggests that AfLEA1 has high conformational plasticity [17], which supports the hypothesis that the protein may exist in more than one tertiary state when bound to the column’s polystyrene/divinylbenzene polymer matrix, causing two distinct elution fractions. Furthermore, a trend was observed indicating the concentration of salt required for elution of AfLEA1 correlates negatively with the quantity of AfLEA1 bound to the column for both elution fractions (Figure S1 and Table S1, Supplementary Materials). This behavior may indicate interactions among AfLEA1 molecules on the column can change the affinity of the protein towards the strong anion exchanger for both conformational states. However, a more thorough investigation of this behavior would be needed to strengthen this interpretation.
The apparent molecular mass of AfLEA1 in both elution fractions was measured using size-exclusion chromatography to exclude SDS-sensitive higher-order oligomers (Figure 2). Independent of the fraction AfLEA1 eluted in during anion-exchange chromatography, size-exclusion chromatography indicates that AfLEA1 has an apparent molecular weight of 33 kDa, which is ~75% larger than the amino acid composition-based calculated mass (~19.7 kDa). However, intrinsically disordered proteins can have apparent molecular sizes up to 12 times as large as a similarly sized globular protein [30]. Overall, these results suggest AfLEA1 is likely in a molten globule state showing some secondary structure but not a tightly packed tertiary structure. In the molten globule state, when evaluated using size-exclusion chromatography, proteins can have an apparent molecular weight of up to twice that of a tightly packed globular protein of a similar length.

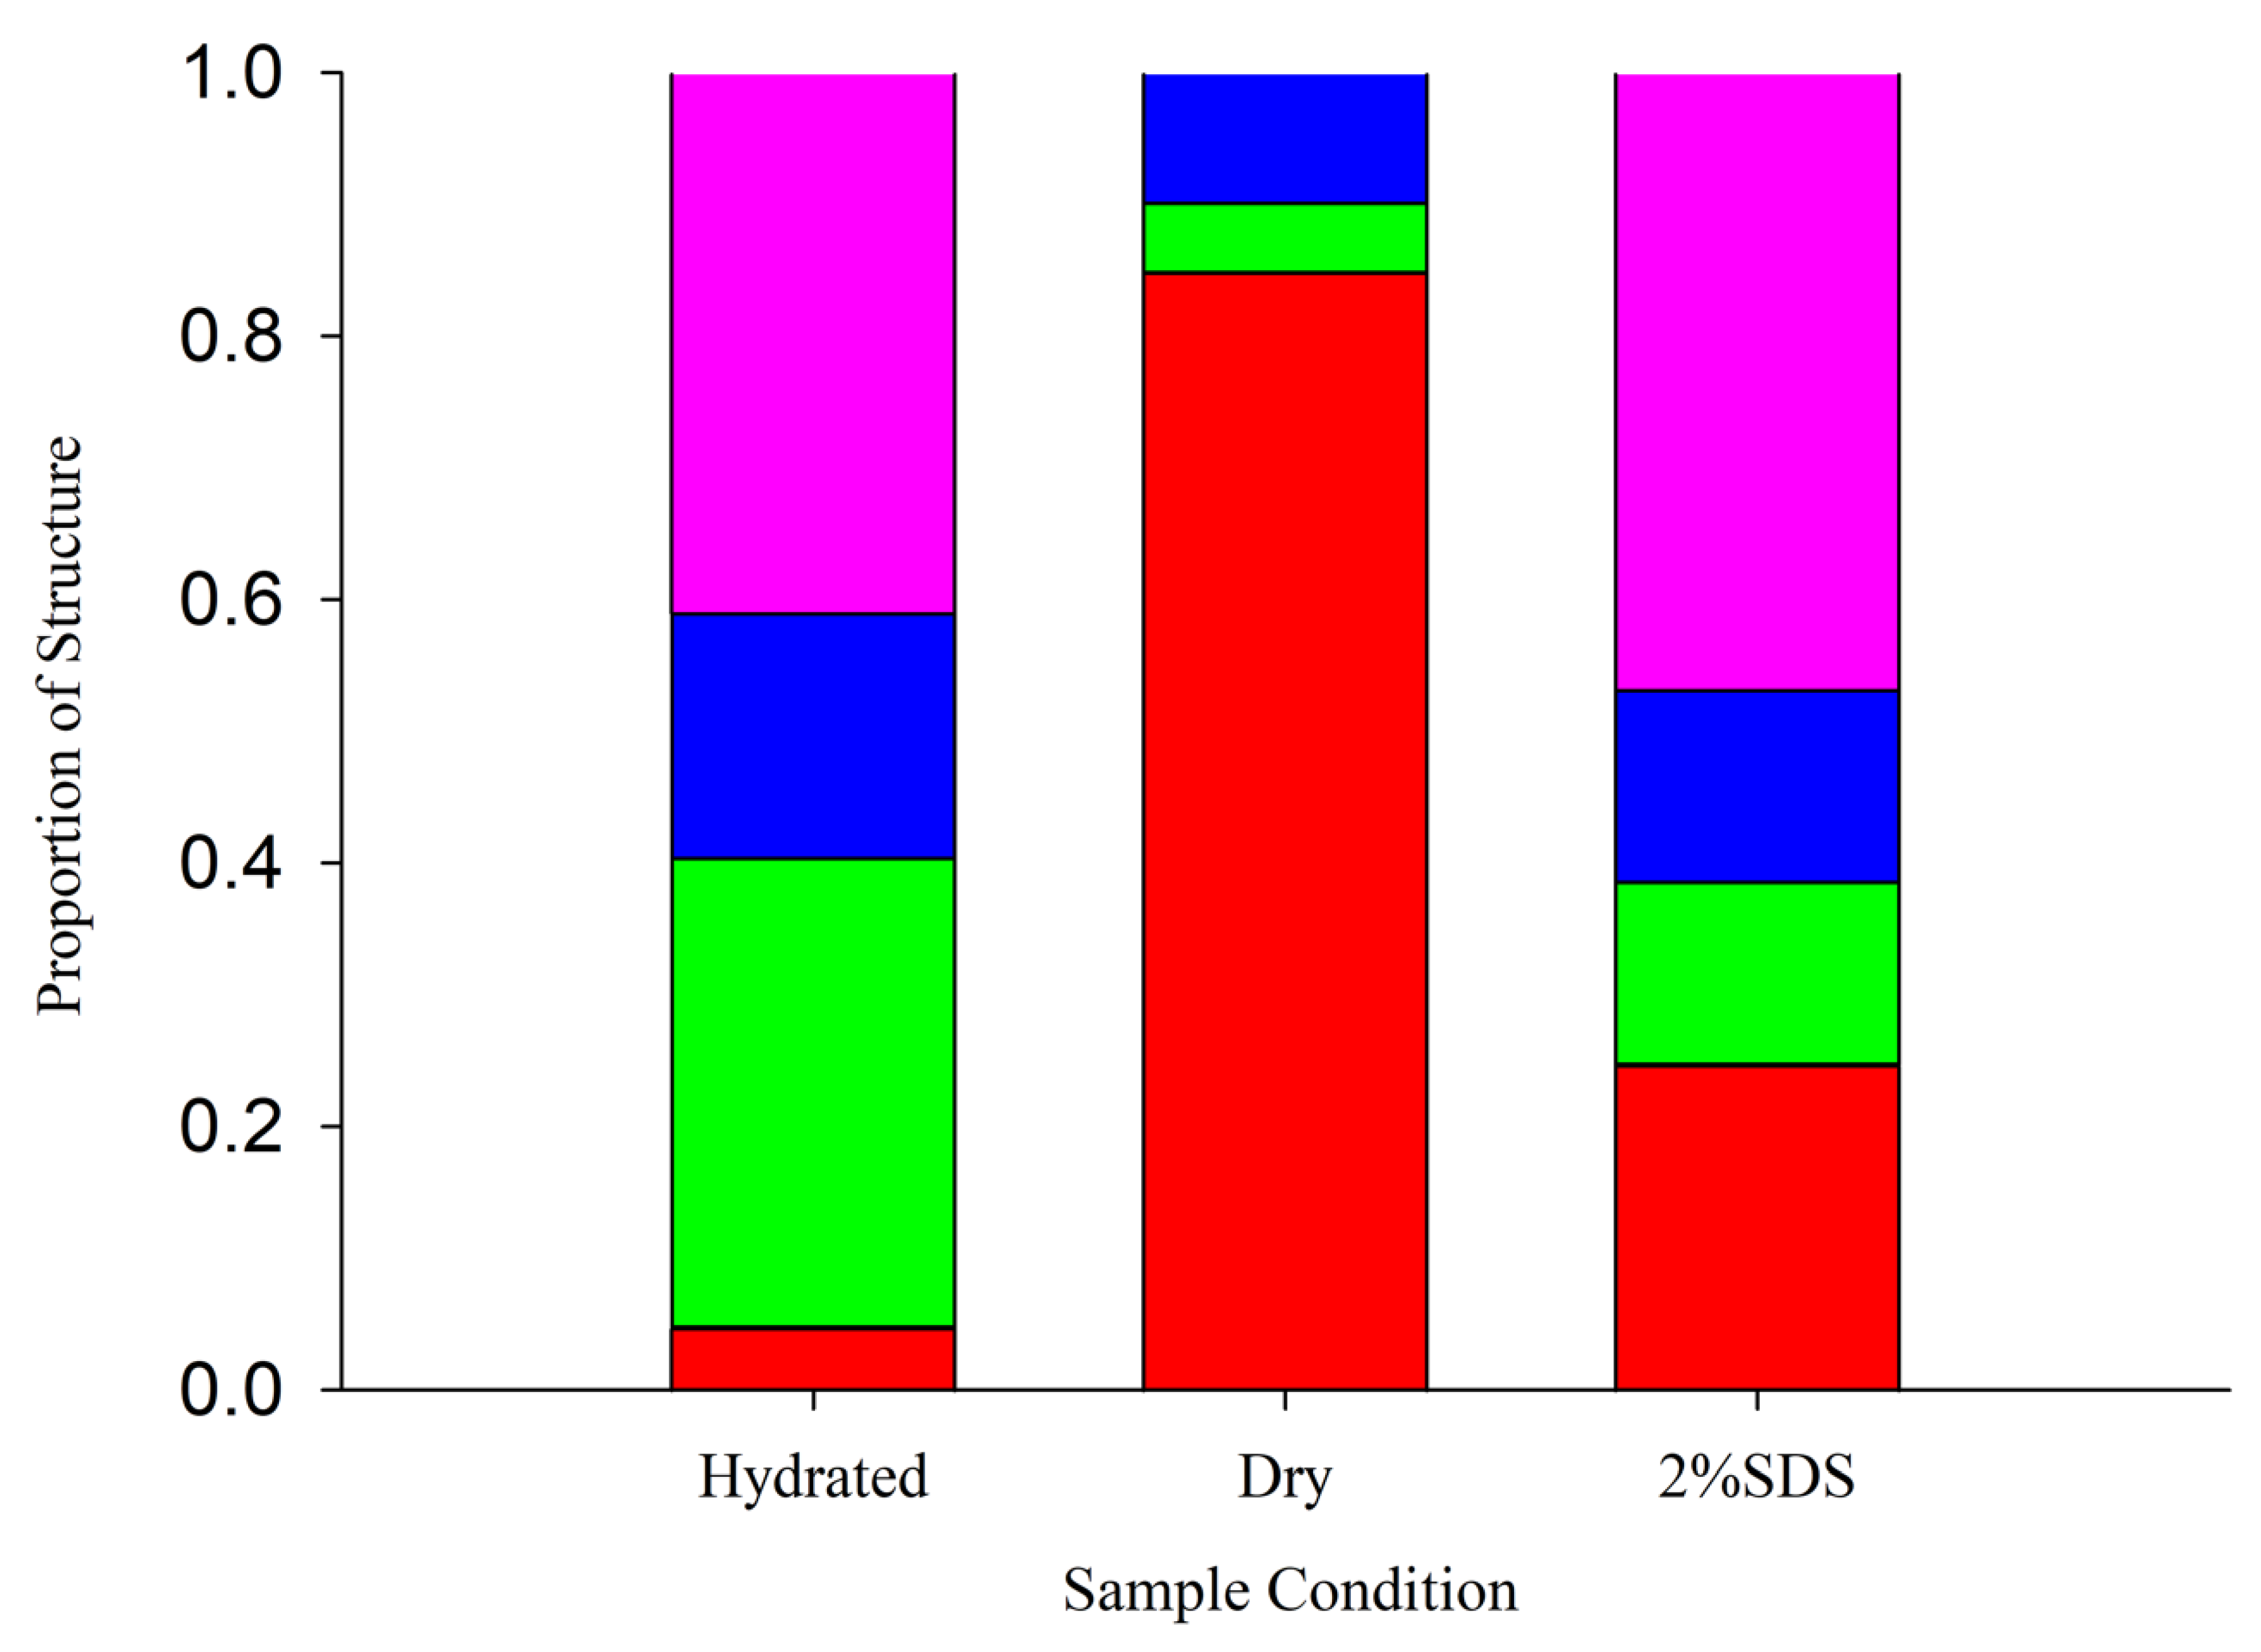
3.2. AfLEA1 Secondary Structural Analysis

The secondary structure of AfLEA1 was investigated by circular dichroism under three conditions to explore the conformational transition of AfLEA1 during the reduced availability of water (Figure 3). In the hydrated state, about 40% AfLEA1 contains defined secondary structure motifs, and the protein is composed of 5% α-helices, 35% β-sheets, 18% turns, and 42% random coils. While AfLEA1 can be classified, like other LEA proteins, as a mostly intrinsically disordered protein, it is surprisingly ordered in the hydrated state. For example, the Group 3 LEA proteins AfrLEA2 and AfrLEA3m (A. franciscana) are only ordered to 21% and 25%, respectively [31]. However, AfLEA1 undergoes a dramatic conformational transition in the desiccated state. The protein is nearly 100% ordered and composed of 85% α-helices, 5% β-sheets, and 10% turns after removing the water (Figure 3). Despite being more structured than most LEA proteins in the hydrated state, this conformational transition is the most dramatic shift from disorder to order reported for an LEA protein from A. franciscana. The transition from the hydrated to the desiccated conformation is partly mimicked by the molecular crowding effect observed in a solution containing 2% SDS (Figure 3). In the presence of SDS, AfLEA1 is slightly less ordered (38%) than in the hydrated state, and its β-sheets appear to transition into α-helices before the random coils. Generally, the secondary structure measurements and predictions produced by circular dichroism represent the average conformation of an ensemble of the different conformational states in the beam’s path [32]. It appears that during desiccation, AfLEA1 is transitioning into a more uniform conformation compared to the hydrated state, which is a strong indication of the disorder-to-order regulation of its protective functions.
The sequence of AfLEA1 is highly repetitive and is mainly composed of the eight repeats of the Group 1 consensus sequence ‘GGOTRREQLGEEGYSQMGRK’ [33,34] (Figure 4A). AfLEA1’s propensity for α-helices is predicted by the regular appearance of alanine-arginine-alanine “helix cap” motifs found at the ends of the repeating Group 1 LEA motif [35,36,37]. Given the amount of predicted α-helical structure, an α-helical protein projection is informative. Unlike AfrLEA2 and AfrLEA3m [38], AfLEA1 does not have sufficient secondary structure orientation of its charged residues to offer alpha-helical stabilization (Figure 4B) [39]. However, the protein does have a thin hydrophobic face, which can stabilize α-helical formation in the absence of water [40]. Nevertheless, the hydrophobic moment is too low to offer sufficient stabilization to explain AfLEA1’s α-helix content measured in the desiccated state [17,41].

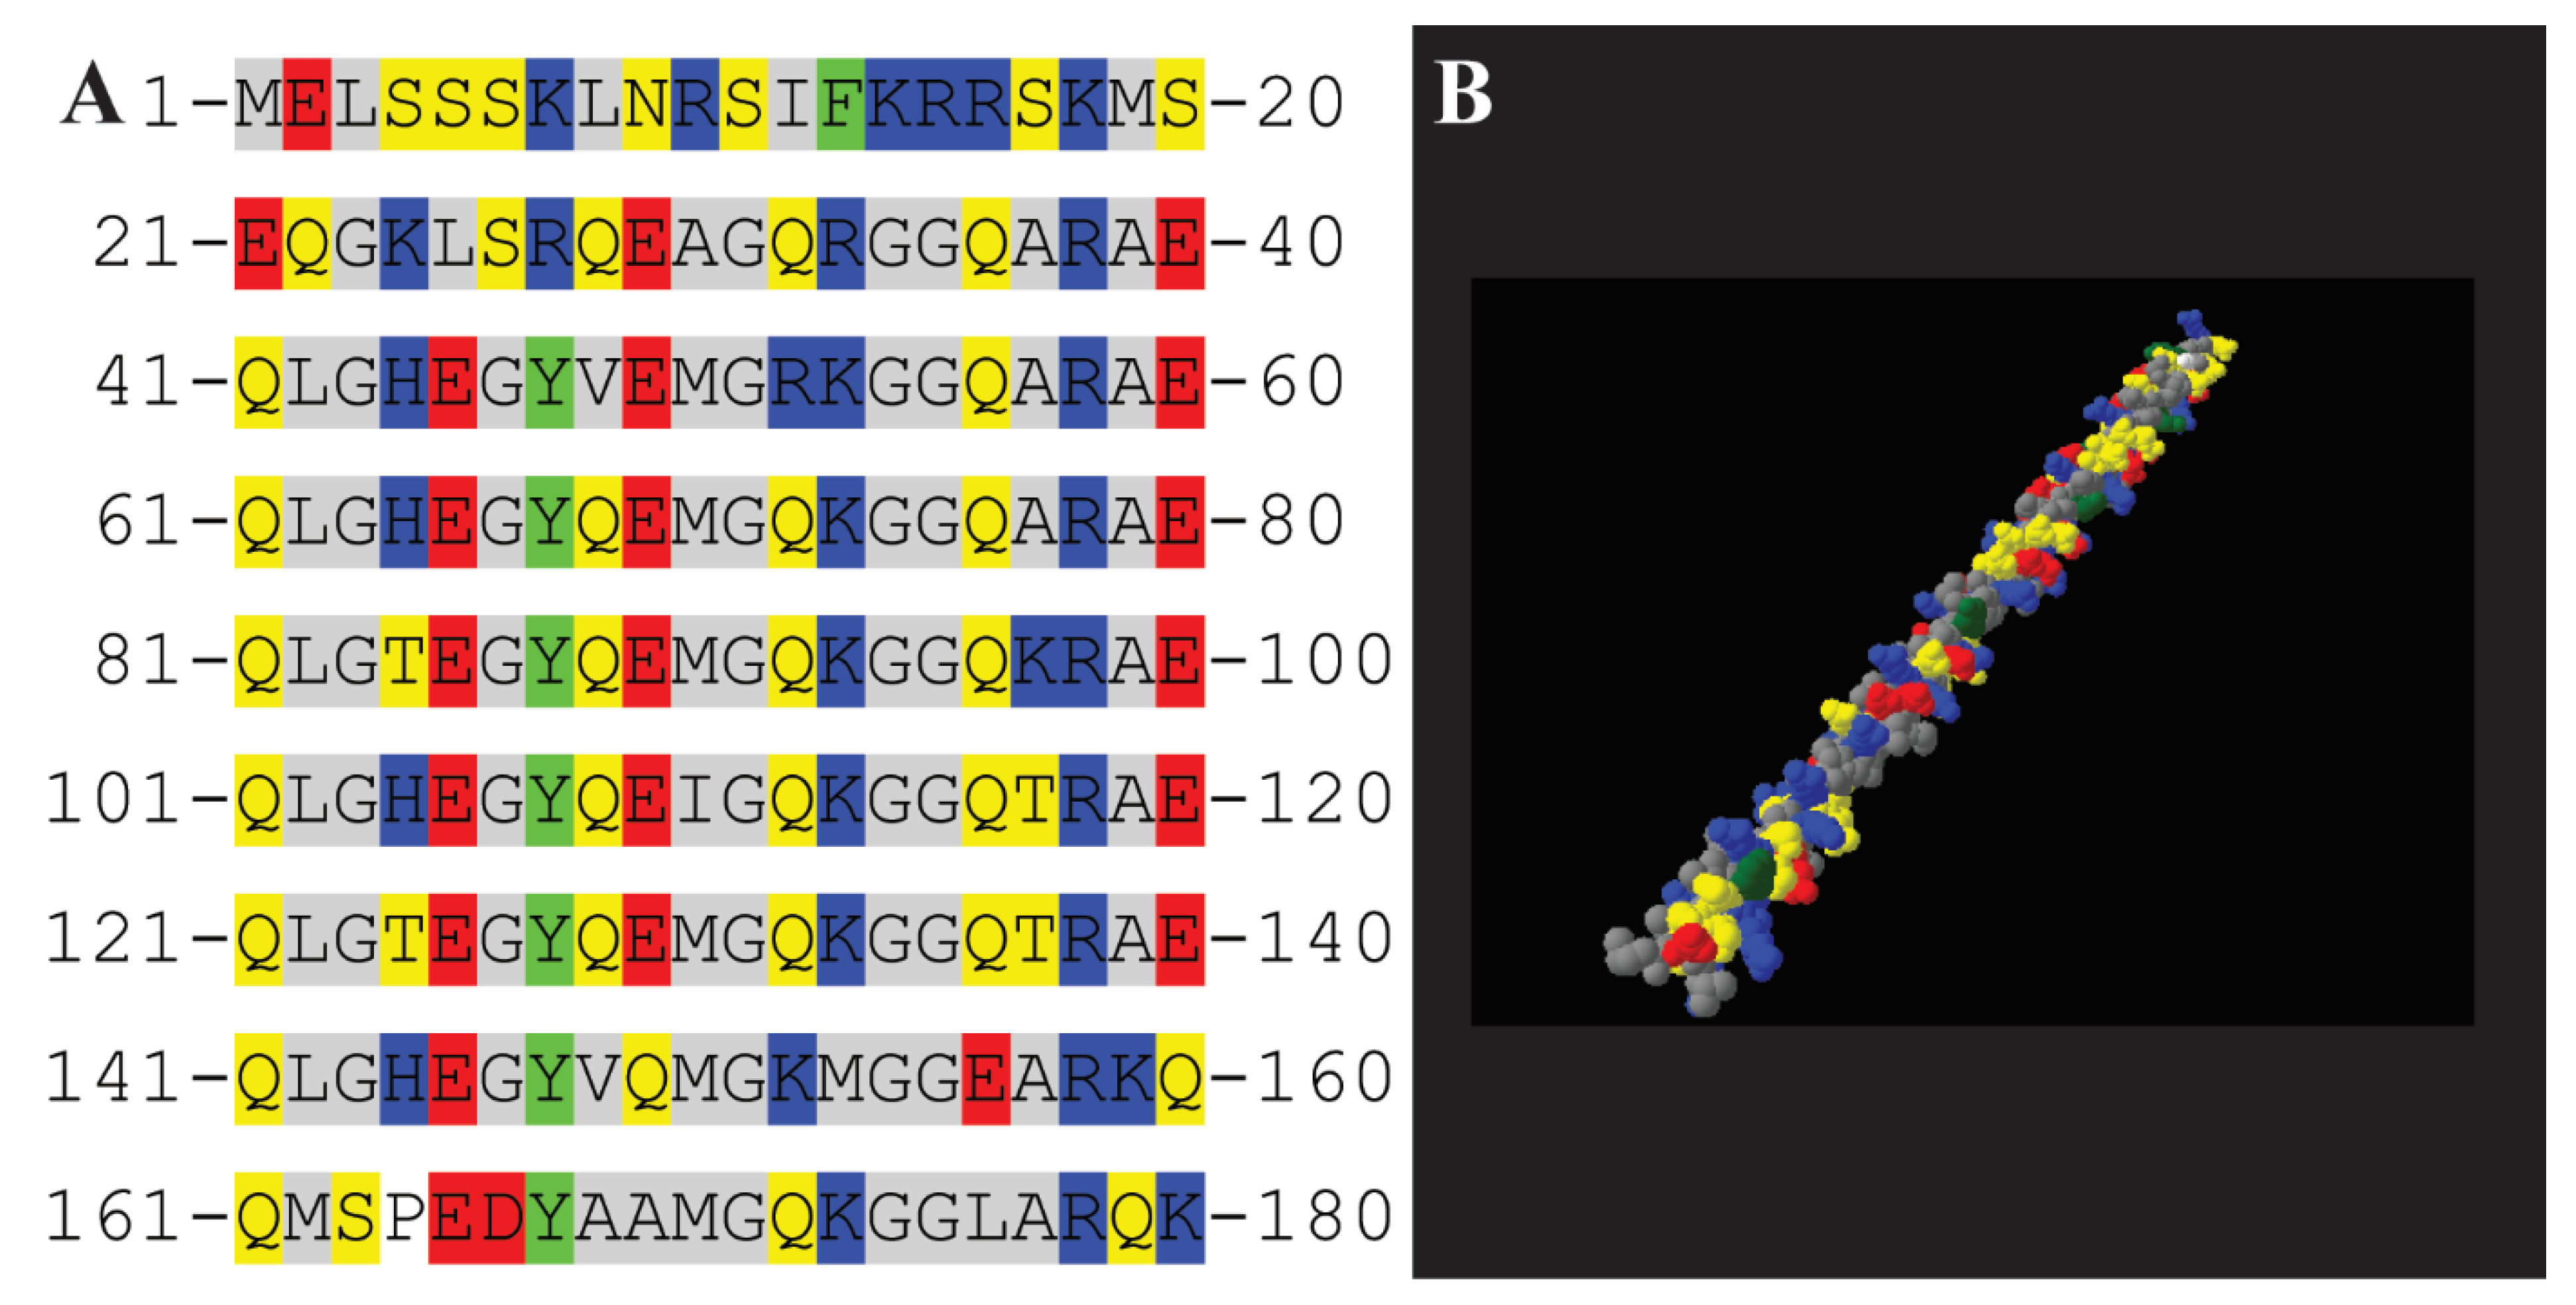
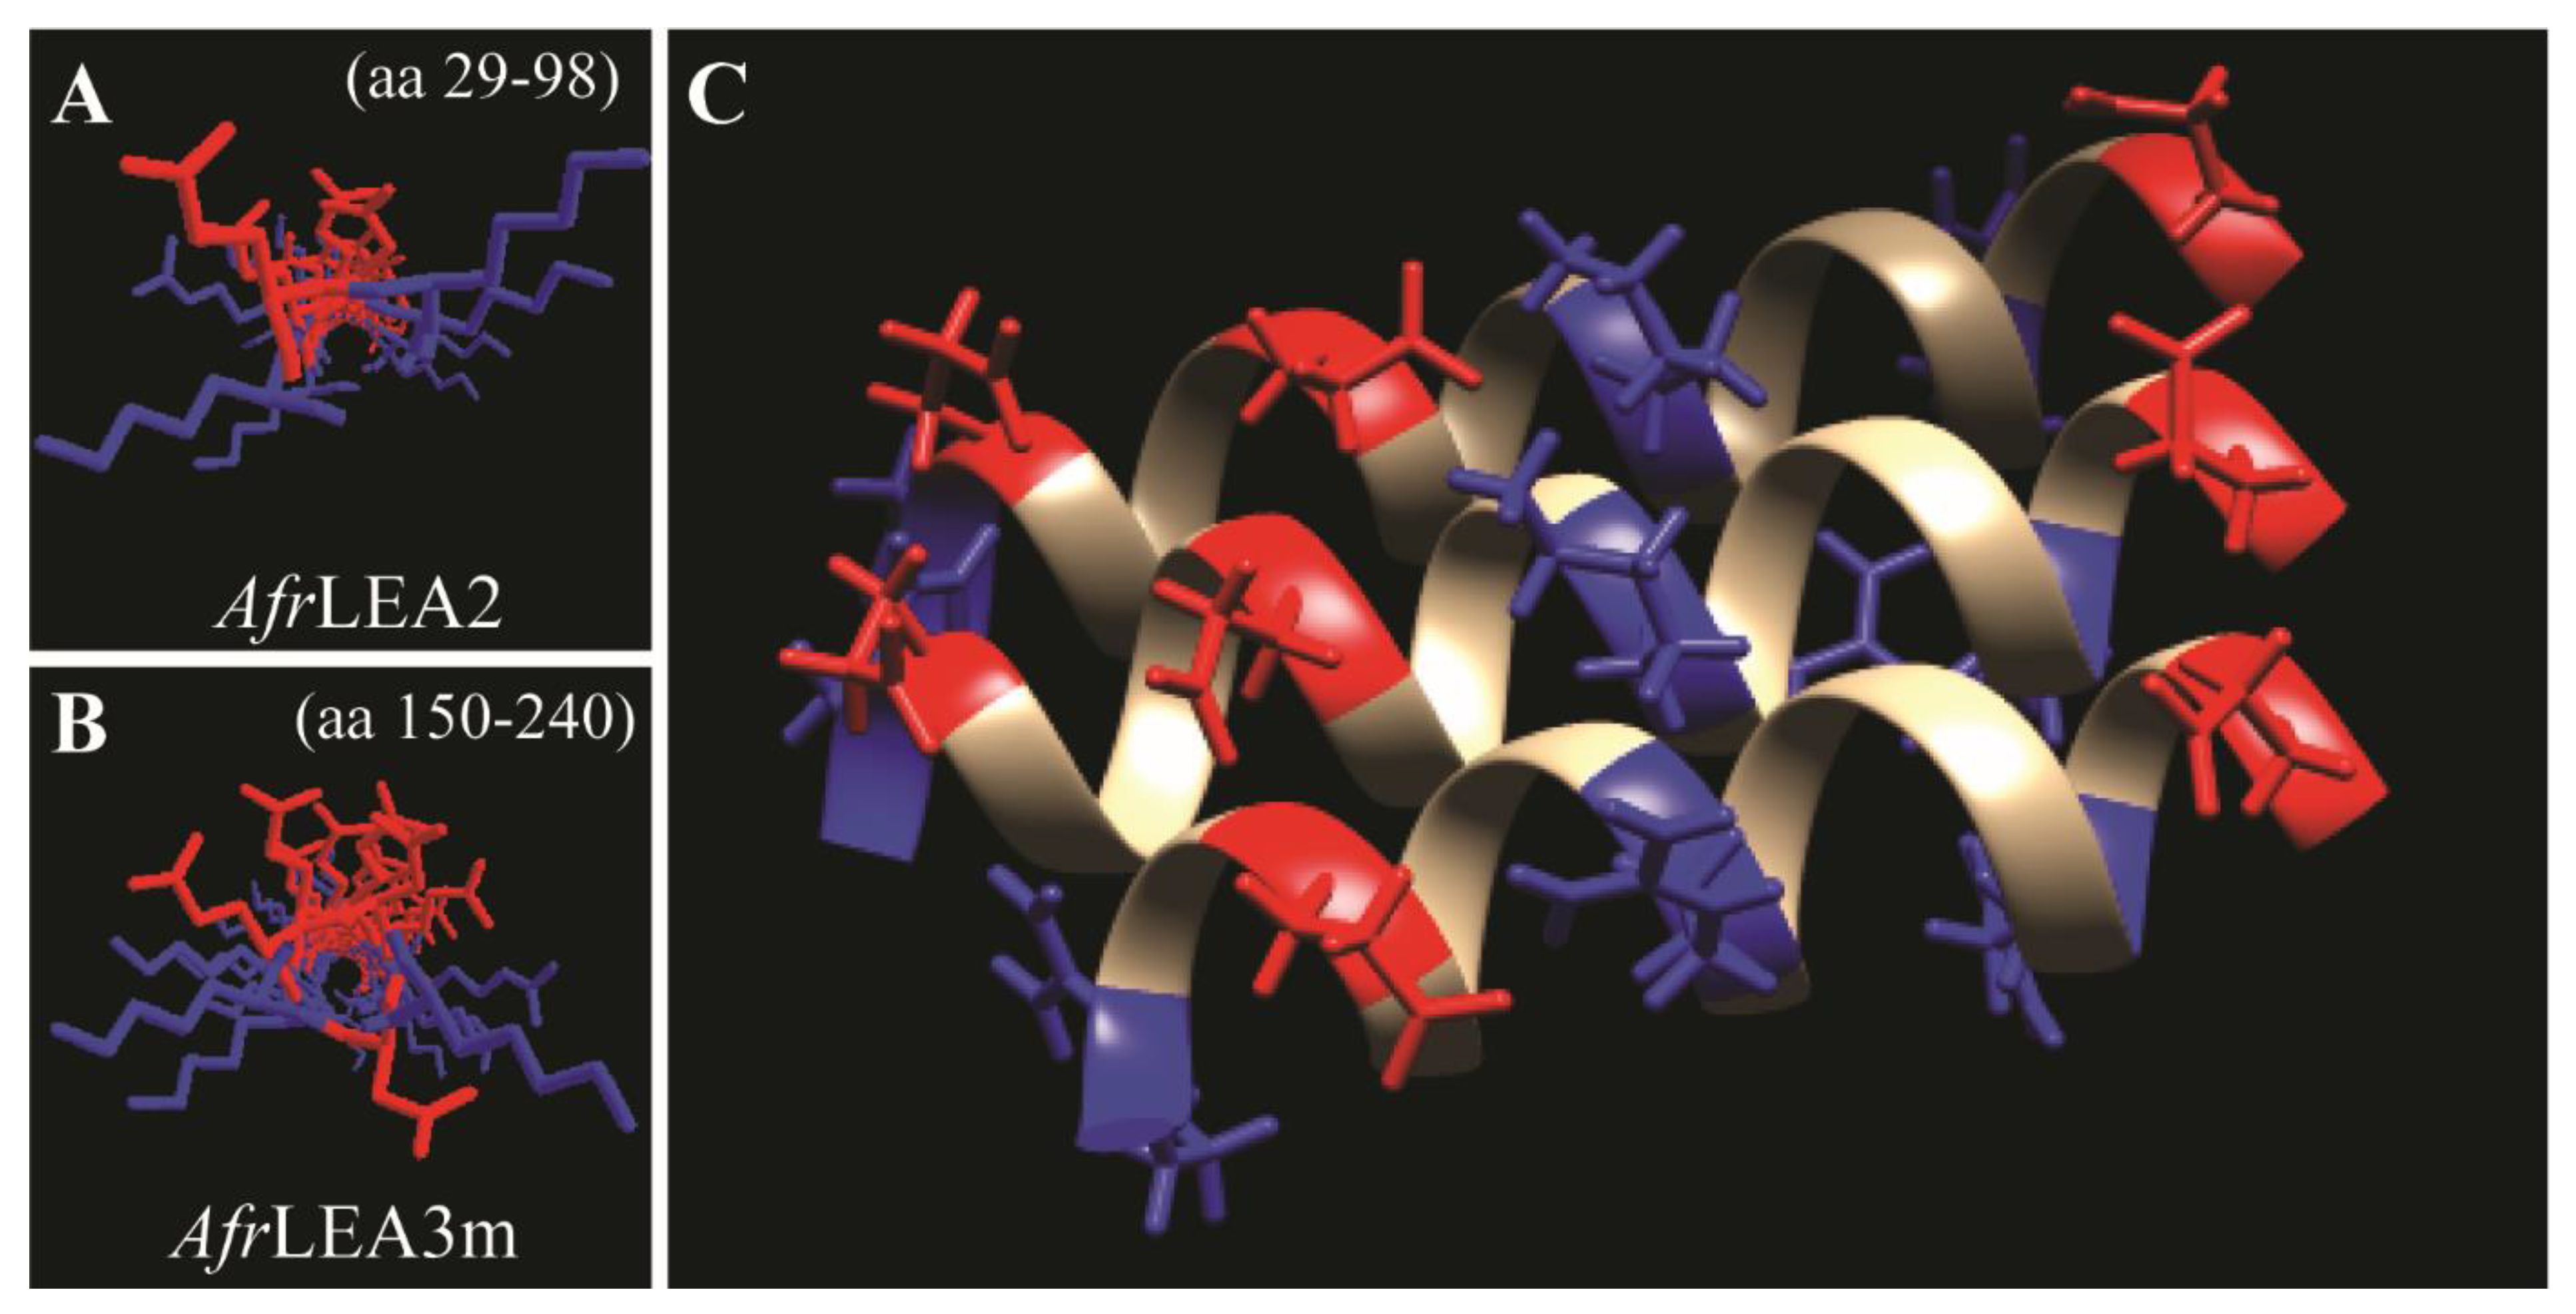
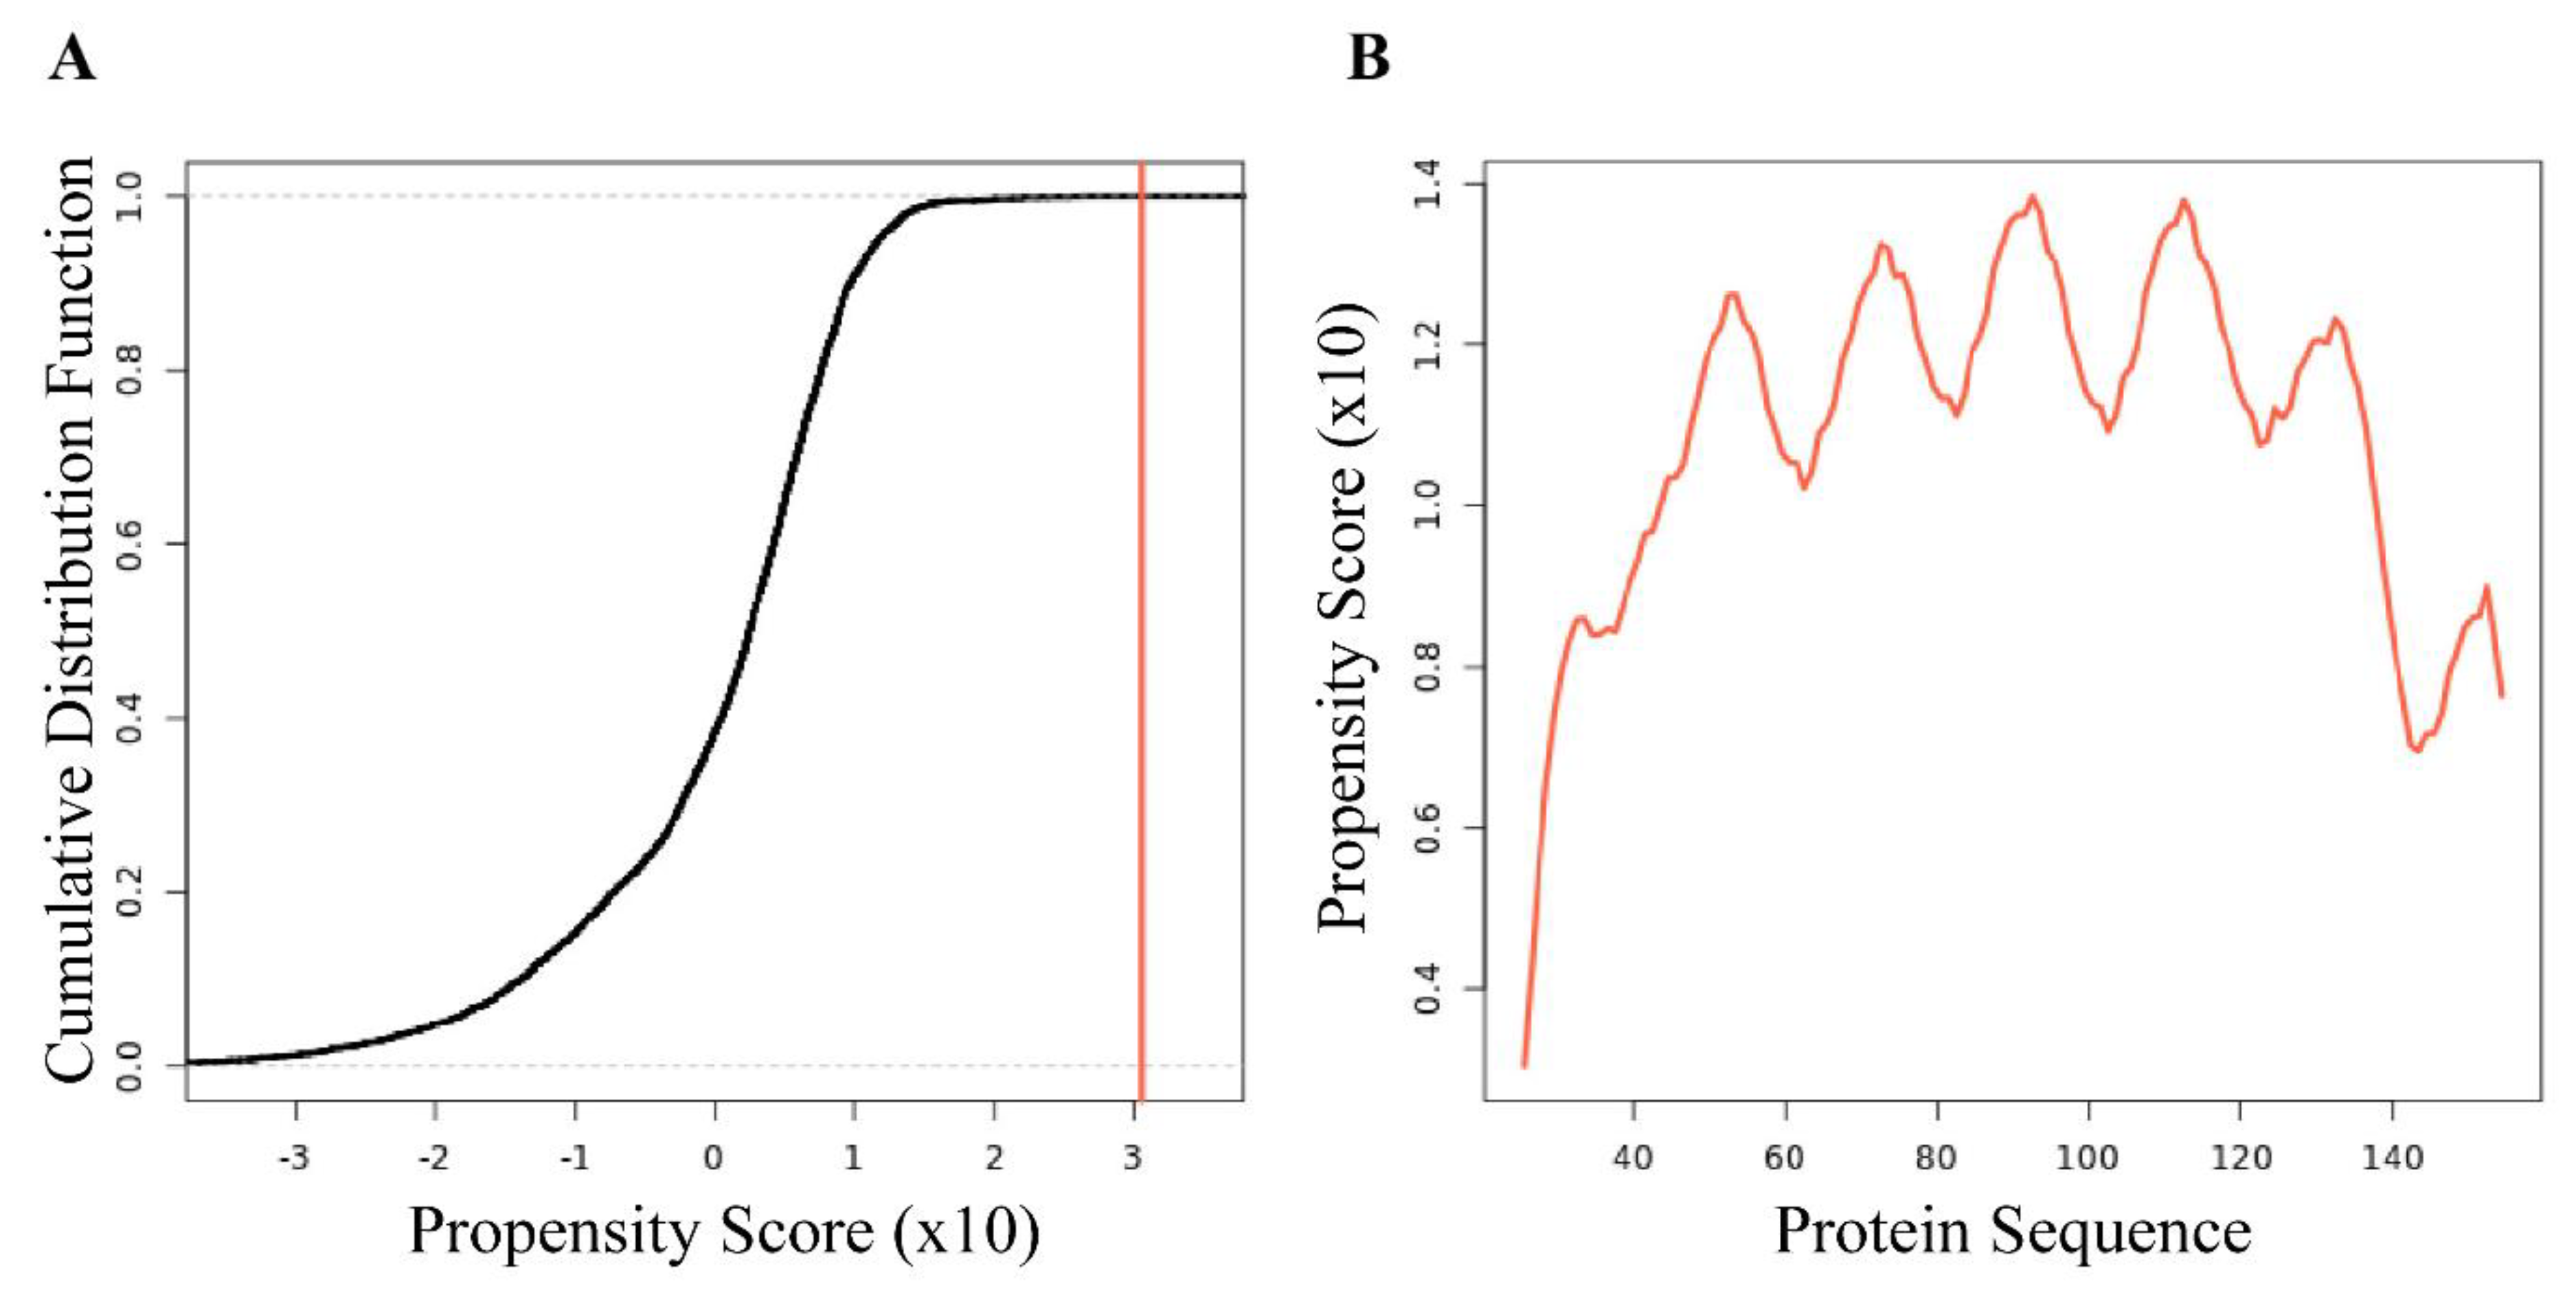
3.3. Computational Interpretation of the Structure of AfLEA1 in the Desiccated State

The I-Tasser program uses X-ray crystallography data to predict protein structure. The program is surprisingly effective at predicting the ordered arrangements of LEA proteins that undergo conformational transitions during desiccation [25], and the secondary structure predictions of I-Tasser fall within 2% of the secondary structure content measured by circular dichroism for desiccated AfLEA1. The α-helices predicted by I-Tasser appear to be organized into a sizeable helical bundle composed of four helix-turn-helix structures, with each helix formed by a single Group 1 LEA consensus sequence and a short spacer containing a histidine residue (Figure 5A). The α-helices propagate from the alanine-arginine-alanine caps, as previously hypothesized [17]. Still, the internal space of the helical bundle is highly enriched in positively charged residues and aromatic residues (Figure 5B).
Although aromatic residues can interact with positively charged residues due to their delocalized π orbitals [42], the small number of aromatic residues does not appear to be sufficient to prevent the electrostatic repulsion of the α-helices in AfLEA1. Despite this source of instability, this structure is similar to a de novo-designed protein built to emulate armadillo repeat proteins (RCSB PDB ID: 5CWH), which has remarkably similar primary, secondary, and tertiary structures [43] to AfLEA1. Armadillo repeat proteins are highly stable and are commonly involved in cell signaling and misfolded protein degradation due to their promiscuous binding behaviors [44,45]. The structure of AfLEA1 appears to be stabilized by similarly charged stripes found on helices proposed for AfrLEA2 and AfrLEA3m [38]. The charge patterns are generated in these two LEA proteins from Group 3 through a specific arrangement of basic and acidic amino acids in the primary sequence (Figure 6A,B). If I-Tasser has accurately predicted the tertiary structure of AfLEA1, then charged stripes arise in this LEA protein from the tertiary association of alpha-helices, thereby stabilizing these helical clusters (Figure 6C) [17].

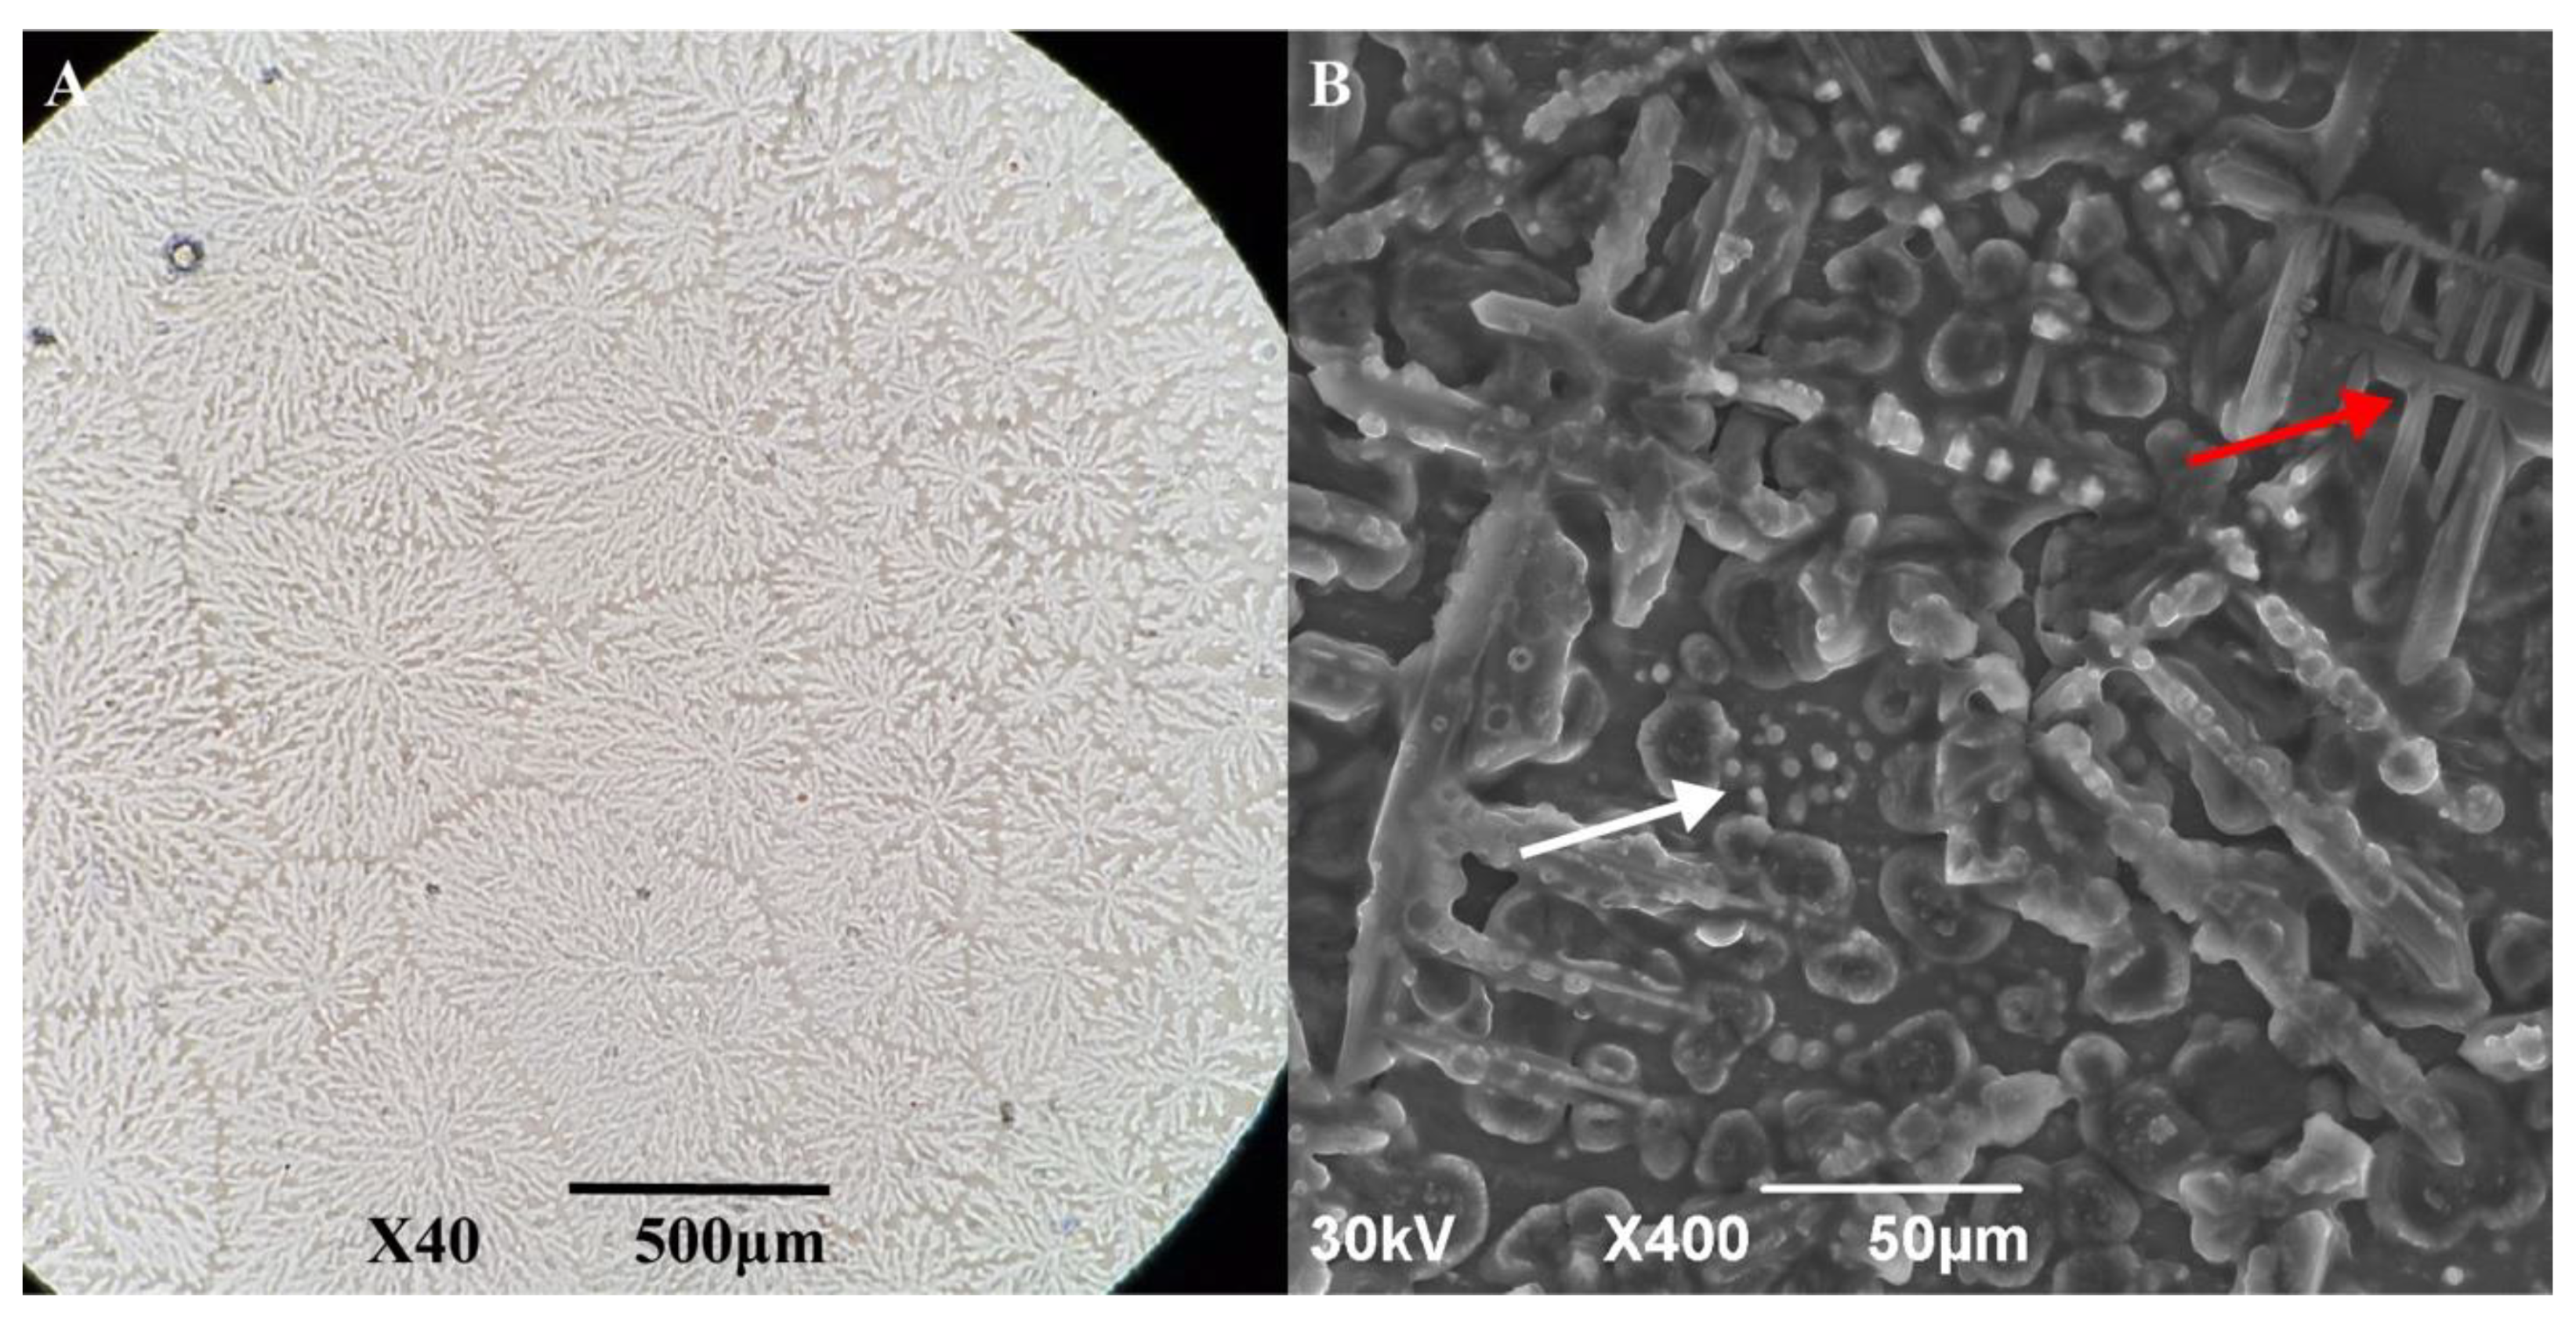
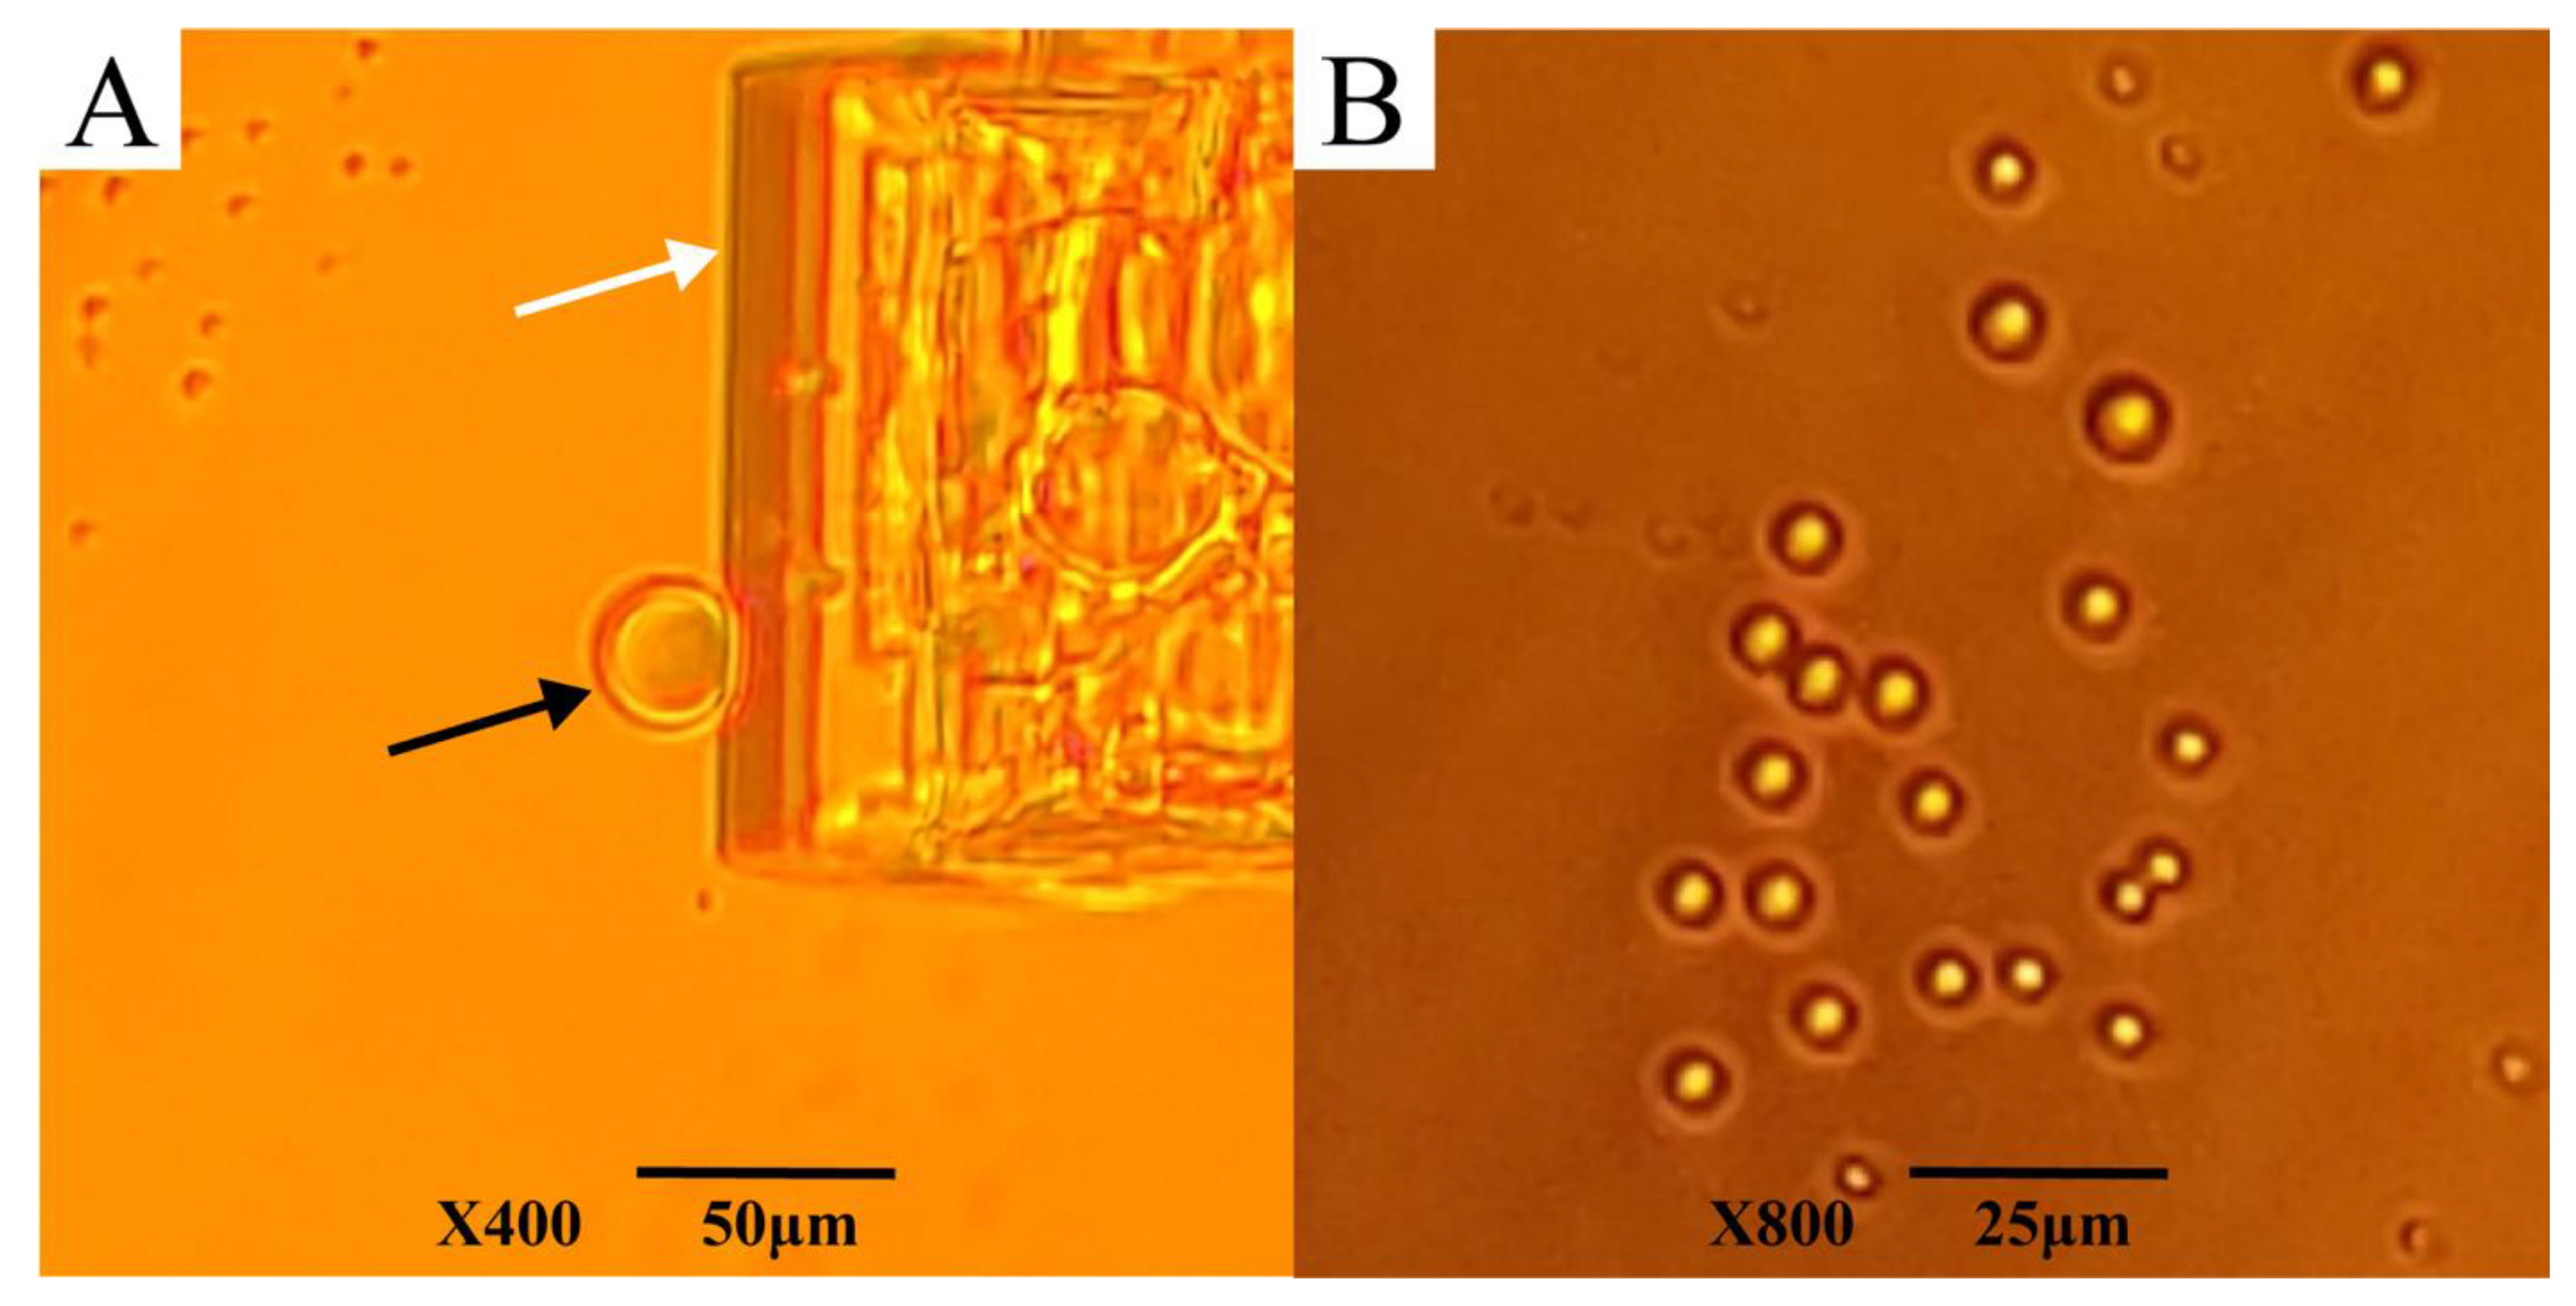
3.4. Behavior of AfLEA1 during Desiccation

Although AfLEA1 appears to evenly distribute itself as an amorphous, glassy deposition during fast desiccation in pure water, as used for circular dichroism, it undergoes crystallization when dried more slowly for hours rather than minutes (Figure 7A). The formation of crystals indicates that AfLEA1 assumes a uniform structure in the desiccated state, as indicated by the circular dichroism data and structural predictions by I-Tasser. Unfortunately, scanning electron microscopy (SEM) reveals that the crystals formed by AfLEA1 during slow drying are of insufficient quality to employ X-ray crystallography to verify the structure of AfLEA1 in the desiccated state (Figure 7B). However, SEM also revealed spherical structures in the desiccated sample similar to those reported for the Group 6 LEA protein AfrLEA6, which is known to undergo LLPS in vitro during desiccation [21].
The program catGranule predicts that AfLEA1 has an exceptionally high propensity to undergo LLPS, particularly when interacting with RNA (Figure 8A,B). Desiccation experiments were conducted in a buffer system that resembles the cellular environment of the encysted embryos of A. franciscana to determine whether AfLEA1 undergoes LLPS in a physiologically more relevant background. At high levels of desiccation, AfLEA1 does appear to undergo LLPS, but this occurs at nearly complete desiccation (Figure 9A), and at these extreme levels of water loss, the observed phenomenon may not be physiologically relevant. Behaviors such as salt-induced precipitation, which may cause proteins to separate from solution, are likely commonplace in the drying cell when protein–protein interactions become unavoidable [46]. The occurrence of LLPS at extreme dehydration may simple be a consequence of water loss, not a protective mechanism during anhydrobiosis. After adding total RNA isolated from A. franciscana to AfLEA1 samples before drying, the protein undergoes an LLPS readily after minor water removal by evaporative drying (Figure 9B). However, additional studies are required to verify that RNA is selectively incorporated into the AfLEA1 dense phase and if the AfLEA1 condensate offers protection against RNA degradation.
The readily observed phase transition behavior of some LEA proteins may warrant revisiting the hydration buffering hypothesis. LLPS behavior involves the reordering of water as water molecules interact with the separating protein to produce a unique fluid with different surface tension, resulting in spherical protein-water droplets. The water contained in the protein-water phase can have properties that vary significantly from the bulk fraction of cytosolic water [47]. The hydration buffer hypothesis postulates that water molecules that are retained and interact at the surface of LEA proteins during dehydration serve as a water reservoir during desiccation [23,48]. In addition to LEA proteins serving as a water reservoir by organizing water molecules at the protein surface, a new organizational feature of water may occur inside of the protein-water droplet that protects desiccation-sensitive biomolecules at different stages of dehydration. Furthermore, changes in water-loss kinetics caused by some LEA proteins could be caused by the different physiochemical behavior of the water fraction in proteinaceous droplets. While associating biomolecular condensates with a general mechanism of desiccation tolerance still appears somewhat premature, research providing evidence for a significant role of proteinaceous phase transitions as part of the anhydrobiotic toolbox has begun to accumulate [6,17,21,49,50].

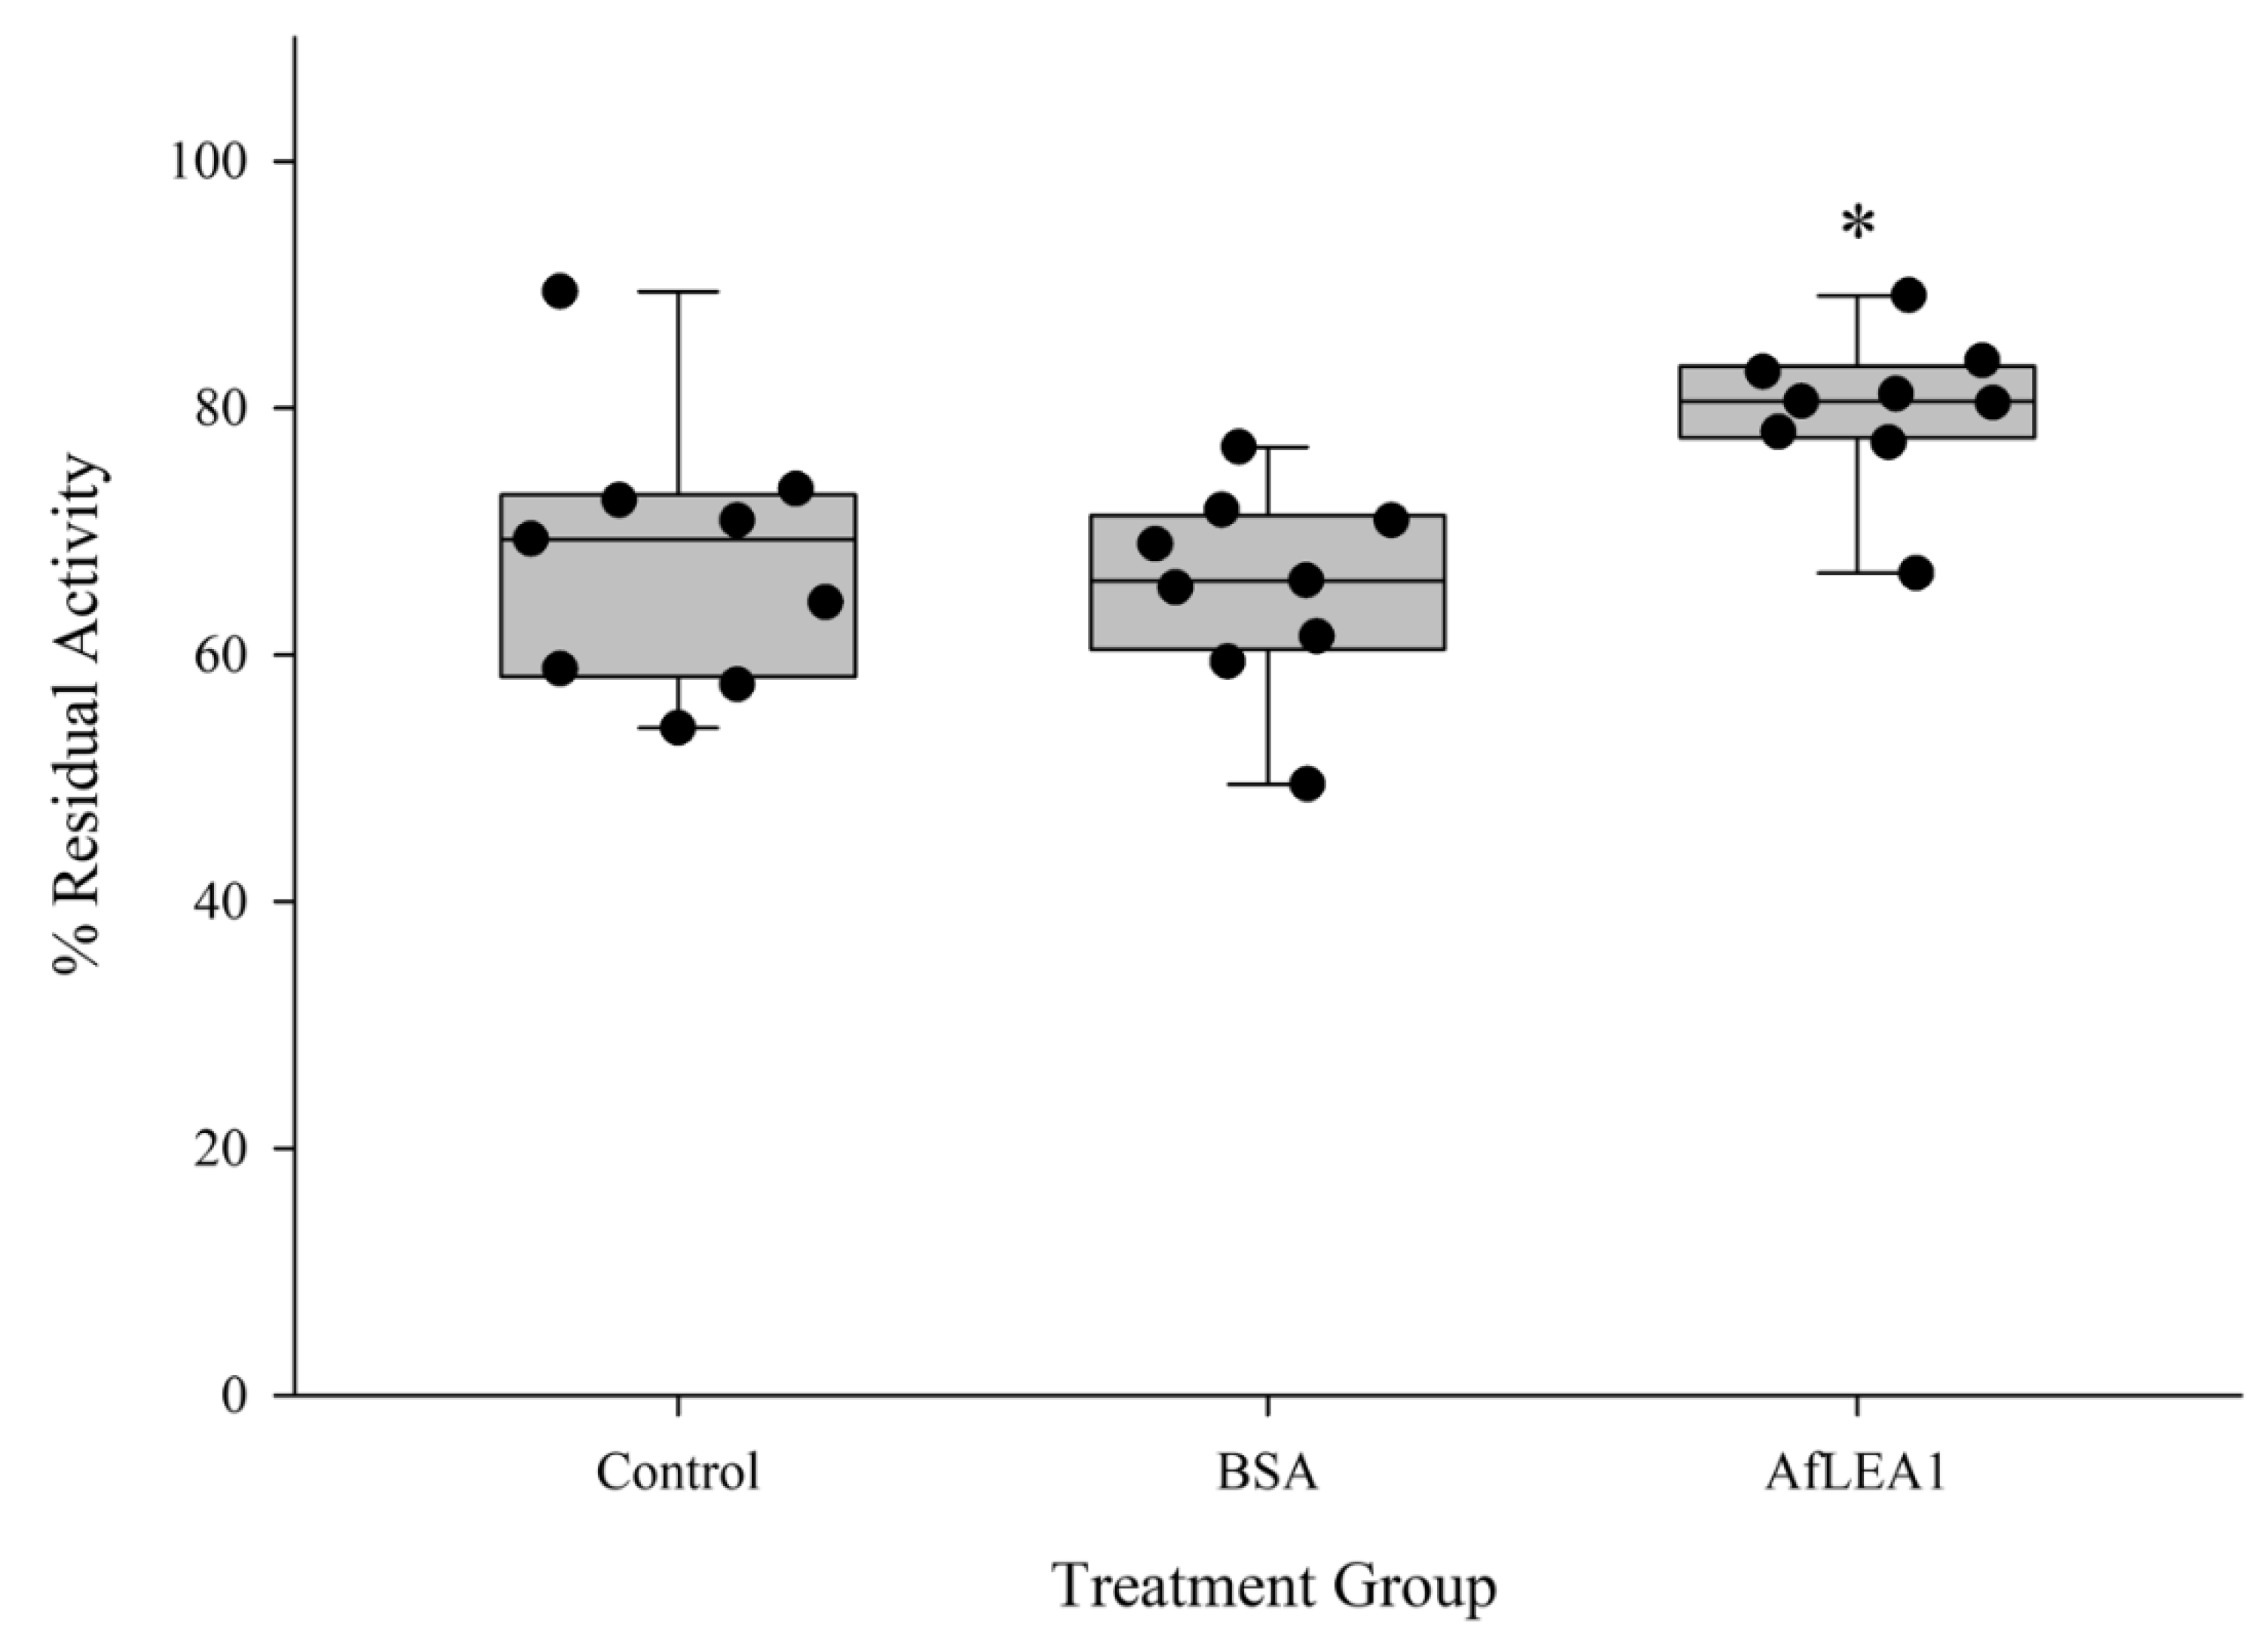
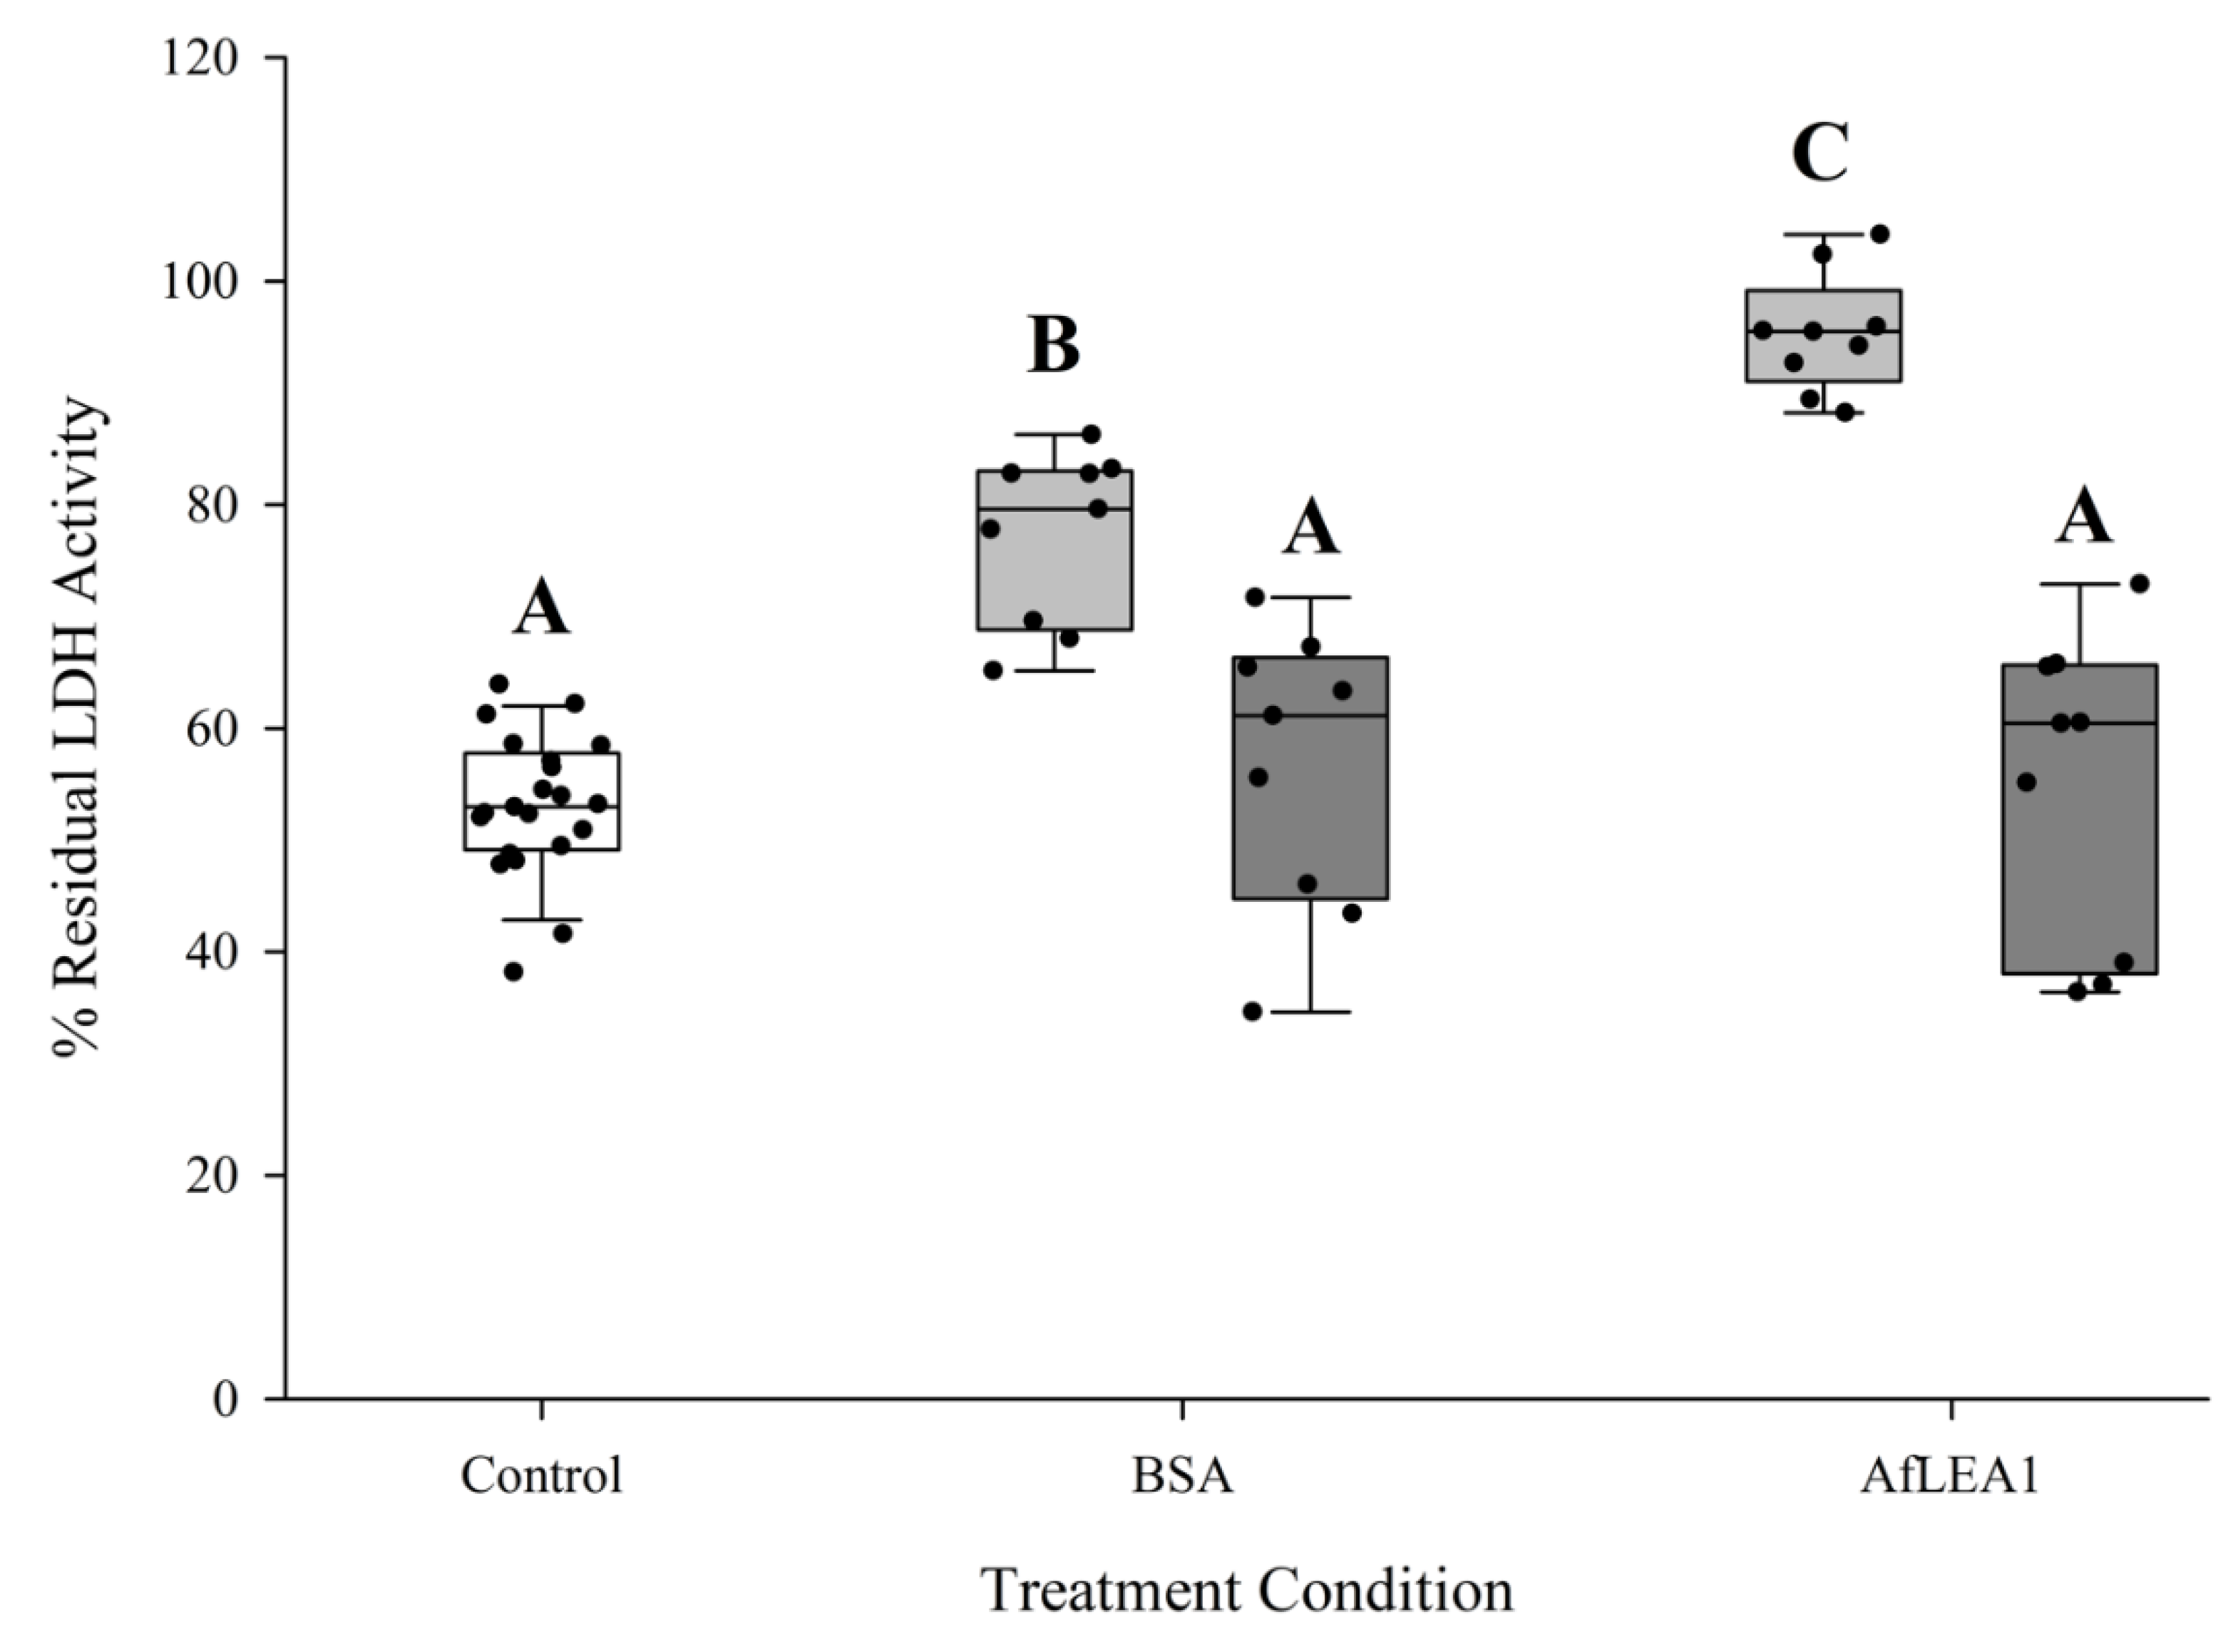
3.5. AfLEA1 Protection of Lactate Dehydrogenase (LDH) Activity during Desiccation and Rehydration

Although the above results may indicate that AfLEA1 is involved in RNA stabilization, one of the leading hypotheses for LEA protein function is the protection of other proteins and membranes during desiccation and rehydration via molecular shielding. Therefore, LDH was desiccated in the presence of AfLEA1 or BSA (Figure 10). Endogenous LDH activity in Kc167 cell lysates that lack LEA proteins was measured to simulate cellular conditions more closely than experiments using purified enzymes can achieve. A significantly higher residual LDH activity after rehydration was observed in samples containing AfLEA1, whereas BSA did not show any improvement over the control (Figure 10). This observation indicates that AfLEA1 offers protection against desiccation-induced protein denaturation, which could have been due to AfLEA1 having a chaperone-like refolding activity. Purified LDH was dried in the absence of AfLEA1 or BSA, and samples were rehydrated with a phosphate buffer or buffer containing either AfLEA1 or BSA to test if enzyme activity is higher if rehydrated with protein-containing solutions. Furthermore, the purified enzyme was dried in the presence or absence of these proteins and rehydrated with phosphate buffer. AfLEA1 preserved nearly 100% of LDH activity during desiccation if added before the onset of water removal but failed to affect LDH activity when only included in the rehydration solution (Figure 11). Therefore, AfLEA1 improved the desiccation tolerance through interactions with LDH during drying or in the desiccated state. BSA offered lesser protection against desiccation-induced loss of LDH activity to the purified enzyme than AfLEA1 when desiccated together with LDH and did not improve the LDH activity if only present during rehydration (Figure 11). It is noteworthy that the protection conferred by BSA to LDH activity was only observed for experiments using the purified enzyme but not in a more complex proteome sample. These results again demonstrate that the insights gained by experiments using purified targets are limited, and caution is warranted when extending these results to physiologically relevant contexts.

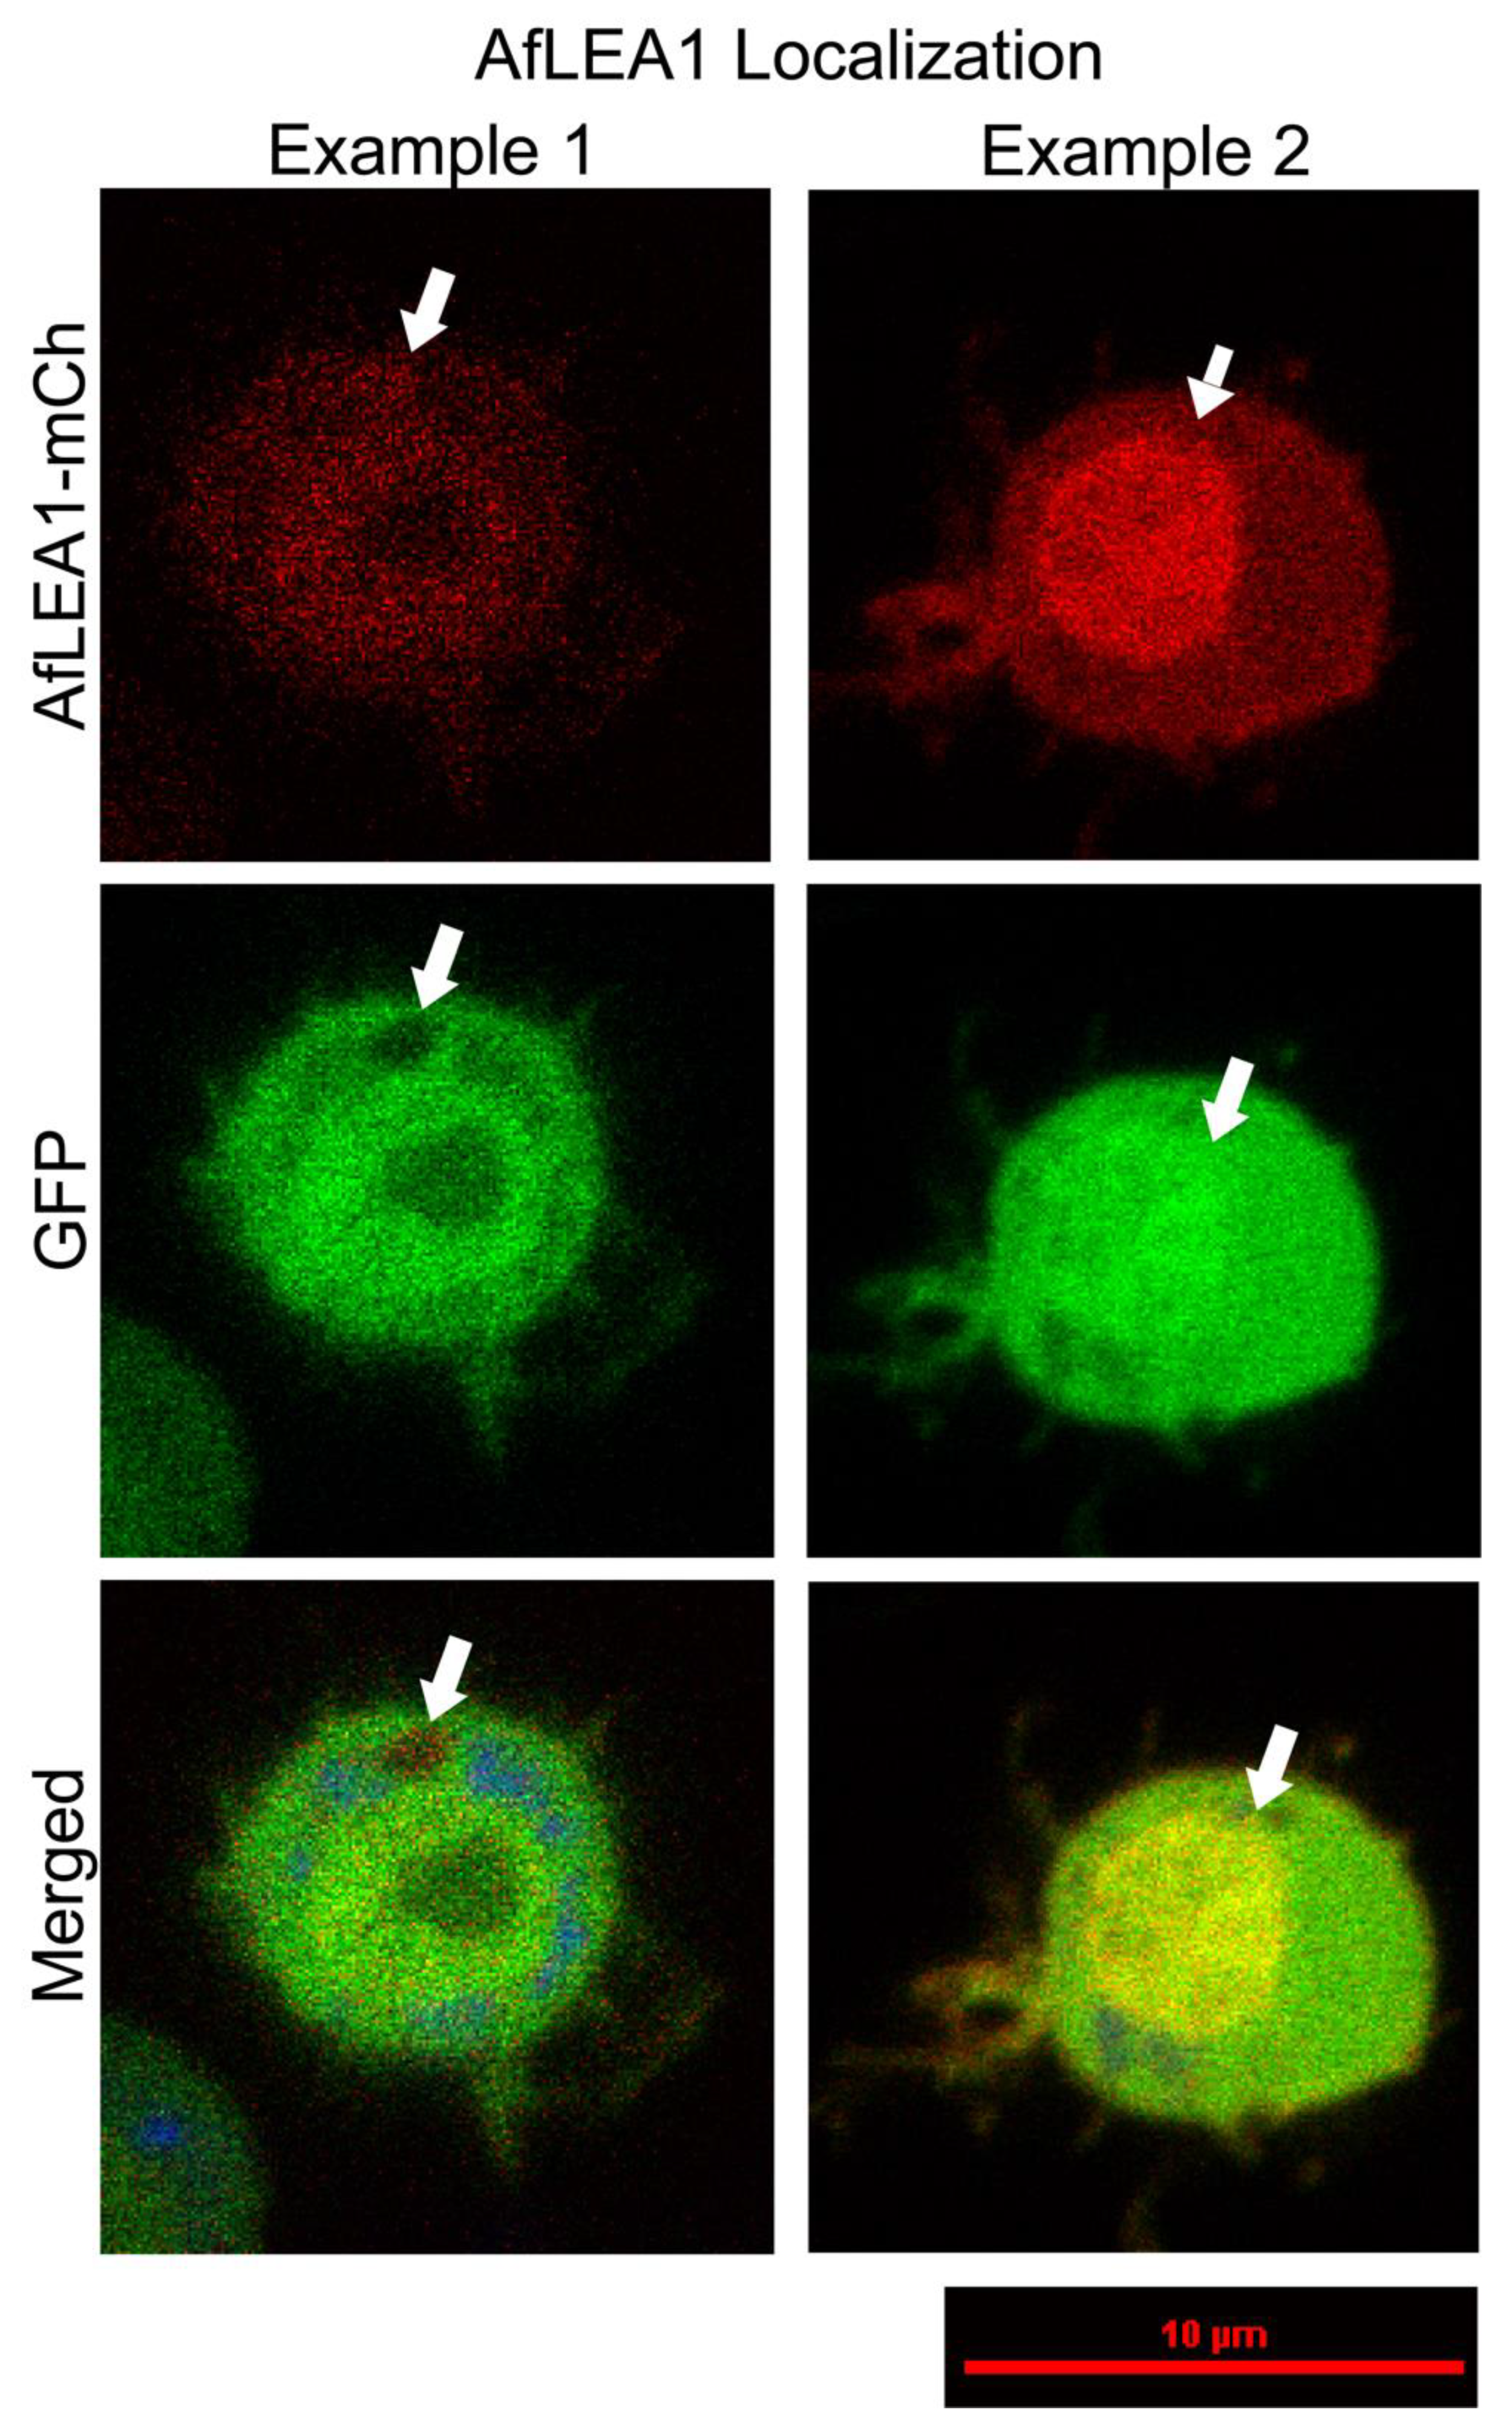
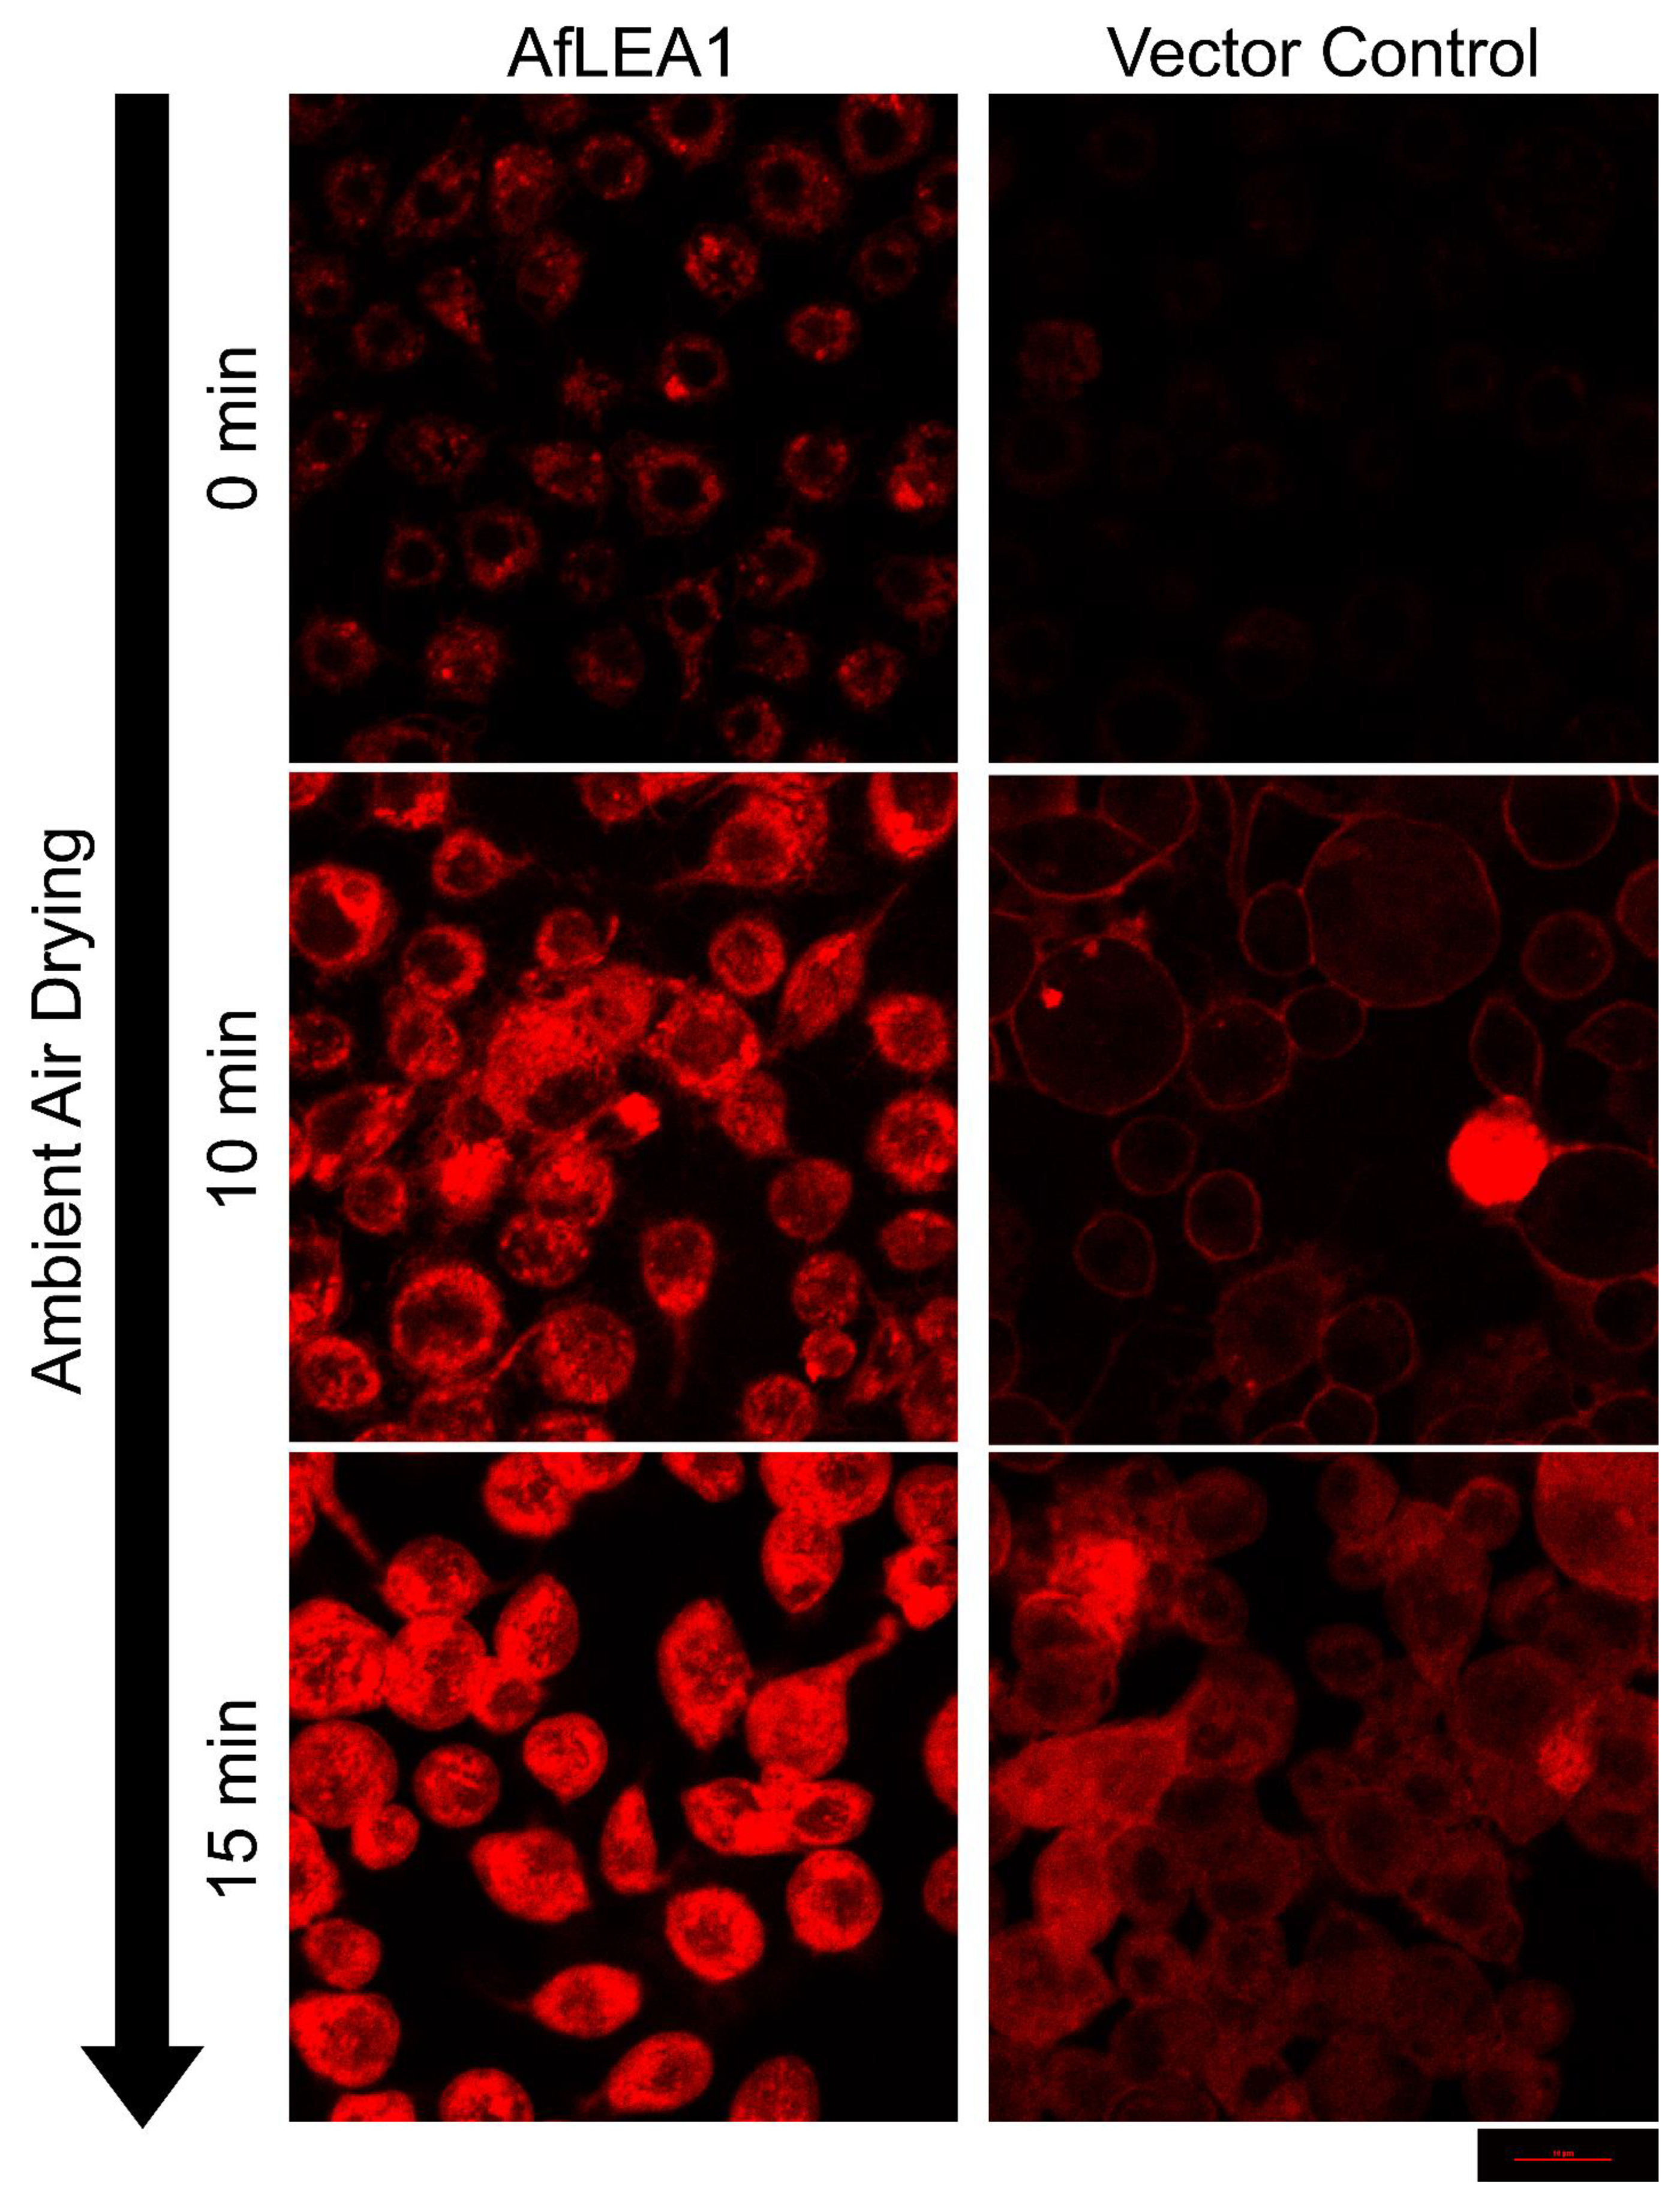
3.6. AfLEA1 Expressed in Kc167 Cells from D. melanogaster Cells Localizes to the Cytoplasm and Improves Cellular Structural Integrity during Desiccation

Kc167 cells from D. melanogaster ectopically co-expressing AfLEA1-mCherry and GFP were stained with MitoView Blue and imaged using confocal microscopy. AfLEA1 was primarily found to localize to the cytoplasm and not the mitochondria, corroborating previously published results (Figure 12). Structures resembling proteinaceous condensates were observed in approximately 38% of AfLEA1-expressing cells when observed by confocal microscopy (Figure 12 and Figure S3, Supplementary Materials). These structures were not detected in the previous work, utilizing conventional fluorescence microscopy [12]. The exclusion of GFP from these condensates suggests that this compartment may be an LLPS of AfLEA1, an interpretation strengthened by the observation that AfLEA1 in vitro readily undergoes an LLPS in the presence of RNA (Figure 9B). In addition, AfLEA1 appeared to accumulate in the nucleus in approximately 23% of cells (Figure 12 and Figure S3, Supplementary Materials). We speculate that the formation of an AfLEA1 condensate and the protein accumulation in the nucleus may be due to interactions with nucleic acids that differ among cell cycle stages. However, additional cell-based studies exploring alternative expression and visualization approaches are needed to confirm any physiological significance of these observations.
During desiccation, Kc167 cells ectopically expressing untagged AfLEA1 displayed a robust increase in intracellular viscosity over the vector control cells when stained with Nile Red (Figure 13). Nile Red is a solvatochromatic dye that can increase in fluoresce intensity with increasing viscosity of the cytoplasm [51,52,53,54,55]. Increasing intracellular viscosity during modest dehydration likely helps impede molecular movement and prevent undesirable chemical reactions until more efficient glasses of protein and sugar can form [5,56,57]. Furthermore, the fusion of the plasma membranes during desiccation was significantly reduced in AfLEA1-expressing cells compared to the vector control. These results are like those obtained using AfrLEA6, possibly suggesting that both proteins utilize similar molecular mechanisms to confer protection during desiccation. However, despite sharing similar promiscuous protection mechanisms, different groups of biomolecules may be targeted by both proteins (e.g., proteins, nucleic acids, or lipids).

4. Conclusions

AfLEA1 and its protein variants in the animal extremophile A. franciscana are the only known Group 1 LEA proteins in this kingdom of life. Based on our findings, their highly repetitive structure aids in consistent protein folding behaviors during desiccation. The repetitive motifs in AfLEA1 may further act as multivalence sites for protein–protein and protein–RNA interactions. We speculate that this will be similar for LEA proteins from Group 1 found in other organisms. The readily observed phase separation of AfLEA1 in the presence of RNA in vitro strongly suggests a direct interaction between both biomolecules. However, AfLEA1 also improves the desiccation tolerance of proteins, such as LDH, making this protein promiscuous in its target selection. Based on these findings, we speculate Group 1 LEA proteins such as AfLEA1 may offer multiple modes of protection against desiccation-induced damage at different cellular hydration levels to various classes of biomolecules.
The reason(s) for multiple Group 1 LEA proteins that virtually only differ in their number of Group 1 repeats in A. franciscana is intriguing and requires further investigation. Similar Group 1 LEA proteins with different molecular mobilities may be advantageous during desiccation. Larger Group 1 LEA proteins may rapidly increase the viscosity of the cellular compartments at high water contents, thereby preventing protein aggregation and membrane collapse. In contrast, smaller Group 1 LEA proteins have higher mobility and can more readily interact with targets in this highly dense environment. We suspect the observed LLPS of AfLEA1 in the presence of RNA is a feature of other LEA proteins from Group 1, strengthening the notion that this recently observed phenomenon could be a common protective mechanism in the toolbox of anhydrobiotic organisms.

Supplementary Materials

The following supporting information can be downloaded at: https://www.mdpi.com/article/10.3390/biom12030425/s1. Table S1: Both AfLEA1 elution fractions display a tendency to elute a lower sodium concentration with increasing amounts of protein loaded. Figure S1: The elution maxima (retention time) of AfLEA1 tends to correlate with the amount of loaded protein (peak height). Figure S2: The CD spectra of AfLEA1 measured in solution (green), in the desiccated state (blue), and when crowded via 2% v/v SDS (magenta). Figure S3: Relative frequencies of unique morphologies observed in Kc167 Drosophila melanogaster cells ectopically expressing AfLEA1-mCherry (A–J).

Author Contributions

Conceptualization, B.J., C.B. and M.A.M.; methodology, B.J., C.B. and M.A.M.; software, B.J. and C.B.; validation, B.J., C.B. and M.A.M.; formal analysis, B.J., C.B. and M.A.M.; investigation, B.J., C.B. and T.B.; resources, M.A.M.; data curation, B.J. and C.B.; writing—original draft preparation, B.J. and C.B.; writing—review and editing, M.A.M.; visualization, B.J. and C.B.; supervision, M.A.M.; project administration, M.A.M.; funding acquisition, M.A.M. All authors have read and agreed to the published version of the manuscript.

Funding

This work was funded by the National Science Foundation [IOS-1659970].

Institutional Review Board Statement

Not applicable.

Informed Consent Statement

Not applicable.

Data Availability Statement

Data is contained within the article or Supplementary Materials.

Acknowledgments

Not applicable.

Conflicts of Interest

The authors declare that they have no conflict of interest.

Abbreviations

IDPIntrinsically Disordered Protein
LEALate Embryogenesis Abundant
LLPSLiquid–Liquid Phase Separation
LDHLactate Dehydrogenase

References

  1. Baker, J.; Van Dennsteele, C.; Dure, L., 3rd. Sequence and characterization of 6 Lea proteins and their genes from cotton. Plant Mol. Biol. 1988, 11, 277–291. [Google Scholar] [CrossRef] [PubMed]
  2. Hincha, D.K.; Thalhammer, A. LEA proteins: IDPs with versatile functions in cellular dehydration tolerance. Biochem. Soc. Trans. 2012, 40, 1000–1003. [Google Scholar] [CrossRef] [PubMed] [Green Version]
  3. Tunnacliffe, A.; Wise, M.J. The continuing conundrum of the LEA proteins. Naturwissenschaften 2007, 94, 791–812. [Google Scholar] [CrossRef] [PubMed]
  4. Graether, S.P.; Boddington, K.F. Disorder and function: A review of the dehydrin protein family. Front. Plant Sci. 2014, 5, 576. [Google Scholar] [CrossRef] [Green Version]
  5. Hand, S.C.; Menze, M.A.; Toner, M.; Boswell, L.; Moore, D. LEA proteins during water stress: Not just for plants anymore. Annu. Rev. Physiol. 2011, 73, 115–134. [Google Scholar] [CrossRef] [Green Version]
  6. Janis, B.; Belott, C.; Menze, M.A. Role of Intrinsic Disorder in Animal Desiccation Tolerance. Proteomics 2018, 18, e1800067. [Google Scholar] [CrossRef] [Green Version]
  7. Hunault, G.; Jaspard, E. LEAPdb: A database for the late embryogenesis abundant proteins. BMC Genom. 2010, 11, 221. [Google Scholar] [CrossRef] [Green Version]
  8. Hand, S.C.; Jones, D.; Menze, M.A.; Witt, T.L. Life without water: Expression of plant LEA genes by an anhydrobiotic arthropod. J. Exp. Zool. Part A Ecol. Genet. Physiol. 2007, 307, 62–66. [Google Scholar] [CrossRef] [Green Version]
  9. Wu, G.; Zhang, H.; Sun, J.; Liu, F.; Ge, X.; Chen, W.H.; Yu, J.; Wang, W. Diverse LEA (late embryogenesis abundant) and LEA-like genes and their responses to hypersaline stress in post-diapause embryonic development of Artemia franciscana. Comp Biochem. Physiol. B Biochem. Mol. Biol 2011, 160, 32–39. [Google Scholar] [CrossRef]
  10. Warner, A.H.; Miroshnychenko, O.; Kozarova, A.; Vacratsis, P.O.; MacRae, T.H.; Kim, J.; Clegg, J.S. Evidence for multiple group 1 late embryogenesis abundant proteins in encysted embryos of Artemia and their organelles. J. Biochem. 2010, 148, 581–592. [Google Scholar] [CrossRef]
  11. Toxopeus, J.; Warner, A.H.; MacRae, T.H. Group 1 LEA proteins contribute to the desiccation and freeze tolerance of Artemia franciscana embryos during diapause. Cell Stress Chaperones 2014, 19, 939–948. [Google Scholar] [CrossRef] [PubMed] [Green Version]
  12. Marunde, M.R.; Samarajeewa, D.A.; Anderson, J.; Li, S.; Hand, S.C.; Menze, M.A. Improved tolerance to salt and water stress in Drosophila melanogaster cells conferred by late embryogenesis abundant protein. J. Insect Physiol. 2013, 59, 377–386. [Google Scholar] [CrossRef] [PubMed] [Green Version]
  13. Warner, A.H.; Guo, Z.H.; Moshi, S.; Hudson, J.W.; Kozarova, A. Study of model systems to test the potential function of Artemia group 1 late embryogenesis abundant (LEA) proteins. Cell Stress Chaperones 2016, 21, 139–154. [Google Scholar] [CrossRef] [PubMed] [Green Version]
  14. Clegg, J.S. The origin of trehalose and its significance during the formation of encysted dormant embryos of Artemia salina. Comp. Biochem. Physiol. 1965, 14, 135–143. [Google Scholar] [CrossRef]
  15. Clegg, J.S. Free glycerol in dormant cysts of the brine shrimp Artemia salina, and its disappearance during development. Biol. Bull. 1962, 123, 295–301. [Google Scholar] [CrossRef]
  16. Candotto Carniel, F.; Fernandez-Marín, B.; Arc, E.; Craighero, T.; Laza, J.M.; Incerti, G.; Tretiach, M.; Kranner, I. How dry is dry? Molecular mobility in relation to thallus water content in a lichen. J. Exp. Bot. 2021, 72, 1576–1588. [Google Scholar] [CrossRef]
  17. Janis, B.; Uversky, V.N.; Menze, M.A. Potential functions of LEA proteins from the brine shrimp Artemia franciscana—Anhydrobiosis meets bioinformatics. J. Biomol. Struct. Dyn. 2017, 36, 3291–3309. [Google Scholar] [CrossRef] [Green Version]
  18. Anderson, J.M.; Hand, S.C. Transgenic expression of late embryogenesis abundant proteins improves tolerance to water stress in Drosophila melanogaster. J. Exp. Biol. 2021, 224, jeb238204. [Google Scholar] [CrossRef]
  19. Knox-Brown, P.; Rindfleisch, T.; Günther, A.; Balow, K.; Bremer, A.; Walther, D.; Miettinen, M.S.; Hincha, D.K.; Thalhammer, A. Similar Yet Different-Structural and Functional Diversity among Arabidopsis thaliana LEA_4 Proteins. Int. J. Mol. Sci. 2020, 21, 2794. [Google Scholar] [CrossRef] [Green Version]
  20. Navarro-Retamal, C.; Bremer, A.; Alzate-Morales, J.; Caballero, J.; Hincha, D.K.; González, W.; Thalhammer, A. Molecular dynamics simulations and CD spectroscopy reveal hydration-induced unfolding of the intrinsically disordered LEA proteins COR15A and COR15B from Arabidopsis thaliana. Phys. Chem. Chem. Phys. 2016, 18, 25806–25816. [Google Scholar] [CrossRef] [Green Version]
  21. Belott, C.; Janis, B.; Menze, M.A. Liquid-liquid phase separation promotes animal desiccation tolerance. Proc. Natl. Acad. Sci. USA 2020, 117, 27676–27684. [Google Scholar] [CrossRef] [PubMed]
  22. Chakrabortee, S.; Tripathi, R.; Watson, M.; Schierle, G.S.; Kurniawan, D.P.; Kaminski, C.F.; Wise, M.J.; Tunnacliffe, A. Intrinsically disordered proteins as molecular shields. Mol. Biosyst. 2012, 8, 210–219. [Google Scholar] [CrossRef] [PubMed] [Green Version]
  23. Mouillon, J.M.; Gustafsson, P.; Harryson, P. Structural investigation of disordered stress proteins. Comparison of full-length dehydrins with isolated peptides of their conserved segments. Plant Physiol. 2006, 141, 638–650. [Google Scholar] [CrossRef] [PubMed] [Green Version]
  24. Centner, C.S.; Moore, J.T.; Baxter, M.E.; Long, Z.T.; Miller, J.M.; Kovatsenko, E.S.; Xie, B.; Menze, M.A.; Berson, R.E.; Bates, P.J.; et al. Acoustofluidic-mediated molecular delivery to human T cells with a three-dimensional-printed flow chamber. J. Acoust. Soc. Am. 2021, 150, 4534–4547. [Google Scholar] [CrossRef]
  25. Yang, J.; Yan, R.; Roy, A.; Xu, D.; Poisson, J.; Zhang, Y. The I-TASSER Suite: Protein structure and function prediction. Nat. Methods 2015, 12, 7–8. [Google Scholar] [CrossRef] [Green Version]
  26. Yang, J.; Zhang, Y. I-TASSER server: New development for protein structure and function predictions. Nucleic Acids Res. 2015, 43, W174–W181. [Google Scholar] [CrossRef] [Green Version]
  27. Roy, A.; Kucukural, A.; Zhang, Y. I-TASSER: A unified platform for automated protein structure and function prediction. Nat. Protoc. 2010, 5, 725–738. [Google Scholar] [CrossRef] [Green Version]
  28. Guex, N.; Peitsch, M.C. SWISS-MODEL and the Swiss-PdbViewer: An environment for comparative protein modeling. Electrophoresis 1997, 18, 2714–2723. [Google Scholar] [CrossRef]
  29. Bolognesi, B.; Lorenzo Gotor, N.; Dhar, R.; Cirillo, D.; Baldrighi, M.; Tartaglia, G.G.; Lehner, B. A Concentration-Dependent Liquid Phase Separation Can Cause Toxicity upon Increased Protein Expression. Cell Rep. 2016, 16, 222–231. [Google Scholar] [CrossRef] [Green Version]
  30. Uverskii, V.N. How many molten globules states exist? Biofizika 1998, 43, 416–421. [Google Scholar]
  31. Boswell, L.C.; Menze, M.A.; Hand, S.C. Group 3 late embryogenesis abundant proteins from embryos of Artemia franciscana: Structural properties and protective abilities during desiccation. Physiol. Biochem. Zool. 2014, 87, 640–651. [Google Scholar] [CrossRef] [PubMed] [Green Version]
  32. Greenfield, N.J. Using circular dichroism spectra to estimate protein secondary structure. Nat. Protoc. 2006, 1, 2876–2890. [Google Scholar] [CrossRef] [PubMed]
  33. Sharon, M.A.; Kozarova, A.; Clegg, J.S.; Vacratsis, P.O.; Warner, A.H. Characterization of a group 1 late embryogenesis abundant protein in encysted embryos of the brine shrimp Artemia franciscana. Biochem. Cell Biol. 2009, 87, 415–430. [Google Scholar] [CrossRef] [PubMed]
  34. Battaglia, M.; Olvera-Carrillo, Y.; Garciarrubio, A.; Campos, F.; Covarrubias, A.A. The Enigmatic LEA Proteins and Other Hydrophilins. Plant Physiol. 2008, 148, 6–24. [Google Scholar] [CrossRef] [Green Version]
  35. Forood, B.; Feliciano, E.J.; Nambiar, K.P. Stabilization of alpha-helical structures in short peptides via end capping. Proc. Natl. Acad. Sci. USA 1993, 90, 838–842. [Google Scholar] [CrossRef] [Green Version]
  36. Presta, L.G.; Rose, G.D. Helix signals in proteins. Science 1988, 240, 1632–1641. [Google Scholar] [CrossRef]
  37. Aurora, R.; Rose, G.D. Helix capping. Protein Sci. A Publ. Protein Soc. 1998, 7, 21–38. [Google Scholar] [CrossRef]
  38. Moore, D.S.; Hansen, R.; Hand, S.C. Liposomes with diverse compositions are protected during desiccation by LEA proteins from Artemia franciscana and trehalose. Biochim. Biophys. Acta Biomembr. 2016, 1858, 104–115. [Google Scholar] [CrossRef] [Green Version]
  39. Lu, H.; Wang, J.; Bai, Y.; Lang, J.W.; Liu, S.; Lin, Y.; Cheng, J. Ionic polypeptides with unusual helical stability. Nat. Commun. 2011, 2, 206. [Google Scholar] [CrossRef] [Green Version]
  40. Dalgicdir, C.; Globisch, C.; Peter, C.; Sayar, M. Tipping the Scale from Disorder to Alpha-helix: Folding of Amphiphilic Peptides in the Presence of Macroscopic and Molecular Interfaces. PLoS Comput. Biol. 2015, 11, e1004328. [Google Scholar] [CrossRef]
  41. Lotan, N.; Yaron, A.; Berger, A. The stabilization of the α-helix in aqueous solution by hydrophobic side-chain interaction. Biopolymers 1966, 4, 365–368. [Google Scholar] [CrossRef]
  42. Burley, S.K.; Petsko, G.A. Amino-aromatic interactions in proteins. FEBS Lett. 1986, 203, 139–143. [Google Scholar] [CrossRef] [Green Version]
  43. Brunette, T.J.; Parmeggiani, F.; Huang, P.-S.; Bhabha, G.; Ekiert, D.C.; Tsutakawa, S.E.; Hura, G.L.; Tainer, J.A.; Baker, D. Exploring the repeat protein universe through computational protein design. Nature 2015, 528, 580–584. [Google Scholar] [CrossRef] [PubMed] [Green Version]
  44. Coates, J.C. Armadillo repeat proteins: Beyond the animal kingdom. Trends Cell Biol. 2003, 13, 463–471. [Google Scholar] [CrossRef]
  45. Tewari, R.; Bailes, E.; Bunting, K.A.; Coates, J.C. Armadillo-repeat protein functions: Questions for little creatures. Trends Cell Biol. 2010, 20, 470–481. [Google Scholar] [CrossRef]
  46. Arakawa, T.; Timasheff, S.N. Mechanism of protein salting in and salting out by divalent cation salts: Balance between hydration and salt binding. Biochemistry 1984, 23, 5912–5923. [Google Scholar] [CrossRef]
  47. Zaslavsky, B.Y.; Uversky, V.N. In Aqua Veritas: The Indispensable yet Mostly Ignored Role of Water in Phase Separation and Membrane-less Organelles. Biochemistry 2018, 57, 2437–2451. [Google Scholar] [CrossRef]
  48. Dignon, G.L.; Best, R.B.; Mittal, J. Biomolecular Phase Separation: From Molecular Driving Forces to Macroscopic Properties. Annu. Rev. Phys. Chem. 2020, 71, 53–75. [Google Scholar] [CrossRef] [Green Version]
  49. Ginsawaeng, O.; Heise, C.; Sangwan, R.; Karcher, D.; Hernández-Sánchez, I.E.; Sampathkumar, A.; Zuther, E. Subcellular Localization of Seed-Expressed LEA_4 Proteins Reveals Liquid-Liquid Phase Separation for LEA9 and for LEA48 Homo- and LEA42-LEA48 Heterodimers. Biomolecules 2021, 11, 1770. [Google Scholar] [CrossRef]
  50. Yagi-Utsumi, M.; Aoki, K.; Watanabe, H.; Song, C.; Nishimura, S.; Satoh, T.; Yanaka, S.; Ganser, C.; Tanaka, S.; Schnapka, V.; et al. Desiccation-induced fibrous condensation of CAHS protein from an anhydrobiotic tardigrade. Sci. Rep. 2021, 11, 21328. [Google Scholar] [CrossRef]
  51. Greenspan, P.; Mayer, E.P.; Fowler, S.D. Nile red: A selective fluorescent stain for intracellular lipid droplets. J. Cell Biol. 1985, 100, 965–973. [Google Scholar] [CrossRef] [PubMed] [Green Version]
  52. Haidekker, M.A.; Theodorakis, E.A. Environment-sensitive behavior of fluorescent molecular rotors. J. Biol. Eng. 2010, 4, 11. [Google Scholar] [CrossRef] [PubMed] [Green Version]
  53. Levitt, J.A.; Chung, P.H.; Suhling, K. Spectrally resolved fluorescence lifetime imaging of Nile red for measurements of intracellular polarity. J. Biomed. Opt. 2015, 20, 096002. [Google Scholar] [CrossRef] [Green Version]
  54. Swain, J.; Mishra, A.K. Nile red fluorescence for quantitative monitoring of micropolarity and microviscosity of pluronic F127 in aqueous media. Photochem. Photobiol. Sci. 2016, 15, 1400–1407. [Google Scholar] [CrossRef] [PubMed]
  55. Yablon, D.G.; Schilowitz, A.M. Solvatochromism of Nile red in nonpolar solvents. Appl. Spectrosc. 2004, 58, 843–847. [Google Scholar] [CrossRef] [PubMed]
  56. Buitink, J.; Leprince, O. Intracellular glasses and seed survival in the dry state. Comptes Rendus Biol. 2008, 331, 788–795. [Google Scholar] [CrossRef]
  57. Leprince, O.; Hendry, G.A.F.; McKersie, B.D. The mechanisms of desiccation tolerance in developing seeds. Seed Sci. Res. 2008, 3, 231–246. [Google Scholar] [CrossRef]
Figure 1. Purification of AfLEA1. (A) SDS-PAGE of crude samples obtained after affinity chromatography (IMPACT) or further purification using anion-exchange chromatography as a polishing step. Fractions 1 and 2 obtained during anion-exchange chromatography contain AfLEA1 at the expected molecular weight of ~19 kDa. (B) AfLEA1 binds to quaternary ammonium groups at a pH of 8.0 and elutes in two distinct fractions (blue line) at relatively low concentrations of NaCl (black line).
Biomolecules 12 00425 g001
Figure 2. Size-exclusion chromatography of AfLEA1, both by anion-exchange chromatography, obtained fractions of the AfLEA1 (blue: peak fraction 1; magenta: peak fraction 2) elute from a size-exclusion column between ovalbumin (44 kDa) and carbonic anhydrase (29 kDa), respectively. Based on these data, the apparent molecular mass of AfLEA1 computes to 33.4 kDa, or approximately 75% larger than the calculated mass based on the polypeptide sequence of the protein. The black line shows the elution of molecular weight markers. The elution maxima correspond to: (1) conalbumin, 75 kDa; (2) ovalbumin, 44 kDa; (3) carbonic anhydrase, 29 kDa; (4) ribonuclease A, 13.7 kDa; and (5) aprotinin 6.5 kDa.
Biomolecules 12 00425 g002
Figure 3. Circular dichroism analysis of hydrated and desiccated AfLEA1, wherein α-helices (red), β-sheets (green), turns (blue), and random coils (magenta) are represented as proportions of the total protein structure. In the hydrated state, the secondary structure of AfLEA1 was on average 5% α-helices, 35% β-sheets, 18% turns, and 42% random coils. In the desiccated state, the secondary structure of AfLEA1 was on average 85% α-helices, 5% β-sheets, and 10% turns. In the presence of 2% SDS, the secondary structure of AfLEA1 was on average of 25% α-helices, 13% β-sheets, 16% turns, and 46% random coils (for CD spectra see Figure S2, Supplementary Materials).
Biomolecules 12 00425 g003
Figure 4. Amino acid sequence features of AfLEA1 where the amino acid properties are labeled by colors representing aromatic (green), polar (yellow), nonpolar (grey), positive (blue), and negative (red) amino acid side chains. (A) The amino acid sequence of AfLEA1 is highly repetitive and consists of eight Group 1 LEA domains. (B) Projected as an α-helix, AfLEA1 has a distinct hydrophobic face of nonpolar amino acids (gray) but does not have distinctly organized stripes of charged amino acid as described for some Group 3 LEA proteins.
Biomolecules 12 00425 g004
Figure 5. I-Tasser prediction of AfLEA1 structure in the desiccated state with amino acid properties labeled by color as polar (yellow), nonpolar (gray), aromatic (green), positive (red), and negative (blue). (A) AfLEA1 is predicted to fold into 84% α-helix, 5% β-sheet, and 11% turns. The tertiary structure of AfLEA1 is predicted to resemble a synthetic helical repeat protein (RCSB PDB ID: 5CWH) composed of helix-turn-helix structures, where each helix-turn-helix is a single Group 1 LEA motif. (B) The distribution of charged amino acids stabilizes the exterior of the AfLEA1. The protein’s interior is enriched with positive and aromatic residues.
Biomolecules 12 00425 g005
Figure 6. Three-dimensional structure and charge distribution of three LEA proteins from A. franciscana as predicted by I-Tasser. Colors represent the positive-charge residues in red and negative residues in blue. (A) Predicted α-helical regions of AfrLEA2 are shown to have characteristic positive-negative-positive residue stripes c.f. [38]. (B) Predicted α-helical regions of AfrLEA3m also showed characteristic positive-negative-positive residue stripes c.f. [38]. (C) AfLEA1 does not present the proposed charge pattern observed in AfrLEA2 and AfrLEA3m in its secondary structure. Still, its tertiary structure presents adjacent stripes of an alternating formal charge (positive-negative-positive-negative) on the protein surface.
Biomolecules 12 00425 g006
Figure 7. AfLEA1, dissolved in ultrapure water, crystallized readily when slowly desiccated at 80% RH. (A) Light microscopy shows that AfLEA1 dries into branching crystals. (B) Scanning electron microscopy (SEM) shows spherical structures (white arrow) are present in the desiccated sample in addition to the branching crystals (red arrow).
Biomolecules 12 00425 g007
Figure 8. The bioinformatics program catGranule predicts that AfLEA1 has a high propensity towards liquid–liquid phase separation in the presence of RNA. (A) A cumulative distribution fraction analysis of the amino acids of AfLEA1 produces a propensity score of 3.05, and a score > 1 is a predictor of LLPS behavior. (B) The residue-level propensity of AfLEA1 to undergo LLPS, where values above 0 indicate an increased likelihood of undergoing LLPS in the presence of RNA.
Biomolecules 12 00425 g008
Figure 9. AfLEA1 undergoes LLPS during desiccation in vitro in a solution mimicking the intracellular conditions in A. franciscana. (A) When desiccated in the absence of RNA, AfLEA1 undergoes LLPS (black arrow) at severe dehydration concurrent with the formation of salt crystals in the solution (white arrow). (B) When desiccated in the presence of mRNA from A. franciscana, AfLEA1 rapidly undergoes LLPS at higher water contents than in an RNA-free solution and before salt crystals are formed.
Biomolecules 12 00425 g009
Figure 10. AfLEA1 (0.4 mg/mL) addition protects endogenous LDH activity in Kc167 cell lysates after desiccation and rehydration, while addition of BSA (0.4 mg/mL) did not significantly increases recovered LDH activity after rehydration compared to the control (n = 9; ±SD, p < 0.05; * different from control).
Biomolecules 12 00425 g010
Figure 11. Residual activity of purified LDH was significantly increased when desiccated in the presence of BSA or AfLEA1 and then rehydrated with 100 mM sodium phosphate buffer at pH 6.5 (light gray box plots). LDH activity was not restored after desiccation in the absence of BSA or AfLEA1, and then rehydrated with 100 mM sodium phosphate buffer at pH 6.5 containing BSA or AfLEA1 (dark gray box plots). Control samples (white box plot) were desiccated and rehydrated in the absence of BSA or AfLEA1 (n = 9-18; ±SD, p < 0.05; different letters indicate significant differences between groups).
Biomolecules 12 00425 g011
Figure 12. A chimeric protein composed of AfLEA1 and mCherry localizes predominately to the cytoplasm in D. melanogaster Kc167 cells ectopically co-expressing AfLEA1-mCherry and GFP (Examples 1 and 2). In some cells, AfLEA1-mCherry was also observed to undergo an LLPS and exclude GFP from the biomolecular condensate (Example 1). AfLEA1-mCherry was observed to accumulate in the nucleus of other cells (Example 2). Cells were stained with 200 µL of MitoView Blue, and AfLEA1-mCherry does not localize to the mitochondria. Images are representative images, and fluorescence intensities are not relative between examples (for a quantitative assessment, see Figure S3, Supplementary Materials).
Biomolecules 12 00425 g012
Figure 13. AfLEA1, when ectopically expressed in Kc167 cells, increases the intracellular viscosity, improves cellular integrity, and reduces plasma membrane fusions during desiccation. Cells ectopically expressing untagged AfLEA1, or the vector control, were stained for 2 min in 200 µL DPBS containing 0.1 µg/mL Nile Red (9-diethylamino-5H-benzo[a]phenoxazin-5-one). Cells were desiccated through evaporative water loss at ambient relative humidity. Fluorescence intensities are relative among all images.
Biomolecules 12 00425 g013
Publisher’s Note: MDPI stays neutral with regard to jurisdictional claims in published maps and institutional affiliations.

