Article

ADP-Induced Conformational Transition of Human Adenylate Kinase 1 Is Triggered by Suppressing Internal Motion of α3α4 and α7α8 Fragments on the ps-ns Timescale

1
Key Laboratory of Chemical Biology of Fujian Province, College of Chemistry and Chemical Engineering, Xiamen University, Xiamen 361005, China
2
Department of Pathogenic Biology, School of Basic Medicine, Tongji Medical College, Huazhong University of Science and Technology, Wuhan 430030, China
*
Author to whom correspondence should be addressed.
These authors contributed equally to this work.
Biomolecules 2022, 12(5), 671; https://doi.org/10.3390/biom12050671
Submission received: 12 April 2022 / Revised: 1 May 2022 / Accepted: 3 May 2022 / Published: 6 May 2022
(This article belongs to the Section Bioinformatics and Systems Biology)

Abstract

:
Human adenylate kinase 1 (hAK1) plays a vital role in the energetic and metabolic regulation of cell life, and impaired functions of hAK1 are closely associated with many diseases. In the presence of Mg2+ ions, hAK1 in vivo can catalyze two ADP molecules into one ATP and one AMP molecule, activating the downstream AMP signaling. The ADP-binding also initiates AK1 transition from an open conformation to a closed conformation. However, how substrate binding triggers the conformational transition of hAK1 is still unclear, and the underlying molecular mechanisms remain elusive. Herein, we determined the solution structure of apo-hAK1 and its key residues for catalyzing ADP, and characterized backbone dynamics characteristics of apo-hAK1 and hAK1-Mg2+-ADP complex (holo-hAK1) using NMR relaxation experiments. We found that ADP was primarily bound to a cavity surrounded by the LID, NMP, and CORE domains of hAK1, and identified several critical residues for hAK1 catalyzing ADP including G16, G18, G20, G22, T39, G40, R44, V67, D93, G94, D140, and D141. Furthermore, we found that apo-hAK1 adopts an open conformation with significant ps-ns internal mobility, and Mg2+-ADP binding triggered conformational transition of hAK1 by suppressing the ps-ns internal motions of α3α4 in the NMP domain and α7α8 in the LID domain. Both α3α4 and α7α8 fragments became more rigid so as to fix the substrate, while the catalyzing center of hAK1 experiences promoted µs-ms conformational exchange, potentially facilitating catalysis reaction and conformational transition. Our results provide the structural basis of hAK1 catalyzing ADP into ATP and AMP, and disclose the driving force that triggers the conformational transition of hAK1, which will deepen understanding of the molecular mechanisms of hAK1 functions.

1. Introduction

Adenylate kinases (AKs) can read cellular adenine nucleotide balance and generate AMP molecules to trigger AMP signaling. Together with downstream AMP signaling (AK→AMP→AMP-sensors), AKs play fundamental roles in cell differentiation, cell polarity maintenance, and cell division [1,2,3,4]. As the crucial metabolic monitor of AMP signaling, the AKs family consists of nine major isoforms (AK1–AK9). AK1 is the major AMP generator and participates in many physiological processes [5,6]. The determined E. coli AK1 three-dimensional structure consists of LID, NMP, and CORE domains, and the LID and NMP domains are responsible for binding substrates, while the CORE domain governs the overall stability of the enzyme [7]. Furthermore, the CORE and NMP domains are conserved in different species whereas the LID domain is quite different. In the presence of Mg2+, AK1 can catalyze ATP and AMP into ADP. Due to ATP and AMP instabilities, analogs of ATP and AMP (AP4A, AP5A, AP6A) have been extensively used to exploit the interactions between AK1 and its substrates ATP and AMP [8]. The comparison of the crystal structures of E.coli AK1 in free form (PDB ID: 4AKE) and in complex with AP5A (PDB ID: 1AKE) displays that AK1 undergoes significant conformational change as both LID and NMP domains get close to the CORE domain when AK1 exerts its catalytic function [9,10]. Moreover, Pelz et al. demonstrate that AK1 binds ATP and AMP with an induced-fit mechanism in which substrate binding initiates AK1 transition from an open state to a closed state [11].
On the other hand, AK1 can reversibly catalyze ADP into ATP and AMP. Filippakopoulos et al. have determined the complex structure of hAK1 with the homologs of two ADP molecules, B4P (PDB ID: 2C95). The complex structure of hAK1-B4P indicates that hAK1 also adopts a closed conformation similar to the complex structure of hAK1-AP5A (PDB ID: 1Z83). The comparison of the apo-MtbAK1 structure (PDB: 1P4S) with the MtbAK1-Mg2+-ADP complex structure (PDB ID: 2CDN) illustrates that ADP binding also induces the conformational transition of AK1 from open to closed states [12,13]. Nevertheless, how substrate binding triggers the conformational transition of AK1 is still unclear. Herein, we determined the solution structure of hAK1 and identified key residues in hAK1 for catalyzing ADP by a combination of NMR chemical shift perturbation, enzyme activity assays, and point mutation experiments. Furthermore, we addressed the backbone dynamics characteristics of hAK1 when it exerted its catalytic function with NMR relaxation experiments. Our results are beneficial to exploring the AK1 catalytic cycle and providing a further mechanistic understanding of AK1 functions.

2. Materials and Methods

2.1. Preparation of Recombinant hAK1 and Its Mutants

Genes of hAK1 and its variants were separately cloned into the pGEX-6p-1 vector. Fusion proteins were expressed in E. coli BL21(DE3) at 22 °C and extracted by sonication, then purified by a GST affinity column. PreScission Protease was used to remove the GST tag at 4 °C. Finally, the target proteins were eluted into the NMR buffer (10 mM Na2HPO4, 100 mM Na2SO4, 50 mM NaCl, pH 6.2). Protein purities were analyzed by using 15 % (w/v) SDS-PAGE. Single-point mutations were conducted through PCR and verified by DNA sequencing from the Sangon Company.

2.2. Structure Calculation

Backbone and side-chain chemical shifts of apo-hAK1 have been assigned in our previous work (BMRB ID: 18133) [14]. 1H-1H NOE resonances in 3D 13C- and 15N-edited NOESY-HSQC spectra were manually and automatically assigned by using the Aria 2.3 software [15]. Resonance integrals of the NOESY-HSQC cross-peaks were used to generate 1H-1H distance restraints. Backbone dihedral restraints were predicted with the TALOS-N program based on assigned chemical shifts of hAK1 [16]. Annealing parameters were optimized for the final run (20,000, 1000, 120,000, and 96,000 for high temperature, refinement, cool1, and cool2 steps). Ultimately, 300 models of hAK1 were calculated and refined with Aria 2.3, from which 20 lowest-energy structures were chosen as the final conformational ensemble. The PROCHECK program was used to assess the structural quality of the hAK1 protein [17].

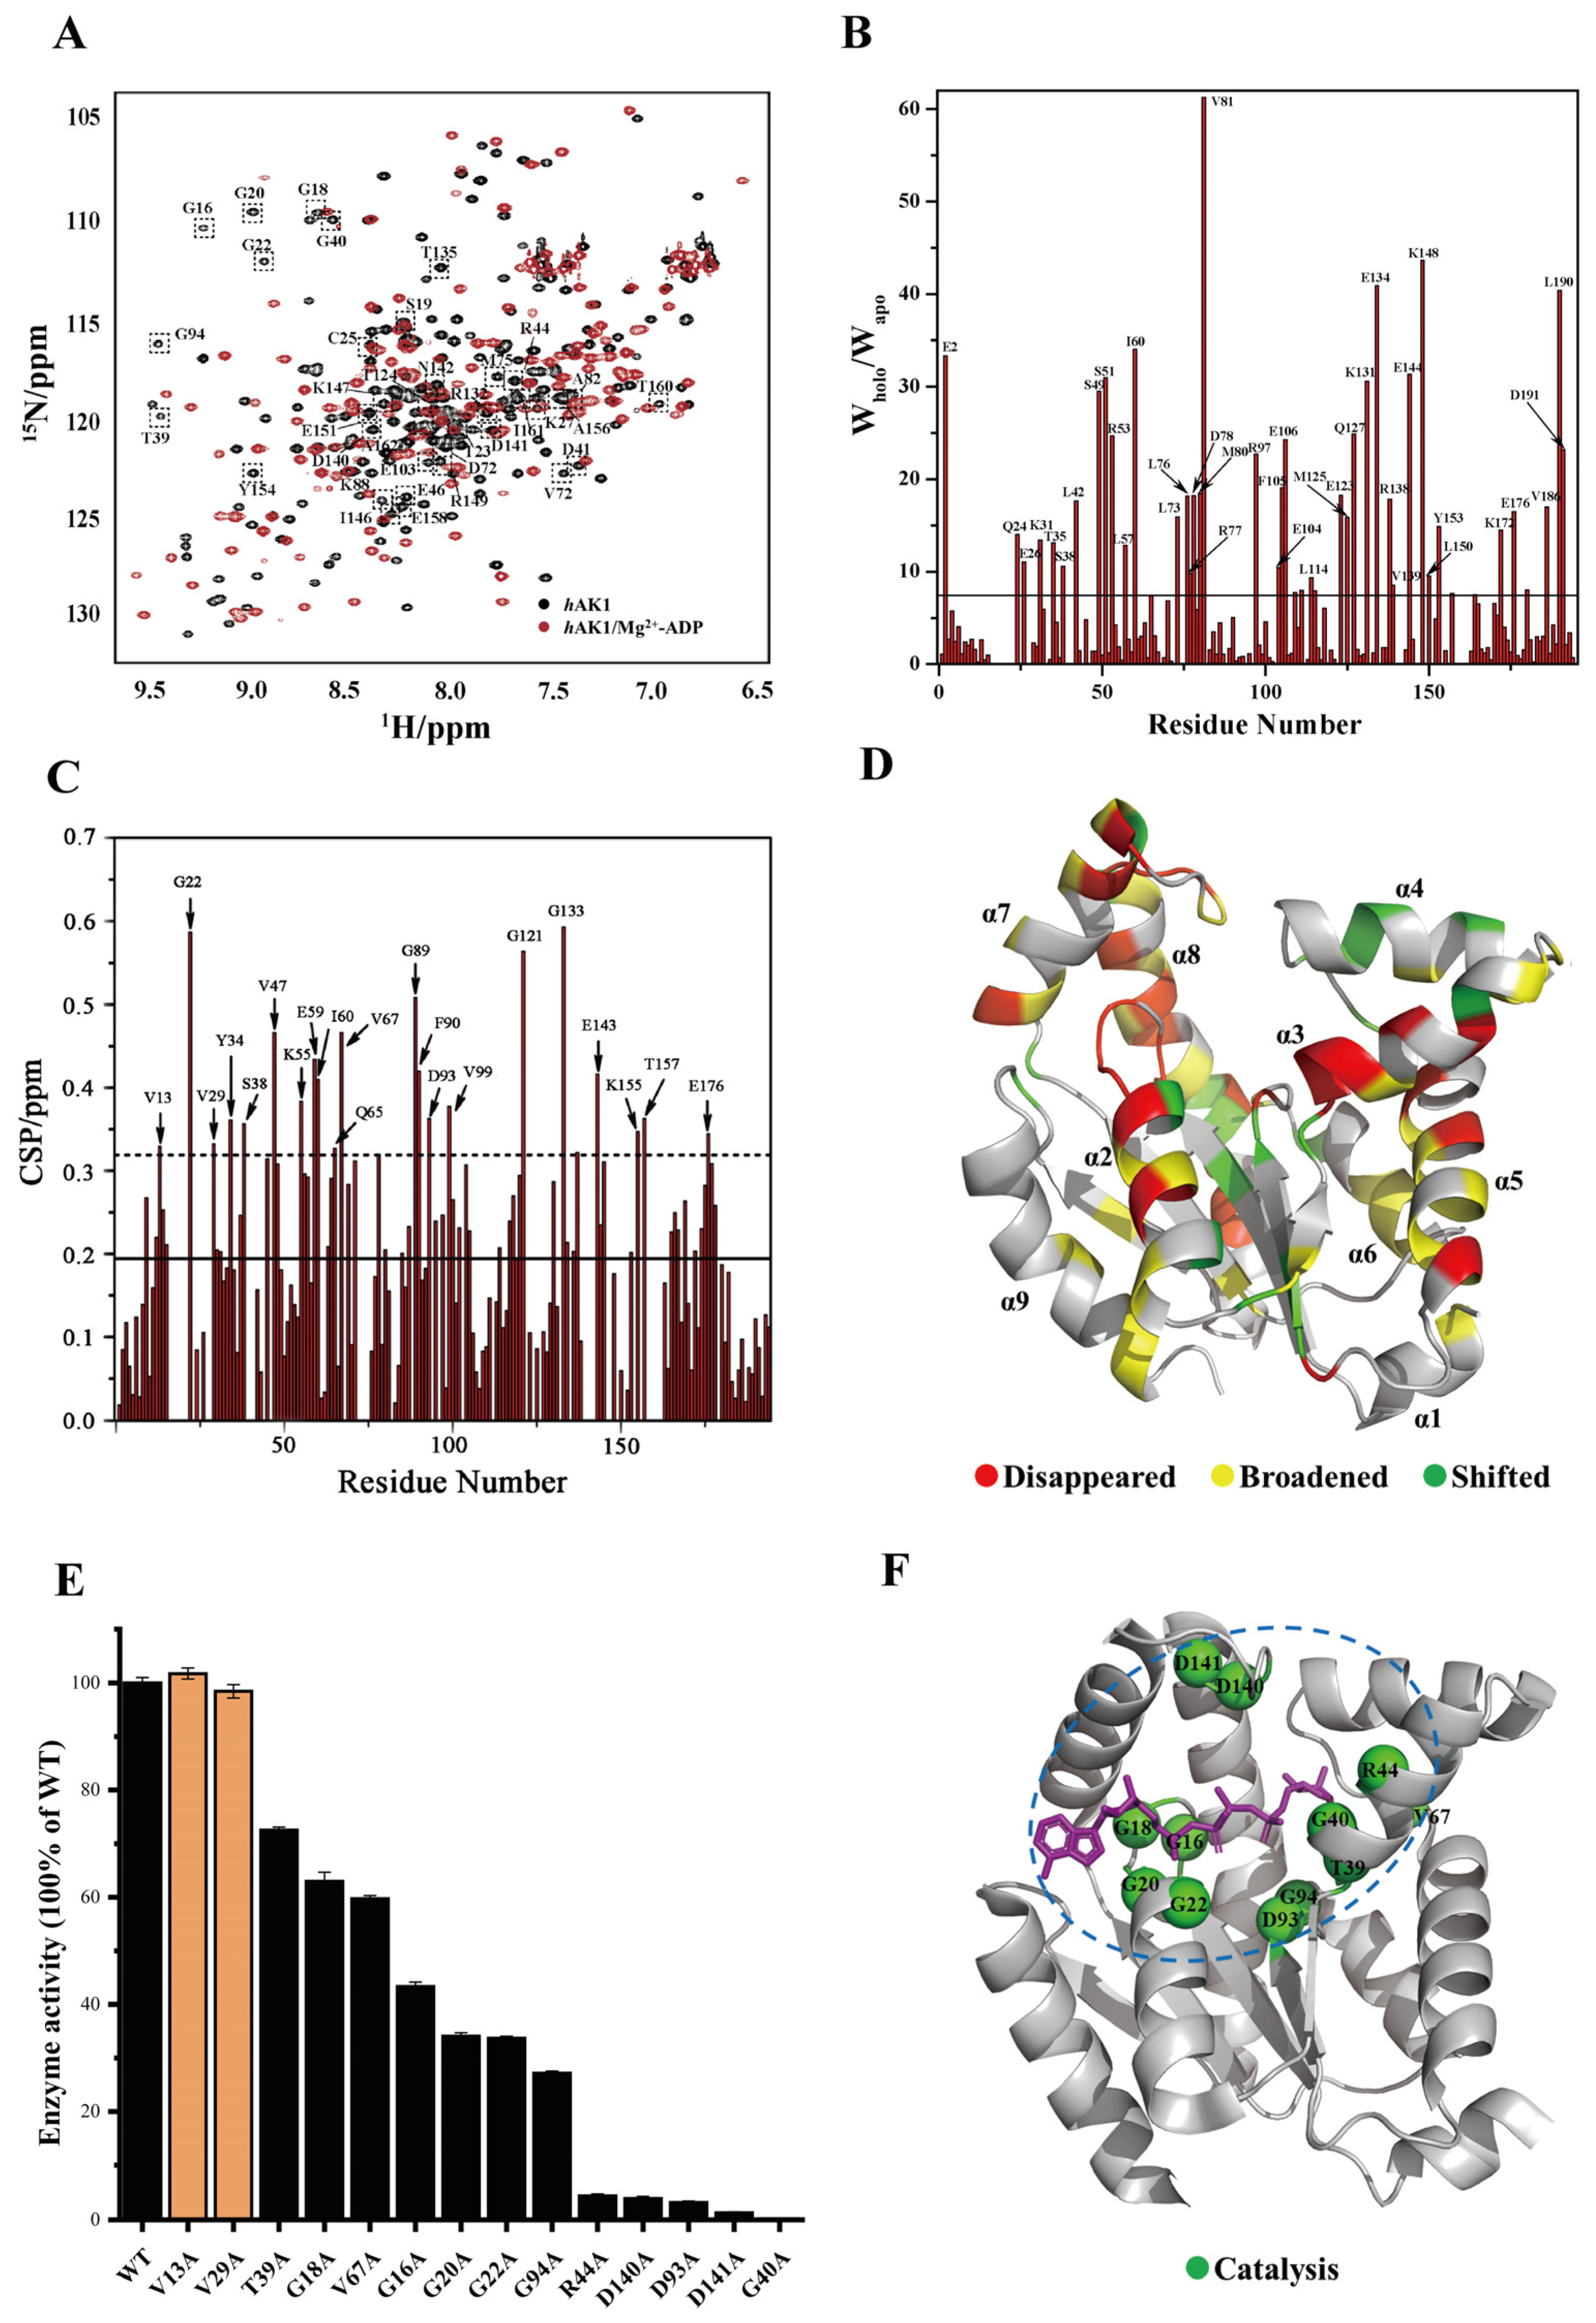
2.3. NMR Chemical Shift Perturbation Experiments

NMR titration experiments were conducted on Bruker Avance Ⅲ 600 MHz spectrometer (Bruker, Billerica, MA, USA) at 298K. The apo-hAK1 sample was solved in NMR buffer added with 5 mM EDTA. The holo-hAK1 sample was solved in NMR buffer added with 5 mM MgCl2, and ADP was titrated step-by-step according to the following molar ratios of protein: ligand: 1:0, 1:0.5, 1:1, 1:2, 1:3, 1:4, 1:5, 1:6, 1:7, 1:8. We calculated chemical shift perturbations (∆δ) of hAK1 at the molar ratio of 1:8, using the following formula:
Δ δ = Δ δ 2 ( H   1 ) + Δ δ 2 ( N   15 ) / 25 ,
where ∆δ(1H) is the perturbation in proton and ∆δ(15N) is the perturbation in nitrogen dimension.

2.4. Enzymatic Activity Assay

Enzymatic activities of hAK1 and its mutants were assessed in a coupling reaction with hexokinase-glucose-6-phosphate dehydrogenase, and the fluorescence intensity of final product NADPH at 456 nm was proportional to the enzymatic activity of hAK1 [18]. In detail, the enzymatic activities were measured in a reaction solution (50 mM Tris-HCl, 7.2 mM MgCl2, 2 mM Glucose, 1.64 mM NADP, 500 µg/L BSA, 3 mM ADP, 0.1 ug/mL hAK1, and 0.7 U/mL hexokinase-glucose-6-phosphate dehydrogenase) at 37 °C for 5 min. Then, a stop solution (10 mM NaOH, 5 mM EDTA) was added into the reaction solution to stop the reaction.

2.5. Backbone Relaxation Measurements

Relaxation experiments were conducted on Bruker Avance Ⅲ 600 MHz spectrometer at 298 K. Standard pulse sequences were used to obtain longitudinal and transverse relaxation rates R1 and R2, as well as {1H}-15N heteronuclear steady-state NOEs (hnNOEs). For 15N T1 measurements, the delay times were set to 0.01, 0.05, 0.1, 0.2, 0.4, 0.8, 1.2, 1.5, and 1.8 s in random order. For 15N T2 measurements, the delay times were set to 16.96, 33.92, 50.88, 67.84, 84.80, 101.76, 118.72, 135.68, 152.64, and 186.56 ms in random order. Two delay times were duplicated for both T1 and T2 experiments at the end of the experiments to estimate uncertainties of T1 and T2 values. For hnNOE experiments, a delay of 2 s was followed by 1H saturation of 3 s, and in the control experiments without 1H saturation, a total delay of 5 s was applied. The relaxation data were processed and analyzed with Bruker Dynamics Center 2.3 (Bruker, Billerica, MA, USA).

2.6. Model-Free Analysis

Model-free analysis of relaxation parameters R1, R2, and hnNOE was performed with the TENSOR2 and FAST-Modelfree programs following the Lipari-Szabo formalism [19,20,21,22]. Internal motions of backbone amide groups were fitted to five different model-free models described with a combination of S2, τe, and Rex. S2 is the squared order parameter, τe is the correlation time of the internal motion (ps-ns time scale), and Rex is the chemical exchange rate (μs-ms time scale) contributing to R2. An axially symmetric diffusion model was chosen for the model-free calculations. The F-test statistics were used to select the model satisfying the data with the lower number of parameters.

2.7. Reduced Spectral Density Mapping

Reduced spectral density mapping was conducted on the obtained relaxation data R1, R2, and hnNOE [23]. These data were converted into three J(ω) values J(0), JN), J(0.87ωH) using the script reported by Leo Spyracopoulos [24].

3. Results

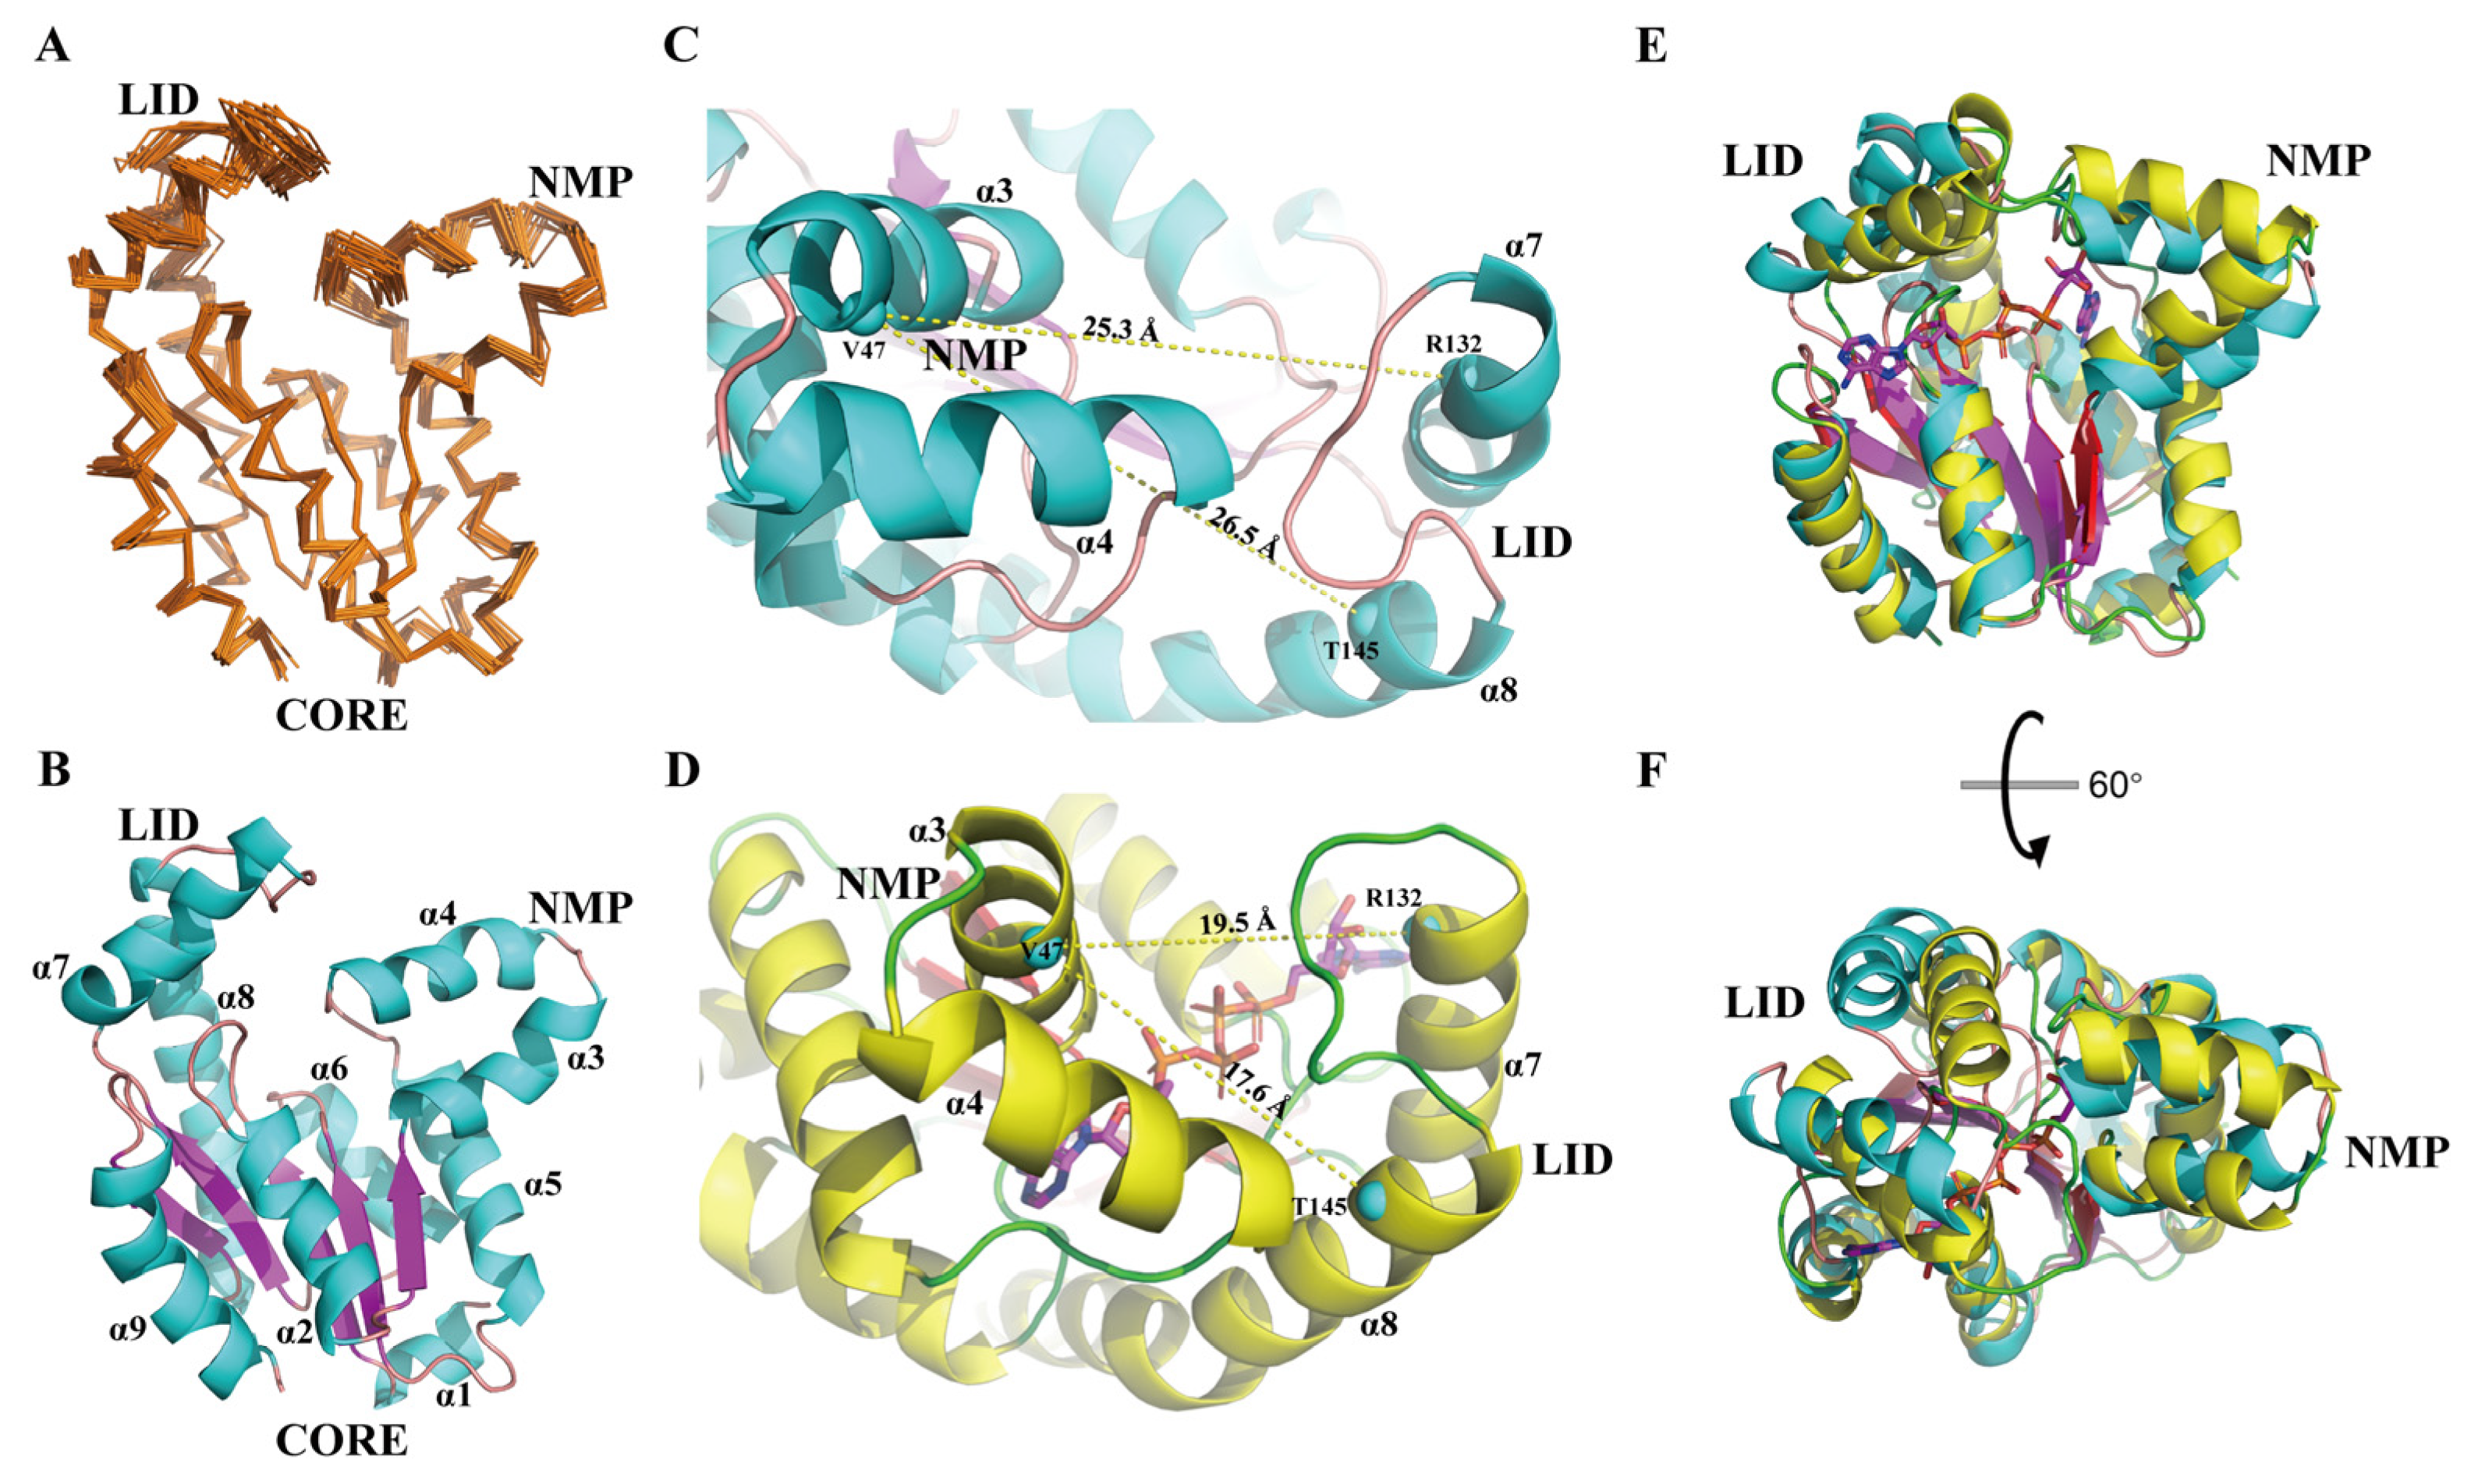
3.1. NMR Solution Structure of hAK1

To disclose molecular mechanisms underlying hAK1 catalyzing ADP, we determined the solution structure of hAK1 using heteronuclear multi-dimensional NMR spectroscopy. The final structure ensemble consists of 20 lowest-energy models (Figure 1A), and the NMR restraints and structure statistics are shown in Table 1. Structural quality analysis by the PROCHECK program illustrated that most of the modeled residues were in preferred and allowed regions (Table 1). The root-mean-square deviation (RMSD) for the 20 structural models to the mean structure reached 0.57 Å and 0.84 Å for backbone atoms and heavy atoms, respectively, indicating a well-defined structure ensemble. The solution structure of hAK1 has been deposited in the Protein Data Bank with an accession code of 7X7S.
Overall, hAK1 adopted a globular fold comprising 9 α-helices (α1: 2–7, α2: 21–32, α3: 39–49, α4: 52–63, α5: 69–83, α6: 99–109, α7: 122–135, α8: 143–167, α9: 179–193) and a five-stranded β-sheet (β1: 9–14, β2: 35–38, β3: 89–83, β4: 114–119, β5: 170–174) (Figure 1B). Three domains, namely NMP, LID, and CORE were identified in the hAK1 protein: NMP contained α3 and α4; LID consisted of α7 and α8; CORE was represented by the β-sheet surrounded by other helices. Notably, NMP and LID domains exhibited larger RMSDs than the global average due to relatively fewer NOE restraints (Figure 1A), indicative of their structural flexibilities in solution.
To investigate structural alterations of hAK1 upon binding to its substrates, we compared the three-dimensional structures of apo-hAK1 (PDB ID: 7X7S) and hAK1-B4P complex (PDB ID: 2C95). Expectedly, NMP and LID domains exhibited noticeable conformational changes. The NMP and LID domains adopted an open conformation in apo-form, characterized by a relatively large distance between α3 and α7 or α8 of 25.3 Å or 26.5 Å, respectively (Figure 1C). Upon B4P binding to hAK1, both NMP and LID domains moved inward, resulting in reduced corresponding distances of 19.5 Å or 17.6 Å, respectively (Figure 1D). Furthermore, the local structural alignment of apo-hAK1 with B4P-complexed hAK1 gave an RMSD of 1.73 Å for the CORE domain, 5.17 Å for the region consisting of NMP and LID domains (Figure 1E–F). Consequently, B4P binding to hAK1 led to a “closed” conformation for the NMP and LID domains.

3.2. Key Residues for hAK1 Catalyzing ADP

As reported previously, hAK1 can efficiently catalyze mutual transformation among ADP, ATP, and AMP only in the presence of some divalent ions such as Mg2+ [25]. To identify key residues for hAK1 catalyzing ADP, we performed NMR titration experiments on 15N-labeled hAK1 with increasing ADP concentration in the presence of Mg2+. It was previously reported that hAK1 is associated with five statuses during its catalytic cycle: open, partially open, intermediate, partially closed, and closed [26]. Expectedly, ADP titration resulted in greater conformational exchange for hAK1. About 50% of peaks in the 2D 1H-15N HSQC spectra of hAK1/Mg2+-ADP were appreciably perturbed, including 36 vanished peaks, 40 broadened peaks and 21 shifted peaks (Figure 2A–C). These perturbed residues were identified and mapped into the three domains of apo-hAK1 based on the backbone assignments we previously completed [14], suggesting that Mg2+-ADP caused a significant change to the whole structure of apo-hAK1 (Figure 2D). In order to identify key residues for hAK1 catalyzing ADP, we mutated 14 significantly perturbed residues, which were situated on the hAK1-B4P interface identified from the 3D structure of hAK1 complexed with B4P (PDB ID: 2C95), including G16, G18, G20, G22, T39, G40, R44, Q65, V67, D93, G94, R132, D140, and D141. Besides, we also mutated significantly perturbed residues V13 and V29, which were located far away from the binding interface.
The enzymatic activities of 12 hAK1 mutants have decreased. As shown in Figure 2E, five mutations (G40A, R44A, D93A, D140A, and D141A) remarkably decreased enzymatic activities of hAK1 by more than 90%. Moreover, four mutations (G16A, G20A, G22A, and G94A) significantly decreased enzymatic activities of hAK1 by more than 50%. Furthermore, three mutations (G18A, T39A, and V67A) reduced enzymatic activities of hAK1 by 20%–40%. Thus, we identified 12 key residues for hAK1 catalyzing ADP, including G16, G18, G20, G22, T39, G40, R44, V67, D93, G94, D140, and D141, which are highlighted in the 3D structure of the hAK1-B4P complex (Figure 2F). Notably, V13A and V29A mutations did not significantly decrease the enzymatic activity of hAK1, implying that their chemical shift perturbation was primarily caused by the overall conformational change of hAK1 upon addition of ADP.

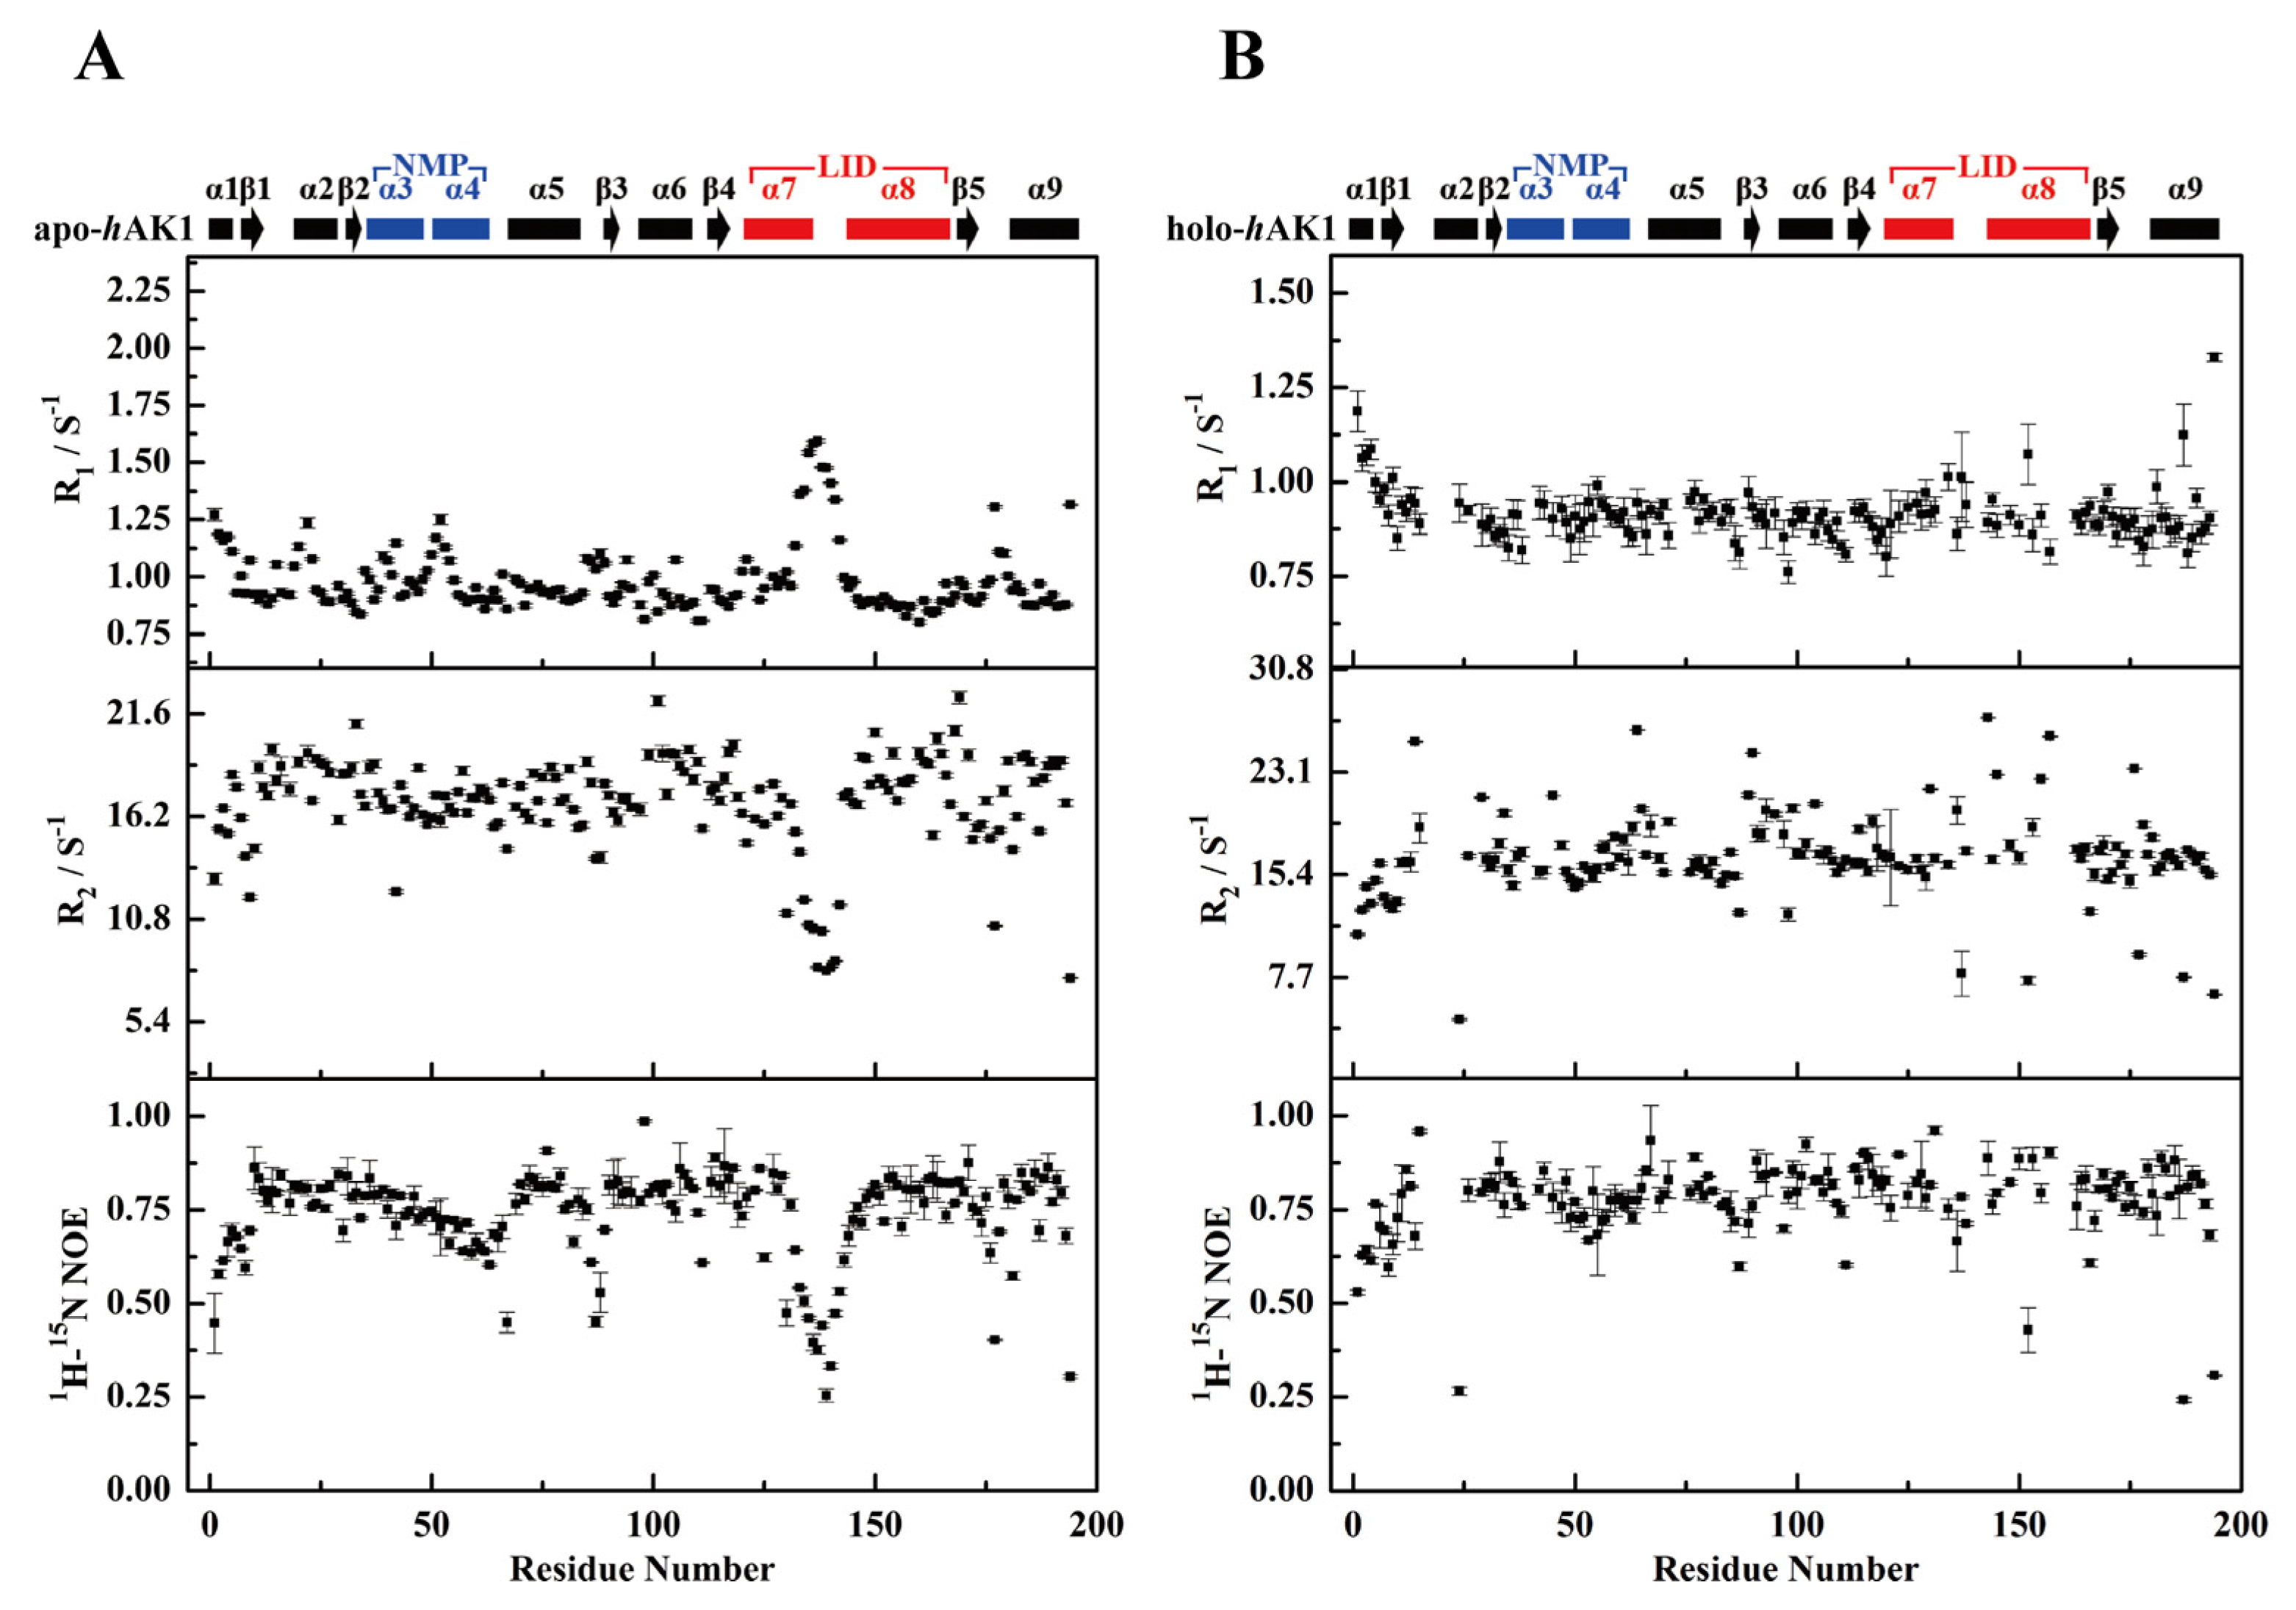
3.3. Comparison of Relaxation Data between apo-hAK1 and holo-hAK1

As it is known, dramatic conformational changes occurred during the hAK1 catalytic cycle. Although structural studies have provided ample evidence for conformational changes of hAK1, few systematic experimental studies were reported to explore dynamic properties of the hAK1 enzyme through its catalytic cycles [27,28]. To disclose the driving force in the conformational transition of hAK1, we determined backbone dynamics parameters of apo-hAK1 and holo-hAK1 (hAK1-Mg2+-ADP), including 15N longitudinal relaxation rates (R1), 15N transverse relaxation rates (R2) and {1H}-15N heteronuclear steady-state NOEs (hnNOE).
The mean R1 and R2 values of apo-hAK1 were 0.983 ± 0.007 s−1 and 16.941 ± 0.178 s−1, respectively (Figure 3A). After Mg2+-ADP addition, the mean R1 and R2 values became 0.917 ± 0.041 s−1 and 16.709 ± 0.329 s−1, respectively. Overall, Mg2+-ADP binding did not result in significant changes in mean relaxation rates for hAK1 (Figure 3A–B). However, holo-hAK1 displayed greater local fluctuations of the backbone relaxation parameters compared to apo-hAK1, especially in the α3α4 fragment (residues 39–72) of the NMP domain and the α7α8 fragment (residues 120–152) of the LID domain. Both α3α4 and α7α8 fragments of apo-hAK1 exhibited higher R1 values and lower R2 values than the average values, implying that these regions might undergo significant internal motions on the ps-ns time scale with observable structural flexibility. Differently, holo-hAK1 showed relatively stable R1 and R2 values across the amino acid sequence with insignificant ps-ns internal motions in α3α4 and α7α8 fragments. Besides, α7α8 of holo-hAK1 displayed profoundly increased {1H}-15N NOE values, suggesting that the LID domain became more rigid upon Mg2+-ADP binding. Therefore, we speculate that Mg2+-ADP binding remarkably changed the dynamics properties of hAK1 by suppressing the ps-ns internal motions of α3α4 and α7α8.

3.4. Model-Free Analysis

The relaxation data of R1, R2, and {1H}-15N NOE were further processed by using model-free analysis. We firstly obtained rotational diffusion tensors describing the overall tumbling of apo-hAK1 and holo-hAK1. The best-fit χ2 value of the axially symmetric diffusion model was 291.2 for apo-hAK1 and 317.3 for holo-hAK1, indicative of well-fitted models. The estimated rotational correlation time (τm) was 13.929 × 10⁻⁹ s for apo-hAK1 and 13.406 × 10⁻⁹ s for holo-hAK1. The diffusion tensor ratio D///D was 1.190 for apo-hAK1 and 1.149 for holo-hAK1, indicating that internal motions of both apo-hAK1 and holo-hAK1 could be described by using slightly prolate diffusion models.
The model-free analysis of relaxation data provided an internal correlation time (τe), and an order parameter (S2) as well as a conformational exchange rate (Rex) for describing backbone dynamics characteristic of each residue for the protein. Results derived from the model-free analysis of apo-hAK1 showed that residues with smaller S2 and larger τe values were primarily distributed in the α3α4 and α7α8 fragments, indicating that these two fragments had apparent fast internal mobility on the ps-ns timescale (Figure 4A). However, once Mg2+-ADP binding, these prominent ps-ns internal motions were attenuated, even quenched in the α3α4 and α7α8 as shown by increased S2 and decreased τe values (Figure 4B). On the other hand, backbone amide groups of apo-hAK1 did not show significant slow internal motions on the µs-ms timescale, as indicated by only one residue exhibiting an observable Rex value (Figure 4C). The Mg2+-ADP binding brought significant µs-ms internal motion in holo-hAK1, as reflected by 24 residues with large Rex values, which surrounded the catalyzing center including V14, G15, V29, S45, G64, Q65, T71, G89, F90, L91, D93, Y95, V99, E104, Q111, L114, Y117, L130, E143, T145, K155, T157, K172, and E176 (Figure 4D). Notably, the LID domain exhibited promoted conformational exchange and structural flexibility, which was potentially favorable for hAK1 exerting its catalytic functions.
As it is known, AK1 binds substrates in the open conformation, catalyzes the phosphor-transfer reaction in the closed conformation, and releases products again in the open conformation. The holo-hAK1 adopts a closed conformation upon Mg2+-ADP binding, which is helpful for avoiding hydrolysis of the product ATP. Note that some residues showed relatively larger S2 values, including E26, Y34, G89, and I92 located in the CORE domain, and A120, L130, E134, S136, G137, and R138 in α7α8 of the NMP domain, as well as K63, G64, and V67 in α3α4 of the LID domain. These regions displayed relatively rigid dynamics properties, which were potentially responsible for restricting the conformational exchange required for hAK1 binding more efficiently Mg2+-ADP (Figure 5).

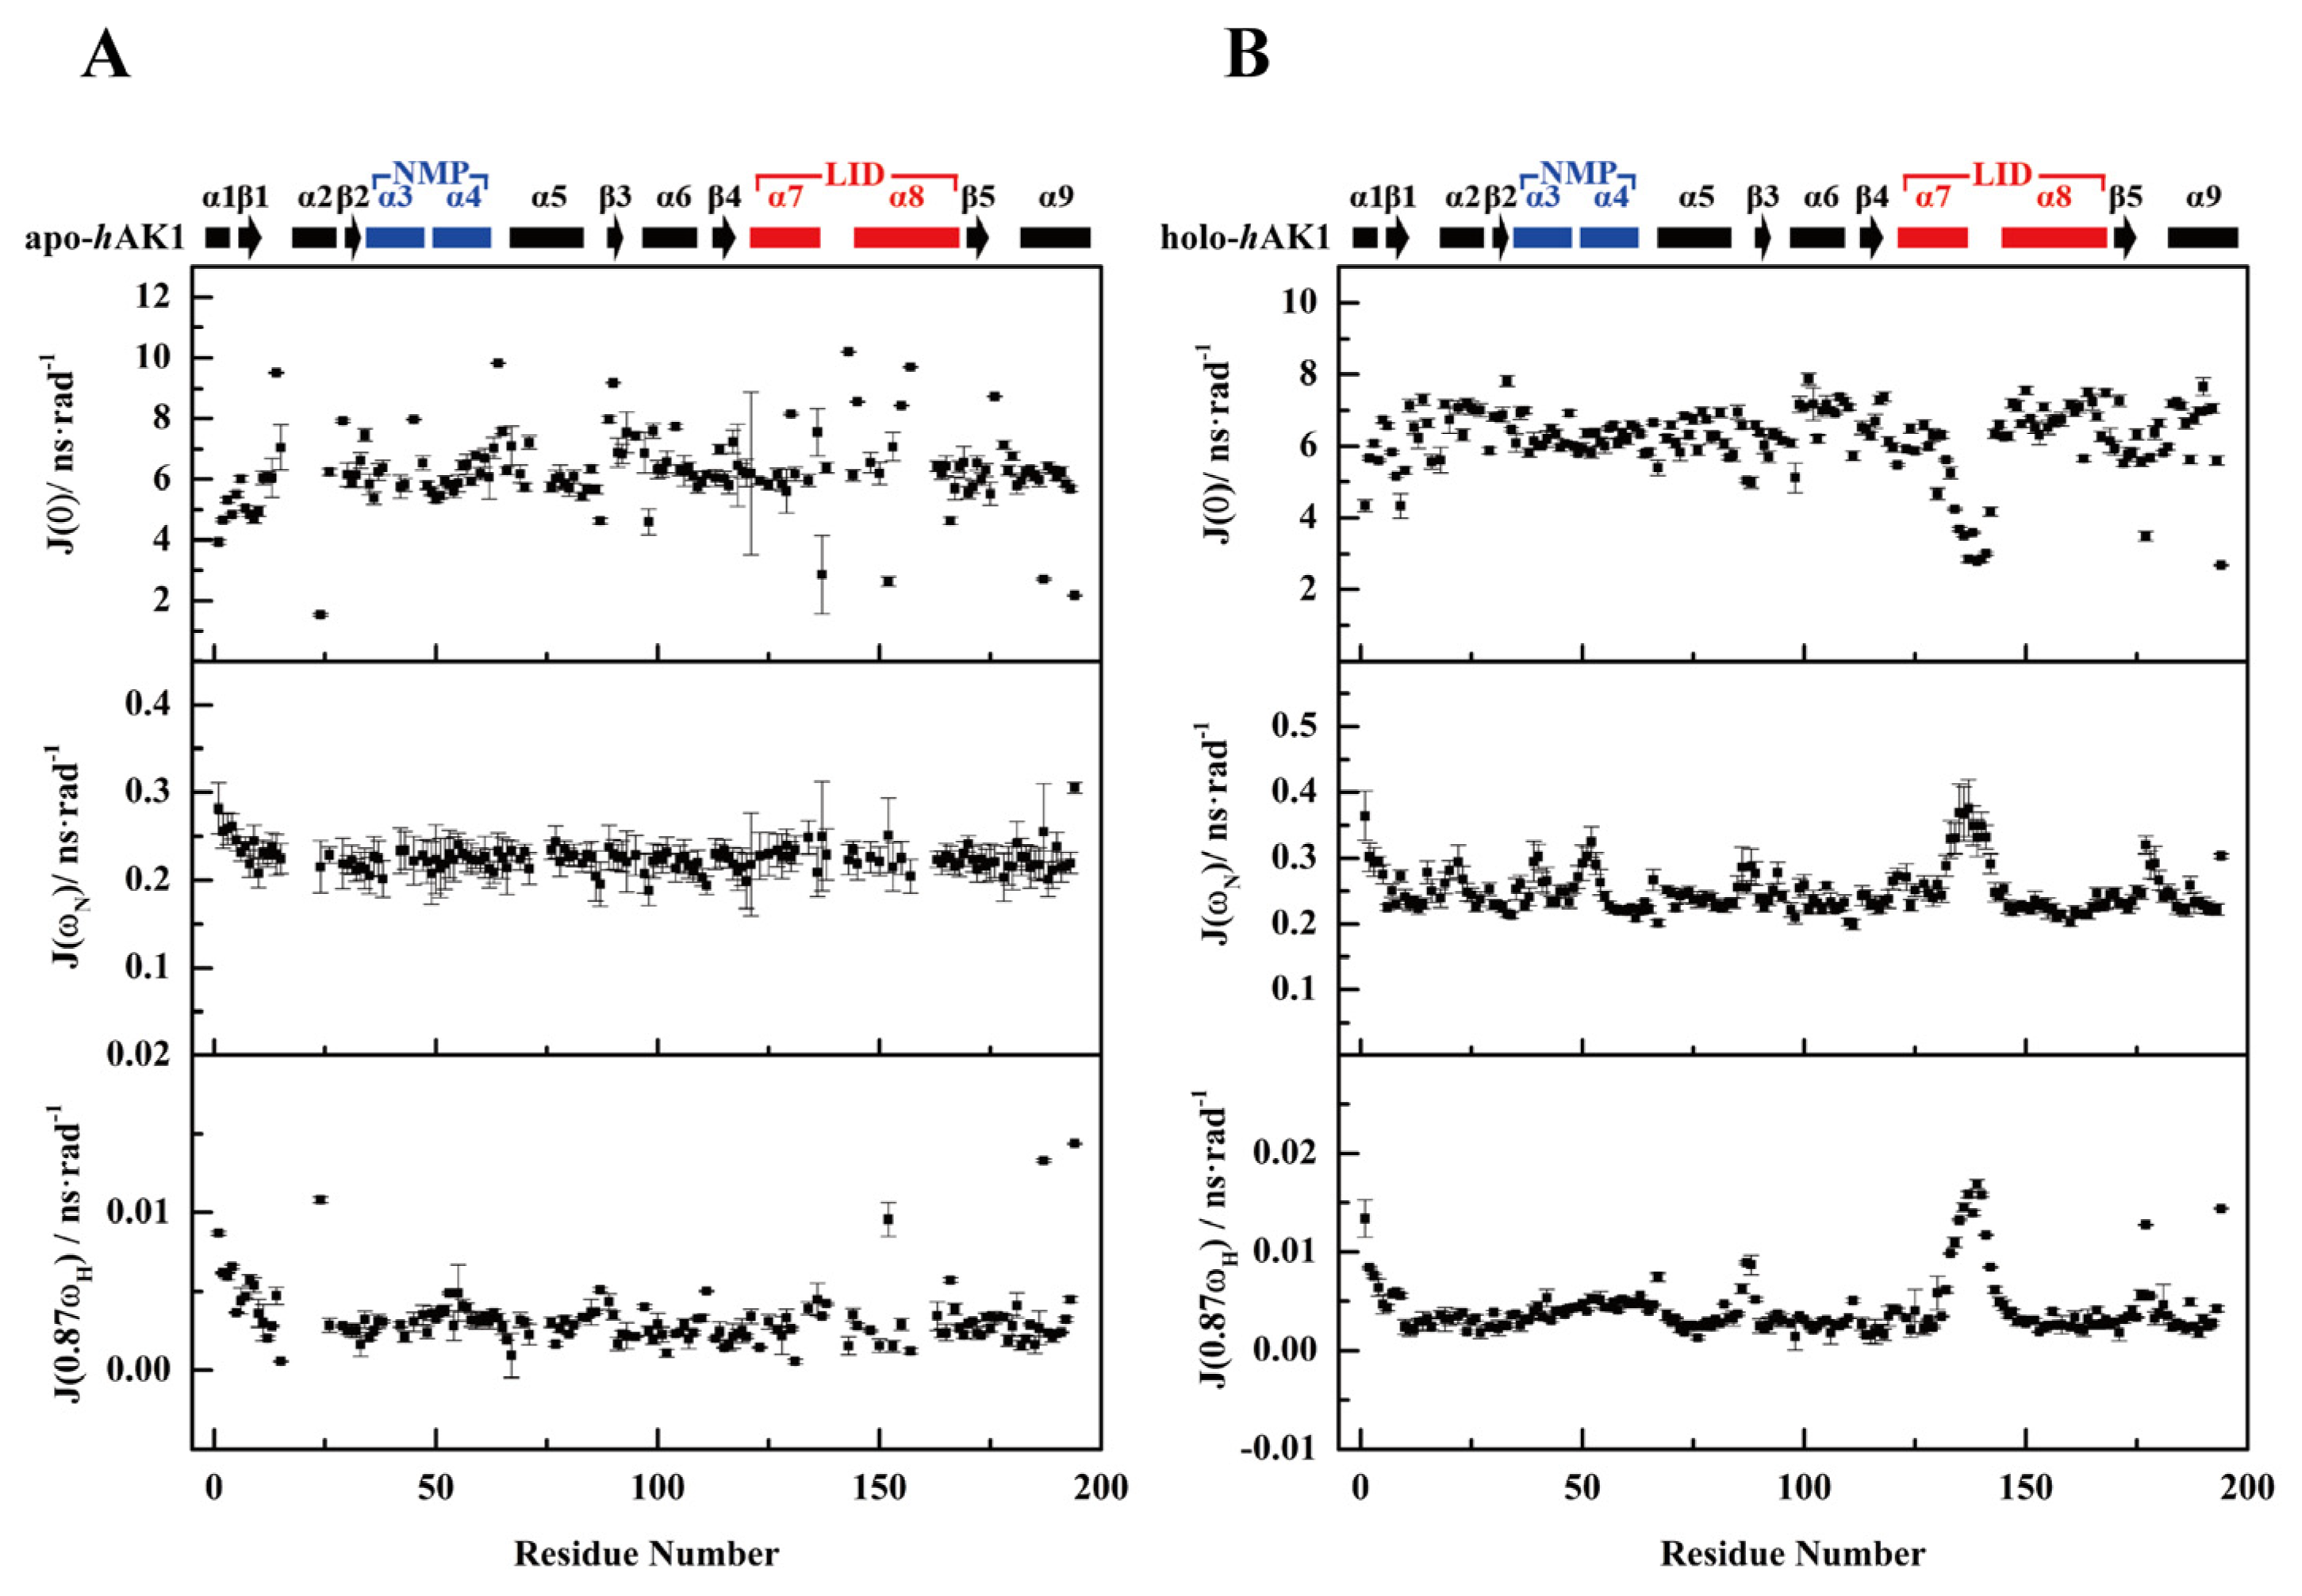
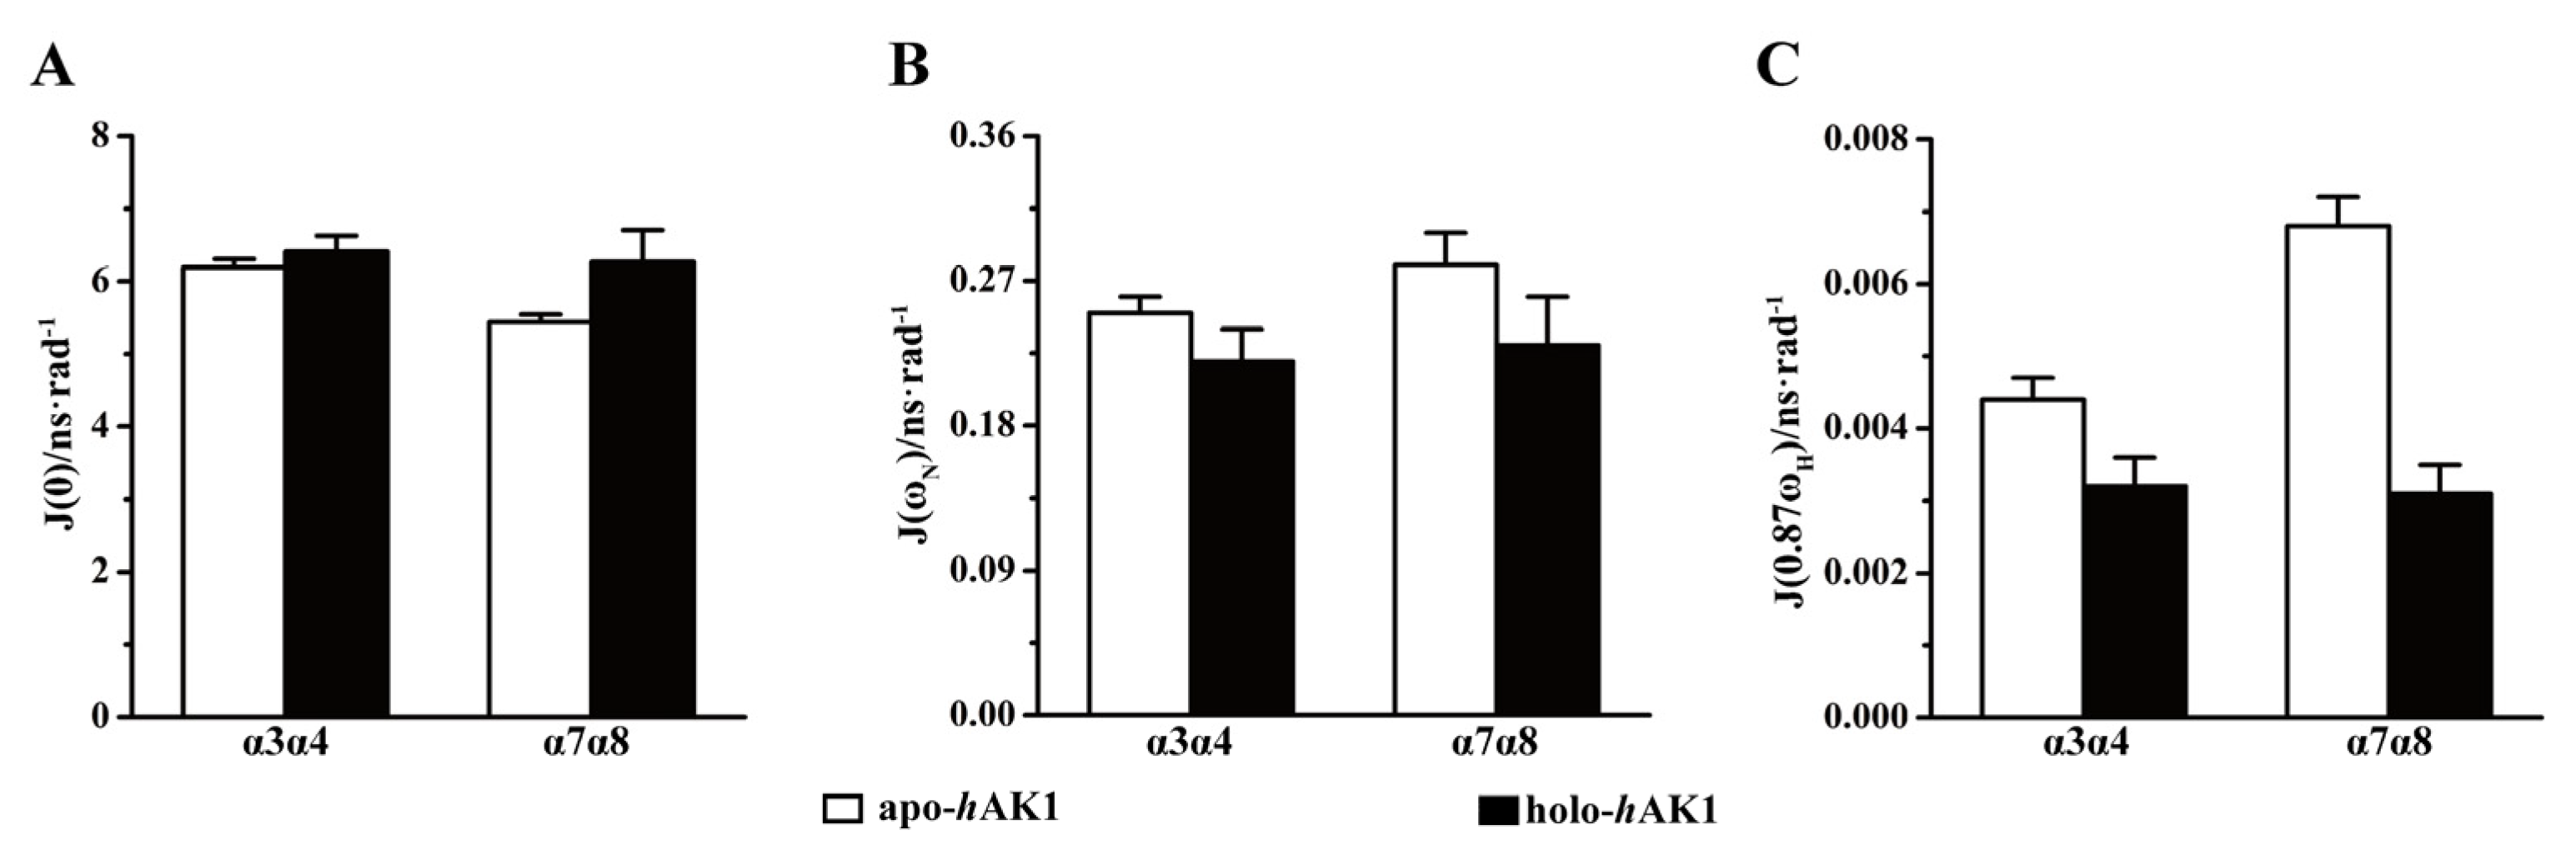
3.5. Reduced Spectral Density Mapping

Reduced spectral density functions at three frequencies J(0), JN) and J(0.87ωH) were calculated for each residue based on the obtained 15N relaxation parameters of apo-hAK1 and holo-hAK1. As expected, both α3α4 and α7α8 fragments displayed different spectral density functions, similar to the above-described relaxation parameters (Figure 6).
Significantly, Mg2+-ADP binding to hAK1 increased average J(0) values in the α3α4 and α7α8 fragments (Figure 7A), suggesting that both fragments had enhanced internal mobility on the µs-ms timescale. Furthermore, Mg2+-ADP binding also remarkably decreased average JN) and J(0.87ωH) values for α3α4 and α7α8, indicative of suppressed structural flexibility on the ps-ns timescale (Figure 7B,C). It seemed that despite the overall 3D structure of holo-hAK1 being more rigid than apo-hAK1, Mg2+-ADP binding profoundly promoted the µs-ms conformational exchange which potentially facilitated catalysis reaction and conformational transition. These results were basically consistent with those from the model-free analysis (Figure 4).

4. Discussion

We have determined the solution structure of apo-hAK1, and identified 12 key residues for hAK1 catalyzing ADP, including G16, G18, G20, G22, T39, G40, R44, V67, D93, G94, D140, and D141. Both model-free analysis and spectral density analysis showed that apo-hAK1 adopts an open conformation with significant ps-ns internal mobility, thereby allowing local structural rearrangements to accommodate hAK1 binding Mg2+ and ADP. The Mg2+-ADP binding substantially triggers the conformational transition of hAK1 by suppressing the fast internal motions of α3α4 in the NMP domain and α7α8 in the LID domain, and simultaneously promoting the slow internal motions of the protein. Upon hAK1 binding Mg2+ and ADP, both α3α4 and α7α8 become more rigid so as to fix the substrate, while the catalyzing center of hAK1 experiences promoted µs-ms conformational exchange, potentially facilitating catalysis reaction and conformational transition.
While our study suggests several potential determinants of hAK1’s catalyzing functionality from a view of structural biology and biophysics, certain considerations arising from our interpretation of the results need in-depth discussion. For example, because of the inherent conformation averaging effect of the in-solution NMR sampling, the rare conformations existing at the saddle points on the free energy landscape might be omitted during structure calculation and, thus, are not necessarily present in the final NMR ensemble. Expectedly, MD simulations would be helpful to remedy the lack of atom-level portrayal of important conformations, which are calculated based on NMR-derived constraints. MD simulations can catch vital biomolecular processes by revealing atomic coordinates at fs-level resolution, and predict how protein dynamics respond to both perturbations imposed on residues and introduction of ligands [29]. Recent advances in accelerated MD might particularly enhance the sampling of biomolecular binding events on an enlarged simulation timescale than the conventional ns-μs all-atom simulation [30]. The advanced MD simulation methodology will allow for the thorough characterization of lid motion and substrate binding thermodynamics and kinetics of hAK1.
Another critical question lies before this study about how the internal motion of α3α4 and α7α8 fragments on the ps-ns timescale induces the biochemically significant steps that occur on the µs-ms timescale. Previous studies reported that the adenylate kinase from Aquifex aeolicus (Aquifex Adk) exhibits a free-energy landscape with multiple kinetic states along the reaction pathway during the catalysis process [31], and the ligand-free Aquifex Adk adopts different conformations with variable degrees of the closure of lids [32]. Some of the flexible “hotspot” residues with backbone conformational alteration allowing for motif-wise lid motion, have been identified as the “hinges”, thereby raising an assumption that the amplitude of the fast internal motion of the hinges on the ps-ns timescale is mechanistically responsible for the biocatalytically significant lid motions on the μs-ms timescale [33]. Furthermore, molecular dynamics (MD) simulation of a sextuple mutant of Aquifex Adk supports this assumption by characterizing the motion trajectories at an atomic resolution [33]. In this mutant, the non-conservative backbone-rigidifying prolines and π-π-stacking-inducing phenylalanines were replaced with the corresponding residues of an Adk homolog with lower NMR-derived S2 values for hinge residues. In other words, the closure of lids might result from “individual attempts by local groups to overcome the energy barrier for the conformational transition” [33]. Due to the domain-wise structural and functional similarities between Aquifex Adk and hAK1, we, therefore, conjecture that the above analyses for Aquifex Adk is applicable to a high extent for hAK1.
Herein, we found that 12 key residues located at the binding interface of hAK1 with ADP are important to hAK1 catalytic activity based on their chemical shift perturbation after ADP addition and their enzymatic change after mutation. However, the nature of the mutation-induced catalytic activity loss in detail remains to be explored. A mechanism mediated by the mis-oriented Mg-ADP interaction is conceivable, but, in the meantime, binding incapability as a result of the misfold of hAK1 is also a possibility. Expectedly, a combination of our biophysical analysis with the high-precision MD simulations might better illustrate the motional patterns of the mutants, thus facilitating the molecular mechanism underlying the catalytically relevant residues. What is more, we also found that five residues (L43, M61, L66, R128 and V182), which were located at the binding interface of hAK1, did not show significant chemical shift perturbations in the NMR titration experiments, suggesting that they were not greatly involved in Mg-ADP binding to hAK1. We, thus, speculate these residues were not closely related to the catalytic function of hAK1. However, mutation experiments and catalytic activity measurements are needed to perform in the future to examine whether these residues are catalytic important for hAK1.
This study mainly focused on biophysically clarifying the structural basis of hAK1 catalyzing ADP into ATP and AMP, and, with the critical discussions above, it is necessary to address the atom-level revelation of the molecular mechanism describing the dynamics of hAK1 binding the substrate. To this end, molecular docking of hAK1 and its substrates as well as relevant molecular dynamics simulation have been included in our future plan and are actually under our investigation, which will facilitate further understanding of the molecular mechanism of hAK1 functions.
In summary, our study is beneficial to further understanding the role of conformational fluctuations involved in the enzymatic activities of hAK1, and provides insights into contributions of internal motions on different timescales to conformational changes induced by Mg2+-ADP binding.

Author Contributions

Conceptualization, C.G., H.Z., W.L. and D.L.; methodology, C.G., H.Z., W.L., H.C., T.C., Z.W., J.Y. and D.L.; validation, C.G., H.Z. and D.L.; formal analysis, C.G., H.Z., W.L., H.C., J.Y. and D.L.; investigation, C.G., H.Z. and D.L.; resources, C.G. and D.L.; data curation, C.G., and H.Z.; writing—original draft preparation, C.G. and H.Z.; writing—review and editing, C.G., H.Z. and D.L.; visualization, H.Z., W.L. and H.C.; supervision, C.G. and D.L.; project administration, D.L.; funding acquisition, C.G. and D.L. All authors have read and agreed to the published version of the manuscript.

Funding

This research was funded by the Natural Science Foundation of Fujian Province (No. 2020J01022).

Data Availability Statement

The solution structure of hAK1 has been deposited in the Protein Data Bank with an accession code of 7X7S (https://www.rcsb.org/structure/unreleased/7X7S accessed on 10 June 2022).

Acknowledgments

The authors are grateful to Liubin Feng of the College of Chemistry and Chemical Engineering, Xiamen University for help with NMR experiments.

Conflicts of Interest

The authors declare no conflict of interest.

References

  1. Downs, S.M.; Hudson, E.R.; Hardie, D.G. A Potential Role for AMP-Activated Protein Kinase in Meiotic Induction in Mouse Oocytes. Dev. Biol. 2002, 245, 200–212. [Google Scholar] [CrossRef] [PubMed] [Green Version]
  2. Lee, J.H.; Koh, H.; Kim, M.; Kim, Y.; Lee, S.Y.; Karess, R.E.; Lee, S.-H.; Shong, M.; Kim, J.-M.; Kim, J.; et al. Energy-Dependent Regulation of Cell Structure by AMP-Activated Protein Kinase. Nature 2007, 447, 1017–1020. [Google Scholar] [CrossRef] [PubMed]
  3. Brenman, J.E. AMPK/LKB1 Signaling in Epithelial Cell Polarity and Cell Division. Cell Cycle 2007, 6, 2755–2759. [Google Scholar] [CrossRef] [PubMed] [Green Version]
  4. Zwerschke, W.; Mazurek, S.; Stöckl, P.; Hütter, E.; Eigenbrodt, E.; Jansen-Dürr, P. Metabolic Analysis of Senescent Human Fibroblasts Reveals a Role for AMP in Cellular Senescence. Biochem. J. 2003, 376, 403–411. [Google Scholar] [CrossRef] [Green Version]
  5. Panayiotou, C.; Solaroli, N.; Karlsson, A. The Many Isoforms of Human Adenylate Kinases. Int. J. Biochem. Cell. B 2014, 49, 75–83. [Google Scholar] [CrossRef]
  6. Dzeja, P.P.; Zeleznikar, R.J.; Goldberg, N.D. Adenylate Kinase: Kinetic Behavior in Intact Cells Indicates It Is Integral to Multiple Cellular Processes. Mol. Cell. Biochem. 1998, 184, 169–182. [Google Scholar] [CrossRef]
  7. Shapiro, Y.E.; Meirovitch, E. Activation Energy of Catalysis-Related Domain Motion in E. Coli Adenylate Kinase. J. Phys. Chem. B 2006, 110, 11519–11524. [Google Scholar] [CrossRef]
  8. Reinstein, J.; Vetter, I.R.; Schlichting, I.; Roesch, P.; Wittinghofer, A.; Goody, R.S. Fluorescence and NMR Investigations on the Ligand Binding Properties of Adenylate Kinases. Biochemistry 1990, 29, 7440–7450. [Google Scholar] [CrossRef]
  9. Müller, C.W.; Schulz, G.E. Structure of the Complex between Adenylate Kinase from Escherichia Coli and the Inhibitor Ap5A Refined at 1.9 Å Resolution: A Model for a Catalytic Transition State. J. Mol. Biol. 1992, 224, 159–177. [Google Scholar] [CrossRef]
  10. Müller, C.; Schlauderer, G.; Reinstein, J.; Schulz, G. Adenylate Kinase Motions during Catalysis: An Energetic Counterweight Balancing Substrate Binding. Structure 1996, 4, 147–156. [Google Scholar] [CrossRef] [Green Version]
  11. Pelz, B.; Žoldák, G.; Zeller, F.; Zacharias, M.; Rief, M. Subnanometre Enzyme Mechanics Probed by Single-Molecule Force Spectroscopy. Nat. Commun. 2016, 7, 10848. [Google Scholar] [CrossRef] [PubMed] [Green Version]
  12. Miron, S.; Munier-Lehmann, H.; Craescu, C.T. Structural and Dynamic Studies on Ligand-Free Adenylate Kinase from Mycobacterium Tuberculosis Revealed a Closed Conformation that Can Be Related to the Reduced Catalytic Activity. Biochemistry 2004, 43, 67–77. [Google Scholar] [CrossRef]
  13. Bellinzoni, M.; Haouz, A.; Graña, M.; Munier-Lehmann, H.; Shepard, W.; Alzari, P.M. The Crystal Structure of Mycobacterium Tuberculosis Adenylate Kinase in Complex with Two Molecules of ADP and Mg2+ Supports an Associative Mechanism for Phosphoryl Transfer. Protein Sci. 2006, 15, 1489–1493. [Google Scholar] [CrossRef] [PubMed] [Green Version]
  14. Fu, C.; Peng, Y.; Liao, X.; Guo, C.; Lin, D. 1H, 13C, 15N Backbone and Side-Chain Resonance Assignments of the Human Adenylate Kinase 1 in Apo Form. Biomol. NMR Assign. 2013, 7, 155–158. [Google Scholar] [CrossRef] [PubMed]
  15. Rieping, W.; Habeck, M.; Bardiaux, B.; Bernard, A.; Malliavin, T.E.; Nilges, M. ARIA2: Automated NOE Assignment and Data Integration in NMR Structure Calculation. Bioinformatics 2007, 23, 381–382. [Google Scholar] [CrossRef] [PubMed] [Green Version]
  16. Shen, Y.; Bax, A. Protein Backbone and Sidechain Torsion Angles Predicted from NMR Chemical Shifts Using Artificial Neural Networks. J. Biomol. NMR 2013, 56, 227–241. [Google Scholar] [CrossRef] [Green Version]
  17. Laskowski, R.A.; MacArthur, M.W.; Moss, D.S.; Thornton, J.M. PROCHECK: A Program to Check the Stereochemical Quality of Protein Structures. J. Appl. Crystallogr. 1993, 26, 283–291. [Google Scholar] [CrossRef]
  18. Borglund, E.; Brolin, S.E.; Ågren, A. Fluorometric Microassays of Adenylate Kinase, an Enzyme Important in Energy Metabolism. Ups. J. Med. Sci. 1978, 83, 81–84. [Google Scholar] [CrossRef] [Green Version]
  19. Lipari, G.; Szabo, A. Model-Free Approach to the Interpretation of Nuclear Magnetic Resonance Relaxation in Macromolecules. 1. Theory and Range of Validity. J. Am. Chem. Soc. 1982, 104, 4546–4559. [Google Scholar] [CrossRef]
  20. Lipari, G.; Szabo, A. Model-Free Approach to the Interpretation of Nuclear Magnetic Resonance Relaxation in Macromolecules. 2. Analysis of Experimental Results. J. Am. Chem. Soc. 1982, 104, 4559–4570. [Google Scholar] [CrossRef]
  21. Dosset, P.; Hus, J.-C.; Blackledge, M.; Marion, D. Efficient Analysis of Macromolecular Rotational Diffusion from Heteronuclear Relaxation Data. J. Biomol. NMR 2000, 16, 23–28. [Google Scholar] [CrossRef] [PubMed]
  22. Cole, R.; Loria, J.P. FAST-Modelfree: A Program for Rapid Automated Analysis of Solution NMR Spin-Relaxation Data. J. Biomol. NMR 2003, 26, 203–213. [Google Scholar] [CrossRef] [PubMed]
  23. Farrow, N.A.; Zhang, O.; Szabo, A.; Torchia, D.A.; Kay, L.E. Spectral Density Function Mapping Using 15N Relaxation Data Exclusively. J. Biomol. NMR 1995, 6, 153–162. [Google Scholar] [CrossRef]
  24. Spyracopoulos, L. A Suite of Mathematica Notebooks for the Analysis of Protein Main Chain 15N NMR Relaxation Data. J. Biomol. NMR 2006, 36, 215. [Google Scholar] [CrossRef]
  25. Cui, D.-C.; Ren, W.-T.; Li, W.-F.; Wang, W. Metadynamics Simulations of Mg2+ Transfer in the Late Stage of the Adenylate Kinase Catalytic Cycle. Acta Phys.-Chim. Sin. 2016, 32, 429–435. [Google Scholar] [CrossRef]
  26. Onuk, E.; Badger, J.; Wang, Y.J.; Bardhan, J.; Chishti, Y.; Akcakaya, M.; Brooks, D.H.; Erdogmus, D.; Minh, D.D.L.; Makowski, L. Effects of Catalytic Action and Ligand Binding on Conformational Ensembles of Adenylate Kinase. Biochemistry 2017, 56, 4559–4567. [Google Scholar] [CrossRef]
  27. Lescop, E.; Lu, Z.; Liu, Q.; Xu, H.; Li, G.; Xia, B.; Yan, H.; Jin, C. Dynamics of the Conformational Transitions in the Assembling of the Michaelis Complex of a Bisubstrate Enzyme: A 15N Relaxation Study of Escherichia Coli 6-Hydroxymethyl-7,8-Dihydropterin Pyrophosphokinase. Biochemistry 2009, 48, 302–312. [Google Scholar] [CrossRef]
  28. Song, H.D.; Zhu, F. Conformational Dynamics of a Ligand-Free Adenylate Kinase. PLoS ONE 2013, 8, e68023. [Google Scholar] [CrossRef] [Green Version]
  29. Hollingsworth, S.A.; Dror, R.O. Molecular Dynamics Simulation for All. Neuron 2018, 99, 1129–1143. [Google Scholar] [CrossRef] [Green Version]
  30. Pawnikar, S.; Bhattarai, A.; Wang, J.; Miao, Y. Binding Analysis Using Accelerated Molecular Dynamics Simulations and Future Perspectives. AABC 2022, 15, 1–19. [Google Scholar] [CrossRef]
  31. Kerns, S.J.; Agafonov, R.V.; Cho, Y.-J.; Pontiggia, F.; Otten, R.; Pachov, D.V.; Kutter, S.; Phung, L.A.; Murphy, P.N.; Thai, V.; et al. The Energy Landscape of Adenylate Kinase during Catalysis. Nat. Struct. Mol. Biol. 2015, 22, 124–131. [Google Scholar] [CrossRef] [PubMed]
  32. Henzler-Wildman, K.A.; Thai, V.; Lei, M.; Ott, M.; Wolf-Watz, M.; Fenn, T.; Pozharski, E.; Wilson, M.A.; Petsko, G.A.; Karplus, M.; et al. Intrinsic Motions along an Enzymatic Reaction Trajectory. Nature 2007, 450, 838–844. [Google Scholar] [CrossRef] [PubMed]
  33. Henzler-Wildman, K.A.; Lei, M.; Thai, V.; Kerns, S.J.; Karplus, M.; Kern, D. A Hierarchy of Timescales in Protein Dynamics Is Linked to Enzyme Catalysis. Nature 2007, 450, 913–916. [Google Scholar] [CrossRef] [PubMed]
Figure 1. Standalone and comparative representation of the apo-hAK1 structure. (A) Superposition of 20 lowest-energy structures of apo-hAK1 represented as ribbons (PDB ID: 7X7S). (B) Mean structure of apo-hAK1 depicted in cartoon. α-helices and β-strands are colored in cyan and purple, respectively. (C) Conformation of NMP and LID domains in apo-hAK1. (D) Conformation of NMP and LID domains in the hAK1-B4P complex (PDB ID: 2C95). The Cα atoms of V47 in α3, R132 in α7 and T145 in α8 are selected to optimally exhibit the distances between α3 and α7 or α8, which are displayed as cyan spheres. The α-helices of apo-hAK1 and B4P-complexed hAK1 are colored in cyan and yellow, respectively. (E,F) Superposition of 7X7S (α-helices in cyan and β-strands in purple) and 2C95 (α-helices in yellow and β-strands in red) structures. 7X7S atom coordinates were RMS fitted to 2C95 by Cα atoms in α1, α2, α5, α6, α9, and β15 for visualization.
Biomolecules 12 00671 g001
Figure 2. Determination of key residues for hAK1 catalyzing ADP. (A) Overlaid 2D 1H-15N HSQC spectra of the hAK1 protein with and without Mg2+-ADP addition. Black: hAK1, Red: hAK1-Mg2+-ADP; dashed box represents disappeared peaks after Mg2+-ADP addition. (B) Identification of residues with significant peak broadening after Mg2+-ADP addition. (C) Identification of residues with significant peak shifting after Mg2+-ADP addition. (D) Mapping perturbed residues onto the three-dimensional structure of apo-hAK1 (PDB ID: 7X7S). (E) Enzymatic activity comparison of hAK1 and its variants. (F) Mapping key residues for hAK1 catalyzing ADP onto the 3D structure of the hAK1-B4P complex (PDB ID: 2C95). Blue dashed circle: ADP catalyzing center.
Biomolecules 12 00671 g002
Figure 3. R1, R2, and hnNOE values of apo-hAK1 (A) and holo-hAK1 (B). The secondary structure elements of hAK1 are displayed on the top of the figure. The α3α4 in the NMP domain and α7α8 in the LID domain are highlighted in blue and red, respectively.
Biomolecules 12 00671 g003
Figure 4. Model-free analyses of apo-hAK1 and holo-hAK1. (A,B) Three dynamics parameters (S2, τe and Rex) fitted from model-free analyses based on the obtained relaxation parameters of R1, R2, and {1H}-15N NOE of apo-hAK1 (A) and holo-hAK1 (B). (C,D) Residues with τe (displayed in red) and Rex (showed as green balls) are mapped onto the 3D structures of apo-hAK1 (C) and hAK1-Mg2+-B4P (D). Red balls: residues with τe and Rex simultaneously. Blue dashed circle: the catalyzing center. The secondary structure elements of hAK1 are displayed on the top of the figure. The α3α4 in the NMP domain and α7α8 in the LID domain are highlighted in blue and red, respectively.
Biomolecules 12 00671 g004
Figure 5. Comparison of the S2 values of holo-hAK1 with apo-hAK1. (A) Differences of the S2 values between holo-hAK1 and apo-hAK1. The secondary structure elements of hAK1 are displayed on the top of the figure. The α3α4 in the NMP domain and α7α8 in the LID domain are highlighted in blue and red, respectively. (B) Residues in holo-hAK1 with increased S2 values are mapped onto the 3D structure of the hAK1-Mg2+-B4P complex.
Biomolecules 12 00671 g005
Figure 6. Spectral density functions of residues in apo-hAK1 (A) and holo-hAK1 (B). Analysis of reduced spectral density mapping was carried out using Mathematica notebooks from Leo Spyracopoulos [24]. The secondary structure elements of hAK1 are displayed on the top of the figure. The α3α4 in the NMP domain and α7α8 in the LID domain are highlighted in blue and red, respectively.
Biomolecules 12 00671 g006
Figure 7. Comparison of spectral density functions of the α3α4 and α7α8 fragments between apo-hAK1 and holo-hAK1. (A) J(0); (B) JN); (C) J(0.87ωH).
Biomolecules 12 00671 g007
Table 1. NMR restraints and structural statistics for hAK1.
NMR Distance and Dihedral ConstraintsValues
Total unambiguous distance restraints2603
Intra-residual884
Sequential (|i–j| = 1)728
Short-range (2 ≤ |i–j| ≤ 3)388
Medium-range (4 ≤ |i–j| ≤ 5)144
Long-range (|i–j| > 5)459
Total ambiguous distance restraints402
Total dihedral angle restraints350
φ (backbone dihedral angle Ci-1–Ni–Ci,α–Ci)175
ψ (backbone dihedral angle Ni–Ci,α–Ci–Ni+1)175
Structural statistics
Mean restraint violations
Distance restraint violations (>0.5 Å)0.90
Dihedral restraint violations (>5°)1.35
Average RMSD (Å) to mean structure (all residues)
Backbone RMSD0.57 ± 0.09
Heavy atoms RMSD0.84 ± 0.06
Ramachandran plot statistics 1
Residues in favored regions89.2% ± 1.5%
Residues in allowed regions10.6% ± 1.7%
Residues in generously allowed regions0.2% ± 0.3%
Residues in disallowed regions0% ± 0%
1 Analyzed with PROCHECK.
Publisher’s Note: MDPI stays neutral with regard to jurisdictional claims in published maps and institutional affiliations.

