1. Introduction
Alzheimer’s disease (AD) is the most prevalent neurodegenerative disease and the most extensively studied cause of dementia [
1]. Pathologically, AD is characterized by and manifests with neurofibrillary tangles formed from the improperly processed phosphorylated tau proteins in the intracellular space and the accumulation of amyloid beta plaques in the intercellular space [
2,
3]. These abnormal aggregates are associated with oxidative stress and inflammation [
4], resulting in microglial activation and neurodegeneration in the brain [
5] and further causing the impairment or even loss of normal cognitive function and memory as age advances. Age, apolipoprotein E ɛ4 (APOE), and sex are the three greatest risk factors for AD [
6]. In fact, sex is an important variable for AD patient stratification and personalized treatment [
7], and a recent study of a large number of transcriptomes shows profound sex-specific changes and network remodeling in AD [
8]. Mechanistically, the sex-specific differential response to AD might be caused by the sex-specific differential transcriptional response to AD pathology [
9]. Despite extensive studies investigating the risk factors and neuropathogenesis of AD, the etiology and molecular and cellular mechanisms underlying AD are still largely unknown [
2,
3], and the majority of the experimental drugs tested for AD have failed without showing significant efficacy [
10].
Proteomics analyses have been utilized to investigate mechanisms underlying neurodegenerative diseases because alterations in protein expression correlate better with phenotypes than changes in RNA expression [
11]. Protein expression can be regulated at multiple levels, including transcriptional and epigenetic control over gene activity and post-transcriptional modulation of RNA splicing, stability, and transport [
12]. Comparison of transcriptomic and proteomic profiling has revealed that ~40% of the variation in protein expression is likely caused and regulated by post-transcriptional and translational/post-translational mechanisms [
13,
14]. Post-translational modifications (PTMs) regulate protein trafficking, function, and degradation, and thus, aberrant PTMs of disease-relevant proteins would trigger abnormal alterations in pathological pathways, leading to disease progression [
10]. Many studies of neurodegenerative diseases, including AD, have characterized PTMs of disease-relevant proteins such as tau [
15] and TDP-43 [
16]. Globally, MS-based proteomic analysis using both label-free [
17] and tandem mass tag (TMT)-labeled [
13,
18] approaches plus various enrichment strategies has emerged as an important paradigm to survey changes in the PTMs of AD patients and healthy controls. The results from these comprehensive surveys [
13,
17,
18] on PTMs provide valuable insight into the biochemical signaling pathways that drive AD pathogenesis and progression [
15].
Dual-specificity phosphatases (DUSPs) are a protein phosphatase subfamily with selectivity towards mitogen-activated protein kinases (MAPKs) [
19]. DUSP4, a member of this family, has been shown to dephosphorylate MAPKs, including ERK, JNK, and p38 kinases. In human epileptic brains, DUSP4 appears to function as a feedback inhibitor of pro-epileptogenic MAPK signaling [
20]. Mechanistically, DUSP4 was demonstrated to be in the PRMT1-DUSP4-p38 axis to modulate cell differentiation [
21]. DUSPs, including DUSP4, have become an important focus of research in neurodegenerative diseases because of their identified contributions to many important biological processes, including neuroprotection, differentiation, and inflammation [
19]. In our recent study [
22], we investigated the roles of DUSP4 and its downstream network in developing learning behavior impairment and neuropathology in the 5xFAD amyloidopathy mouse model. We found that overexpression of DUSP4 improves learning behavior only in female 5xFAD, whereas β-amyloid load is reduced in both male and female mice [
22]. Transcriptomics profiling plus pathway enrichment analysis further supported the idea that DUSP4 may modulate the AD phenotype in a sex-specific manner [
22].
In the present study, we sought to perform proteomics and phosphoproteomics analyses of the 5xFAD mice with and without DUSP4 overexpression to identify proteins and phosphorylation modulated via DUSP4. We further compared our DUSP4-modulated proteomes with AD-associated protein signatures and networks derived from large proteomic studies of human postmortem brains with AD to understand how DUSP4 may contribute to AD pathogenesis. Finally, we developed sex-specific, DUSP4-centric proteomic network models and signaling maps.
3. Results
We performed both proteomic and phosphoproteomic analyses using the label-free quantification of MaxQuant [
46,
47,
48] to analyze the mouse brain hippocampal samples extracted from four experimental groups that had been administered AAV-DUSP4 or AAV-GFP into dHc: 5xFAD-DUSP4 (
n = 7 females,
n = 4 males), 5xFAD-GFP (
n = 7 females,
n = 5 males), WT-GFP (
n = 5 females,
n = 7 males), and WT-DUSP4 (
n = 5 females,
n = 6 males) (
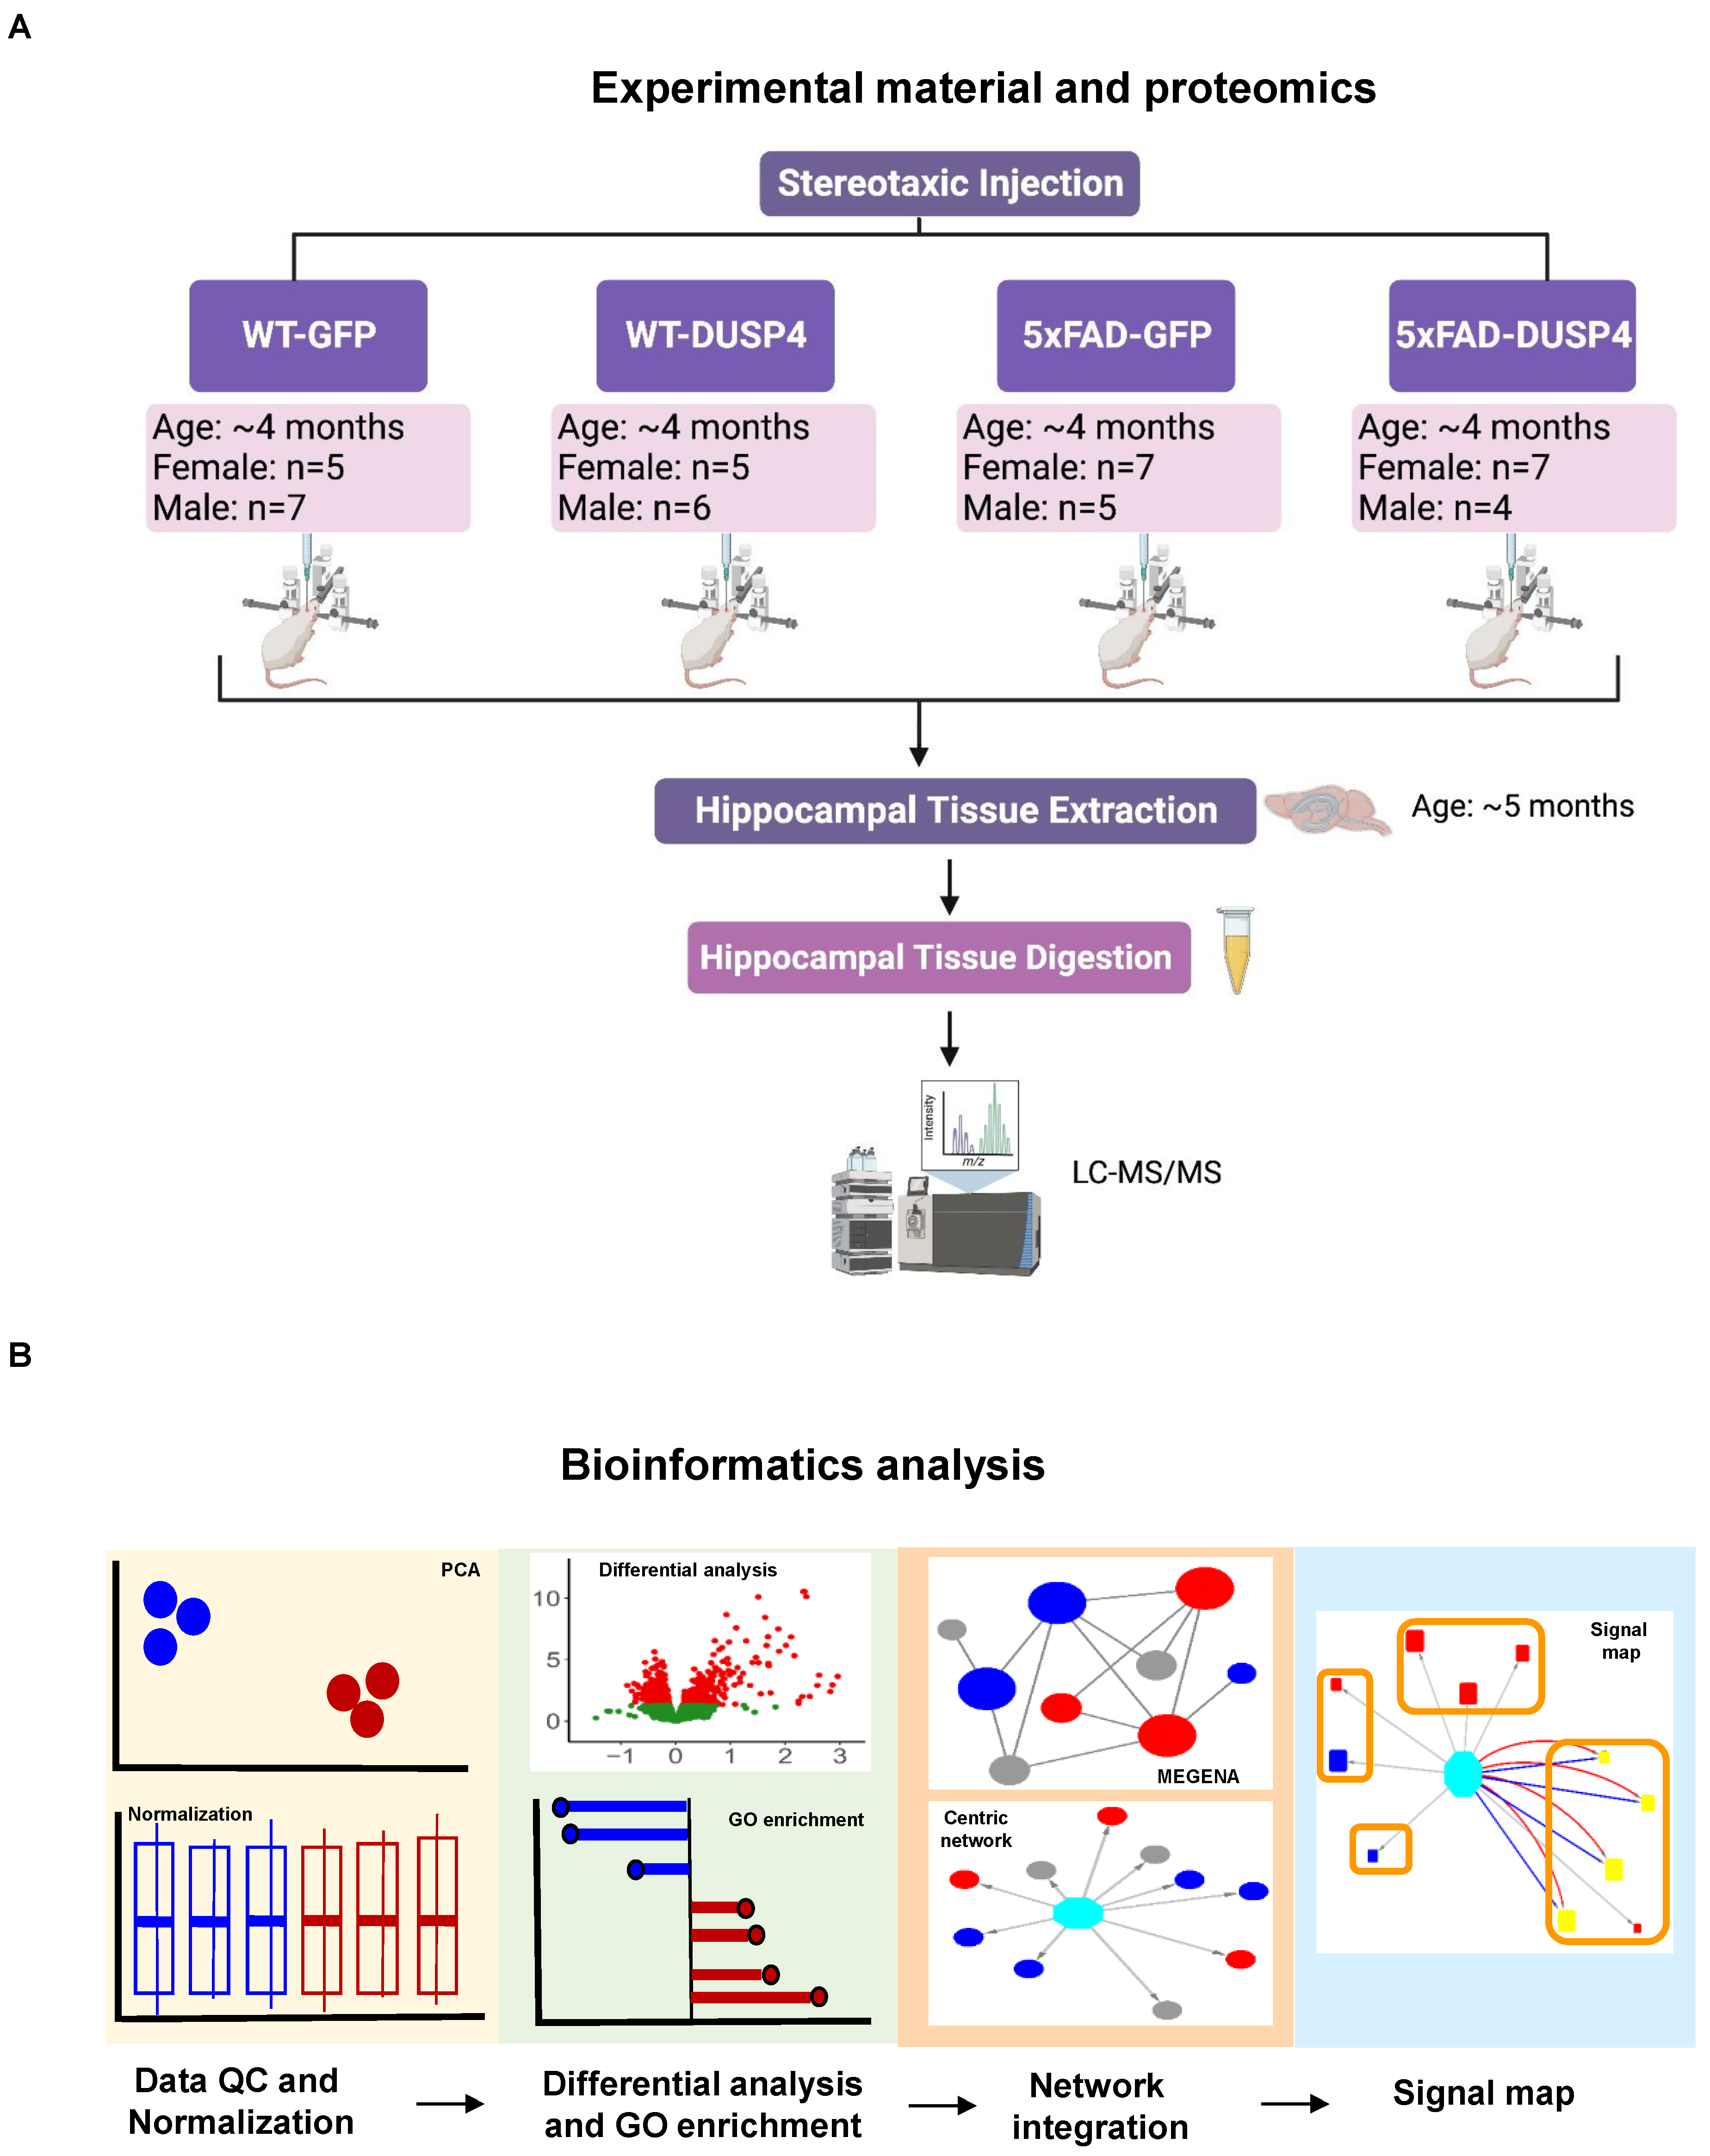
Figure 1A, see
Section 2 and
Supplementary Data S1). As quality control (QC), we verified the genotypes of mice by the western blot analysis using the antibody (6E10) that specifically recognizes transgenic human amyloid precursor protein (APP) and using microscopic observation of the GFP protein activity/fluorescence (see
Section 2). Based on this analysis, a male mouse originally identified as 5xFAD-GFP was re-classified as WT-GFP, and the downstream analysis was corrected. In addition, we conducted QC on the proteomic and phosphoproteomic data for further downstream processing (see
Section 4).
In the present study, we focused our analysis on the two most critical comparisons, i.e., 5xFAD-GFP vs. WT-GFP, to identify proteins and phosphoproteins that are regulated in the 5xFAD mouse model compared to WT, and in comparisons of 5xFAD-DUSP4 to 5xFAD-GFP, to investigate the impact of DUSP4 overexpression on the proteome/phosphoproteome in 5xFAD. To simplify the presentation, we termed the comparison 5xFAD-GFP vs. WT-GFP as 5xFADvsWT, and 5xFAD-DUSP4 vs. 5xFAD-GFP as 5xFAD-DUSP4vs5xFAD.
Furthermore, we used the nominal
p < 0.05 as a cut-off to include the proteins/phosphoproteins regulated via DUSP4 overexpression. Our experimental validation of selected proteins and integration with human proteomics showed that this cut-off is an effective criterion for determining the proteomic/phosphoproteomic signatures regulated by DUSP4 (see
Section 4).
Figure 1B highlights the bioinformatics workflow for data analysis and integration.
3.1. Substantial Numbers of Differentially Expressed Proteins (DEPs) Were Regulated in 5xFAD and via DUSP4 Overexpression
Together, we quantified 4459 distinct proteins over the 46 samples. After QC (see
Section 2), we obtained 3578 unique proteins. We performed DEP analysis to reveal the mouse proteome impacted by the 5xFAD transgene and DUSP4 overexpression. We identified 685 and 564 DEPs comparing 5xFADvsWT for female and male mice, respectively (
Figure 2A;
Supplementary Figure S1A; Supplementary Data S2A,B). We detected more DEPs that were down-regulated than up-regulated in 5xFADvsWT for mice of both sexes (
Supplementary Figure S2). As expected, the expression of APP was substantially elevated in 5xFAD mice of each sex (
Figure 2A;
Supplementary Figure S1A; Supplementary Data S2A,B). In comparing 5xFAD-DUSP4vs5xFAD, we found 295 and 335 DEPs for female and male mice, respectively (
Figure 2B;
Supplementary Figure S1B; Supplementary Data S2C,D). In contrast to the comparison of 5xFADvsWT, we detected more up-regulated DEPs than down-regulated ones in 5xFAD-DUSP4vs5xFAD in each sex (
Supplementary Figure S2). As anticipated, DUSP4 protein levels were markedly increased in 5xFAD-DUSP4vs5xFAD for both female (fold-change (FC) = 6.7,
p = 0.05) and male (FC = 22.8,
p = 4.7 × 10
−6) mice, respectively (
Supplementary Data S2C,D). Note that the APP protein expression was not altered in 5xFAD-DUSP4vs5xFAD.
We compared the DEP signatures across different comparisons for each sex. We separated up-regulated proteins from down-regulated ones to examine consistency in the directionality of protein expression changes. For each comparison, we observed significant overlap between the male and female DEP signatures in the direction of protein expression changes and insignificant overlap in the opposite directions (
Figure 2C;
Supplementary Figure S3A). For example, the up-regulated signatures of males and females in 5xFADvsWT significantly overlap (fold enrichment (FE) = 4.2, FDR = 1.1 × 10
−68;
Figure 2C) and the down-regulated signatures of males and females in 5xFAD-DUSP4vs5xFAD also significantly overlapped (FE = 1.8, FDR = 0.02;
Supplementary Figure S3A). In contrast, in male mice, the up-regulated signature in 5xFAD-DUSP4vs5xFAD significantly overlaps the down-regulated signature in 5xFADvsWT (FE = 7.8, FDR = 1.7 × 10
−44;
Figure 2D). Similar results were observed in female mice (
Supplementary Figures S2 and S3B). These results show that DUSP4 overexpression reverses the abnormal proteomic changes in the 5xFAD mice in comparison with the wildtype mice: in male mice, ~27% of the DEPs were reversed, whereas ~15% of the DEPs in female mice were reversed upon the DUSP overexpression (
Supplementary Figure S2).
We further looked into the DEPs for cell-type specificity. We observed that the down-regulated signatures were enriched for the markers of neurons. In contrast, the up-regulated signatures were most enriched for the markers of microglia and astrocytes in 5xFADvsWT in both sex groups (
Figure 2E), consistent with some previous findings of up-regulated immune response and neuronal damage, and down-regulated synaptic transmission [
49]. However, in 5xFAD-DUSP4vs5xFAD, we found that the down-regulated signatures were enriched for the markers of microglia and astrocytes in both sex groups, whereas the up-regulated signature in only males was enriched for the neuronal markers (
Figure 2E). Thus, overexpression of DUSP4 affected all the major brain cell types, albeit with differences in enrichment significance across sex groups (
Figure 2E).
We also examined biological pathways and functional processes in which these DEPs participated. In male 5xFAD mice, the immune and defense response was activated while neuronal and synaptic functions were suppressed (
Figure 2F). Similar results were observed for female 5xFAD mice (
Supplementary Figure S4A). We then examined the effect of DUSP4 overexpression in 5xFAD mice. In male mice, DUSP4 overexpression activated pathways like intracellular signal transduction while it suppressed immune and defense responses that were activated in 5xFAD mice (
Figure 2G). However, in females, DUSP4 overexpression affected a different set of pathways (
Supplementary Figure S4B). Note that many pathways suppressed via DUSP4 overexpression in female mice (e.g., apoptotic process) are detrimental to cell functions (
Supplementary Figure S4B). These results revealed sex-specific functions of DUSP4.
3.2. DUSP4 Overexpression Caused Significant Changes in Differentially Expressed Post-translational Modification (DEPTM) Sites
We preprocessed the mass spectrometry (MS)-based phosphoproteome profiling using the R package PhosPiR, which removed MaxQuant-marked reverse sequences and potential contaminants, and have summarized the intensities for each phosphosite entry, termed PTM site (see
Section 2). The expression level (intensity) at each PTM site was obtained from quantile normalization and low-rank approximation imputation [
32]. We removed any PTM site with no gene name or PTM position information. The expression was further log2-transformed for the downstream analysis.
Figure 2.
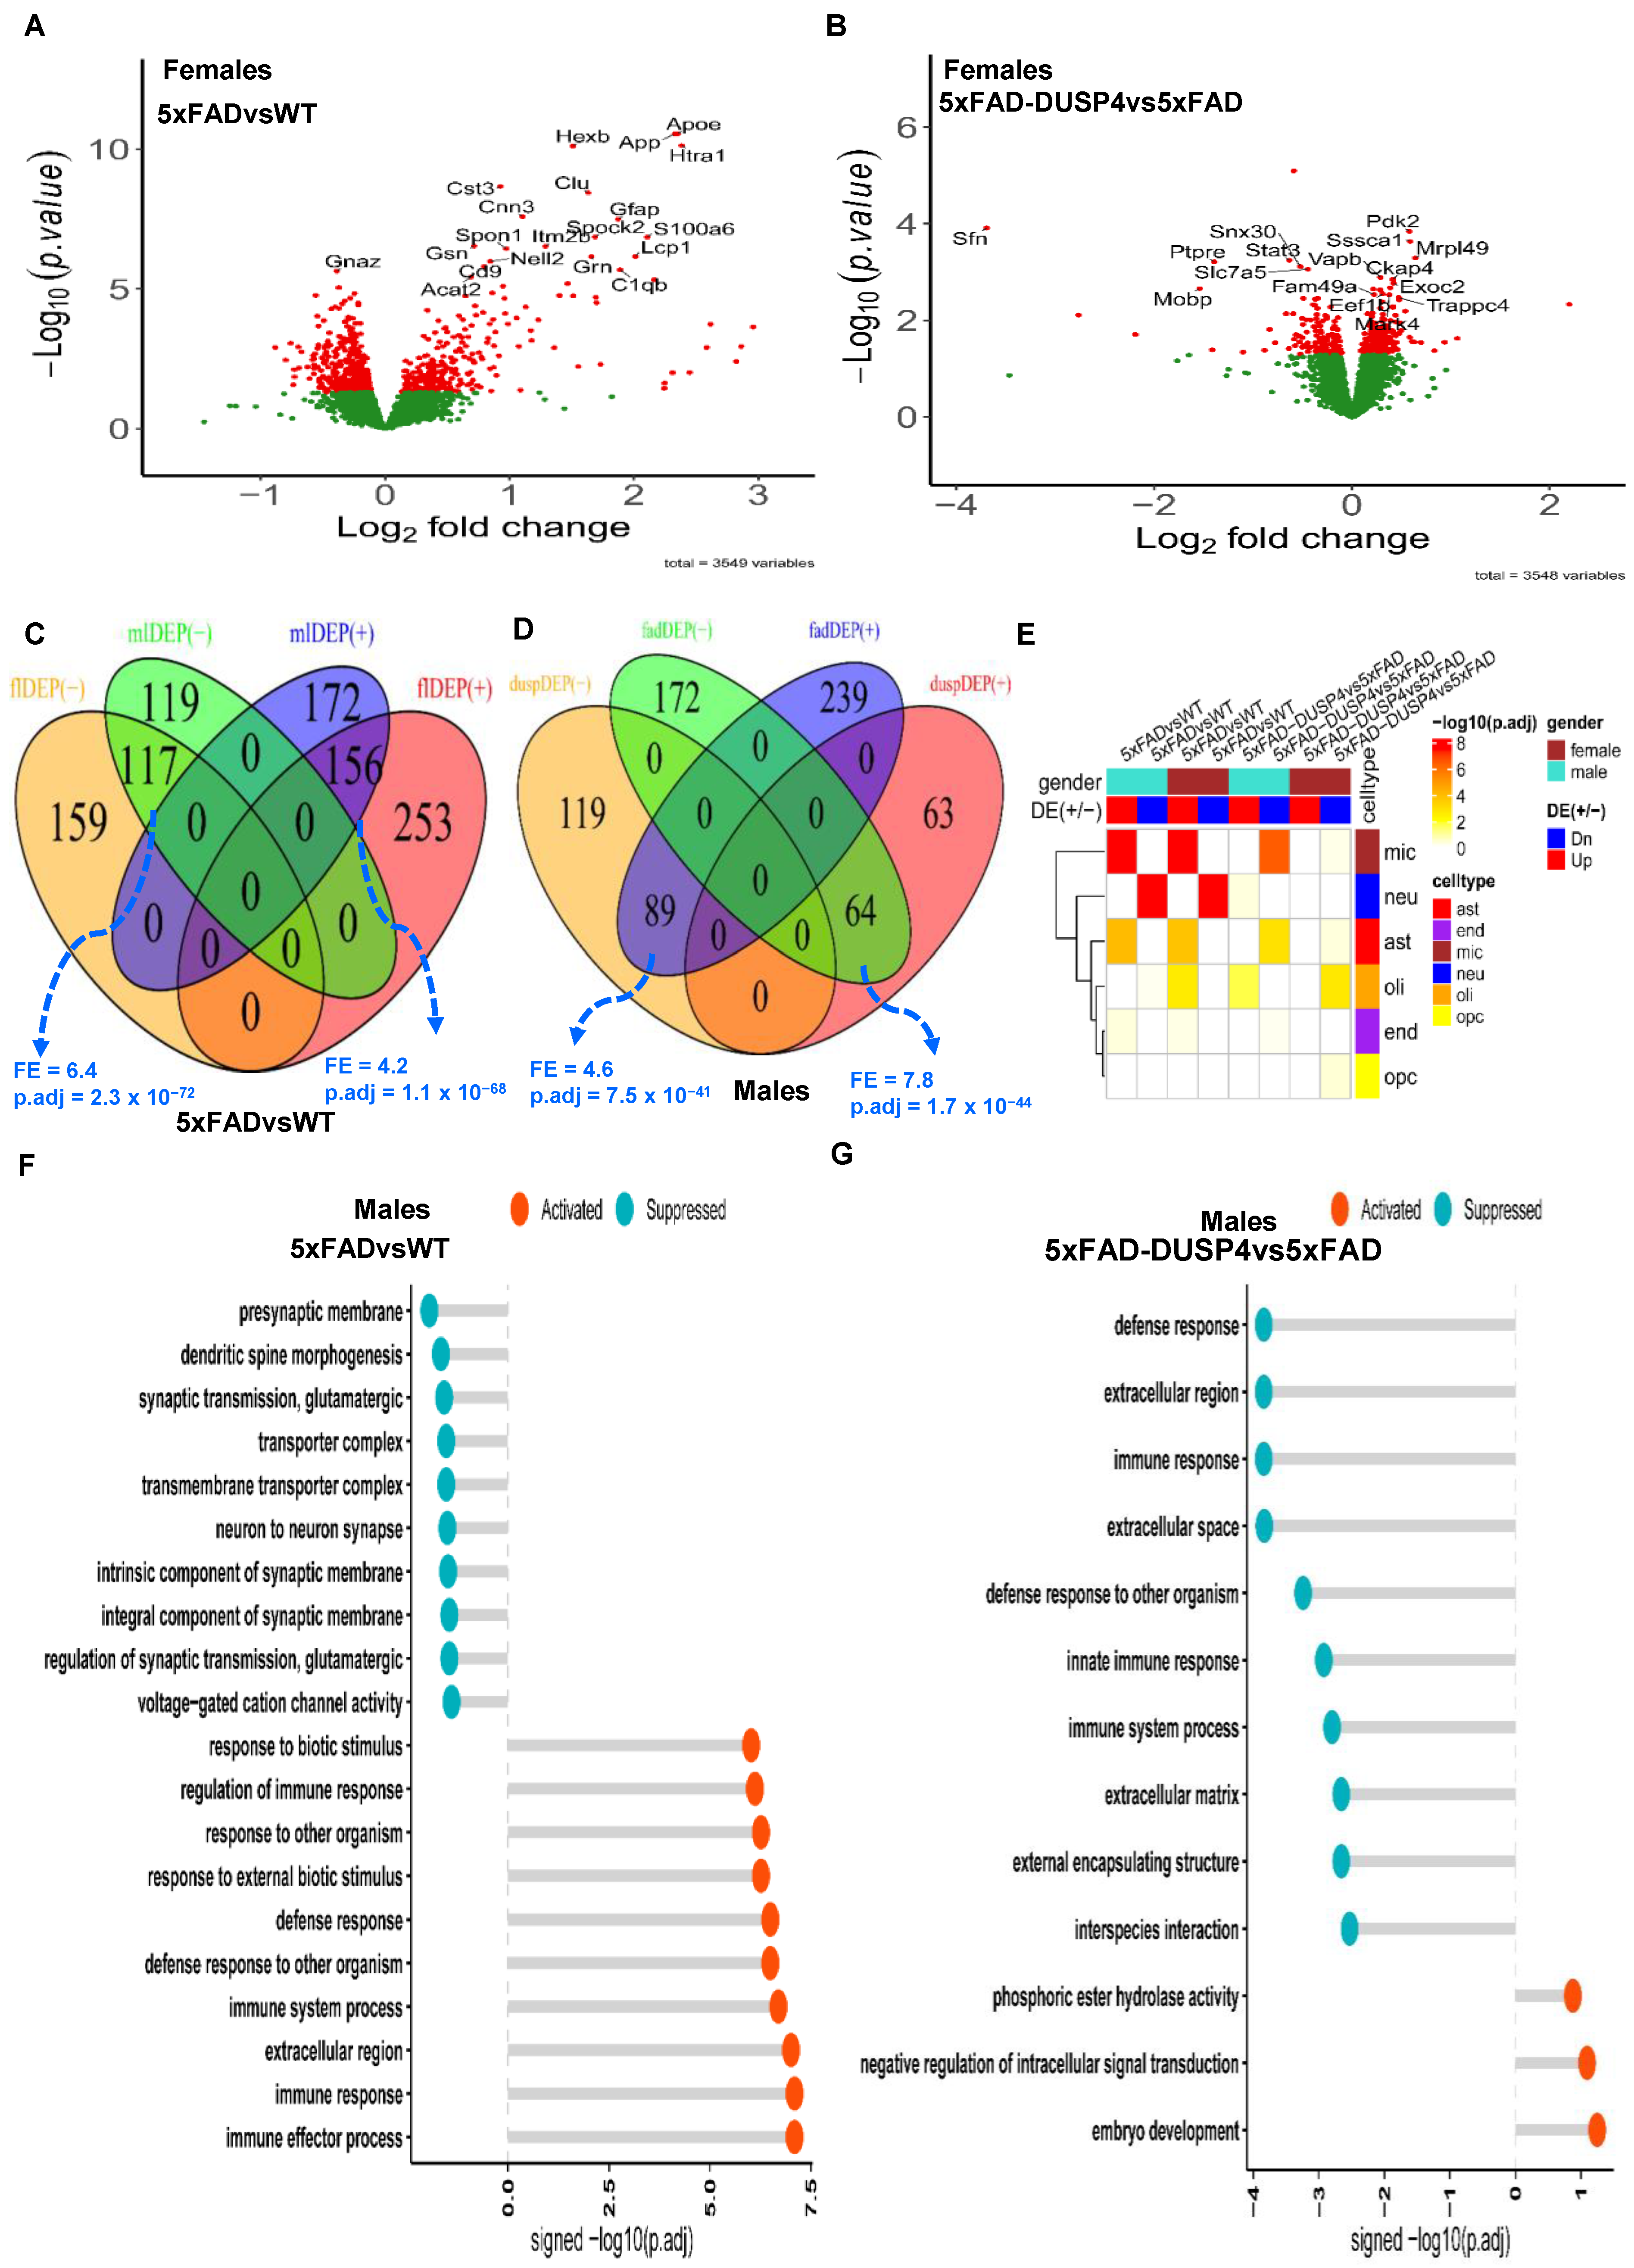
Analysis of differentially expressed proteins (DEPs). (
A) Volcano plot showing the DEPs in 5xFADvsWT in female mice. (
B) Volcano plot showing the DEPs in 5xFAD-DUSP4vs5xFAD female mice. In (
A,
B), each dot represents a protein, and highlighted are the top-ranked 10 DEPs in each comparison. Dots in red are DEPs, whereas dots in green are not differentially expressed proteins. (
C) Venn diagram showing the overlap of the DEPs in 5xFADvsWT between male and female mice. mlDEP(-) and mlDEP(+) are down- and up-regulated DEPs in males. flDEP() and flDEP(+) are down- and up-regulated DEPs in females. (
D) Venn diagram showing the overlapping of DEPs between 5xFADvsWT and 5xFAD-DUSP4vs5xFAD in male mice. fadDEP() and fadDEP(+) are down- and up-regulated DEPs in 5XFAD. duspDEP() and duspDEP(+) are down- and up-regulated DEPs in DUSP4 overexpression. FE, fold enrichment for the intersection between two DEPTM signature sets. p.adj, BH-adjusted
p-value showing the statistical significance of the enrichment. (
E) Enrichment of various mouse DEP lists from the present study in the published reference mouse cell-type signatures. The reference mouse cell-type signatures were curated and described in [
50], which include six gene signatures that are specifically expressed in microglia (mic), neuron (neu), astrocytes (ast), oligodendrocytes (oli), endothelial cells (end), and oligodendrocyte precursor cells (opc), respectively. (
F,
G) GO enrichment analysis on DEPs of 5xFADvsWT (
G) and 5xFAD-DUSP4vs5xFAD (
F) in male mice. X-axis, −log10(p.adj) split by enrichment groups, activated (positive) vs. suppressed (negative). Y-axis, GO (gene ontology) terms. The higher of a −log10(p.adj) value the more likely the DEP signature is associated with a GO pathway.
Figure 2.
Analysis of differentially expressed proteins (DEPs). (
A) Volcano plot showing the DEPs in 5xFADvsWT in female mice. (
B) Volcano plot showing the DEPs in 5xFAD-DUSP4vs5xFAD female mice. In (
A,
B), each dot represents a protein, and highlighted are the top-ranked 10 DEPs in each comparison. Dots in red are DEPs, whereas dots in green are not differentially expressed proteins. (
C) Venn diagram showing the overlap of the DEPs in 5xFADvsWT between male and female mice. mlDEP(-) and mlDEP(+) are down- and up-regulated DEPs in males. flDEP() and flDEP(+) are down- and up-regulated DEPs in females. (
D) Venn diagram showing the overlapping of DEPs between 5xFADvsWT and 5xFAD-DUSP4vs5xFAD in male mice. fadDEP() and fadDEP(+) are down- and up-regulated DEPs in 5XFAD. duspDEP() and duspDEP(+) are down- and up-regulated DEPs in DUSP4 overexpression. FE, fold enrichment for the intersection between two DEPTM signature sets. p.adj, BH-adjusted
p-value showing the statistical significance of the enrichment. (
E) Enrichment of various mouse DEP lists from the present study in the published reference mouse cell-type signatures. The reference mouse cell-type signatures were curated and described in [
50], which include six gene signatures that are specifically expressed in microglia (mic), neuron (neu), astrocytes (ast), oligodendrocytes (oli), endothelial cells (end), and oligodendrocyte precursor cells (opc), respectively. (
F,
G) GO enrichment analysis on DEPs of 5xFADvsWT (
G) and 5xFAD-DUSP4vs5xFAD (
F) in male mice. X-axis, −log10(p.adj) split by enrichment groups, activated (positive) vs. suppressed (negative). Y-axis, GO (gene ontology) terms. The higher of a −log10(p.adj) value the more likely the DEP signature is associated with a GO pathway.
![Biomolecules 14 00066 g002]()
We obtained 7124 distinct PTMs across the 46 samples, spanned 2222 unique proteins, averaging about 3 PTM sites per protein. We performed differential expression analysis on all the PTMs. We identified 982 and 557 DEPTMs in 5xFADvsWT for female and male mice, respectively (
Figure 3A;
Supplementary Figure S5A; Supplementary Data S3A,B). We detected more DEPTMs that were up-regulated than down-regulated in 5xFADvsWT in both sex groups (
Supplementary Figure S6). In comparing 5xFAD-DUSP4vs5xFAD, we found 409 and 425 DEPTMs for female and male mice, respectively (
Figure 3B;
Supplementary Figure S5B; Supplementary Data S3C,D). In contrast to the comparison of 5xFADvsWT, we detected more down-regulated than up-regulated DEPTMs in the 5xFAD-DUSP4vs5xFAD for mice of either sex (
Supplementary Figure S6). We then compared the DEPTM signatures across different comparisons in each sex in the same way we conducted the DEP analysis (see above). Overall, a similar trend was observed for the DEPTMs as for the DEPs (
Figure 3C,D;
Supplementary Figure S7). In each comparison (5xFADvsWT or 5xFAD-DUSP4vs5xFAD), female and male mice shared a significant portion of DEPTMs with the same directionality, whereas in each sex, 5xFADvsWT and 5xFAD-DUSP4vs5xFAD showed significant overlap between their DEPTMs but with opposite directionality (
Figure 3C,D;
Supplementary Figure S7). We further quantified the proportion of DEPTMs that are reversed in expression via DUSP4 overexpression. We found that female mice had a slightly higher percentage of DEPTMs reversed (15%) compared to males (14%; see
Supplementary Figure S6). These results again suggested that DUSP4 overexpression might reverse the effects of the 5xFAD transgene on mice at the phosphoproteome level.
We further explored the pathways in which the DEPTMs were involved. Since proteins may possess multiple phosphorylation sites, we collapsed the DEPTM sites onto their respective protein levels. We define a differentially phosphorylated protein (DPP) as containing at least one DEPTM. We obtained 665 and 418 DPPs in 5xFADvsWT for female and male mice, respectively, and 327 and 340 DPPs in 5xFAD-DUSP4vs5xFAD for female and male mice, respectively. As shown in
Figure 3E,F, the most affected pathways are involved in neuronal processes and synaptic function for the DPPs (DEPTMs) across the comparisons in each sex (
Supplementary Figure S8A,B), suggesting that both 5xFAD and DUSP4 might often influence the phosphorylation state of the proteins that are relevant to neuronal and synaptic function.
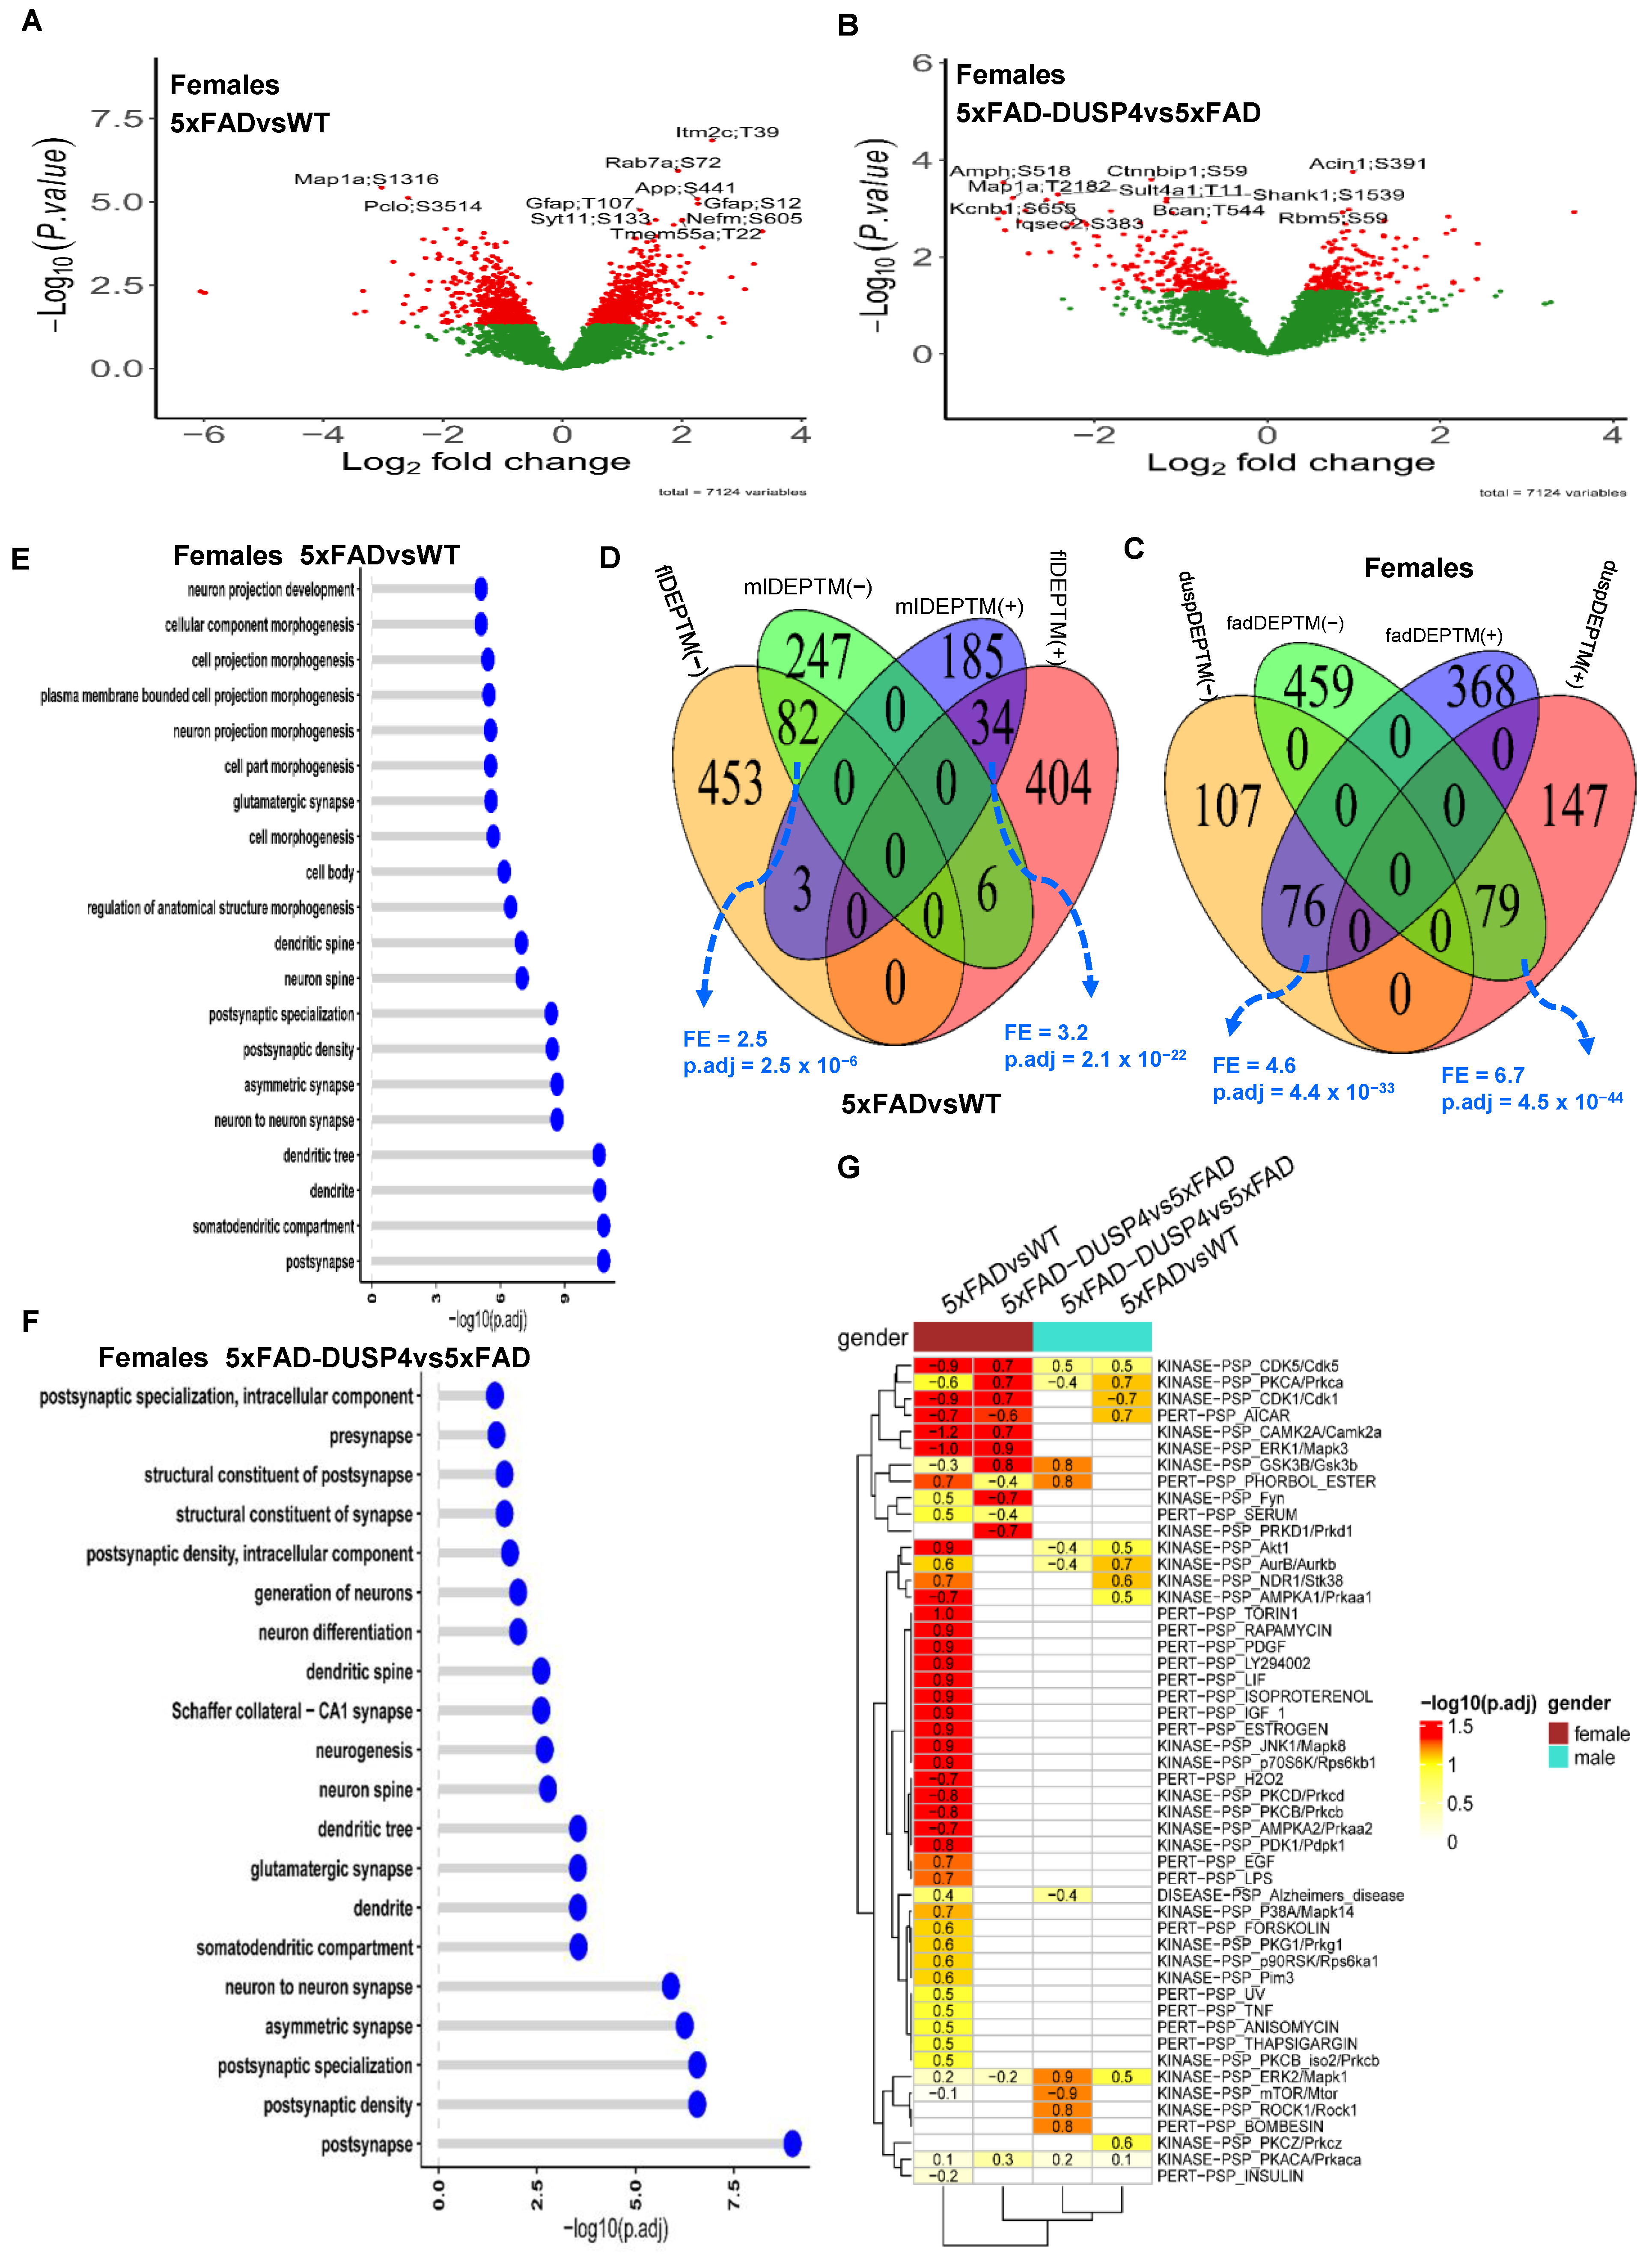
Figure 3.
Analysis of differentially expressed PTM (DEPTM). (A,B) Volcano plots visualizing DEPTMs in 5xFADvsWT (A) and 5xFAD-DUSP4vs5xFAD (B) in female mice, respectively. In (A) and (B), each dot represents a protein and highlighted are top-ranked DEPTMs. Dots in red are DEPTMs that are significantly different expressions in the comparisons, whereas dots in green are not differentially expressed PTMs. Highlighted are the top 10 most significant DEPTMs. (C) Venn diagram showing the overlapping of DEPTMs between 5xFADvsWT and 5xFAD-DUSP4vs5xFAD in female mice. fadDEPTM(-) and fadDEPTM(+) are down- and up-regulated DEPTMs in 5XFAD. duspDEPTM(-) and duspDEPTM(+) are down- and up-regulated DEPTMs in DUSP4 overexpression. (D) Venn diagram showing the overlapping of DEPTMs in 5xFADvsWT between male and female mice. mlDEPTM(-) and mlDEPTM(+) are down- and up-regulated DEPTMs in males. flDEPTM(-) and flDEPTM(+) are down- and up-regulated DEPTMs in females. FE, fold enrichment for the intersection between two DEPTM signature sets. p.adj, BH-adjusted p-value showing the statistical significance of the enrichment. (E,F) GO enrichment analysis on the DEPTMs of 5xFADvsWT (E) and 5xFAD-DUSP4vs5xFAD (F) in female mice. Y-axis, GO terms. X-axis, −log10(p.adj), the higher of which, the more likely the DEPTM signature is associated with the GO pathways. (G) PTM site enrichment analysis on various DEPTM signatures. Highlighted numbers are the score of fold enrichment. The color bar showing the −log10(p.adj) for the enrichment score: The higher the value, the more likely the DEPTM signature is relevant to the PTM site signature in the database.
![Biomolecules 14 00066 g003]()
To delve more deeply into the signals represented in our phosphoproteome profiling, we applied the site-centric pathway analysis [
33] on our PTMs via the algorithm as described in the R package GSVA [
34] (see
Section 2). We examined how the PTMs are enriched for the PTM site-specific phosphorylation signatures [
33] (PTMsigDB). As shown in
Figure 3G, in female 5xFADvsWT, the PTMs were enriched over more than half of the PTM sets in the mouse PTMsigDB. The top-ranked kinase PTM sets are KINASE-PSP_CAMK2A/Camk2a, KINASE-PSP_ERK1/Mapk3, and KINASE-PSP_JNK1/Mapk8 [
51] (
Figure 3G), which are critical in AD neuropathogenesis. Strikingly, the PTMs from 5xFAD-DUSP4vs5xFAD in female mice are enriched for the PTM sets in the mouse PTMsigDB yet with an opposite directionality in enrichment score (ES) (
Figure 3G), highlighting that DUSP4 overexpression in 5xFAD mice normalized the dysregulation of the PTM sets in 5xFAD mice in comparison with WT mice. In contrast, in male mice, the enrichment of PTMs in the mouse PTMsigDB was not very evident in spite of the enrichment in a few PTM sets (
Figure 3G). These results further suggested that DUSP4 overexpression might counteract the effects of the 5xFAD transgene in mice in PTM site-centric pathways.
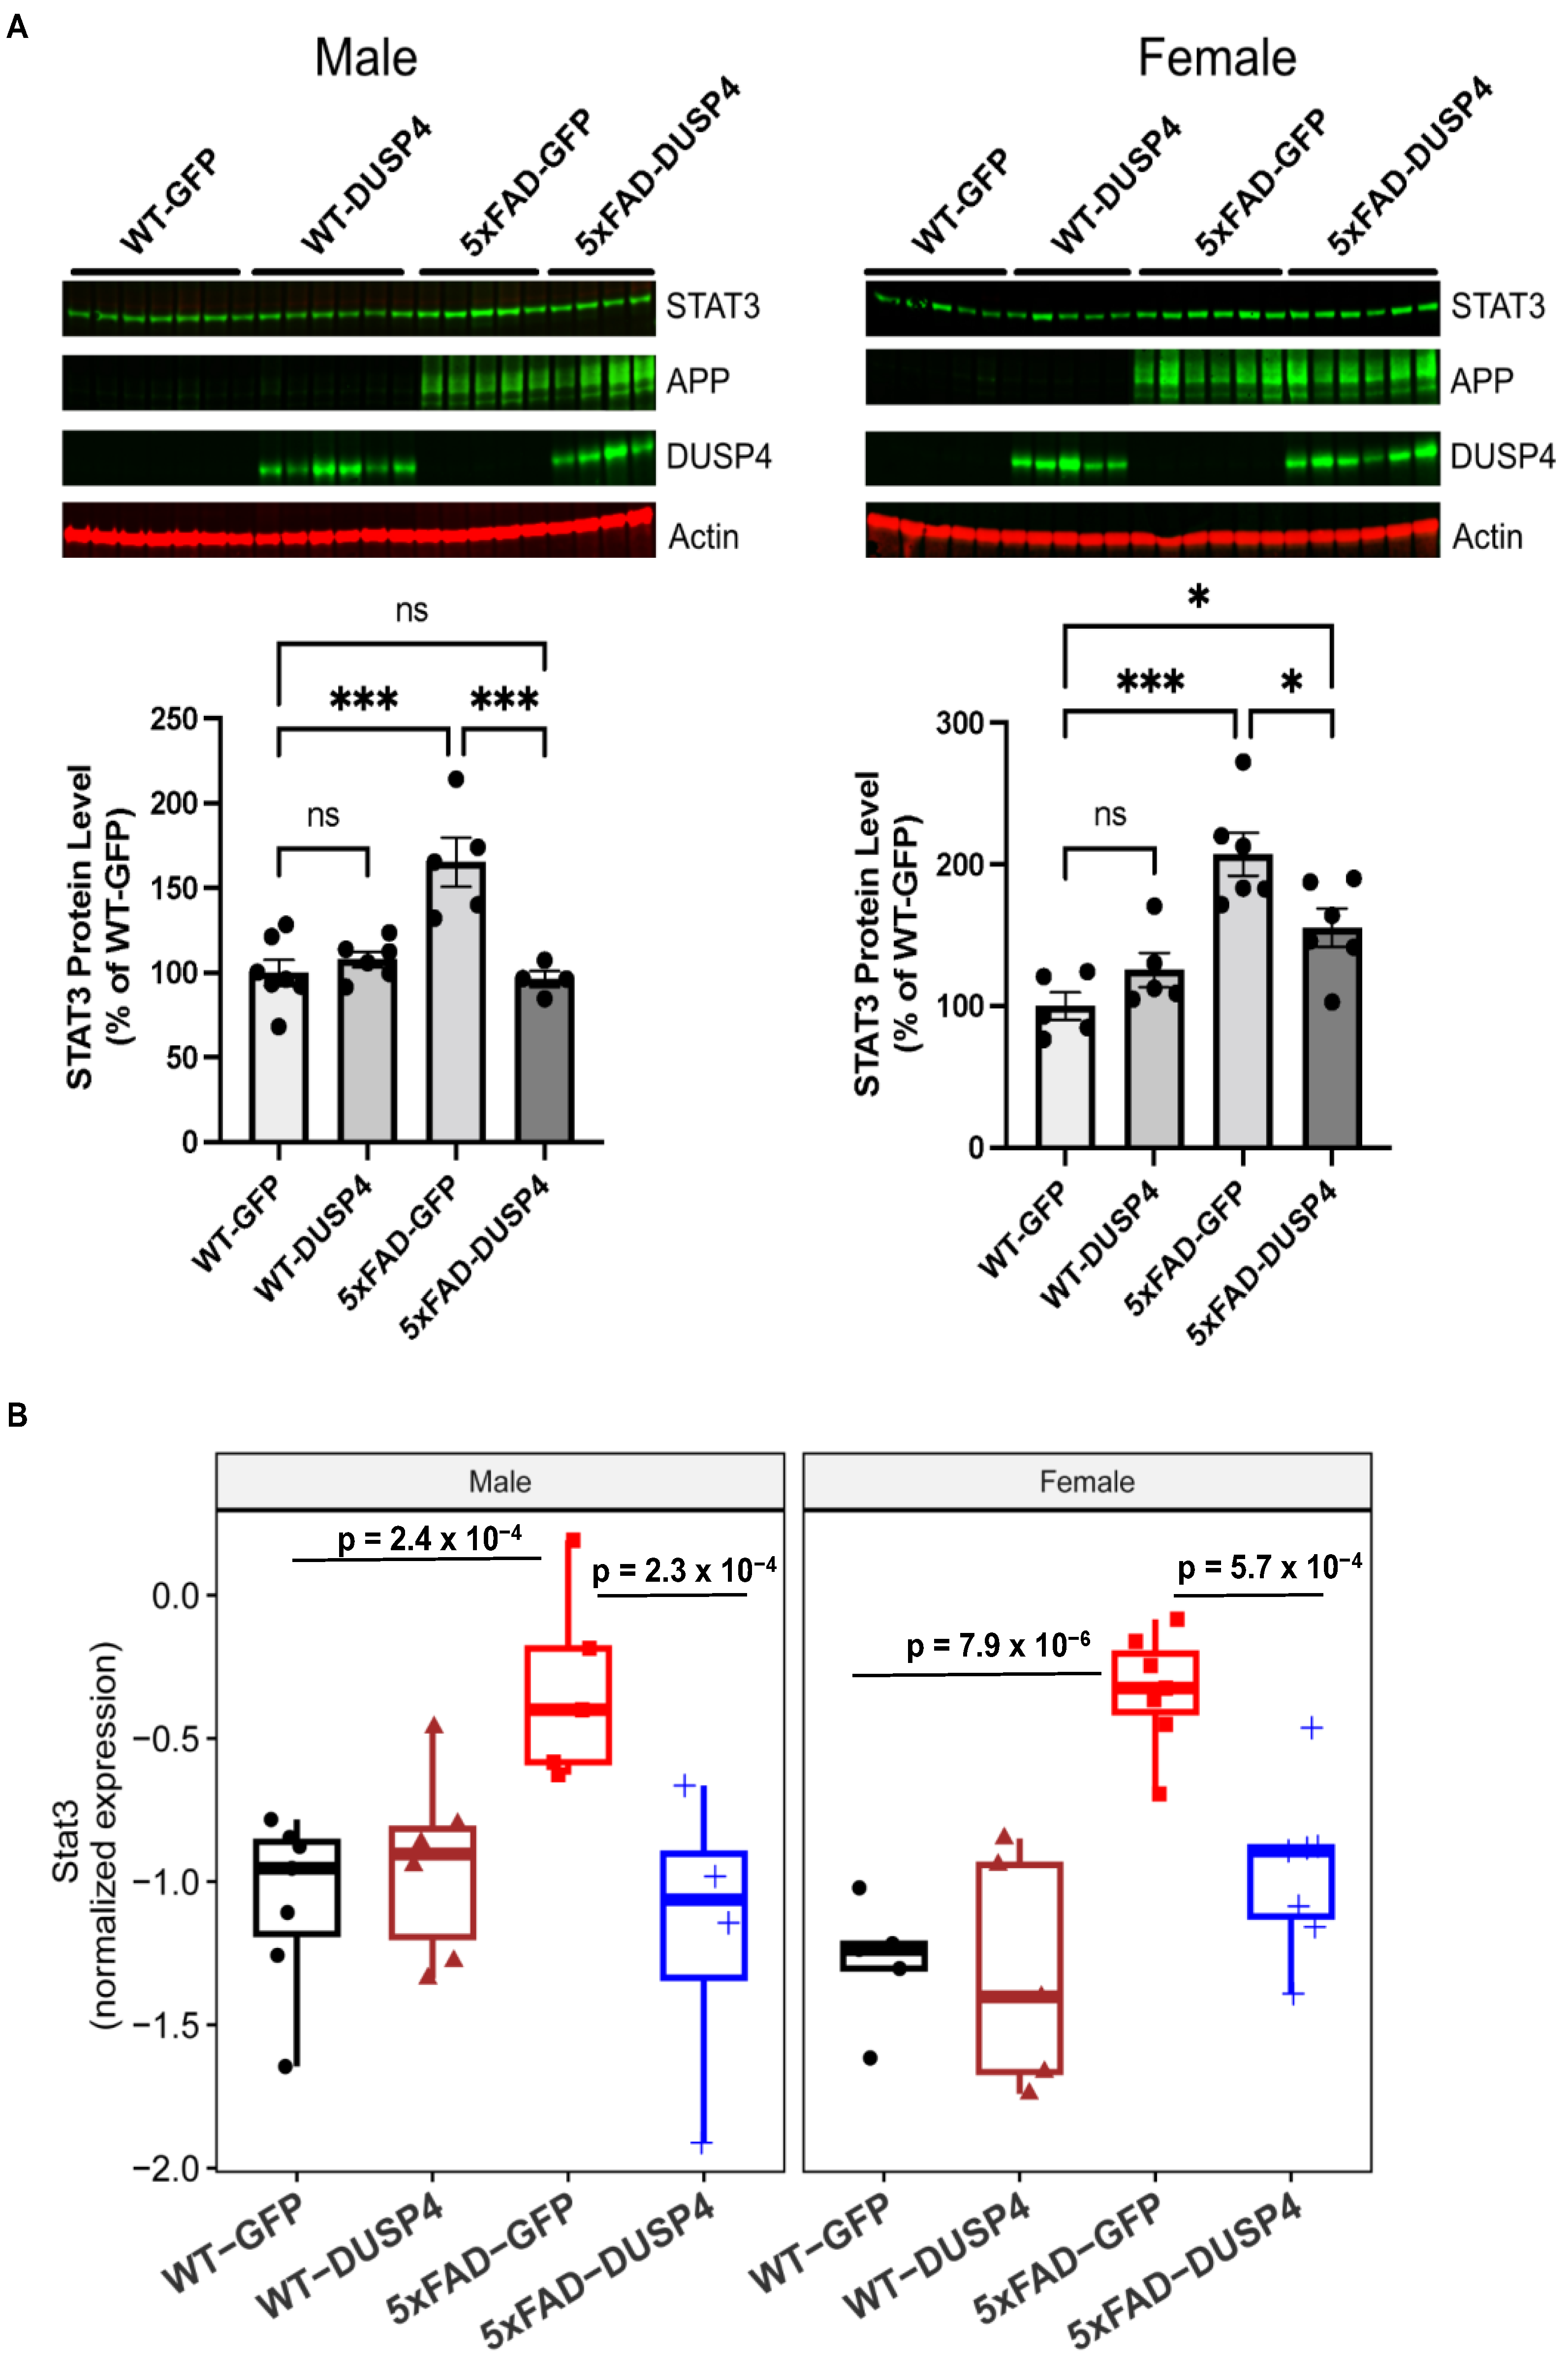
3.3. DUSP4 Overexpression Resulted in Reduction in STAT3 in 5xFAD Mice
Hippocampal STAT3, human APP (hAPP), and DUSP4 protein levels were significantly altered in our proteomics data. Interestingly, STAT3 has been implicated in AD-associated neuroinflammation, and it has been reported that inhibition of STAT3 ameliorates AD-associated neuroinflammation [
52]. In addition, we show that Stat3 is one of the most downregulated DEPTMs and DEGs following DUSP4 overexpression in 5xFAD, utilizing both phosphoproteomics analyses in the current study and transcriptomics analyses in our published study [
22]. Therefore, STAT3 could be a potential mediator by which DUSP4 regulates AD-associated neuroinflammation. We then further validate the changes in these proteins using western blot analyses. The results showed that hippocampal STAT3 protein levels were increased by about 110% in female 5xFAD mice overexpressing GFP (5xFAD-GFP), while male 5xFAD-GFP increased by about 65%, compared to age- and sex-matched wildtype mice overexpressing GFP (WT-GFP) (
Figure 4A). STAT3 protein levels were reduced by about 65% in both female and male 5xFAD overexpressing DUSP4 (5xFAD-DUSP4) compared to age- and sex-matched 5xFAD-GFP (
Figure 4A). Although STAT3 protein levels were significantly reduced in female 5xFAD-DUSP4 compared to female 5xFAD-GFP, levels were significantly higher than female WT-GFP, while Stat3 protein levels in male 5xFAD-DUSP4 showed no significant differences compared to male WT-GFP (
Figure 4A). Strikingly, these results nearly replicated those we obtained from the proteomic analysis (
Figure 4B) regarding Stat3 expression in the different mouse genotypes (
Figure 4B): Stat3 levels were dramatically increased in 5xFAD-GFP compared to WT-GFP, which was restored by DUSP4 overexpression in 5xFAD (
Figure 4B). Furthermore, our western blot analyses confirmed the DUSP4 overexpression in both female and male mice administered with AAV-DUSP4. In addition, western blot analyses detected the hAPP protein only in 5xFAD transgenic mice, which confirmed 5xFAD genotypes. Together, these results validate the proteomics analyses.
3.4. The DUSP4 DEP and DEPTM Signatures Are Enriched in Human AD Protein Networks
We first compared the mouse DEP signatures in the present study with the human DEPs in AD that were derived from the proteomics profiling in the parahippocampal gyrus (PHG) of the MSBB cohort [
38,
41]. We stratified the human subjects over sex and thus obtained the sex-specific DEPs in AD vs. normal healthy individuals (NL) (
Supplementary Data S4, and
Section 2). The mouse DEPs in 5xFADvsWT significantly overlapped the human DEP signatures, with the same directionality in both sexes, though the overlap of male signatures was much less significant (
Figure 5A,B). On the other hand, the DEP signatures in 5xFAD-DUSP4vs5xFAD in the male mice have marginally significant overlap with the human male DEP signatures in the opposite directions (
Supplementary Figure S9A), while the signatures from the female mice do not significantly overlap the respective human signatures (
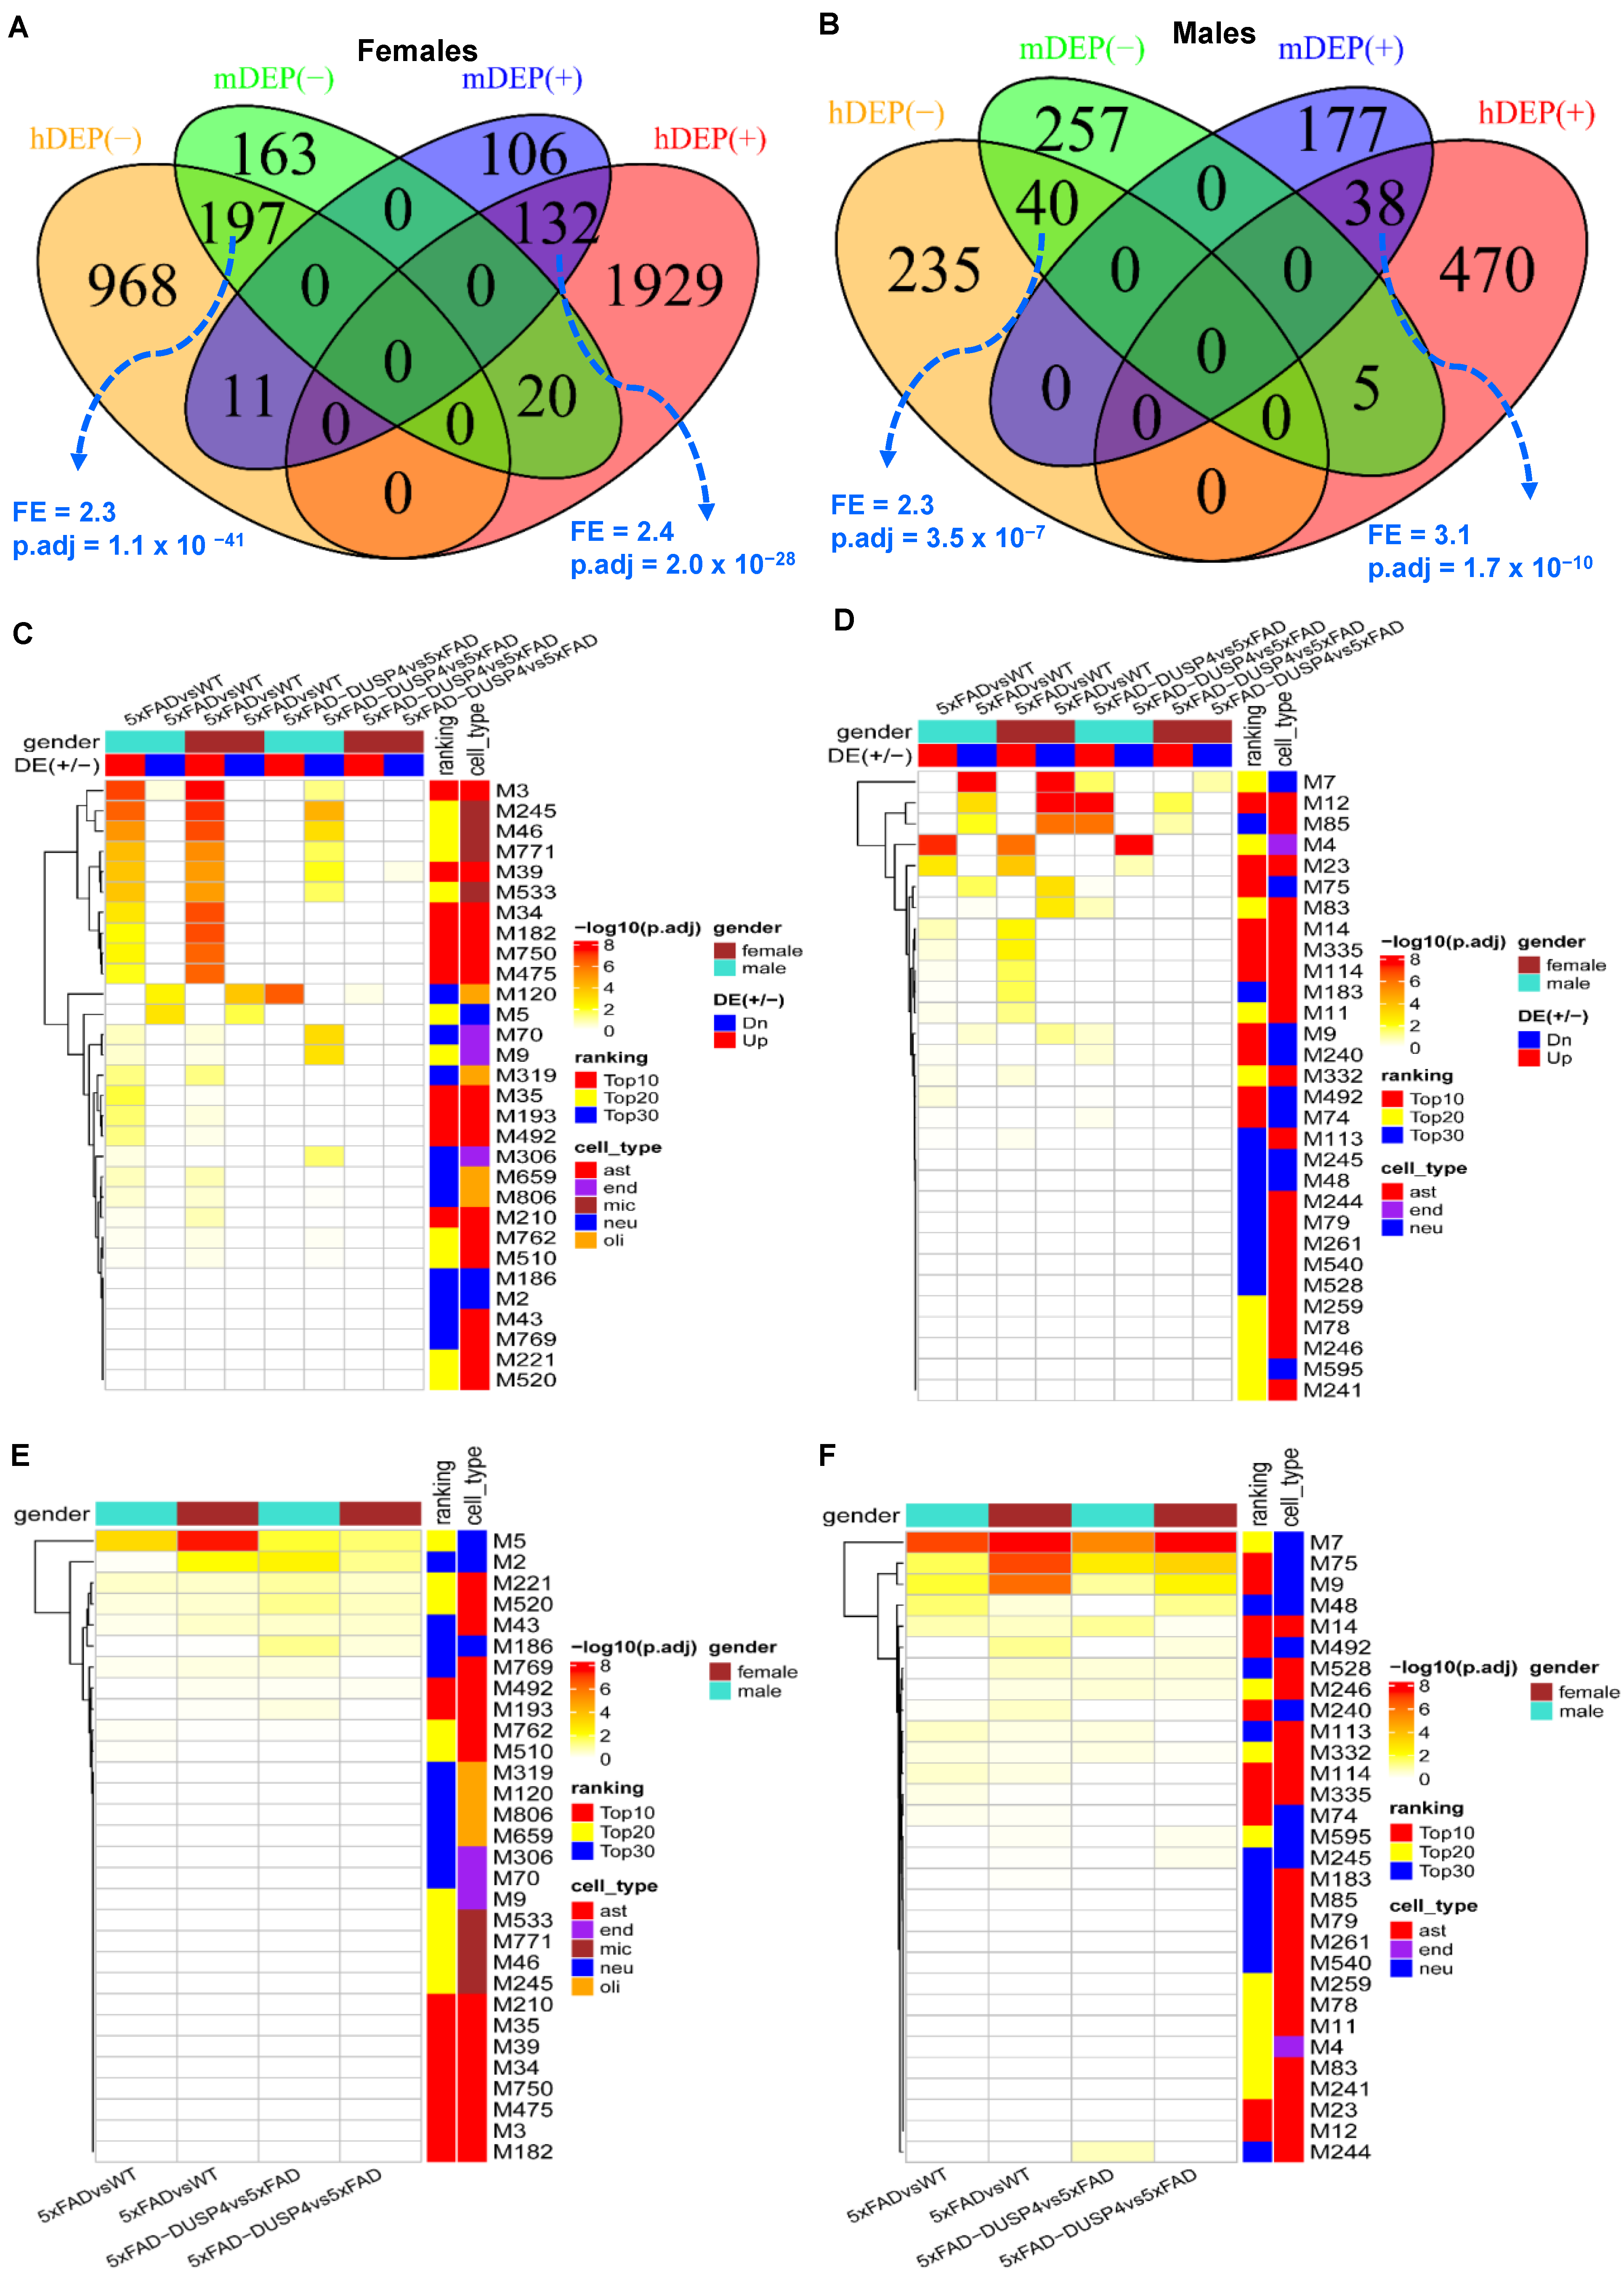
Supplementary Figure S9B). These results validated the mouse DEPs we identified and suggested that our findings from the mouse proteomics might be relevant to human AD neuropathology.
We projected the mouse DEP signatures onto the MEGENA co-expression networks from the human proteomics [
41] to further understand their functional relevance to human AD. In the MSBB protein co-expression network, more than half (>15) of the top 30 AD-associated modules were enriched for the mouse DEPs from 5xFADvsWT of both sexes (
Figure 5C). The up-regulated DEPs in both male and female mice are enriched in the astrocyte (M3) and microglia modules (M245), while the down-regulated DEPs overlap significantly with the neuronal modules (M5) (
Figure 5C). We also observed the enrichment of the DEPs from 5xFAD-DUSP4vs5xFAD in the network, especially the down-regulated DEPs in the male mice (
Figure 5C). Similar results were found in the ROSMAP MEGENA network (
Figure 5D). These results further validated the relevance of the mouse DEPs to human AD and were consistent with the aforementioned cell-type enrichment analysis (
Figure 2E).
Furthermore, the mouse DEPTMs are also enriched in a number of top-ranked AD modules in the MSBB (
Figure 5E) and ROSMAP (
Figure 5F) protein co-expression networks. Importantly, the most enriched modules are neuron-specific (M5 and M2 in the MSBB cohort,
Figure 5E; M7 and M75 in the ROSMAP cohort,
Figure 5F). These results are consistent with the previous pathway enrichment analysis (
Figure 3E,F) and indicate that the DEPTMs are often involved in neuronal and synaptic functions.
Figure 5.
Integration of the DEPs and DEPTMs in mice with the human co-expression networks. (A) Venn diagram revealing the overlap between female mouse DEPs in 5xFADvsWT and human female-specific DEPs in AD vs. NL (The DEPs identified in human females). (B) Venn diagram showing the overlap between male mice DEPs in 5xFADvsWT and human male-specific DEPs in AD vs. NL (the DEPs identified in human males). In (A,B), mDEP(+) and mDEP(−) denote up- and down-regulated DEPs in mice, respectively, whereas hDEP(+) and hDEP(−) denote up- and down-regulated DEPs in humans, respectively. (C,D) Heatmaps highlighting the enrichment of the mouse DEP signatures over human proteomics MEGENA co-expression networks for the MSBB (C) and ROSMAP (D) cohorts, respectively. (E,F) Heatmaps highlighting the enrichment of the mouse DEPTMs over human proteomics MEGENA co-expression networks for the MSBB (E) and ROSMAP (F) cohorts, respectively. DE(+/−)denotes up- or down-regulated DEPs, respectively. Ranking denotes the categories of the module ranking order in relevance to AD: Top10, Top20, and Top30 represent top-ranked 10, 20, and 30 AD modules, respectively. Cell type is the cell type that is the most enriched in each module. ast, astrocytes; neu, neurons; endo, endothelial cells; mic, microglia; olig, oligodendrocytes. Because a protein may have more than one DEPTM site, we collapsed the DEPTMs to their respective protein levels; that is, a protein represents all the DEPTMs that belong to it. Each field in the heatmap represents the intersection between a DEP or DEPTM signature over a module (clusters of genes) in the network. Only the top 30 AD associated modules are shown.
![Biomolecules 14 00066 g005]()
3.5. DUSP4 Protein-Centered Networks Are Sex-Specific
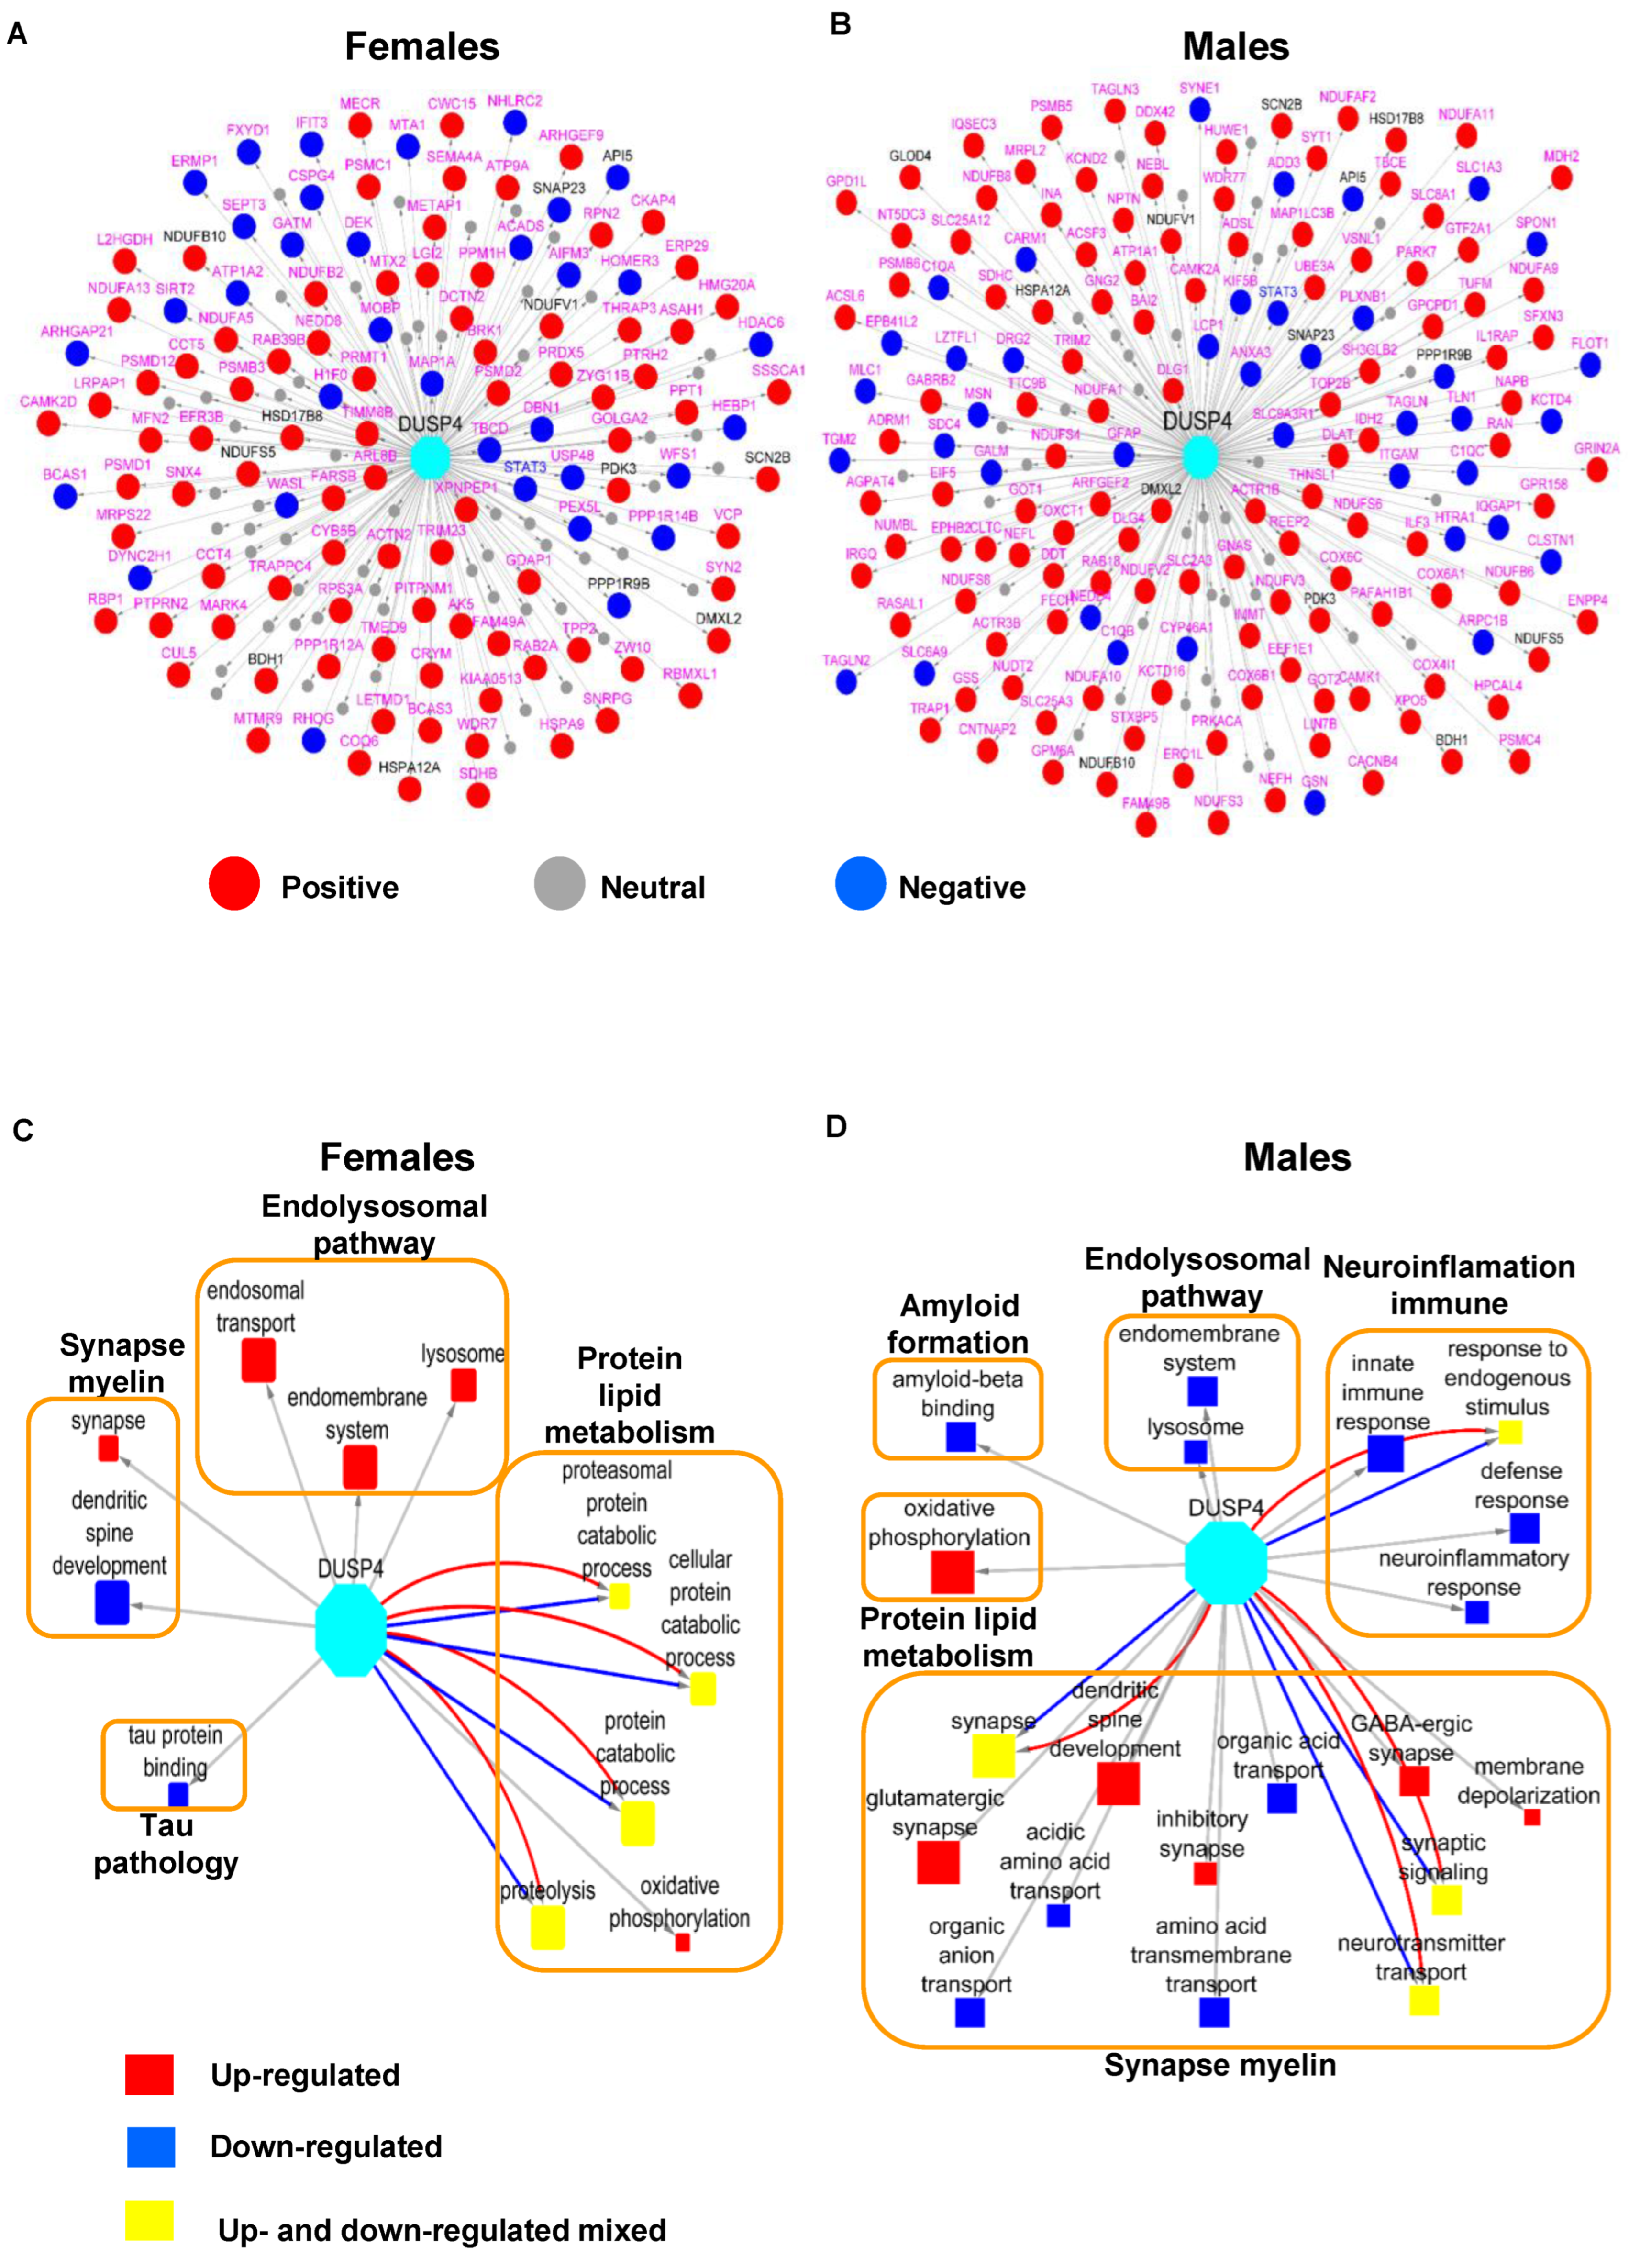
To formally identify the genes that are co-regulated with DUSP4 in AD, we leveraged a number of human AD cohorts as previously described [
43] by examining the genes with significant correlations with DUSP4. We intersected the mouse DEP signatures in 5xFAD-DUSP4vs5xFAD with the human DUSP4-associated genes and further constructed DUSP4 protein-centric networks for each sex (
Figure 6A,B). There are more proteins positively correlated with the DUSP4 protein/gene than those negatively correlated with the DUSP4 protein/gene (
Figure 6A,B). Impressively, the majority of the DUSP4-associated proteins are specifically expressed in either females (
Figure 6A) or males (
Figure 6B). Based on the sex-specific DUSP4-centric networks, we constructed the sex-specific DUSP4 signal maps (
Figure 6C,D). As shown in
Figure 6C, in females, DUSP4 is often involved in protein and lipid metabolism, in contrast to its involvement in synapse and myelin functions in males (
Figure 6D). DUSP4 participates in endolysosomal pathways in both male and female mice but in the opposite directions (
Figure 6C,D). In summary, the results demonstrate that DUSP4 plays important roles in AD pathogenesis by regulating biological processes and functions shared by two sexes or distinct in each sex.
4. Discussion
In the present study, we investigated the proteins and phosphorylation sites that are modulated in 5xFAD mice and examined the sex-specific impacts of DUSP4 overexpression on the 5xFAD proteome/phosphoproteome. In 5xFAD mice, a substantial number of proteins were up- or down-regulated in both male and female mice, and they were involved in AD-related biological processes, such as activated immune response (up-regulated in microglia and astrocytes) or suppressed synaptic activities (down-regulated in neurons). Upon DUSP4 overexpression, those dysregulated proteins and pathways (for example, immune response and defense response) were rescued. For the phosphoproteome, we detected an array of phosphorylation sites that are associated with 5xFAD and DUSP4 overexpression in each sex. However, the 5xFAD- and DUSP4-associated phosphorylation changes were in the opposite directions. Strikingly, both 5xFAD- and DUSP4-associated phosphorylation changes occurred mainly in neurons, which were predicted to regulate neuronal processes and synaptic function. Site-centric pathway analysis revealed that both the 5xFAD- and DUSP4-phosphorylation sites were enriched for a number of kinases in females but only a limited number of kinases in male mice. Our study represents, to our knowledge, the first examination of the proteome and phosphoproteome that is modulated by DUSP4 and the determination of the significance of such modulation in AD.
DUSP4 is a mitogen-activated protein kinase (MAPK) pathway regulator, which regulates a wide variety of cellular signaling pathways, including stress responses, differentiation, and apoptosis [
53]. Intriguingly, transcriptomic profiling of hippocampal RNAs in patients with Alzheimer’s disease (AD) showed a downregulation of DUSP4 [
54], suggesting a potential role for DUSP4 in AD-associated pathogenesis. Our previous study in the 5xFAD AD animal model indicated that hippocampal DUSP4 overexpression rescued spatial memory deficits in female 5xFAD mice but not in male 5xFAD mice [
22]. In addition, transcriptomic profiling of 5xFAD mice overexpressing DUSP4 showed that differentially expressed genes (DEGs, false discovery rate (FDR) < 0.05), including Stat1, Stat2, and Ccl2 were downregulated in female 5xFAD-DUSP4 mice, while no DEGs (FDR < 0.05) were detected in male 5xFAD overexpressing DUSP4. Furthermore, enrichment analysis of DEGs predicted that neuroinflammatory, interferon, and extracellular signal-regulated kinase (ERK)/MAPK signaling pathways were regulated in female 5xFAD overexpressing DUSP4 [
22]. While these transcriptomic data suggested a role for DUSP4 in AD-associated neuroinflammation, it is not clear how DUSP4 downregulated neuroinflammatory pathways. Consistent with our transcriptomic profiling of groups of mice with the same genotypes and AAV treatments, in the present study, we observed up-regulated STAT1 protein in 5xFAD, which was reported in human AD [
55], whereas DUPS4 overexpression in 5xFAD female mice down-regulated STAT1 protein expression (
Supplementary Data S2). Similar results were found in male mice, although the changes were not robust by comparison in terms of
p-values. STAT2 and CCL2 were not profiled in the present study because of either low abundance at the protein expression level or large variation in expression among the samples, which caused their exclusion from further analysis. Overall, we observed significant overlaps between the 5xFAD- and DUSP4-associated signatures of both protein and phosphoprotein in female and male mice (
Figure 2D and
Figure 3C;
Supplementary Figures S3B and S7A), but in the opposite directions, indicating that DUSP4 overexpression may reduce AD-related deficits by reversing the dysregulated genes/proteins in 5xFAD in comparison with WT in a sex-specific manner. Furthermore, there exist significant differences in the sex-specific DUSP4-centric networks and signal maps (
Figure 6). Taken together, our results that demonstrate sex-specific differences in the response of the 5xFAD proteome and phosphoproteomce to DUSP4 overexpression further support previous observations that DUSP4 overexpression reduces amyloidopathy in both sexes but learning deficits only in female 5xFAD mice [
22].
Microglia-associated neuroinflammation is characteristic of AD-associated pathology and was reported to be regulated by the ERK/MAPK signaling pathway [
51]. Quantitative proteomics analyses showed that ERK1 and ERK2 were up-regulated in postmortem AD human brains, and phosphorylated ERK was also increased in isolated microglia from 5xFAD mice [
51]. In addition, proteomics analyses of the hippocampus in 5xFAD mice have revealed several pro-inflammatory markers, including STAT3 [
49], which can promote microglia-dependent neuroinflammation. For example, it was previously shown that deletion of microglial STAT3 in mice prevented microglia-dependent neuroinflammation [
56]. The ERK/MAPK signaling pathway is a critical regulator of pro-inflammatory microglial activation, and microglial activation has been suggested as a contributor to the progression of AD [
57]. In the present study, we found that DUSP4 overexpression in 5xFAD mice caused a reduction in STAT3 protein levels in both sexes (
Figure 4 and
Supplementary Data S2). We subsequently queried the protein and protein interaction (PPI) network [
58] in AD and obtained a STAT3 subnetwork (
Supplementary Figure S10). Impressively, the STAT3-subnetwork is enriched for a number of pathways critical to AD, such as amyloid formation, tau pathology, neuroinflammation, and synapse and myelin functions (
Supplementary Figure S10). Thus, it is speculated that STAT3 is the connection point through which DUSP4 exerts its effects on AD, which might be one of the mechanisms underlying DUSP4 functionality that is shared in male and female mice.
In the present study, we used the nominal
p < 0.05 as the cut-off in order to maximize inclusion of proteins/phosphoproteins that are regulated by DUSP4 overexpression. First, we carefully followed the standard experimental protocols and data processing pipelines (see
Section 2). As an example, we performed principal component analysis (PCA) on the protein and phosphoprotein expression data (
Supplementary Figure S11), which was encouraging as it indicates that, in general, mouse samples can be grouped together concordant to their genotypes. Then, we inspected and validated some of the proteins that were known to be regulated by 5xFAD. For example, we observed the up-regulation of the APP [
22,
49], APOE [
49], and STAT3 [
49,
52] proteins in the 5xFAD mice of either sex, which is not only consistent with previously reported studies but was further confirmed by our experimental validation (
Figure 4) and the integration analysis with the human proteomics profiling (
Figure 5). For DEPTMs, we observed that the phosphorylation site (APP;S441) in the APP protein was significantly up-regulated in both male and female 5xFAD mice (
Figure 3A;
Supplementary Data S3A,B). APP serine 441 has been inferred to be phosphorylated by a combination of experimental and computational evidence [
59] (The mouse App entry P12023, UniProtKB at
https://www.uniprot.org/). Strikingly, DUSP4 overexpression resulted in a decreased level of phosphorylation at this site (APP;S441) in 5xFAD mice of either sex (
Supplementary Data 3C,D). S441 is found within the E2 dimerization domain of APP (aa374-565) (The mouse App entry P12023, UniProtKB at
https://www.uniprot.org/). Whether S441 phosphorylation modulates antiparallel App dimer formation, heparin binding, and/or binding with other App interactors is to our knowledge unknown, although protein phosphorylation has been reported to modulate APP interactions [
60] and to occur in the APP ectodomain [
61]. Similarly, we also observed 26 PTMs in the tau protein (Mapt gene), some of which displayed significant association with 5xFAD or DUSP4 (
Supplementary information; Supplementary Figure S12). As an additional line of evidence, in female 5xFAD mice, we observed high consistency between the DEPs from the present study and the DEGs from our previous work [
22] (
Supplementary Figure S13, Supplementary results and discussion). These results and evidence together support this cut-off (nominal
p < 0.05) as an effective criterion in determining the protein/phosphoprotein signatures regulated by DUSP4, albeit we cannot rule out any exceptions due to false discovery.
In the present study, we investigated the sex-specific impact of DUSP4 overexpression on proteome and phosphoproteome in 5xFAD mice. To determine whether such sex-specific molecular responses to DUSP4 overexpression were due to the sex difference in DUSP4 protein expression, we performed differential protein expression analysis of DUSP4 in male vs. female mice with overexpression of DUSP4. However, there was no significant difference in DUSP4 expression between male and female mice (
p = 0.59,
Supplementary Figure S15). Therefore, our data does not support the hypothesis that our observed sex-specific molecular changes were due to the differential expression of DUSP4 between male and female mice.


 ,
, 


