Article

Reelin Regulates Developmental Desynchronization Transition of Neocortical Network Activity

1
Department of Anatomy, College of Medicine and Health Sciences, United Arab Emirates University, Al Ain 17666, United Arab Emirates
2
Department of Neuroanatomy and Molecular Brain Research, Medical Faculty, Ruhr University Bochum, 44801 Bochum, Germany
3
Department of Genetics and Genomics, College of Medicine and Health Sciences, United Arab Emirates University, Al Ain 17666, United Arab Emirates
4
Departments of Molecular Genetics, Neuroscience, Neurology and Neurotherapeutics, Center for Translational Neurodegeneration Research, University of Texas Southwestern Medical Center, Dallas, TX 5323, USA
*
Author to whom correspondence should be addressed.
Biomolecules 2024, 14(5), 593; https://doi.org/10.3390/biom14050593
Submission received: 12 March 2024 / Revised: 29 April 2024 / Accepted: 2 May 2024 / Published: 17 May 2024
(This article belongs to the Section Biological Factors)

Abstract

:
During the first and second stages of postnatal development, neocortical neurons exhibit a wide range of spontaneous synchronous activity (SSA). Towards the end of the second postnatal week, the SSA is replaced by a more sparse and desynchronized firing pattern. The developmental desynchronization of neocortical spontaneous neuronal activity is thought to be intrinsically generated, since sensory deprivation from the periphery does not affect the time course of this transition. The extracellular protein reelin controls various aspects of neuronal development through multimodular signaling. However, so far it is unclear whether reelin contributes to the developmental desynchronization transition of neocortical neurons. The present study aims to investigate the role of reelin in postnatal cortical developmental desynchronization using a conditional reelin knockout (RelncKO) mouse model. Conditional reelin deficiency was induced during early postnatal development, and Ca2+ recordings were conducted from organotypic cultures (OTCs) of the somatosensory cortex. Our results show that both wild type (wt) and RelncKO exhibited an SSA pattern during the early postnatal week. However, at the end of the second postnatal week, wt OTCs underwent a transition to a desynchronized network activity pattern, while RelncKO activity remained synchronous. This changing activity pattern suggests that reelin is involved in regulating the developmental desynchronization of cortical neuronal network activity. Moreover, the developmental desynchronization impairment observed in RelncKO was rescued when RelncKO OTCs were co-cultured with wt OTCs. Finally, we show that the developmental transition to a desynchronized state at the end of the second postnatal week is not dependent on glutamatergic signaling. Instead, the transition is dependent on GABAAR and GABABR signaling. The results suggest that reelin controls developmental desynchronization through GABAAR and GABABR signaling.

1. Introduction

During early neocortical development, neurons exhibit a high SSA pattern which manifests as synchronized oscillations in intracellular Ca2+ concentration [1]. These spontaneous Ca2+ waves usually start in the posterior cortex, propagate slowly towards its anterior end [2], and include multiple areas within the central nervous system such as the retina, spinal cord, hindbrain, hippocampus, and neocortex [3]. Moreover, it has been observed in a variety of species [4]. Moreover, neocortical SSA strongly depends on AMPA and NMDA receptor activation and is modulated by cholinergic activity in the first postnatal week [2,5,6]. In the absence of sensory stimuli, cortical networks exhibit complex, self-organized activity patterns [7,8,9]. Extracellular multielectrode recordings were used to observe three distinct patterns of synchronized oscillatory activity in the rat somatosensory cortex in vivo at postnatal day (P) 0 to 7. Among these, the spindle bursts, which are short bursts of 10 Hz oscillations, were found to be the dominant activity pattern in S1 [10], confirming previous findings [11,12]. In vivo, the intact somatosensory cortex of newborn rats is spatially confined to spindle bursts, which represent the first and only organized network pattern. These spindles are selectively triggered in a somatotopic manner by spontaneous muscle twitches, which are motor patterns analogous to human fetal movements [11]. Early neuronal activity also controls the rate of programmed cell death in the developing barrel cortex, suggesting that spindle bursts are physiological activity patterns particularly suited to suppressing apoptosis [13]. Moreover, the SSA is a hallmark of neuronal circuits during early development [14]. For instance, neurons in the developing auditory system exhibit spontaneous bursts of activity before hearing onset. When glutamate release from hair cells is blocked, the changes in peripheral excitability maintain patterned neural activity in the brain [15]. This early form of activity is typically discontinuous and interrupted by silent periods, as reported in studies on humans [16], in the rat visual system [17], and in the visual cortex of preterm human infants as well as neonatal rats [18]. During the initial days of postnatal development, the SSA relies on gap junctions for its functioning [12,19], whereas it helps in spreading this wave-like activity in the second postnatal week [9].
At the end of the second postnatal week, neocortical networks undergo a transition to a desynchronized sparse state that lacks a clear spatial structure [7]. This has also been confirmed in studies with mice in vivo at P13 [20], in rats between P25 and 36 [21], in rats between P21 and 30 [22], and in mice at P14 [23]. The transition to a desynchronized sparse state has been suggested to be a mechanism that allows for increased storage capacity in associative memories while saving energy at the same time [24]. Additionally, there has been controversy regarding whether the developmental desynchronization transition depends on synaptic input. For instance, the deprivation of sensory input from the periphery had no effect on the time course of the developmental transition in the neocortex [7]. On the other hand, in the absence of coincident synaptic input in the cerebellum, Golgi cells synchronize their firing. In turn, with coincident mossy fiber input in the cerebellum, a desynchronization transition is triggered [25].
During early development, GABA has been suggested to play a role in controlling neuronal differentiation, synaptogenesis, and synaptic plasticity through its excitatory effects [1,26]. The role of GABA in regulating SSA in the hippocampus and neocortex during early development has been extensively investigated over the past two decades [27]. In the early postnatal week of hippocampal development, the SSA of living mice is characterized by sharp waves named giant depolarizing potentials (GDPs) [28], which depend on excitatory GABA [29,30]. The release of GABA in early postnatal neocortical development induces Ca2+ influx; however, it diminishes neuronal firing [31,32]. This suggests that although GABA is depolarizing, it predominantly inhibits network activity through shunting. In comparison to the hippocampal GDPs, GABA is not involved in neocortical SSA in the first postnatal developmental week, as confirmed by other studies [31,33,34,35]. It is important to note that the developmental shift from GABA excitation to inhibition occurs simultaneously with the shift towards network desynchronization at the end of the second postnatal week. This suggests that inhibitory GABA action is necessary for the network desynchronization shift.
Reelin is an extracellular protein which is involved in mammalian brain development and function. It controls neuronal migration and layer formation in the developing cerebral cortex, as evidenced by morphological studies on reeler mutant mice that lack reelin expression [36,37]. Reelin also modulates synaptic plasticity in the adult brain [38,39]. It has been shown that in the absence of reelin, experience-dependent plasticity in the visual cortex into adulthood was prolonged [40]. The confirmation of the contribution of reelin signaling to the genetic and behavioral expression of learning and memory has been documented [41,42]. Moreover, an epigenomic analysis has revealed that the binding of reelin to its receptor results in the expression of certain immediate early genes involved in synaptic plasticity [43]. Reelin signaling, mediated via the cell membrane located reelin receptors ApoER2 and VLDLR, guides the radial migration of newborn neurons and orchestrates the development of cortical layers [44,45,46]. In the developing and adult brain, the majority of GABAergic interneurons in the neocortex expresses reelin. Additionally, reelin exerts opposing effects on dendritic growth depending on the developmental stage. During the embryonic developmental stage, it enhances dendritic growth [47,48,49,50], whereas it limits dendritic growth during postnatal development [50,51,52,53]. Adult conditionally induced RelncKO mice exhibited altered hippocampal LTP and a subtle behavioral phenotype. However, their cortical architecture was indistinguishable from that of their wild-type littermates [54]. The question of whether reelin deficiency affects the early cortical network transition from synchronized to a desynchronized state remains to be answered. To address this question, we examined how conditionally induced reelin deficiency after birth affects developmental network desynchronization in the somatosensory neocortex of RelncKO mice. We focused on the potential interaction between reelin signaling and GABABR function in regulating the developmental desynchronization transition, as synaptic release is primarily controlled by GABABRs that mediate inhibitory GABA effects at the end of the second postnatal week.

2. Material and Methods

2.1. Reelin Conditional Knockout Mice (RelncKO)

The mice were kept in a standard 12 h light cycle and provided with standard mouse chow ad libitum. The care and use of experimental animals were in compliance with the Federal German law and ARRIVE guidelines, with permission Nr. 84-02.04.2016.A383. The conditional RelncKO line was generated as previously described [54]. Conditional reelin knockout mice (Relnflox/flox CAG-CreERT2 mice) were obtained by crossing Relnflox/flox mice with hemizygous tamoxifen-inducible Cre-recombinase-expressing mice (CAGCreERT2) [55]. For the experiments, we selected only male mice with Relnflox/flox CAGCreERT2 and crossed them with female mice with Relnflox/flox to generate Relnflox/flox wildtype (wt) and Relnflox/flox CAGCreERT2 (RelncKO) siblings, as verified by PCR. This study was not pre-registered, and no exclusion criteria were pre-determined, making it an exploratory study. We did not perform blinding or randomization to allocate subjects in the study, and no sample size calculation was performed.

2.2. PCR and Genotyping

DNA was isolated from ear, tail, and brain tissue samples using a ReliaPrep gDNA kit (Cat# A205, Promega, Mannheim, Germany). The isolated DNA amounts were determined by spectrophotometry using the Genova Nano system (Jenway). PCR reactions were performed in a 50 μL reaction mixture containing 200 ng of template DNA, Soriano buffer (0.67 M Tris, 0.16 M ammonium sulfate, 67 mM MgCl2, 67 µM EDTA, and 50 mM β-Mercaptoethanol), Taq polymerase, 2 µL DMSO, and 10 mM dNTPs. The following primers were used for genotyping wildtype mice: forward primer 5′-ATAAACTGGTGCTTATGTGACAGG-3′, reverse primer 5′-AGACAATGCTAACAACAGCAAGC-3′ (450 bp); for Relnflox/flox mice: forward primer 5′-GCTCTGGCCAAGCTTTATC-3′, reverse primer 5′- CGCGATCGATAACTTCGTATAGCATAC-3′ (1200 bp); and for the detection of CAG-CreERT2: forward primer 5′-ATTGCTGTCACTTGGTCGTGG-3′, reverse primer 5′-GGAAAATGCTTCTGTCCGTTTGC-3′ (200 bp). The PCR amplification products were verified on a 2% agarose gel in TBE buffer.

2.3. Organotypic Cultures and Pharmacological Treatment

OTCs were prepared from newborn mice on postnatal day 0 (P0). All solutions used for OTC preparation were sterile. OTC preparation was performed in a laminar airflow bench with horizontal counterflow (Horizontal Flow, ICN, Biomedicals, Eschwege; Germany). Mice were briefly anesthetized with hypothermia and decapitated. The skull was gently removed, and the cortex was placed on a chopper plate (McIllwain, Bad Schwalbach, Germany). The somatosensory cortex was cut into 350 μm thick slices, and the slices were gently transferred into ice-cold buffered salt solution (GBSS, Cat# 24020117, Gibco, Eggenstein, Germany) containing 25 mM D-glucose. After recovery for 30 min, the sections were transferred to coverslips (12 × 24 mm, Kindler). A mixture of chicken plasma (Sigma) and GBBS/thrombin (Merck) was mixed in a ratio of 2:1 and allowed to clot for 45 min. The coverslip was transferred to a roller tube (Nunc) filled with 750 μL of semi-artificial medium and placed in a roller incubator at 37 °C. For knockout induction, OTCs after preparation were stimulated with 1 µM (Z)-4-hydroxytamoxifen (4-OHT) (Cat# 3412, Tocris, Wiesbaden, Germany) at 2 days in vitro (2 DIV) for 5 consecutive days and maintained for experiments until 14 DIV. A graphical flow chart of the OTC experimental procedures is shown in Figure 1A. The following drugs were used for Ca2+ imaging experiments: Gabazin (10 µM, Cat# 0130, Tocris, Wiesbaden, Germany), CGP35348 (10 µM, Cat# 1245/10, Tocris, Wiesbaden, Germany), CNQX (10 µM, Cat# 0190/10, Tocris, Wiesbaden, Germany), APV (50 µM, 0190/10, Tocris), recombinant mouse LRPAP protein (LDL receptor-related protein-associated protein 1 (also called RAP), 50 ng/mL, Cat# 4480-LR, R&D Systems).

2.4. Ca2+ Imaging Using Spinning Disc Laser Microscopy

Ca2+ imaging was performed with the Ca2+ indicator Oregon Green 488 BAPTA-1 AM (OGB-1 AM, Cat# O6807, Molecular Probes, Eugene, OR, USA) for OTC loading at DIV14, as we described previously [56,57]. Briefly, a solution of 20% PF127 (Cat# P2443, Sigma, Steinheim, Germany) dissolved in DMSO (w/v) (J.T. Baker) was prepared to dissolve OGB-1 (1 µM). After loading, the sections were washed several times to remove excess dye and allowed to recover for one hour. The slices were transferred to the recording chamber mounted on the fixed stage of an inverted microscope and perfused with 95% O2, 5% CO2 bubbled artificial cerebrospinal fluid (ACSF; 3–5 mL/min) at 32 ± 2 °C. The composition of the ACSF was as follows: 125 mM NaCl, 5 mM KCl, 2 mM CaCl2, 1 mM MgSO4, 25 mM NaHCO3, 1.25 mM NaH2PO4, 25 mM glucose, pH 7.4. Osmolality was 295 ± 5 mOsm, as determined by a cryoscopic osmometer (Osmomat 030, Gonotec, Berlin, Germany). Fluorometric Ca2+ recordings were performed with a Visiscope spinning-disc confocal system CSU-W1 (Visitron, Munich, Germany) consisting of a CSU-W1-T2 spinning disc unit and an sCMOS digital camera (4.2 Mpixel rolling shutter version) on an inverted Nikon Ti-E motorized microscope using a CFI P-Fluor 20× objective (NA 0.5, WD = 2.10 mm). Images were acquired at 3 frames per second with an exposure time of 330 ms using VisiView image acquisition software (Visitron, Munich, Germany). The Ca2+ dye OGB-1 was excited at 488 nm. The emitted fluorescence was collected through an ET 525/50 filter.

2.5. Analysis of Imaging Data

From each animal, we imaged 3–4 OTCs from the somatosensory cortex. In each OTC, 3 areas of interest (AOIs) were recorded. Fluorometric data are expressed as ΔF/F0 (background-corrected fluorescence increase divided by resting fluorescence). Raw data, provided as an 8-bit linear intensity scale, were plotted as fluorescence intensity versus time. After background correction, the cell soma was selected as a region of interest (ROI). Baseline fluorescence (F0) was calculated as the average of 20 frames in a time window without neuronal activity (judged by visual inspection). Data were then normalized to mean fluorescence intensities [ΔF/F0 = (F − F0)/F0] to allow comparison of data across experiments. Recorded neurons with ΔF/F0 ≥ 10% were considered active and included in the analyses. The result was manually inspected and corrected as necessary. Fractions of synchronized neurons were calculated as follows: the number of neurons exhibiting a simultaneous Ca2+ event, having ΔF/F0 ≥ 10%, and participating in at least 40% of the network events during the trace was divided by the total number of active neurons. Similarly, the fractions of desynchronized neurons were calculated as follows: the remaining neurons that exhibited a Ca2+ event and had ΔF/F0 ≥ 10% but did not participate in any of the synchronous network events during the trace were divided by the total number of active neurons. Neurons with ΔF/F0 < 10% were considered silent.

2.6. Statistical Analysis

The statistical analyses were performed using Sigma Stat 12 (SPSS Incorporated). For comparisons between two groups, Student’s unpaired t-test was used when the normality test (Shapiro–Wilk) passed; otherwise, the Mann–Whitney test was used. For comparisons between more than two groups, one-way ANOVA was used, followed by a Holm–Sidak multiple comparison test for post hoc analysis if the normality test was passed. If normality assumptions were not met, we conducted a one-way ANOVA on ranks, followed by Tukey’s multiple comparison test for post hoc analysis, which was used to identify significant groups. Statistical significance was set at p < 0.001.

3. Results

3.1. Developmental Desynchronization of Cortical Network Activity in the Somatosensory Cortex

Eliminating reelin during embryonic development affects cortical layer lamination [58]. However, after birth, when neurons have already migrated and settled into their proper layers, elimination of reelin does not affect cortical lamination. In a previous study, we found that conditional elimination of reelin after birth did not alter the distribution of layer-specific expression markers in the neocortex, thus preserving cortical layers [59]. To bypass the cortical layer malformations present in the reeler mutant, 4-OHT was added to the culture medium of OTCs from 2 DIV for 4 consecutive days to induce reelin deficiency. To investigate developmental network desynchronization in the mouse somatosensory cortex, we recorded Ca2+ activity in spontaneously active OTC at different developmental time windows: 5, 10, and 14 DIV (Figure 1). Imaging large networks of neuronal populations loaded with the calcium indicator OGB-1 using a spinning-disk confocal microscope equipped with fast cameras, can be used to image thousands of neurons simultaneously without significant photobleaching, with good signal-to-noise ratio, and minimal cellular damage [56,60]. This technique does not require electrodes penetrating the tissue, minimizing cellular damage. Ca2+ recording of OTCs loaded with the calcium indicator OGB-1 showed a synchronous neuronal activity pattern in the wt OTC at 5 DIV (Figure 1B–D). Around 80% of cortical neurons displayed synchronous neuronal activity at that stage, 5% of the neurons showed desynchronized activity, and the remaining 15% were silent. At 10 DIV, there was an increase in the percentage of neurons exhibiting desynchronized activity (60%, Figure 1E–G). By 14 DIV, 90% of recorded cortical neurons of wt cultures exhibited desynchronized activity, making it the dominant form of neuronal activity during this developmental time window (Figure 1H–J). The observed developmental desynchronization pattern in the somatosensory cortex in this study was comparable to neuronal activity patterns which were previously reported in in vivo studies. Similar patterns were reported in mice by [20] around P13 and by [23] at P14, while similar patterns in rats were reported by [21] between P25 and 36 and by [22] between P21 and 30.

3.2. Developmental Network Desynchronization Is Disrupted in Reelin-Deficient Mice

During embryonic and early postnatal development, Cajal–Retzius cells express reelin. However, these cells undergo selective cell death through apoptosis and disappear completely by P14 [46,61,62]. Despite this, a subset of GABAergic inhibitory interneurons in the cortex [63,64,65,66] and entorhinal cortical ocean cells [67] continue to express reelin postnatally. The function of reelin in regulating neuronal activity during early cortical development remains poorly understood. Previous studies have shown that reelin regulates the function of GABABRs [59] and dendritic development [53]. Initially, we aimed to confirm that 4-OHT treatment induces nuclear Cre activation and knockout of the floxed reelin gene. Therefore, we performed immunofluorescence at different time points after 4-OHT treatment to confirm the knockout of reelin (see Figure 2A). We observed a remarkable decrease in reelin expression after 2 days of treatment with 4-OHT, and complete elimination of reelin immunostaining after 5 days (Figure 2A). Using Ca2+ imaging, we compared spontaneous activity from wt and RelncKO OTCs. Both groups of OTCs were treated with 4-OHT. Previously, it was verified that 4-OHT treatment does not alter basic synaptic transmission [59]. To test whether reelin influences the developmental desynchronization shift around the first postnatal week, Ca2+ signals were recorded from wt and RelncKO OTCs at 7 DIV. In the wt OTCs, the Ca2+ recording analyses revealed that 70% of cortical neurons displayed desynchronized activity, and the remaining 30% of neurons were synchronized at 7 DIV (Figure 2F). On the other hand, in recorded RelncKO OTCs, cortical neurons showed only 50% of a desynchronized network pattern, while the remaining 50% of the recorded neurons were synchronized (Figure 2F). AT 14 DIV, in the wt OTCs, the Ca2+ recording analyses revealed that 90% of cortical neurons displayed desynchronized activity, and the remaining 10% of neurons were synchronized at 14 DIV (Figure 2B,C,G; see also Supplementary Movie S1). On the other hand, in recorded RelncKO OTCs, cortical neurons showed only 10% of a desynchronized network pattern, while the remaining 90% of the recorded neurons were synchronized (Figure 2D,E,G; see also Supplementary Movie S1). To test whether reelin deficiency caused a delay or complete blockade of network developmental desynchronization, we kept the OTCs until 25 DIV and performed Ca2+ recording in both wt and RelncKO OTCs (Figure 2H). Similar to the analyses at 14 DIV, we observed the same effect at 25 DIV, indicating that reelin deficiency caused a blockade rather than a delay in the developmental desynchronization shift (Figure 2H). This finding suggests that reelin is not only necessary for the desynchronization of the developmental network at the end of the second postnatal week but also two weeks later. However, we cannot conclude that this blockade occurs permanently because we did not record OTCs at the adult stage.

3.3. Wildtype Reelin Rescues Developmental Desynchronization in RelncKO Neurons

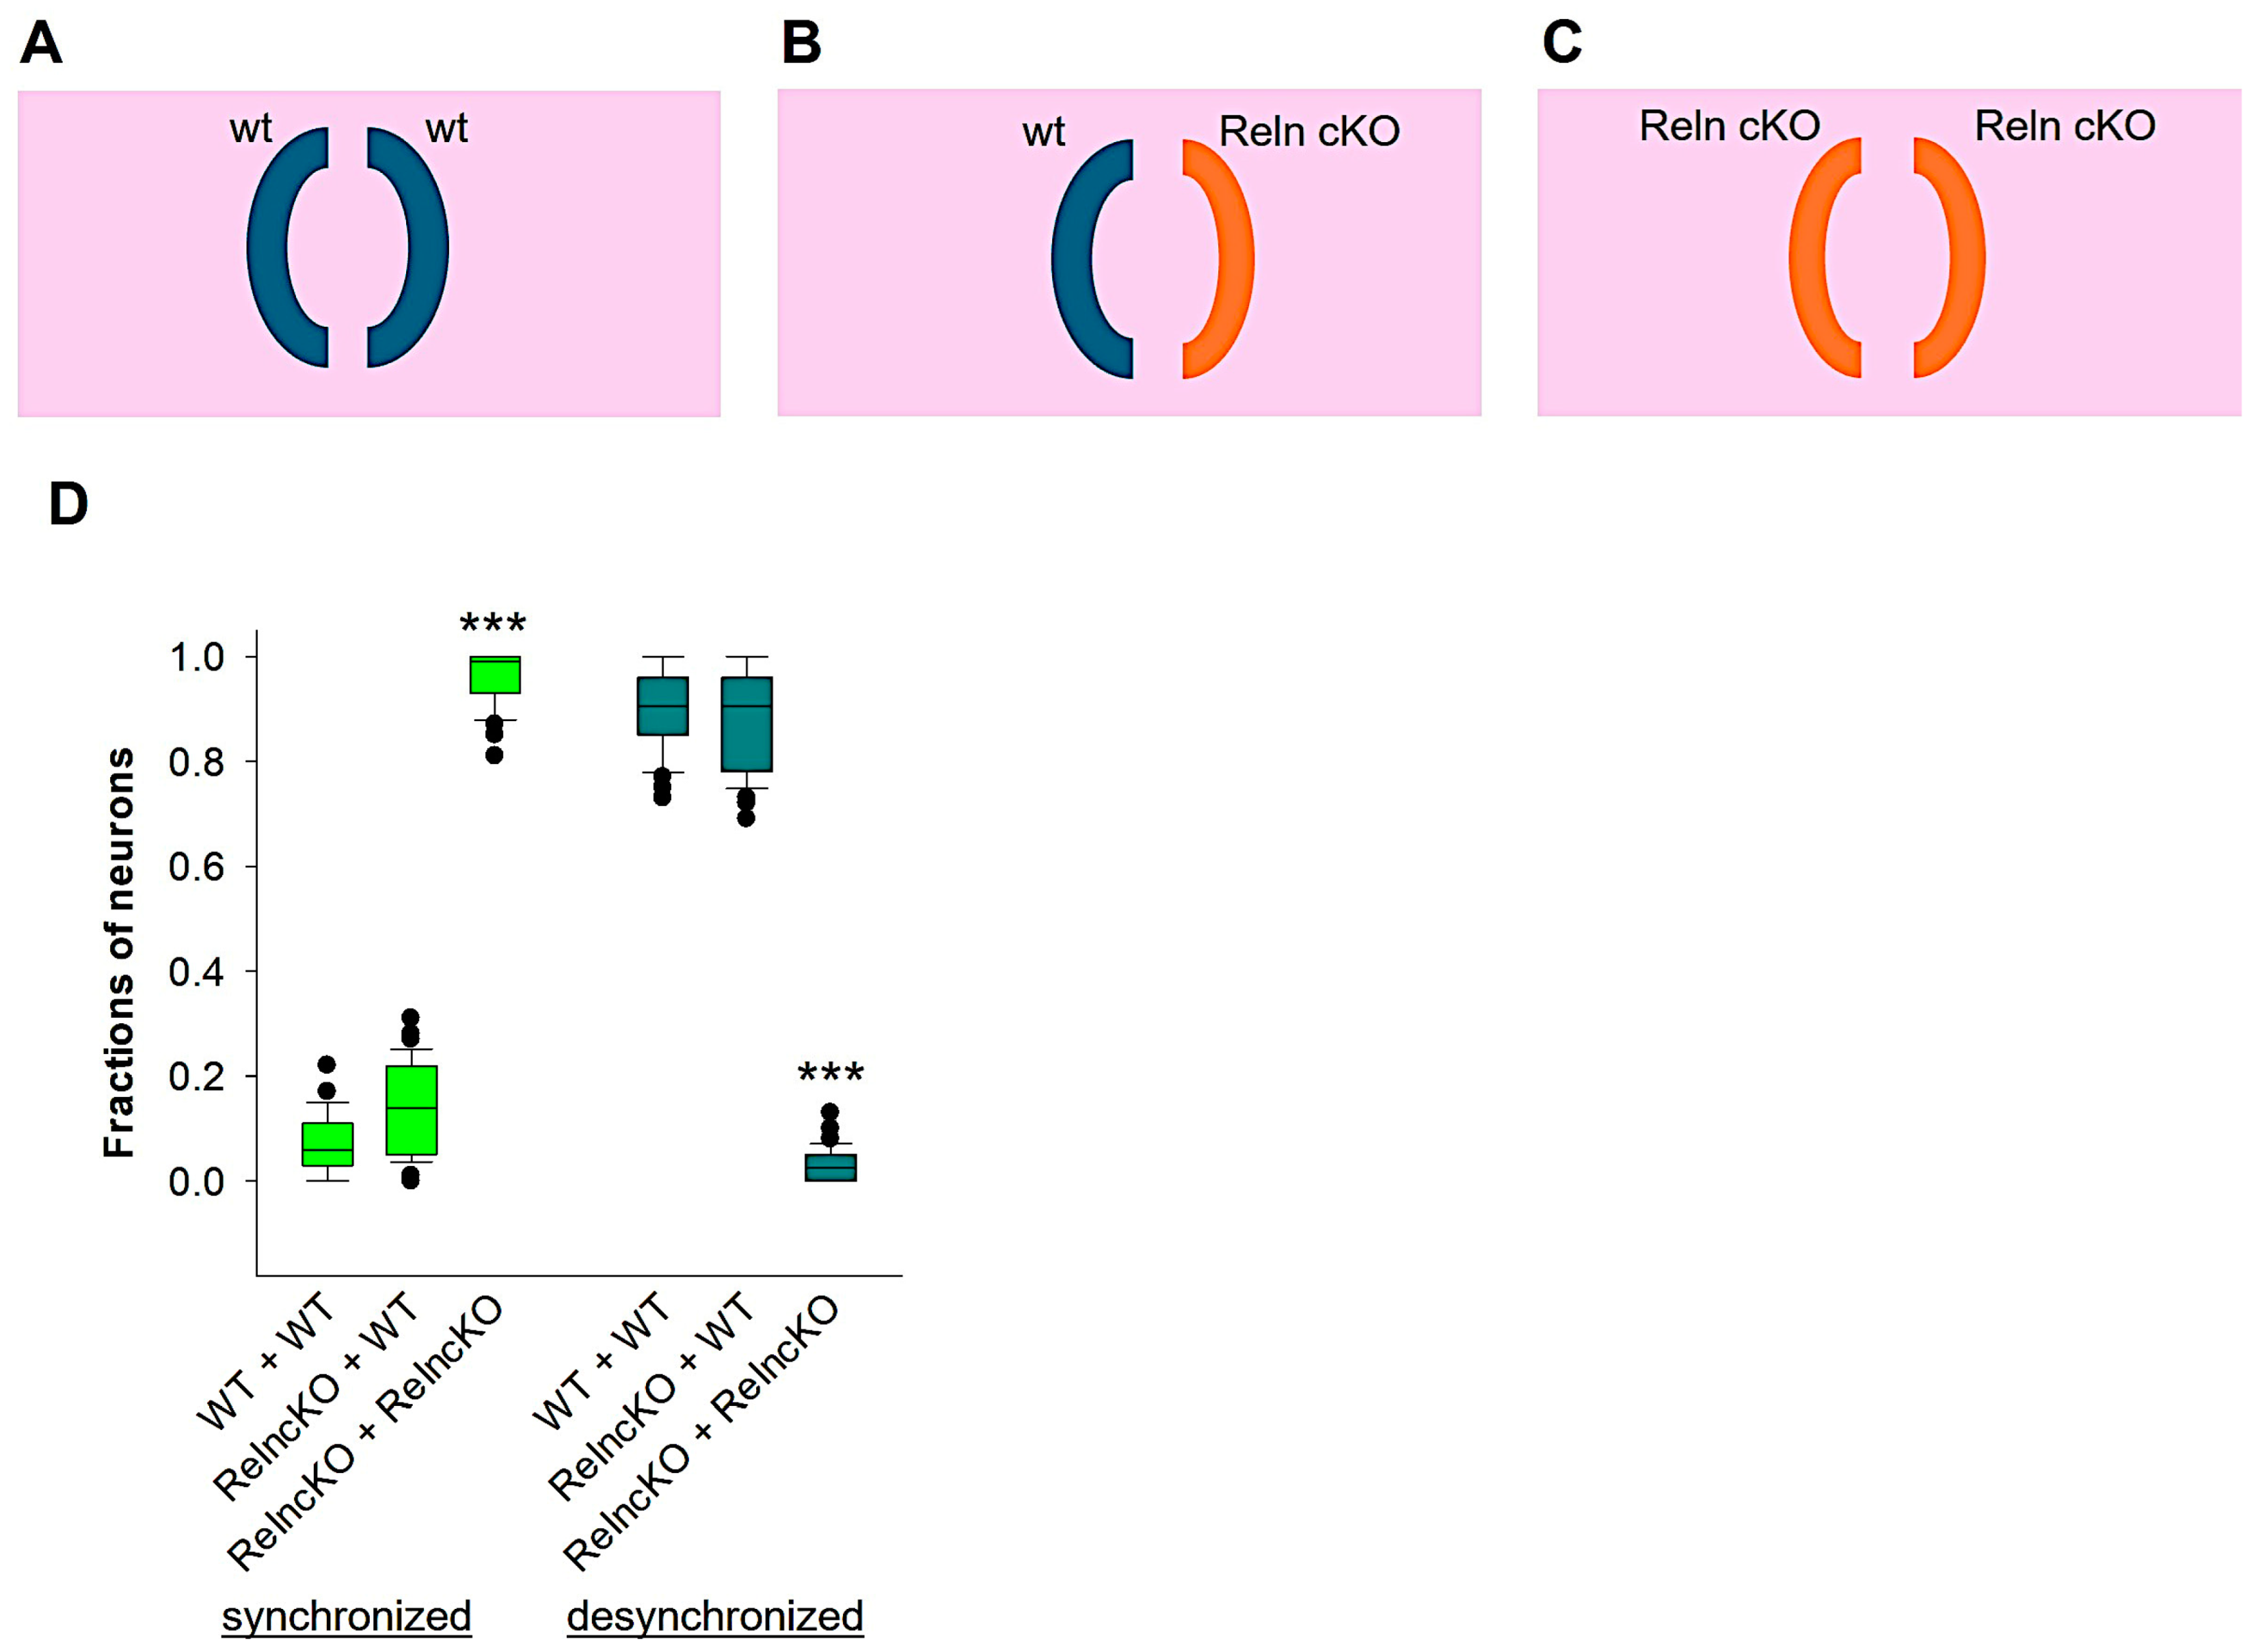
Next, we investigated whether secreted reelin from wt OTCs could rescue the abnormal synchronized neuronal activity pattern observed in the RelncKO OTCs at 14 DIV. To address this question, we co-cultured OTCs in three different conditions: wt with wt, RelncKO with RelncKO, or wt with RelncKO (Figure 3A–C). Our previous research has shown that the amount of secreted reelin in the culture medium varies depending on the conditions. In the wt + wt co-culture, the amount of secreted reelin was abundant. In the wt + RelncKO co-culture, a lesser amount was detectable. In contrast, reelin was almost undetectable in the RelncKO + RelncKO co-culture medium [59]. Ca2+ recording experiments at 14 DIV revealed that 6% of wt + wt co-culture neurons displayed a synchronous activity pattern, which was not significantly different from the wt + RelncKO co-culture neurons (14%; Figure 3D). In contrast, a significantly higher percentage of RelncKO + RelncKO co-culture neurons exhibited a synchronous activity pattern (97%; Figure 3D). However, desynchronized activity was detected in the majority of wt + wt (94%) and wt + RelncKO (86%) co-cultures. In contrast, the fraction of desynchronized neurons in RelncKO + RelncKO co-culture neurons was remarkably reduced (3%; Figure 3D). These results suggest that reelin secreted from wt OTCs into the incubation medium enabled developmental synchronization shift in the co-cultured RelncKO neurons to a basic level comparable to the control group.

3.4. Developmental Network Desynchronization Is Controlled by Reelin Signaling

We further aimed to test whether the shift in developmental desynchronization defect observed in the RelncKO neurons is modulated by canonical reelin signaling. To address this question, we treated OTCs with RAP, an LDL receptor family chaperone that prevents the binding of reelin to VLDLR and ApoER2. Reelin regulates DAB1 tyrosine phosphorylation by binding to VLDLR and ApoER2 [45]. To test whether reelin signaling is involved in the developmental desynchronization shift, we performed Ca2+ imaging in wt and RelncKO OTCs and recorded neurons before and after bath application of RAP (50 ng/mL). At 14 DIV, wt OTCs displayed a desynchronized neuronal activity pattern; however, the bath application of RAP induced neuronal synchronization (Figure 4C; see also Supplementary Movie S3). In contrast to wt OTCs, neither the proportion of synchronized nor desynchronized neurons was affected by the application of RAP to RelncKO OTCs (Figure 4C). These results suggest that blocking endogenous reelin signaling with RAP at the end of the second week results in a developmental desynchronization defect for cortical neurons.

3.5. GABAergic, but Not Glutamatergic, Signaling Is Involved in Reelin-Mediated Developmental Desynchronization

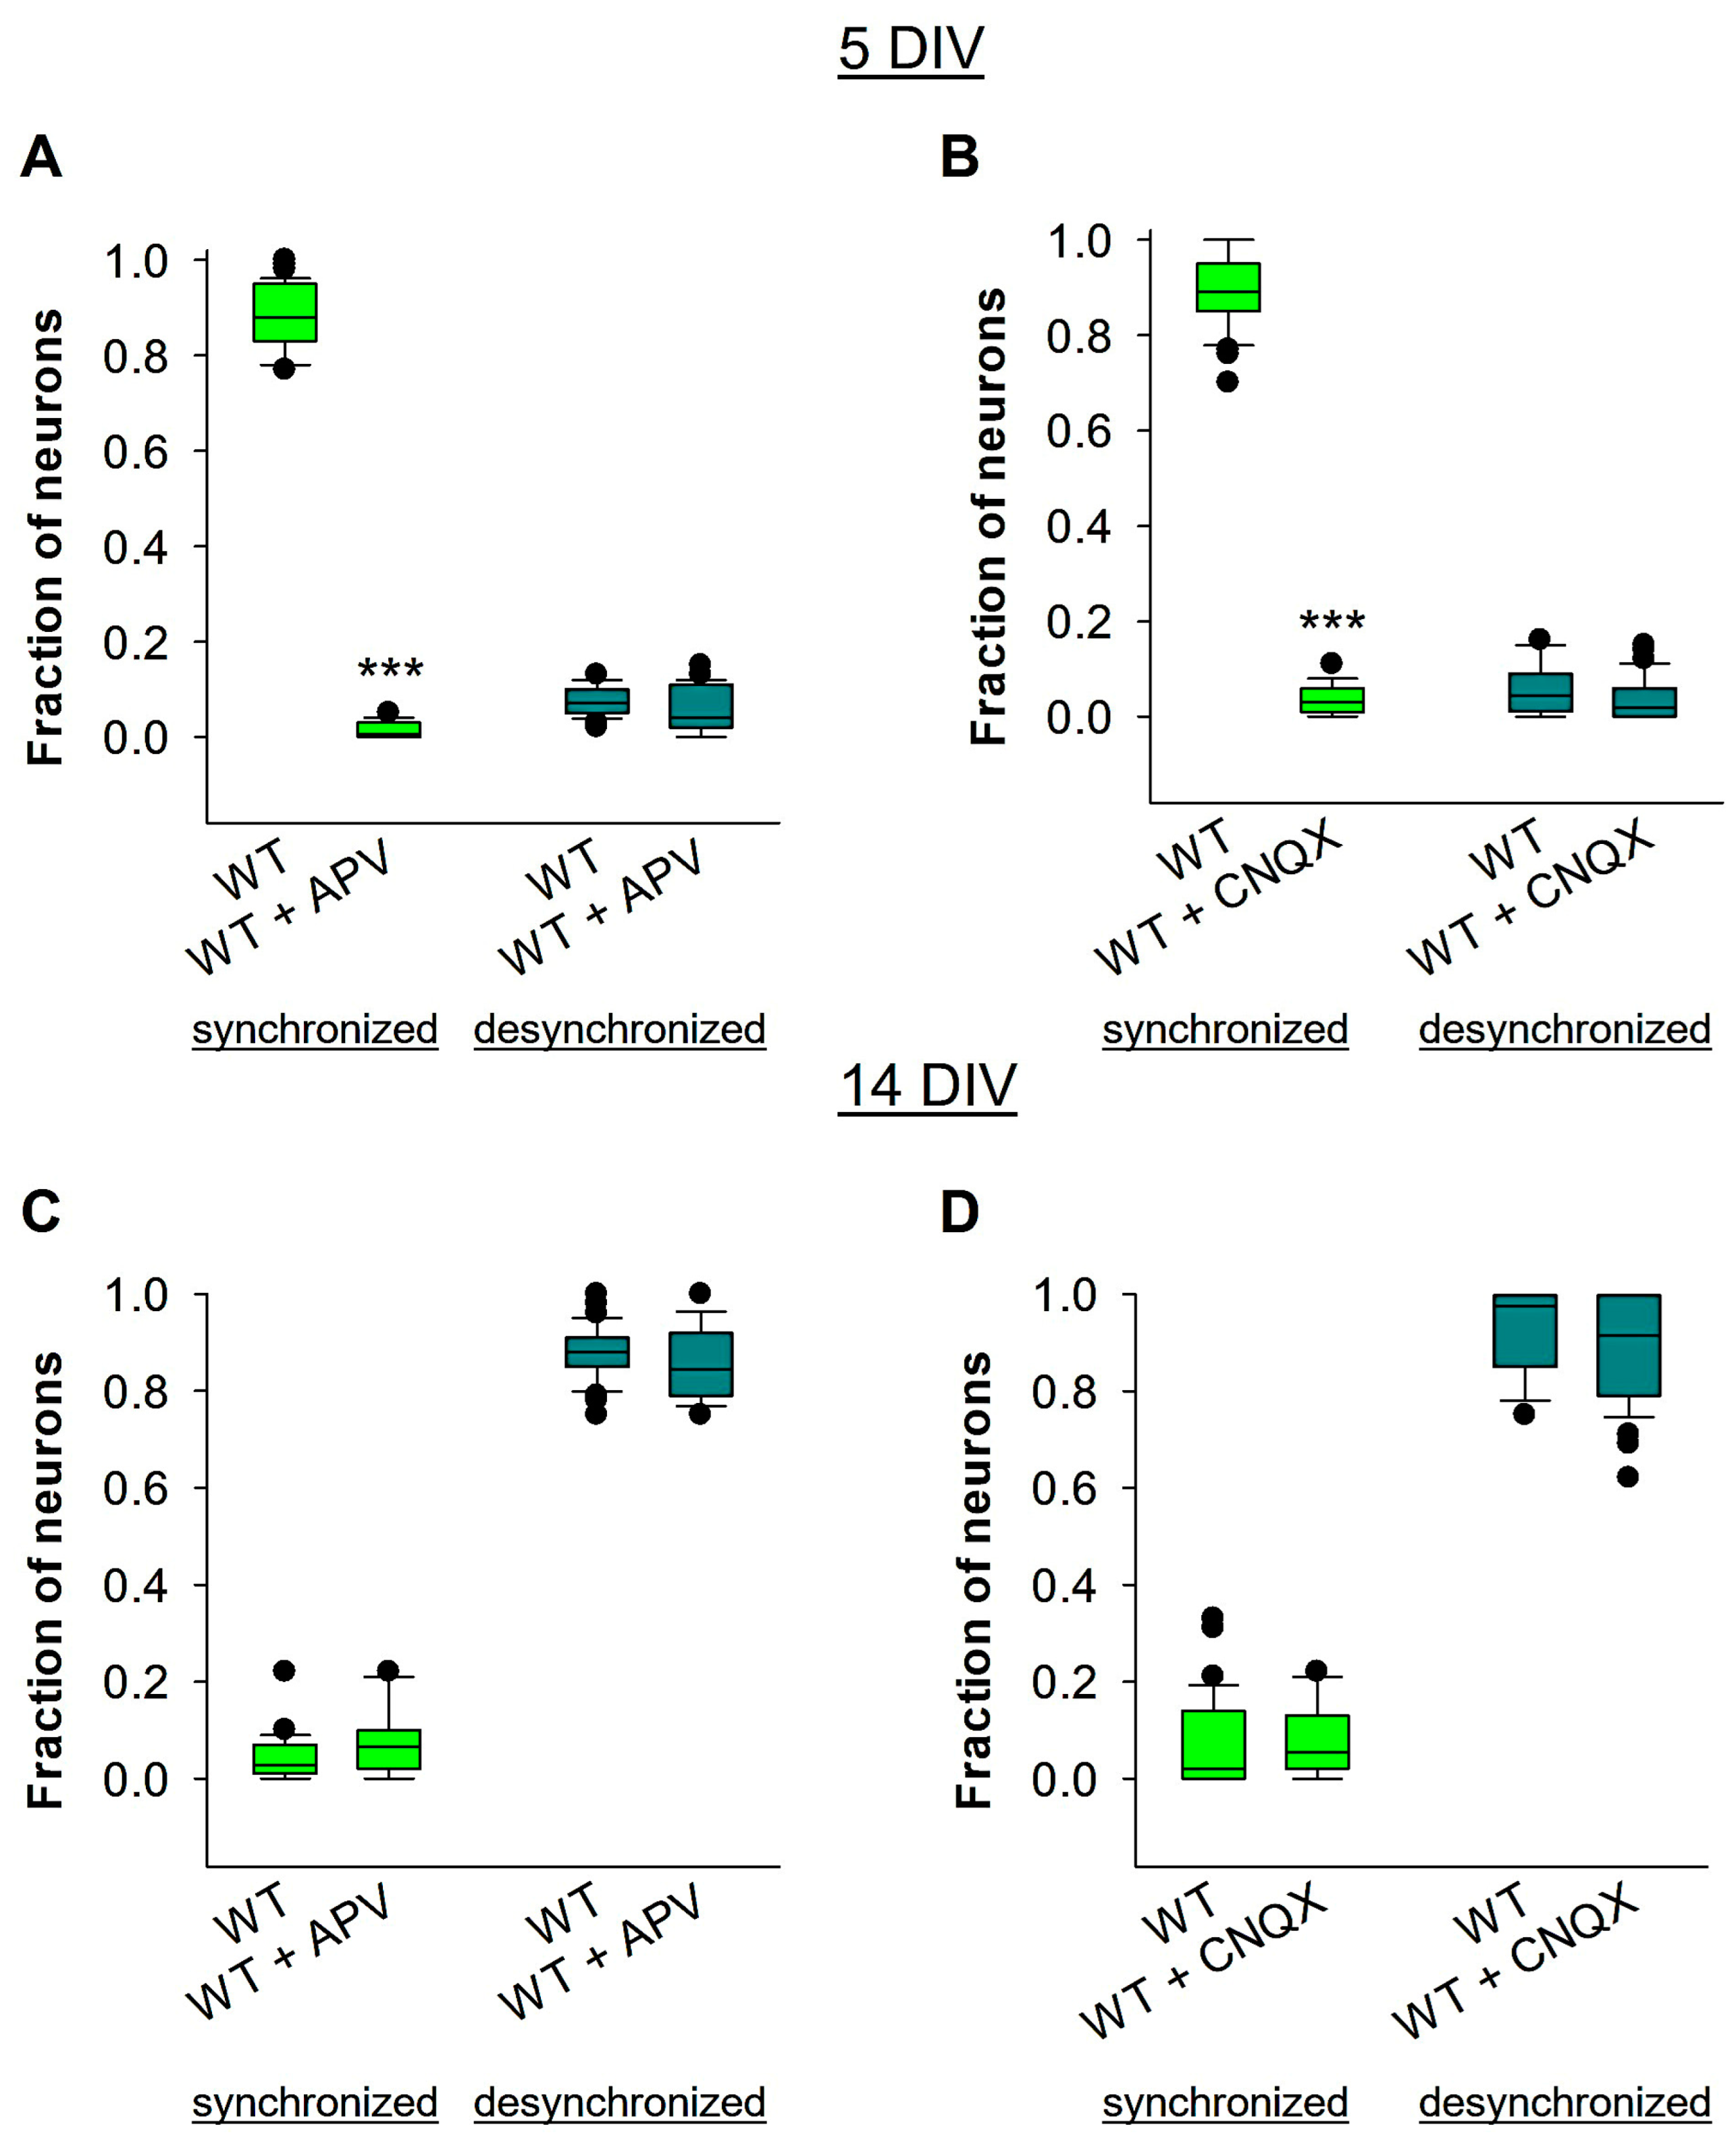
As previously stated, early development of SSA relies primarily on the activation of glutamatergic AMPA and NMDA receptors, and is also influenced by cholinergic activity [2,5,6]. To confirm this, we recorded Ca2+ signals from wt OTCs at 5 DIV when SSA is strongly dependent on AMPAR and NMDAR activation. In fact, we can see that, at 5 DIV, the bath application of either APV or CNQX can both block SSA during that developmental time window (Figure 5A,B). Additionally, reelin has been shown to enhance NMDA and AMPA receptor activity in the adult hippocampus [68]. However, during the developmental desynchronization period (around the end of the second week), it is unclear whether glutamatergic activity controls the developmental shift. To test this, we performed Ca2+ imaging in wt OTCs, and applied the NMDAR antagonist APV acutely at 14 DIV (Figure 5C). The results showed that bath application with APV did not affect the developmental desynchronization shift (Figure 5C). Similarly, blockade of the AMPA/kainate glutamate receptor with CNQX at 14 DIV did not affect the developmental desynchronization shift (Figure 5D). These results suggest that reelin-mediated developmental desynchronization is independent of glutamatergic signaling.
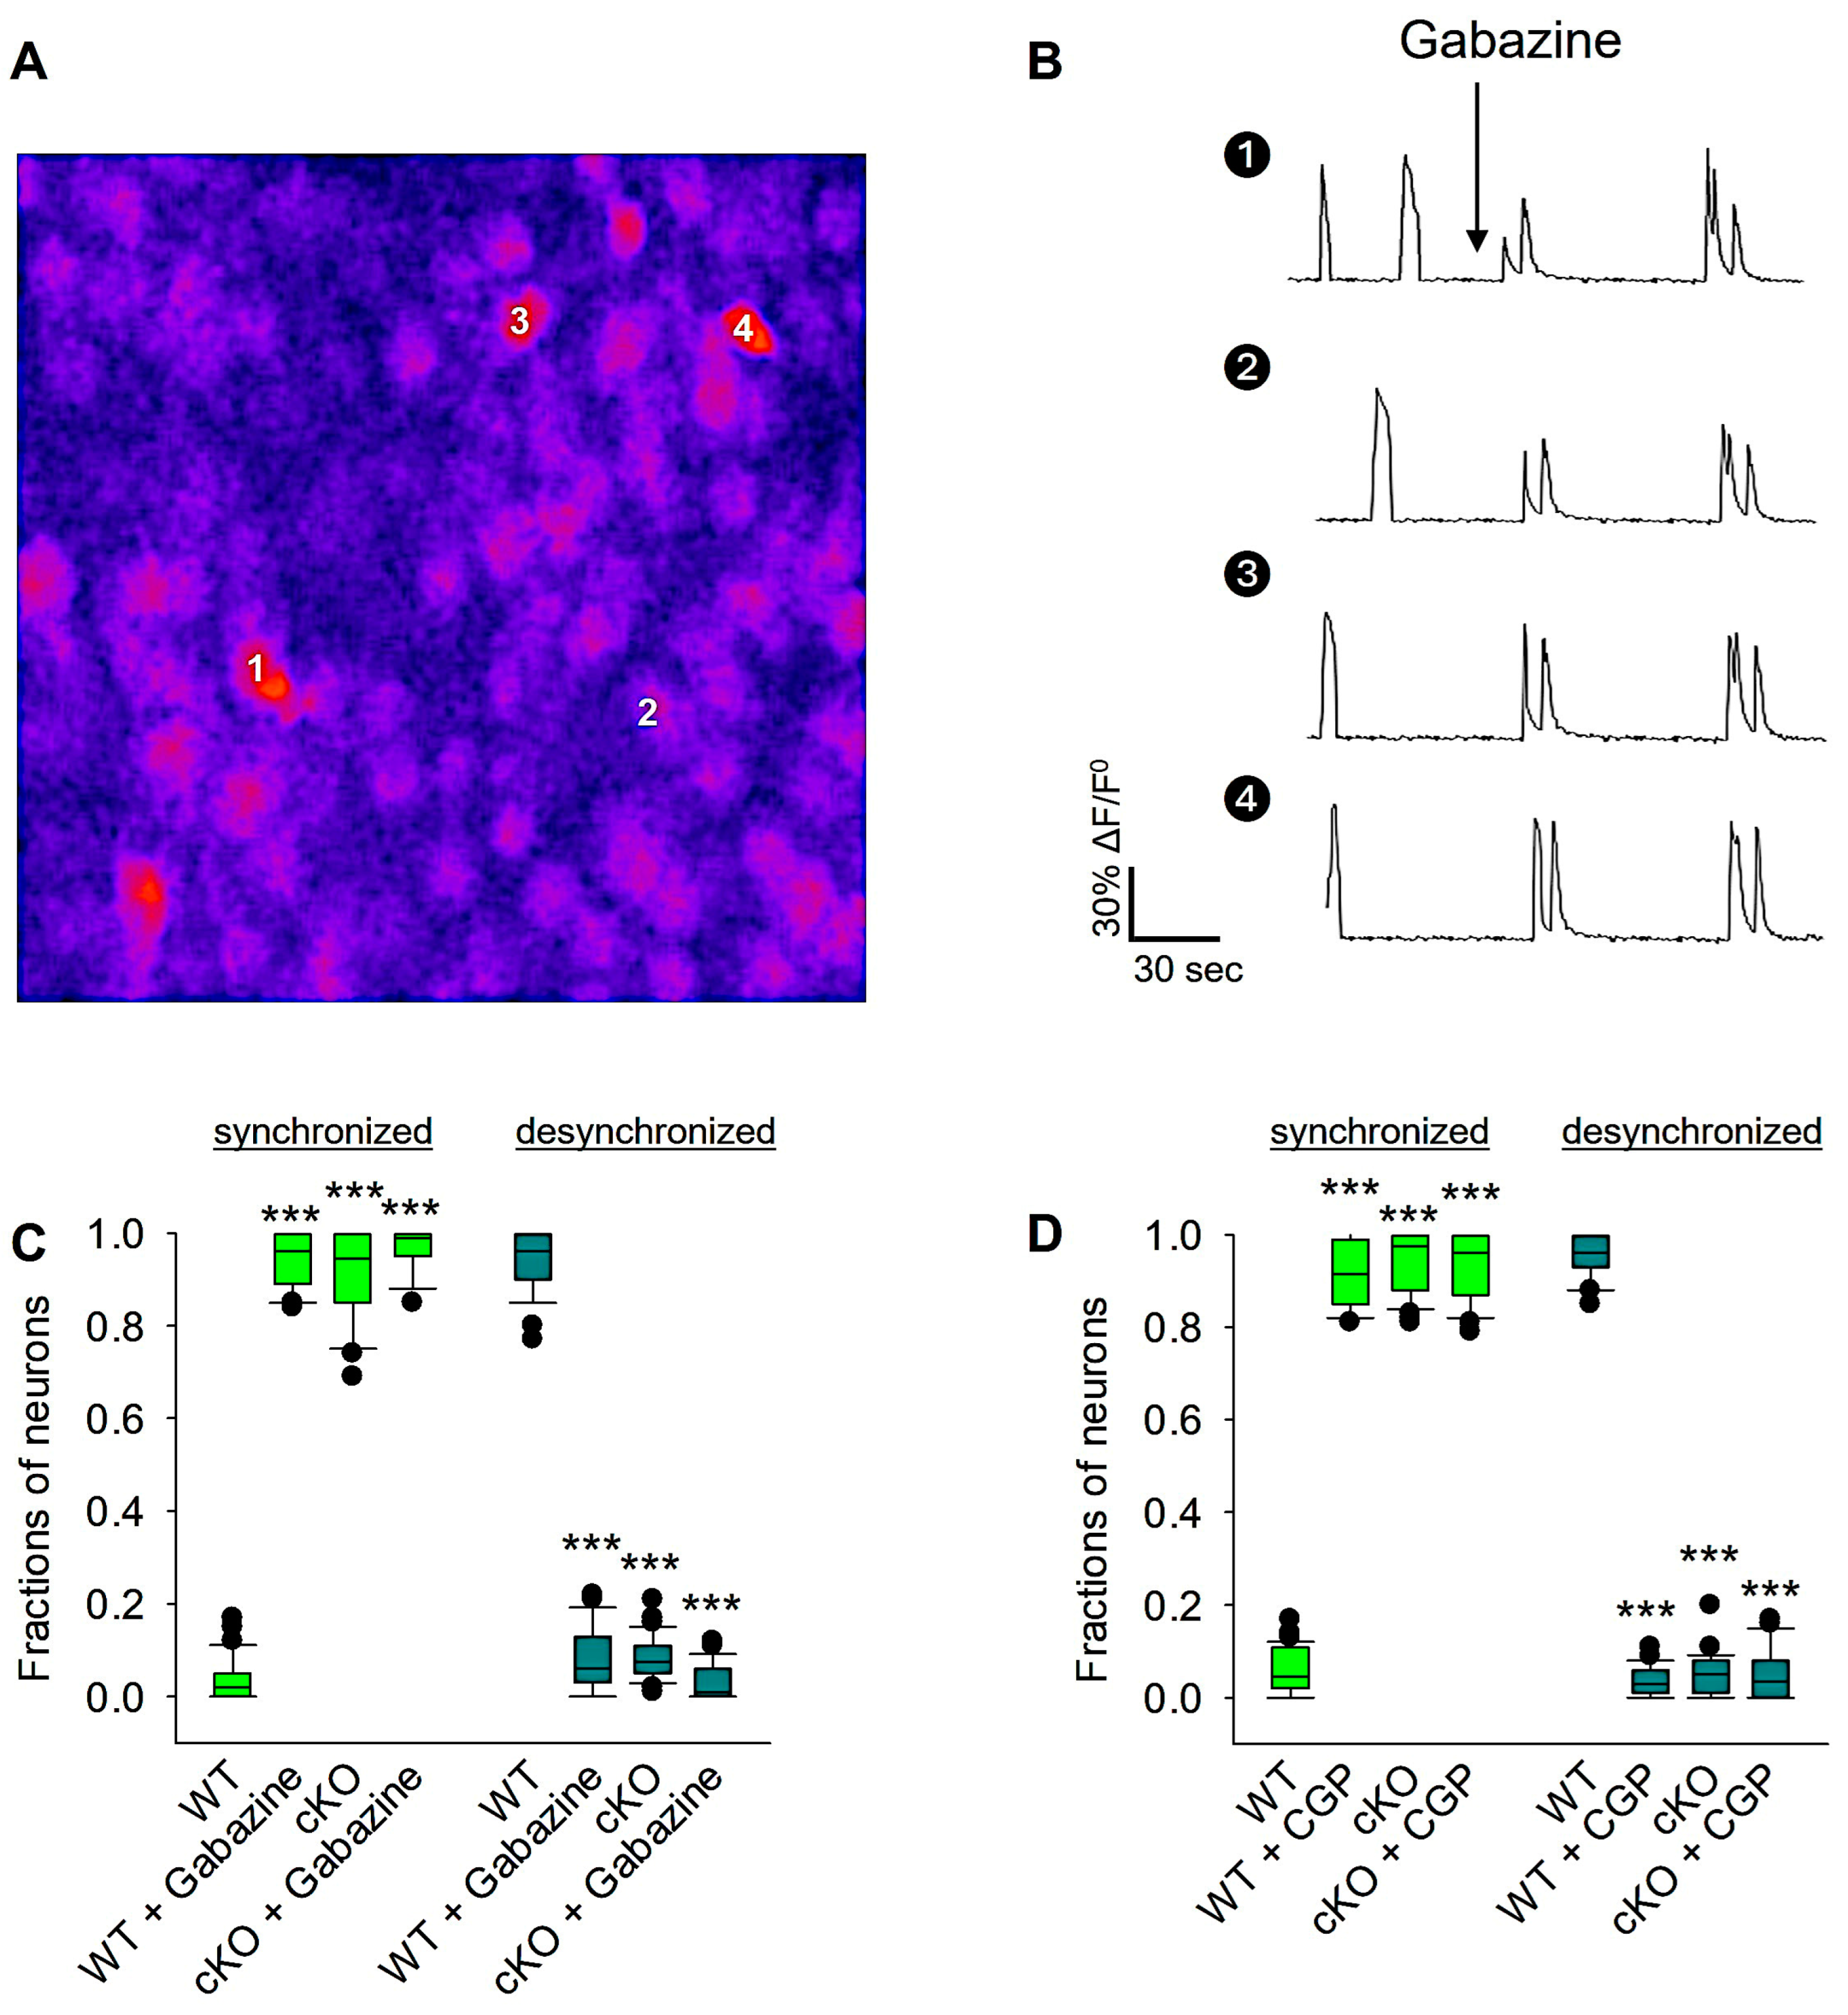
The shift in network desynchronization coincides with the developmental shift from excitatory to inhibitory GABA, which occurs at the end of the second postnatal week. Previous research has demonstrated that an increase in GABAergic inhibition may lead to the elimination of SSA in the neocortex and hippocampus [69]. To test whether the inhibitory action of GABA receptors plays a role in reelin-mediated developmental desynchronization around the second postnatal week, Ca2+ signals were recorded from wt OTC before and after acute bath application of specific GABA receptor antagonists. At 14 DIV, wt and RelncKO OTCs were recorded before and after acute treatment with GABAAR or GABABR antagonists (Figure 6). Acute blockade of GABAARs with Gabazine in wt OTCs significantly reduced the fraction of desynchronized neurons in the recorded OTCs (95% for non-treated OTCs vs. 5% in Gabazine-treated OTCs; Figure 6A–C; see also Supplementary Movie S4), indicating the role of the GABAARs in promoting neuronal desynchronization. Furthermore, acute blockade of GABAARs with Gabazine in RelncKO OTCs resulted in the same fraction of desynchronized neurons as in non-treated RelncKO OTCs (Figure 6C). Furthermore, acute blockade of GABABRs with CGP in wt OTCs remarkably reduced the fraction of desynchronized neurons in the recorded OTCs (93% for non-treated OTCs vs. 7% in CGP-treated OTCs; Figure 6D), whereas cute blockade of GABABRs with CGP in RelncKO OTCs resulted in the same fraction of desynchronized neurons as in non-treated RelncKO OTCs (Figure 6D), confirming the dysfunctionality of GABABRs in the RelncKO OTCs. These results suggest that both GABAARs and GABABRs are required for reelin-mediated developmental desynchronization.

4. Discussion

In this study, we identified a new function of reelin in early postnatal cortical neural network development. Our findings indicate that postnatally induced reelin deficiency caused a disruption of the developmental desynchronization shift naturally occurring in the somatosensory cortical neurons around the second postnatal week. To mimic this effect, we blocked reelin binding to its receptors ApoER2 and VLDLR using RAP. As there are no specific selective antagonists for ApoER2 and VLDLR, we used RAP to broadly block LRP family members. Co-culture of RelncKO OTCs with reelin-secreting wt OTCs rescued the deficient network developmental shift from synchronized to desynchronized activity in co-cultured RelncKO OTCs. Reelin is secreted by Cajal–Retzius (CR) cells in layer I of the neocortex during early embryonic stages. The number of CR cells in layer I significantly drops after birth, and CR cells vanish completely around P14 due to selective cell death through apoptosis [62]. Therefore, after birth, reelin can be secreted from CR cells (at least until P14) but also by the inhibitory interneurons [66]. Therefore, secreted reelin from both cell types can be responsible for triggering the developmental desynchronization shift in the somatosensory cortex. Furthermore, there is another group of neurons known as ocean cells or stellate cells that express reelin exclusively in the medial entorhinal cortex. These cells have been demonstrated as being responsible for context-specific fear memory [67]. Reelin function in early postnatal development is still not well documented. For example, it was found that the N-terminal region of reelin restricts dendritic growth of neocortical apical pyramidal neurons [52]. Another study conducted a morphometric analysis of interneurons in the adult reeler neocortex and hippocampus and showed that reeler interneurons had hypertrophic growth with longer dendritic branches compared to wild-type interneurons [51]. In early postnatal development, the conditional knockout of reelin increased dendritic growth in inhibitory interneurons due to the absence of GABABR signaling [53,59]. Additionally, reelin plays a role in developing vertical columnar structures in the mouse presubicular cortex. It acts as a stop signal for the growth and branching of postnatal pyramidal cell apical dendrites [70]. On the other hand, cortical neurons’ apical dendrites are inhibited by chondroitin sulfate proteoglycans (CSPGs), which are highly expressed in the marginal zone, and a recent study has shown that reelin signaling in the marginal zone counteracts the inhibitory action of CSPGs on apical dendrites in the cortex [71]. Taken together, this study contributes to our comprehension of reelin’s function during early postnatal cortical development.
The SSA depends on glutamatergic signaling in the early development of the neocortex [2,5,6,56,72,73,74]. Furthermore, it has been proposed that the maturation of GABAergic signaling is responsible for the developmental desynchronization shift in the neocortex and hippocampus [2,4,69]. The present study also aimed at investigating the potential involvement of glutamatergic signaling in the developmental desynchronization shift during the second postnatal week of development. However, the blockade of glutamate receptors did not affect the developmental shift to desynchronization, indicating that glutamatergic signaling is limited to the first postnatal week when SSA is the predominant cortical activity. While the pattern of SSA during the first postnatal week is well-studied, there is insufficient information on how the developmental desynchronization shift occurs during the second postnatal week. Several studies have found that neocortical networks undergo a transition to a desynchronized state between the end of the second and third postnatal weeks of development [7,20,21,22,23]. However, the underlying mechanism of this developmental desynchronization shift remains largely unexplored. Recently, it was shown that GABAARs, but not GABABRs, modulate network desynchronization in the medial entorhinal cortex (mEC) during the second postnatal week of development [75]. Our results confirm that GABAARs are involved in the developmental desynchronization shift in the somatosensory cortex. During early development, GABAARs do not mediate hyperpolarization-dependent inhibition, since GABAAR signaling is predominantly depolarizing and excitatory [76]. The switch from GABA excitation to inhibition occurs in the neocortex between the first and the second postnatal developmental week [27,77]. There is a link between reelin and postsynaptic GABAAR in the grid cells of the entorhinal cortex. Reelin-positive cells selectively express the α3 subunit of the GABAAR and this selective pattern is responsible for both tonic and phasic inhibition [78]. Furthermore, the neurohormone oxytocin desynchronized SSA in the first postnatal week in the mouse medial prefrontal cortex. By the end of the second postnatal week, the inhibition of GABAARs restored SSA, suggesting the emergence of GABAAR-mediated inhibition as a major factor in the termination of SSA in the mouse medial prefrontal cortex [23]. Moreover, reelin haploinsufficiency in the mouse neocortex disrupts the developmental GABA excitation/inhibition switch, indicating an interaction between reelin signaling and GABA receptors. It is important to note that the postnatal GABA shift is not a simple switch that takes place at a certain moment in postnatal development, but rather reflects a gradual change in neuronal Cl homeostasis, such that GABA signaling gradually becomes more hyperpolarizing within local neuronal networks [27]. The timing of the GABA excitation/inhibition switch coincides with the period when neocortical activity becomes desynchronized. The transition of the network from SSA to an independent desynchronized state may be determined by the GABA excitation/inhibition switch.
GABABRs are metabotropic receptors coupled to guanine nucleotide-binding proteins (G proteins). They modulate Ca2+ and K+ channels, inducing both presynaptic and slow postsynaptic inhibition [79]. The presynaptic GABABRs are coupled to Ca2+ channels, which regulate the release of neurotransmitters [80]. During prenatal development in vivo, GABARs were detected by immunocytochemistry as early as E14 in the marginal zone and the subplate of the cortex, indicating the expression and potential formation of functional GABARs [81]. During embryonic development, GABA is the main neurotransmitter. At this stage, GABA is not hyperpolarizing because GABAR lacks coupling between G proteins and potassium channels until the end of the first postnatal week [82]. The non-hyperpolarizing activation of GABAR in early embryonic development has been shown to promote dendritic growth [83]. However, after birth, when GABABR shifts to hyperpolarization, it can couple to G proteins and potassium channels. Previous studies have shown that GABABR intracellular signaling via Gαi/o proteins is impaired in RelncKO mice [59]. Therefore, in the absence of early postnatal reelin expression, the GABABRs were not functional [59]. Our findings suggest that the activation of GABABRs in the somatosensory cortex is necessary for reelin-mediated developmental desynchronization shift.

5. Conclusions

This study documents the role of an extracellular matrix protein in the developmental desynchronization shift that occurs naturally at the end of the second postnatal week of cortical development. In the absence of reelin neuronal activity, RelncKO OTCs exhibited synchronous neuronal activity at the end of the second postnatal week. Furthermore, we demonstrated that developmental desynchronization impairment observed in RelncKO could be rescued when RelncKO OTCs were co-cultured with wt OTCs. Finally, our findings indicate that the developmental transition to a desynchronized state at the end of the second postnatal week is not dependent on glutamatergic signaling. Rather, the transition is dependent on GABAergic signaling. The results indicate that reelin controls developmental desynchronization through GABAergic signaling. These results are consistent with a previous study which demonstrated that GABARs modulate network desynchronization in the mEC during the second postnatal week of development [75]. The results of the present study confirm that GABARs are involved in the developmental desynchronization shift in the somatosensory cortex. However, it shows that this process is dependent on the upstream reelin signaling pathway. The present study suggests that reelin also plays a role in shaping neuronal activity during early postnatal network activity development.

Supplementary Materials

The following supporting information can be downloaded at https://www.mdpi.com/article/10.3390/biom14050593/s1. Movie S1: Ca2 recording of neuronal activity in wt OTCs at 14 DIV; Movie S2: Ca2+ recording of neuronal activity in RelncKO OTCs at 14 DIV; Movie S3: Effect of Reelin signaling blockade in wt OTCs; Movie S4: Effect of GABAARs blockade on network desynchronization.

Author Contributions

Conceptualization: M.I.K.H. and E.F.; methodology: M.I.K.H., P.P., S.D., O.R. and A.J., formal analysis: M.I.K.H., O.R., A.J., B.R.A. and M.Z.A.; investigation: M.I.K.H., P.P., S.D., O.R., A.J., B.R.A., M.Z.A., J.H. and E.F.; data curation: M.I.K.H. and E.F.; writing—original draft: M.I.K.H.; writing—review and editing: M.I.K.H. and E.F.; funding acquisition: M.I.K.H., J.H. and E.F. All authors have read and agreed to the published version of the manuscript.

Funding

This work was supported by the United Arab Emirates University startup grant numbers 12M142 to M.I.K.H., and the UAEU UPAR grant number 12M159 to M.I.K.H.; FoRUM from Ruhr-University of Bochum to E.F. This work was supported by NIH grants NS093382, NS108115, AG053391, HL063762 (to JH). JH was further supported by the Blue Field Project to Cure FTD, BrightFocus Foundation (A20135245 and A2016396S), Harrington Discovery Institute, and a Circle of Friends Pilot Synergy Award. Institutional Review Board Statement: The animal study protocol was approved by the Institutional Review Board.

Institutional Review Board Statement

The care and use of experimental animals were in compliance with the Federal German law and ARRIVE guidelines, with permission Nr. 84-02.04.2016.A383.

Informed Consent Statement

Not applicable.

Data Availability Statement

The Relnflox mice (B6.129-Relntm1Her/J; Stock # 037348) are available from Jackson Laboratories, Bar Harbor, Maine.

Conflicts of Interest

The authors declare no conflicts of interest.

References

  1. Khazipov, R.; Luhmann, H.J. Early Patterns of Electrical Activity in the Developing Cerebral Cortex of Humans and Rodents. Trends Neurosci. 2006, 29, 414–418. [Google Scholar] [CrossRef] [PubMed]
  2. Garaschuk, O.; Linn, J.; Eilers, J.; Konnerth, A. Large-Scale Oscillatory Calcium Waves in the Immature Cortex. Nat. Neurosci. 2000, 3, 452–459. [Google Scholar] [CrossRef] [PubMed]
  3. Moody, W.J.; Bosma, M.M. Ion Channel Development, Spontaneous Activity, and Activity-Dependent Development in Nerve and Muscle Cells. Physiol. Rev. 2005, 85, 883–941. [Google Scholar] [CrossRef] [PubMed]
  4. Allene, C.; Cossart, R. Early NMDA Receptor-Driven Waves of Activity in the Developing Neocortex: Physiological or Pathological Network Oscillations? J. Physiol. 2010, 588, 83–91. [Google Scholar] [CrossRef] [PubMed]
  5. McCabe, A.K.; Chisholm, S.L.; Picken-Bahrey, H.L.; Moody, W.J. The Self-Regulating Nature of Spontaneous Synchronized Activity in Developing Mouse Cortical Neurones. J. Physiol. 2006, 577, 155–167. [Google Scholar] [CrossRef] [PubMed]
  6. Yang, J.-W.; Reyes-Puerta, V.; Kilb, W.; Luhmann, H.J. Spindle Bursts in Neonatal Rat Cerebral Cortex. Neural Plast. 2016, 2016, 3467832. [Google Scholar] [CrossRef] [PubMed]
  7. Golshani, P.; Gonçalves, J.T.; Khoshkhoo, S.; Mostany, R.; Smirnakis, S.; Portera-Cailliau, C. Internally Mediated Developmental Desynchronization of Neocortical Network Activity. J. Neurosci. 2009, 29, 10890–10899. [Google Scholar] [CrossRef]
  8. Luczak, A.; Maclean, J.N. Default Activity Patterns at the Neocortical Microcircuit Level. Front. Integr. Neurosci. 2012, 6, 30. [Google Scholar] [CrossRef] [PubMed]
  9. Siegel, F.; Heimel, J.A.; Peters, J.; Lohmann, C. Peripheral and Central Inputs Shape Network Dynamics in the Developing Visual Cortex in Vivo. Curr. Biol. 2012, 22, 253–258. [Google Scholar] [CrossRef]
  10. Yang, J.-W.; Hanganu-Opatz, I.L.; Sun, J.-J.; Luhmann, H.J. Three Patterns of Oscillatory Activity Differentially Synchronize Developing Neocortical Networks in Vivo. J. Neurosci. 2009, 29, 9011–9025. [Google Scholar] [CrossRef]
  11. Khazipov, R.; Sirota, A.; Leinekugel, X.; Holmes, G.L.; Ben-Ari, Y.; Buzsáki, G. Early Motor Activity Drives Spindle Bursts in the Developing Somatosensory Cortex. Nature 2004, 432, 758–761. [Google Scholar] [CrossRef] [PubMed]
  12. Dupont, E.; Hanganu, I.L.; Kilb, W.; Hirsch, S.; Luhmann, H.J. Rapid Developmental Switch in the Mechanisms Driving Early Cortical Columnar Networks. Nature 2006, 439, 79–83. [Google Scholar] [CrossRef] [PubMed]
  13. Luhmann, H.J.; Khazipov, R. Neuronal Activity Patterns in the Developing Barrel Cortex. Neuroscience 2018, 368, 256–267. [Google Scholar] [CrossRef] [PubMed]
  14. Martini, F.J.; Guillamón-Vivancos, T.; Moreno-Juan, V.; Valdeolmillos, M.; López-Bendito, G. Spontaneous Activity in Developing Thalamic and Cortical Sensory Networks. Neuron 2021, 109, 2519–2534. [Google Scholar] [CrossRef] [PubMed]
  15. Babola, T.A.; Li, S.; Gribizis, A.; Lee, B.J.; Issa, J.B.; Wang, H.C.; Crair, M.C.; Bergles, D.E. Homeostatic Control of Spontaneous Activity in the Developing Auditory System. Neuron 2018, 99, 511–524.e5. [Google Scholar] [CrossRef]
  16. Dreyfus-Brisac, C.; Larroche, J.C. Discontinuous electroencephalograms in the premature newborn and at term. Electro-anatomo-clinical correlations. Rev. Electroencephalogr. Neurophysiol. Clin. 1971, 1, 95–99. [Google Scholar] [CrossRef] [PubMed]
  17. Hanganu, I.L.; Ben-Ari, Y.; Khazipov, R. Retinal Waves Trigger Spindle Bursts in the Neonatal Rat Visual Cortex. J. Neurosci. 2006, 26, 6728–6736. [Google Scholar] [CrossRef] [PubMed]
  18. Colonnese, M.T.; Kaminska, A.; Minlebaev, M.; Milh, M.; Bloem, B.; Lescure, S.; Moriette, G.; Chiron, C.; Ben-Ari, Y.; Khazipov, R. A Conserved Switch in Sensory Processing Prepares Developing Neocortex for Vision. Neuron 2010, 67, 480–498. [Google Scholar] [CrossRef]
  19. Allène, C.; Cattani, A.; Ackman, J.B.; Bonifazi, P.; Aniksztejn, L.; Ben-Ari, Y.; Cossart, R. Sequential Generation of Two Distinct Synapse-Driven Network Patterns in Developing Neocortex. J. Neurosci. 2008, 28, 12851–12863. [Google Scholar] [CrossRef]
  20. Stosiek, C.; Garaschuk, O.; Holthoff, K.; Konnerth, A. In Vivo Two-Photon Calcium Imaging of Neuronal Networks. Proc. Natl. Acad. Sci. USA 2003, 100, 7319–7324. [Google Scholar] [CrossRef]
  21. Kerr, J.N.D.; Greenberg, D.; Helmchen, F. Imaging Input and Output of Neocortical Networks in Vivo. Proc. Natl. Acad. Sci. USA 2005, 102, 14063–14068. [Google Scholar] [CrossRef]
  22. Hromádka, T.; Deweese, M.R.; Zador, A.M. Sparse Representation of Sounds in the Unanesthetized Auditory Cortex. PLoS Biol. 2008, 6, e16. [Google Scholar] [CrossRef] [PubMed]
  23. Pires, J.; Nelissen, R.; Mansvelder, H.D.; Meredith, R.M. Spontaneous Synchronous Network Activity in the Neonatal Development of mPFC in Mice. Dev. Neurobiol. 2021, 81, 207–225. [Google Scholar] [CrossRef] [PubMed]
  24. Olshausen, B.A.; Field, D.J. Sparse Coding of Sensory Inputs. Curr. Opin. Neurobiol. 2004, 14, 481–487. [Google Scholar] [CrossRef] [PubMed]
  25. Vervaeke, K.; Lorincz, A.; Gleeson, P.; Farinella, M.; Nusser, Z.; Silver, R.A. Rapid Desynchronization of an Electrically Coupled Interneuron Network with Sparse Excitatory Synaptic Input. Neuron 2010, 67, 435–451. [Google Scholar] [CrossRef] [PubMed]
  26. Ben-Ari, Y. Developing Networks Play a Similar Melody. Trends Neurosci. 2001, 24, 353–360. [Google Scholar] [CrossRef]
  27. Peerboom, C.; Wierenga, C.J. The Postnatal GABA Shift: A Developmental Perspective. Neurosci. Biobehav. Rev. 2021, 124, 179–192. [Google Scholar] [CrossRef]
  28. Leinekugel, X.; Khazipov, R.; Cannon, R.; Hirase, H.; Ben-Ari, Y.; Buzsáki, G. Correlated Bursts of Activity in the Neonatal Hippocampus in Vivo. Science 2002, 296, 2049–2052. [Google Scholar] [CrossRef]
  29. Sipilä, S.T.; Schuchmann, S.; Voipio, J.; Yamada, J.; Kaila, K. The Cation-Chloride Cotransporter NKCC1 Promotes Sharp Waves in the Neonatal Rat Hippocampus. J. Physiol. 2006, 573, 765–773. [Google Scholar] [CrossRef]
  30. Murata, Y.; Colonnese, M.T. GABAergic Interneurons Excite Neonatal Hippocampus in Vivo. Sci. Adv. 2020, 6, eaba1430. [Google Scholar] [CrossRef]
  31. Kirmse, K.; Kummer, M.; Kovalchuk, Y.; Witte, O.W.; Garaschuk, O.; Holthoff, K. GABA Depolarizes Immature Neurons and Inhibits Network Activity in the Neonatal Neocortex in Vivo. Nat. Commun. 2015, 6, 7750. [Google Scholar] [CrossRef] [PubMed]
  32. Che, A.; Babij, R.; Iannone, A.F.; Fetcho, R.N.; Ferrer, M.; Liston, C.; Fishell, G.; De Marco García, N.V. Layer I Interneurons Sharpen Sensory Maps during Neonatal Development. Neuron 2018, 99, 98–116.e7. [Google Scholar] [CrossRef] [PubMed]
  33. Minlebaev, M.; Ben-Ari, Y.; Khazipov, R. Network Mechanisms of Spindle-Burst Oscillations in the Neonatal Rat Barrel Cortex In Vivo. J. Neurophysiol. 2007, 97, 692–700. [Google Scholar] [CrossRef] [PubMed]
  34. Minlebaev, M.; Colonnese, M.; Tsintsadze, T.; Sirota, A.; Khazipov, R. Early Gamma Oscillations Synchronize Developing Thalamus and Cortex. Science 2011, 334, 226–229. [Google Scholar] [CrossRef] [PubMed]
  35. Marguet, S.L.; Le-Schulte, V.T.Q.; Merseburg, A.; Neu, A.; Eichler, R.; Jakovcevski, I.; Ivanov, A.; Hanganu-Opatz, I.L.; Bernard, C.; Morellini, F.; et al. Treatment during a Vulnerable Developmental Period Rescues a Genetic Epilepsy. Nat. Med. 2015, 21, 1436–1444. [Google Scholar] [CrossRef]
  36. Caviness, V.S. Patterns of Cell and Fiber Distribution in the Neocortex of the Reeler Mutant Mouse. J. Comp. Neurol. 1976, 170, 435–447. [Google Scholar] [CrossRef] [PubMed]
  37. Curran, T.; D’Arcangelo, G. Role of Reelin in the Control of Brain Development. Brain Res. Brain Res. Rev. 1998, 26, 285–294. [Google Scholar] [CrossRef]
  38. Faini, G.; Del Bene, F.; Albadri, S. Reelin Functions beyond Neuronal Migration: From Synaptogenesis to Network Activity Modulation. Curr. Opin. Neurobiol. 2021, 66, 135–143. [Google Scholar] [CrossRef] [PubMed]
  39. Leifeld, J.; Förster, E.; Reiss, G.; Hamad, M.I.K. Considering the Role of Extracellular Matrix Molecules, in Particular Reelin, in Granule Cell Dispersion Related to Temporal Lobe Epilepsy. Front. Cell Dev. Biol. 2022, 10, 917575. [Google Scholar] [CrossRef]
  40. Pielecka-Fortuna, J.; Wagener, R.J.; Martens, A.-K.; Goetze, B.; Schmidt, K.-F.; Staiger, J.F.; Löwel, S. The Disorganized Visual Cortex in Reelin-Deficient Mice Is Functional and Allows for Enhanced Plasticity. Brain Struct. Funct. 2015, 220, 3449–3467. [Google Scholar] [CrossRef]
  41. Rogers, J.T.; Rusiana, I.; Trotter, J.; Zhao, L.; Donaldson, E.; Pak, D.T.S.; Babus, L.W.; Peters, M.; Banko, J.L.; Chavis, P.; et al. Reelin Supplementation Enhances Cognitive Ability, Synaptic Plasticity, and Dendritic Spine Density. Learn. Mem. 2011, 18, 558–564. [Google Scholar] [CrossRef] [PubMed]
  42. Xu, S.; Zhu, J.; Mi, K.; Shen, Y.; Zhang, X. Functional Role of SIL1 in Neurodevelopment and Learning. Neural Plast. 2019, 2019, 9653024. [Google Scholar] [CrossRef] [PubMed]
  43. Telese, F.; Ma, Q.; Perez, P.M.; Notani, D.; Oh, S.; Li, W.; Comoletti, D.; Ohgi, K.A.; Taylor, H.; Rosenfeld, M.G. LRP8-Reelin-Regulated Neuronal Enhancer Signature Underlying Learning and Memory Formation. Neuron 2015, 86, 696–710. [Google Scholar] [CrossRef] [PubMed]
  44. Bock, H.H.; May, P. Canonical and Non-Canonical Reelin Signaling. Front. Cell Neurosci. 2016, 10, 166. [Google Scholar] [CrossRef] [PubMed]
  45. Lee, G.H.; D’Arcangelo, G. New Insights into Reelin-Mediated Signaling Pathways. Front. Cell Neurosci. 2016, 10, 122. [Google Scholar] [CrossRef] [PubMed]
  46. Jossin, Y. Reelin Functions, Mechanisms of Action and Signaling Pathways During Brain Development and Maturation. Biomolecules 2020, 10, 964. [Google Scholar] [CrossRef] [PubMed]
  47. Niu, S.; Renfro, A.; Quattrocchi, C.C.; Sheldon, M.; D’Arcangelo, G. Reelin Promotes Hippocampal Dendrite Development through the VLDLR/ApoER2-Dab1 Pathway. Neuron 2004, 41, 71–84. [Google Scholar] [CrossRef] [PubMed]
  48. Jossin, Y.; Goffinet, A.M. Reelin Signals through Phosphatidylinositol 3-Kinase and Akt to Control Cortical Development and through mTor to Regulate Dendritic Growth. Mol. Cell Biol. 2007, 27, 7113–7124. [Google Scholar] [CrossRef] [PubMed]
  49. Matsuki, T.; Pramatarova, A.; Howell, B.W. Reduction of Crk and CrkL Expression Blocks Reelin-Induced Dendritogenesis. J. Cell Sci. 2008, 121, 1869–1875. [Google Scholar] [CrossRef]
  50. Hamad, M.I.K.; Emerald, B.S.; Kumar, K.K.; Ibrahim, M.F.; Ali, B.R.; Bataineh, M.F. Extracellular Molecular Signals Shaping Dendrite Architecture during Brain Development. Front. Cell Dev. Biol. 2023, 11, 1254589. [Google Scholar] [CrossRef]
  51. Yabut, O.; Renfro, A.; Niu, S.; Swann, J.W.; Marín, O.; D’Arcangelo, G. Abnormal Laminar Position and Dendrite Development of Interneurons in the Reeler Forebrain. Brain Res. 2007, 1140, 75–83. [Google Scholar] [CrossRef] [PubMed]
  52. Chameau, P.; Inta, D.; Vitalis, T.; Monyer, H.; Wadman, W.J.; van Hooft, J.A. The N-Terminal Region of Reelin Regulates Postnatal Dendritic Maturation of Cortical Pyramidal Neurons. Proc. Natl. Acad. Sci. USA 2009, 106, 7227–7232. [Google Scholar] [CrossRef] [PubMed]
  53. Hamad, M.I.K.; Petrova, P.; Daoud, S.; Rabaya, O.; Jbara, A.; Melliti, N.; Leifeld, J.; Jakovčevski, I.; Reiss, G.; Herz, J.; et al. Reelin Restricts Dendritic Growth of Interneurons in the Neocortex. Development 2021, 148, dev199718. [Google Scholar] [CrossRef]
  54. Lane-Donovan, C.; Philips, G.T.; Wasser, C.R.; Durakoglugil, M.S.; Masiulis, I.; Upadhaya, A.; Pohlkamp, T.; Coskun, C.; Kotti, T.; Steller, L.; et al. Reelin Protects against Amyloid β Toxicity in Vivo. Sci. Signal 2015, 8, ra67. [Google Scholar] [CrossRef]
  55. Hayashi, S.; McMahon, A.P. Efficient Recombination in Diverse Tissues by a Tamoxifen-Inducible Form of Cre: A Tool for Temporally Regulated Gene Activation/Inactivation in the Mouse. Dev. Biol. 2002, 244, 305–318. [Google Scholar] [CrossRef] [PubMed]
  56. Hamad, M.I.K.; Krause, M.; Wahle, P. Improving AM Ester Calcium Dye Loading Efficiency. J. Neurosci. Methods 2015, 240, 48–60. [Google Scholar] [CrossRef]
  57. Hamad, M.I.K.; Daoud, S.; Petrova, P.; Rabaya, O.; Jbara, A.; Melliti, N.; Stichmann, S.; Reiss, G.; Herz, J.; Förster, E. Biolistic Transfection and Expression Analysis of Acute Cortical Slices. J. Neurosci. Methods 2020, 337, 108666. [Google Scholar] [CrossRef]
  58. Frotscher, M.; Chai, X.; Bock, H.H.; Haas, C.A.; Förster, E.; Zhao, S. Role of Reelin in the Development and Maintenance of Cortical Lamination. J. Neural. Transm. (Vienna) 2009, 116, 1451–1455. [Google Scholar] [CrossRef] [PubMed]
  59. Hamad, M.I.K.; Jbara, A.; Rabaya, O.; Petrova, P.; Daoud, S.; Melliti, N.; Meseke, M.; Lutz, D.; Petrasch-Parwez, E.; Schwitalla, J.C.; et al. Reelin Signaling Modulates GABAB Receptor Function in the Neocortex. J. Neurochem. 2021, 156, 589–603. [Google Scholar] [CrossRef]
  60. Yuste, R.; MacLean, J.; Vogelstein, J.; Paninski, L. Imaging Action Potentials with Calcium Indicators. Cold Spring Harb. Protoc. 2011, 2011, 985–989. [Google Scholar] [CrossRef]
  61. Del Río, J.A.; Heimrich, B.; Supèr, H.; Borrell, V.; Frotscher, M.; Soriano, E. Differential Survival of Cajal-Retzius Cells in Organotypic Cultures of Hippocampus and Neocortex. J. Neurosci. 1996, 16, 6896–6907. [Google Scholar] [CrossRef] [PubMed]
  62. Anstötz, M.; Cosgrove, K.E.; Hack, I.; Mugnaini, E.; Maccaferri, G.; Lübke, J.H.R. Morphology, Input-Output Relations and Synaptic Connectivity of Cajal-Retzius Cells in Layer 1 of the Developing Neocortex of CXCR4-EGFP Mice. Brain Struct. Funct. 2014, 219, 2119–2139. [Google Scholar] [CrossRef] [PubMed]
  63. Alcántara, S.; Ruiz, M.; D’Arcangelo, G.; Ezan, F.; de Lecea, L.; Curran, T.; Sotelo, C.; Soriano, E. Regional and Cellular Patterns of Reelin mRNA Expression in the Forebrain of the Developing and Adult Mouse. J. Neurosci. 1998, 18, 7779–7799. [Google Scholar] [CrossRef] [PubMed]
  64. Pesold, C.; Impagnatiello, F.; Pisu, M.G.; Uzunov, D.P.; Costa, E.; Guidotti, A.; Caruncho, H.J. Reelin Is Preferentially Expressed in Neurons Synthesizing Gamma-Aminobutyric Acid in Cortex and Hippocampus of Adult Rats. Proc. Natl. Acad. Sci. USA 1998, 95, 3221–3226. [Google Scholar] [CrossRef] [PubMed]
  65. Chin, J.; Massaro, C.M.; Palop, J.J.; Thwin, M.T.; Yu, G.-Q.; Bien-Ly, N.; Bender, A.; Mucke, L. Reelin Depletion in the Entorhinal Cortex of Human Amyloid Precursor Protein Transgenic Mice and Humans with Alzheimer’s Disease. J. Neurosci. 2007, 27, 2727–2733. [Google Scholar] [CrossRef] [PubMed]
  66. Pohlkamp, T.; Dávid, C.; Cauli, B.; Gallopin, T.; Bouché, E.; Karagiannis, A.; May, P.; Herz, J.; Frotscher, M.; Staiger, J.F.; et al. Characterization and Distribution of Reelin-Positive Interneuron Subtypes in the Rat Barrel Cortex. Cereb. Cortex 2014, 24, 3046–3058. [Google Scholar] [CrossRef] [PubMed]
  67. Kitamura, T.; Sun, C.; Martin, J.; Kitch, L.J.; Schnitzer, M.J.; Tonegawa, S. Entorhinal Cortical Ocean Cells Encode Specific Contexts and Drive Context-Specific Fear Memory. Neuron 2015, 87, 1317–1331. [Google Scholar] [CrossRef]
  68. Chen, Y.; Beffert, U.; Ertunc, M.; Tang, T.-S.; Kavalali, E.T.; Bezprozvanny, I.; Herz, J. Reelin Modulates NMDA Receptor Activity in Cortical Neurons. J. Neurosci. 2005, 25, 8209–8216. [Google Scholar] [CrossRef]
  69. Blankenship, A.G.; Feller, M.B. Mechanisms Underlying Spontaneous Patterned Activity in Developing Neural Circuits. Nat. Rev. Neurosci. 2010, 11, 18–29. [Google Scholar] [CrossRef]
  70. Nishikawa, S.; Goto, S.; Hamasaki, T.; Yamada, K.; Ushio, Y. Involvement of Reelin and Cajal-Retzius Cells in the Developmental Formation of Vertical Columnar Structures in the Cerebral Cortex: Evidence from the Study of Mouse Presubicular Cortex. Cereb. Cortex 2002, 12, 1024–1030. [Google Scholar] [CrossRef]
  71. Zluhan, E.; Enck, J.; Matthews, R.T.; Olson, E.C. Reelin Counteracts Chondroitin Sulfate Proteoglycan-Mediated Cortical Dendrite Growth Inhibition. eNeuro 2020, 7, ENEURO.0168-20.2020. [Google Scholar] [CrossRef] [PubMed]
  72. Jones, R.S.; Heinemann, U. Spontaneous Activity Mediated by NMDA Receptors in Immature Rat Entorhinal Cortex in Vitro. Neurosci. Lett. 1989, 104, 93–98. [Google Scholar] [CrossRef]
  73. Sheroziya, M.G.; von Bohlen Und Halbach, O.; Unsicker, K.; Egorov, A.V. Spontaneous Bursting Activity in the Developing Entorhinal Cortex. J. Neurosci. 2009, 29, 12131–12144. [Google Scholar] [CrossRef]
  74. Namiki, S.; Norimoto, H.; Kobayashi, C.; Nakatani, K.; Matsuki, N.; Ikegaya, Y. Layer III Neurons Control Synchronized Waves in the Immature Cerebral Cortex. J. Neurosci. 2013, 33, 987–1001. [Google Scholar] [CrossRef] [PubMed]
  75. Dawitz, J.; Kroon, T.; Hjorth, J.J.J.; Mansvelder, H.D.; Meredith, R.M. Distinct Synchronous Network Activity During the Second Postnatal Week of Medial Entorhinal Cortex Development. Front. Cell Neurosci. 2020, 14, 91. [Google Scholar] [CrossRef] [PubMed]
  76. Ben-Ari, Y.; Gaiarsa, J.-L.; Tyzio, R.; Khazipov, R. GABA: A Pioneer Transmitter That Excites Immature Neurons and Generates Primitive Oscillations. Physiol. Rev. 2007, 87, 1215–1284. [Google Scholar] [CrossRef]
  77. Ben-Ari, Y. The GABA Excitatory/Inhibitory Developmental Sequence: A Personal Journey. Neuroscience 2014, 279, 187–219. [Google Scholar] [CrossRef]
  78. Berggaard, N.; Seifi, M.; van der Want, J.J.L.; Swinny, J.D. Spatiotemporal Distribution of GABAA Receptor Subunits Within Layer II of Mouse Medial Entorhinal Cortex: Implications for Grid Cell Excitability. Front. Neuroanat. 2018, 12, 46. [Google Scholar] [CrossRef] [PubMed]
  79. Benarroch, E.E. GABAB Receptors: Structure, Functions, and Clinical Implications. Neurology 2012, 78, 578–584. [Google Scholar] [CrossRef]
  80. Pinard, A.; Seddik, R.; Bettler, B. GABAB Receptors: Physiological Functions and Mechanisms of Diversity. Adv. Pharmacol. 2010, 58, 231–255. [Google Scholar] [CrossRef]
  81. López-Bendito, G.; Luján, R.; Shigemoto, R.; Ganter, P.; Paulsen, O.; Molnár, Z. Blockade of GABA(B) Receptors Alters the Tangential Migration of Cortical Neurons. Cereb. Cortex 2003, 13, 932–942. [Google Scholar] [CrossRef] [PubMed]
  82. Fukuda, A.; Mody, I.; Prince, D.A. Differential Ontogenesis of Presynaptic and Postsynaptic GABAB Inhibition in Rat Somatosensory Cortex. J. Neurophysiol. 1993, 70, 448–452. [Google Scholar] [CrossRef] [PubMed]
  83. Bony, G.; Szczurkowska, J.; Tamagno, I.; Shelly, M.; Contestabile, A.; Cancedda, L. Non-Hyperpolarizing GABAB Receptor Activation Regulates Neuronal Migration and Neurite Growth and Specification by cAMP/LKB1. Nat. Commun. 2013, 4, 1800. [Google Scholar] [CrossRef] [PubMed]
Figure 1. Recording of neuronal activity in wt at different developmental stages. (A) Graphic flow chart of experimental procedures. For this experiment, OTCs were prepared from 8 wt and 8 RelncKO mice. An example image during Ca2+ recording of an OTC loaded with OGB-1 at 5 DIV is shown in (B). The ΔF/F0 traces of 6 cells (numbered in B) are displayed in (C), which show mostly synchronized, and less frequent desynchronized and silent cells. The fraction of neurons participating in synchronized, desynchronized, and silent neuronal activity is represented in the box plot in the graph (D). A total of 25 OTCs were used for the analyses at 5 DIV. An example image during Ca2+ recording of an OTC loaded with OGB-1 at 10 DIV is shown in (E). The ΔF/F0 traces of 10 cells (numbered in E) are displayed in (F), which show mostly desynchronized, less frequently synchronized, and few silent cells. The fraction of neurons participating in synchronized, desynchronized, and silent neuronal activity is represented in the box plot in the graph (G). A total 28 OTCs were used for the analyses at 10 DIV. An example image during Ca2+ recording of an OTC loaded with OGB-1 at 14 DIV is shown in (H). The ΔF/F0 traces of 6 cells (numbered in H) are displayed in (I), which show predominantly desynchronized and few synchronized silent cells. The fraction of neurons participating in synchronized, desynchronized, and silent neuronal activity is represented in the box plot in the graph (J). A total of 27 OTCs were used for the analyses at 14 DIV. Scale bars in B, E, and H: 30 μm. One-way-ANOVA on Ranks followed by Tukey’s multiple comparison test; *** p < 0.001. The horizontal lines in the box plots represent the median; whiskers indicate variability outside the upper and lower quartiles; box indicates the middle half of the sample.
Biomolecules 14 00593 g001
Figure 2. Comparison of neuronal activity between wt and RelncKO mice. Confocal merge images of reelin immunofluorescence (in green) and the nuclear marker TO-PRO-3® (in blue) were obtained after 4-OHT treatment for 1–5 days starting from 2 DIV. (A) Both positive control (No 4-OHT) and negative control (no primary antibody against reelin) are shown. Scale bars in A are 50 μm. For Ca2+ recording experiment, OTCs were prepared from 11 wt and 12 RelncKO mice. An example of images taken during Ca2+ recording of a wt OTC loaded with OGB-1 at 14 DIV is shown in (B,C) at different time intervals during the recording (see also Supplementary Movie S1). Note that at 14 DIV the dominant type of activity in wt OTCs is the desynchronized activity. Example images during Ca2+ recording of RelncKO OTC loaded with OGB-1 at 14 DIV in RelncKO OTCs are shown at different time interval during the recording (D,E; see also Supplementary Movie S2). Note that at 14 DIV, the primary type of activity in RelncKO OTCs is the synchronized activity. Scale bars in B-E are 30 μm. The box plot in the graph represents the fraction of neurons participating in synchronized and desynchronized neuronal activity at 7 DIV (F; 21 wt OTCs and 20 RelncKO OTCs), 14 DIV (G; 24 wt OTCs and 23 RelncKO OTCs), and 25 DIV (H; 18 wt OTCs and 17 RelncKO OTCs). The Mann-Whitney U test was used for statistical analysis and the results showed *** p < 0.001. The median is represented by the horizontal lines in the box plots, while the whiskers indicate variability outside the upper and lower quartiles. The box indicates the middle half of the sample.
Biomolecules 14 00593 g002
Figure 3. Neuronal desynchronization in RelncKO OTCs is rescued by secreted reelin. Schematic representation of the co-culture experimental approach. (A): Two co-cultured wt OTCs. (B): A wt OTC co-cultured together with a RelncKO OTC. (C): Two co-cultured RelncKO OTCs. The fraction of neurons participating in synchronized and desynchronized neuronal activity is represented in the box plot in the graph (D). Statistical analysis was performed using one-way ANOVA on ranks followed by Tukey’s multiple comparison test, with a significance level of *** p < 0.001. For this analysis, we used a total of 32 OTCs from wt and 36 OTCs from RelncKO mice. Note that the fraction of synchronized and desynchronized neurons recorded from RelncKO, which were co-cultured with wt OTCs, showed no difference from the wt OTCs that were co-cultured with wt OTCs. The Mann–Whitney U test was used for statistical analysis, and the results showed *** p < 0.001.
Biomolecules 14 00593 g003
Figure 4. Effect of RAP blockade of reelin receptors on network desynchronization. Wt and RelncKO OTCs were recorded before and after bath application of RAP (50 µg). For each experiment, OTCs were prepared from 7 wt mice and 7 RelncKO mice. Control wt OTCs were treated with H2O. A sample image of an OGB-1-loaded OTC used for Ca2+ recording at 14 DIV is shown in (A). The ΔF/F0 traces of 4 cells (numbered in A) are shown in (B), demonstrating that RAP application to wt OTCs dramatically reduced the fraction of desynchronized OTC after RAP treatment. The fraction of neurons involved in synchronized and desynchronized neuronal activity is shown in the box plot in graph (C). In contrast to wt OTCs, neither the proportion of synchronized nor desynchronized neurons was affected by the application of RAP to RelncKO OTCs. A total of 42 OTCs were used for the analyses. The Mann–Whitney U test was used for statistical analysis, and the results showed *** p < 0.001.
Biomolecules 14 00593 g004
Figure 5. Reelin-mediated developmental desynchronization is independent of glutamatergic signaling. OTCs from wt mice were recorded before and after bath application of either APV or CNQX. In each experiment, OTCs were prepared from 8 wt mice. Control wt OTCs were treated with H2O. The fractions of neurons involved in synchronized and desynchronized neuronal activity before and after treatment with APV at 5 DIV are presented in (A), and at 14 DIV are presented in (C). The fractions of neurons participating in synchronized and desynchronized neuronal activity before and after treatment with CNQX at 5 DIV are presented in (B), and at 14 DIV are presented in (D). A total of 52 OTCs were used for analyses of the APV experiments, and 48 OTCs were used for analyses of the CNQX experiments. The Mann–Whitney U test was used for statistical analysis, and the results showed *** p < 0.001.
Biomolecules 14 00593 g005
Figure 6. Reelin-mediated developmental desynchronization is dependent on GABAergic signaling. RelncKO or wt OTCs were recorded before and after bath application of either Gabazine or CGP. In each experiment, OTCs were prepared from 12 wt and 12 RelncKO mice. Control wt or RelncKO OTCs were treated with H2O. An example image during Ca2+ recording of an OTC loaded with OGB-1 at 14 DIV is shown in (A). An example of ΔF/F0 traces of 4 cells (numbered in A) before and after Gabazine treatment is shown in (B). The fraction of neurons involved in synchronized and desynchronized neuronal activity before and after treatment with Gabazine is shown in the box plot in the graph (C). The fraction of neurons participating in synchronized and desynchronized neuronal activity before and after treatment with CGP is shown in the box plot in the graph (D). A total of 36 OTCs were used for analyses of the Gabazine experiments, and 35 OTCs were used for analyses of the CGP experiments. Statistical analysis: one-way ANOVA on ranks followed by Tukey’s multiple comparison test; *** p < 0.001.
Biomolecules 14 00593 g006
Disclaimer/Publisher’s Note: The statements, opinions and data contained in all publications are solely those of the individual author(s) and contributor(s) and not of MDPI and/or the editor(s). MDPI and/or the editor(s) disclaim responsibility for any injury to people or property resulting from any ideas, methods, instructions or products referred to in the content.