
Mouse Exploratory Behaviour in the Open Field with and without NAT-1 EEG Device: Effects of MK801 and Scopolamine

Abstract
:1. Introduction
2. Methods
2.1. Experimental Design
2.2. Animals
2.3. Stereotactic Surgery and Home-Cage Recordings (Experiment 2 Only)
2.4. Drugs and Drug Formulation
2.5. Apparatus and Testing Protocols
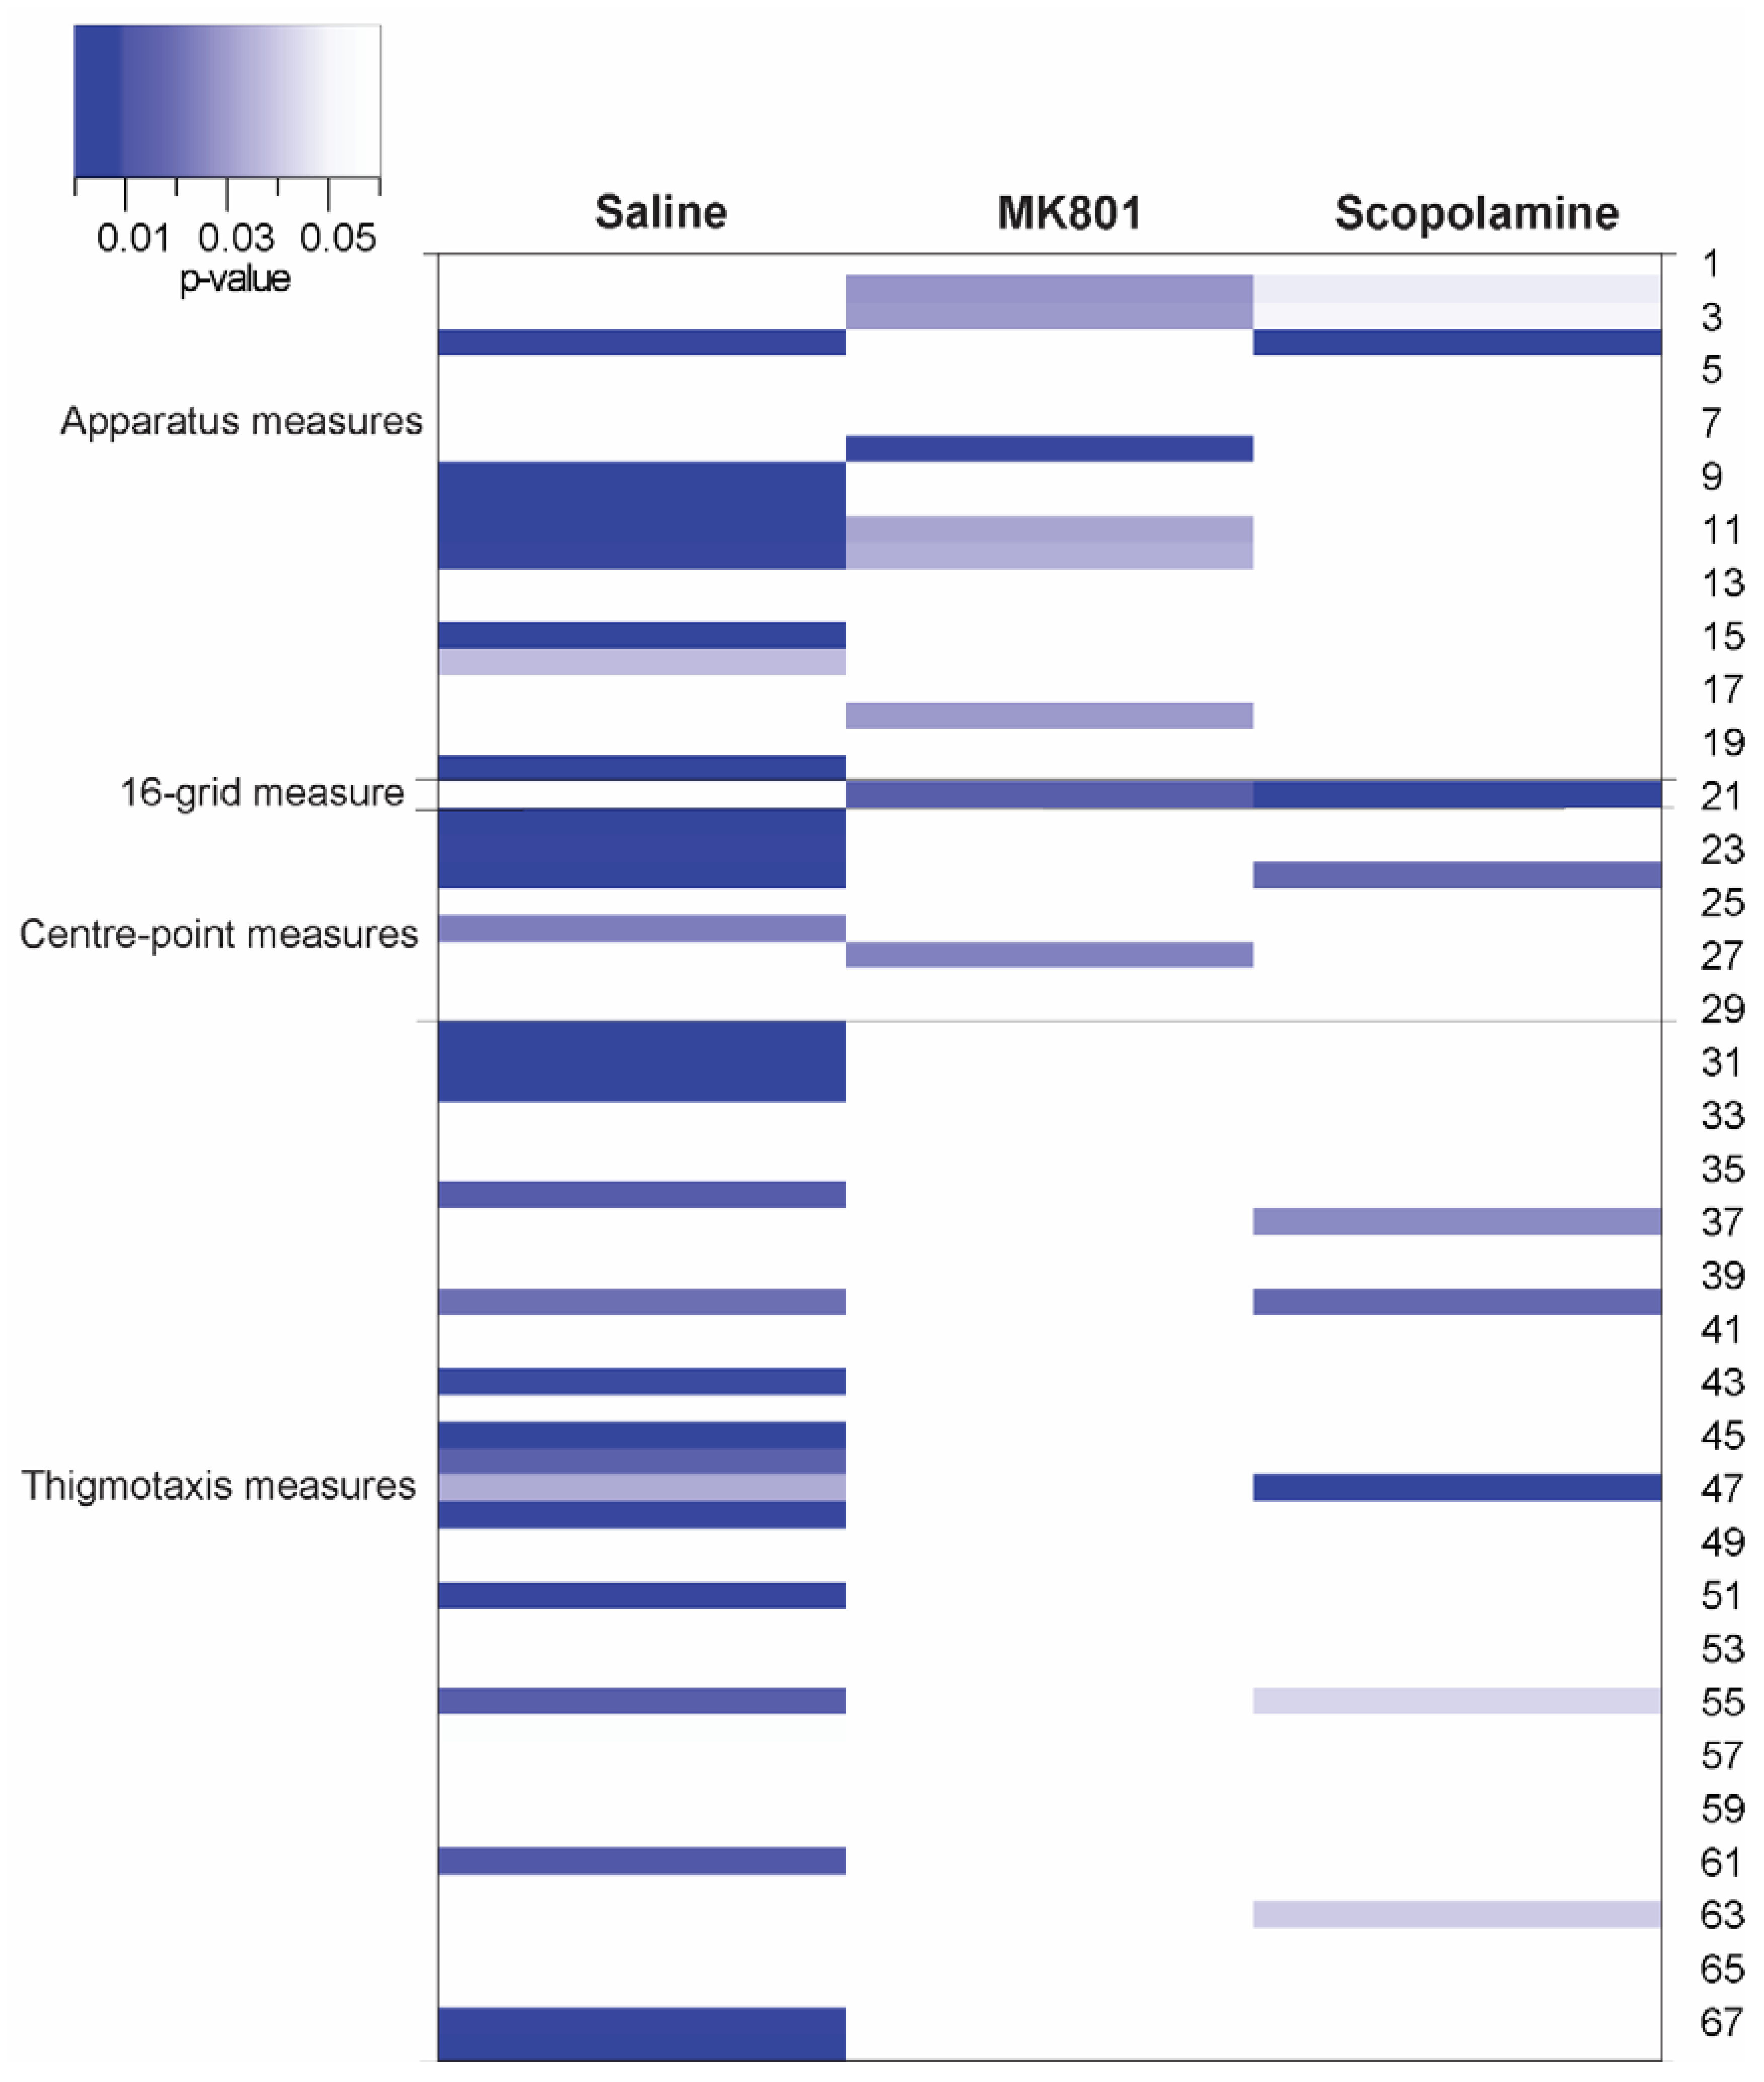
- total distance travelled in the arena;
- line-crossings in a 16-grid overlay;
- meandering (a measurement of an animal’s absolute turn angle over the total distance travelled, which refers to the winding movement of animal);
- frequency of rotations (total of 360 degree turns to the left and 360 degree turns to the right);
- degree of thigmotaxis (a ratio of distance travelled in the periphery zone against the total distance travelled);
- average distance from the centre point (to provide meaningful indications of the general location of the mice without utilizing zonal outlines).
2.6. Exploratory Data Analyses
2.7. Statistical Analysis
3. Results
4. Discussion
Supplementary Materials
Author Contributions
Funding
Institutional Review Board Statement
Informed Consent Statement
Data Availability Statement
Acknowledgments
Conflicts of Interest
References
- Ahnaou, A.; Huysmans, H.; Jacobs, T.; Drinkenburg, W.H.I.M. Cortical EEG Oscillations and Network Connectivity as Efficacy Indices for Assessing Drugs with Cognition Enhancing Potential. Neuropharmacology 2014, 86, 362–377. [Google Scholar] [CrossRef] [PubMed]
- Crispin-Bailey, C.; Moulds, A.; Platt, B.; Hollier, G.P.; Freeman, M.J.; Fargus, A.G. A Miniaturized 4-Channel, 2KSa/Sec Biosignal Data Recorder With 3-Axis Accelerometer and Infra-Red Timestamp Function. In Proceedings of the Seventh International Conference on Sensor Technologies and Applications, Porto, Portugal, 25–29 September 2013. [Google Scholar]
- Crouch, B.; Yeap, J.M.; Pais, B.; Riedel, G.; Platt, B. Of Mice and Motion: Behavioural-EEG Phenotyping of Alzheimer’s Disease Mouse Models. J. Neurosci. Methods 2019, 319, 89–98. [Google Scholar] [CrossRef] [PubMed]
- Dhamne, S.C.; Silverman, J.L.; Super, C.E.; Lammers, S.H.T.; Hameed, M.Q.; Modi, M.E.; Copping, N.A.; Pride, M.C.; Smith, D.G.; Rotenberg, A.; et al. Replicable in Vivo Physiological and Behavioral Phenotypes of the Shank3B Null Mutant Mouse Model of Autism. Mol. Autism 2017, 8, 26. [Google Scholar] [CrossRef] [PubMed]
- Drinkenburg, W.H.I.M.; Ruigt, G.S.F.; Ahnaou, A. Pharmaco-EEG Studies in Animals: An Overview of Contemporary Translational Applications. Neuropsychobiology 2015, 72, 151–164. [Google Scholar] [CrossRef] [PubMed]
- Etholm, L.; Arabadzisz, D.; Lipp, H.P.; Heggelund, P. Seizure Logging: A New Approach to Synchronized Cable-Free EEG and Video Recordings of Seizure Activity in Mice. J. Neurosci. Methods 2010, 192, 254–260. [Google Scholar] [CrossRef]
- Jyoti, A.; Plano, A.; Riedel, G.; Platt, B. EEG, Activity, and Sleep Architecture in a Transgenic AβPP Swe/PSEN1 A246E Alzheimer’s Disease Mouse. J. Alzheimers Dis. 2010, 22, 873–887. [Google Scholar] [CrossRef] [PubMed]
- Platt, B.; Drever, B.; Koss, D.; Stoppelkamp, S.; Jyoti, A.; Plano, A.; Utan, A.; Merrick, G.; Ryan, D.; Melis, V.; et al. Abnormal Cognition, Sleep, EEG and Brain Metabolism in a Novel Knock-in Alzheimer Mouse, PLB1. PLoS ONE 2011, 6, e27068. [Google Scholar] [CrossRef] [PubMed]
- Jiang, Z.; Huxter, J.R.; Bowyer, S.A.; Blockeel, A.J.; Butler, J.; Imtiaz, S.A.; Wafford, K.A.; Phillips, K.G.; Tricklebank, M.D.; Marston, H.M.; et al. TaiNi: Maximizing Research Output Whilst Improving Animals’ Welfare in Neurophysiology Experiments. Sci. Rep. 2017, 7, 8086. [Google Scholar] [CrossRef]
- Rung, J.P.; Carlsson, A.; Rydén Markinhuhta, K.; Carlsson, M.L. (+)-MK-801 Induced Social Withdrawal in Rats; a Model for Negative Symptoms of Schizophrenia. Prog. Neuropsychopharmacol. Biol. Psychiatry 2005, 29, 827–832. [Google Scholar] [CrossRef]
- Svoboda, J.; Stankova, A.; Entlerova, M.; Stuchlik, A. Acute Administration of MK-801 in an Animal Model of Psychosis in Rats Interferes with Cognitively Demanding Forms of Behavioral Flexibility on a Rotating Arena. Front. Behav. Neurosci. 2015, 9, 75. [Google Scholar] [CrossRef]
- van der Staay, F.J.; Rutten, K.; Erb, C.; Blokland, A. Effects of the Cognition Impairer MK-801 on Learning and Memory in Mice and Rats. Behav. Brain Res. 2011, 220, 215–229. [Google Scholar] [CrossRef] [PubMed]
- Wu, J.; Zou, H.; Strong, J.A.; Yu, J.; Zhou, X.; Xie, Q.; Zhao, G.; Jin, M.; Yu, L. Bimodal Effects of MK-801 on Locomotion and Stereotypy in C57BL/6 Mice. Psychopharmacology 2005, 177, 256–263. [Google Scholar] [CrossRef] [PubMed]
- Cheon, S.Y.; Koo, B.-N.; Kim, S.Y.; Kam, E.H.; Nam, J.; Kim, E.J. Scopolamine Promotes Neuroinflammation and Delirium-like Neuropsychiatric Disorder in Mice. Sci. Rep. 2021, 11, 8376. [Google Scholar] [CrossRef] [PubMed]
- Robinson, L.; Harbaran, D.; Riedel, G. Visual Acuity in the Water Maze: Sensitivity to Muscarinic Receptor Blockade in Rats and Mice. Behav. Brain Res. 2004, 151, 277–286. [Google Scholar] [CrossRef] [PubMed]
- Mabunga, D.F.N.; Park, D.; Ryu, O.; Valencia, S.T.; Adil, K.J.L.; Kim, S.; Kwon, K.J.; Shin, C.Y.; Jeon, S.J. Recapitulation of Neuropsychiatric Behavioral Features in Mice Using Acute Low-Dose MK-801 Administration. Exp. Neurobiol. 2019, 28, 697–708. [Google Scholar] [CrossRef] [PubMed]
- Qi, C.; Zou, H.; Zhang, R.; Zhao, G.; Jin, M.; Yu, L. Age-Related Differential Sensitivity to MK-801-Induced Locomotion and Stereotypy in C57BL/6 Mice. Eur. J. Pharmacol. 2008, 580, 161–168. [Google Scholar] [CrossRef] [PubMed]
- Wegener, N.; Nagel, J.; Gross, R.; Chambon, C.; Greco, S.; Pietraszek, M.; Gravius, A.; Danysz, W. Evaluation of Brain Pharmacokinetics of (+)MK-801 in Relation to Behaviour. Neurosci. Lett. 2011, 503, 68–72. [Google Scholar] [CrossRef] [PubMed]
- Zuo, D.Y.; Zhang, Y.H.; Cao, Y.; Wu, C.F.; Tanaka, M.; Wu, Y.L. Effect of Acute and Chronic MK-801 Administration on Extracellular Glutamate and Ascorbic Acid Release in the Prefrontal Cortex of Freely Moving Mice on Line with Open-Field Behavior. Life Sci. 2006, 78, 2172–2178. [Google Scholar] [CrossRef] [PubMed]
- Percie du Sert, N.; Hurst, V.; Ahluwalia, A.; Alam, S.; Avey, M.T.; Baker, M.; Browne, W.J.; Clark, A.; Cuthill, I.C.; Dirnagl, U.; et al. The ARRIVE Guidelines 2.0: Updated Guidelines for Reporting Animal Research. PLoS Biol. 2020, 18, e3000410. [Google Scholar] [CrossRef]
- Balzekas, I.; Hernandez, J.; White, J.; Koh, S. Confounding Effect of EEG Implantation Surgery: Inadequacy of Surgical Control in a Two Hit Model of Temporal Lobe Epilepsy. Neurosci. Lett. 2016, 622, 30–36. [Google Scholar] [CrossRef]
- Paxinos, G.; Franklin, K.B.J. The Mouse Brain in Stereotaxic Coordinates, 2nd ed.; Academic Press: Cambridge, MA, USA, 2001; ISBN 978-0-12-547636-2. [Google Scholar]
- Arroyo-Araujo, M.; Voelkl, B.; Laloux, C.; Novak, J.; Koopmans, B.; Waldron, A.-M.; Seiffert, I.; Stirling, H.; Aulehner, K.; Janhunen, S.K.; et al. Systematic Assessment of the Replicability and Generalizability of Preclinical Findings: Impact of Protocol Harmonization across Laboratory Sites. PLoS Biol. 2022, 20, e3001886. [Google Scholar] [CrossRef]
- Ranjbaran, Z.; Keefer, L.; Stepanski, E.; Farhadi, A.; Keshavarzian, A. The Relevance of Sleep Abnormalities to Chronic Inflammatory Conditions. Inflamm. Res. 2007, 56, 51–57. [Google Scholar] [CrossRef]
- Wang, B.-S.; Wang, X.-J.; Gong, L.-K. The Construction of a Williams Design and Randomization in Cross-Over Clinical Trials Using SAS. J. Stat. Softw. 2009, 29, 1–10. [Google Scholar] [CrossRef]
- Robinson, L.; Spruijt, B.; Riedel, G. Between and within Laboratory Reliability of Mouse Behaviour Recorded in Home-Cage and Open-Field. J. Neurosci. Methods 2018, 300, 10–19. [Google Scholar] [CrossRef]
- Robinson, L.; Riedel, G. Comparison of Automated Home-Cage Monitoring Systems: Emphasis on Feeding Behaviour, Activity and Spatial Learning Following Pharmacological Interventions. J. Neurosci. Methods 2014, 234, 13–25. [Google Scholar] [CrossRef]
- Wahlsten, D. Standardizing Tests of Mouse Behavior: Reasons, Recommendations, and Reality. Physiol. Behav. 2001, 73, 695–704. [Google Scholar] [CrossRef]
- Spruijt, B.M.; Peters, S.M.; de Heer, R.C.; Pothuizen, H.H.J.; van der Harst, J.E. Reproducibility and Relevance of Future Behavioral Sciences Should Benefit from a Cross Fertilization of Past Recommendations and Today’s Technology: “Back to the Future”. J. Neurosci. Methods 2014, 234, 2–12. [Google Scholar] [CrossRef]
- Head, M.L.; Holman, L.; Lanfear, R.; Kahn, A.T.; Jennions, M.D. The Extent and Consequences of P-Hacking in Science. PLoS Biol. 2015, 13, e1002106. [Google Scholar] [CrossRef]
- Gehlenborg, N.; Wong, B. Heat Maps. Nat. Methods 2012, 9, 213. [Google Scholar] [CrossRef]
- Timotius, I.K.; Canneva, F.; Minakaki, G.; Moceri, S.; Plank, A.-C.C.; Casadei, N.; Riess, O.; Winkler, J.; Klucken, J.; Eskofier, B.; et al. Systematic Data Analysis and Data Mining in CatWalk Gait Analysis by Heat Mapping Exemplified in Rodent Models for Neurodegenerative Diseases. J. Neurosci. Methods 2019, 326, 108367. [Google Scholar] [CrossRef]
- Ho, J.; Tumkaya, T.; Aryal, S.; Choi, H.; Claridge-Chang, A. Moving beyond P Values: Everyday Data Analysis with Estimation Plots. Nat. Methods 2019, 16, 565–566. [Google Scholar] [CrossRef]
- Johnston, M.G.; Faulkner, C. A Bootstrap Approach Is a Superior Statistical Method for the Comparison of Non-Normal Data with Differing Variances. New Phytol. 2021, 230, 23–26. [Google Scholar] [CrossRef]
- R Core Team. R: A Language and Environment for Statistical Computing; R Foundation for Statistical Computing: Vienna, Austria, 2023; Available online: https://www.R-Project.Org/ (accessed on 4 June 2020).
- Lundt, A.; Wormuth, C.; Siwek, M.E.; Müller, R.; Ehninger, D.; Henseler, C.; Broich, K.; Papazoglou, A.; Weiergräber, M. EEG Radiotelemetry in Small Laboratory Rodents: A Powerful State-of-the Art Approach in Neuropsychiatric, Neurodegenerative, and Epilepsy Research. Neural Plast. 2016, 2016, 8213878. [Google Scholar] [CrossRef]
- Mansouri, M.T.; Ahmed, M.T.; Cassim, T.Z.; Kreuzer, M.; Graves, M.C.; Fenzl, T.; García, P.S. Telemetric Electroencephalography Recording in Anesthetized Mice—A Novel System Using Minimally-Invasive Needle Electrodes with a Wireless OpenBCITM Cyton Biosensing Board. MethodsX 2023, 10, 102187. [Google Scholar] [CrossRef]
- Papazoglou, A.; Lundt, A.; Wormuth, C.; Ehninger, D.; Henseler, C.; Soós, J.; Broich, K.; Weiergräber, M. Non-Restraining EEG Radiotelemetry: Epidural and Deep Intracerebral Stereotaxic EEG Electrode Placement. J. Vis. Exp. JoVE 2016, 112, 54216. [Google Scholar] [CrossRef]
- Weiergräber, M.; Henry, M.; Hescheler, J.; Smyth, N.; Schneider, T. Electrocorticographic and Deep Intracerebral EEG Recording in Mice Using a Telemetry System. Brain Res. Protoc. 2005, 14, 154–164. [Google Scholar] [CrossRef]
- Pennartz, C.M.A.; Farisco, M.; Evers, K. Indicators and Criteria of Consciousness in Animals and Intelligent Machines: An Inside-Out Approach. Front. Syst. Neurosci. 2019, 13, 25. [Google Scholar] [CrossRef]
- Waldmann, M.R.; Schmid, M.; Wong, J.; Blaisdell, A.P. Rats Distinguish between Absence of Events and Lack of Evidence in Contingency Learning. Anim. Cogn. 2012, 15, 979–990. [Google Scholar] [CrossRef]
- Wiltschko, A.B.; Tsukahara, T.; Zeine, A.; Anyoha, R.; Gillis, W.F.; Markowitz, J.E.; Peterson, R.E.; Katon, J.; Johnson, M.J.; Datta, S.R. Revealing the Structure of Pharmacobehavioral Space through Motion Sequencing. Nat. Neurosci. 2020, 23, 1433–1443. [Google Scholar] [CrossRef]
- Hauglund, N.L.; Kusk, P.; Kornum, B.R.; Nedergaard, M. Meningeal Lymphangiogenesis and Enhanced Glymphatic Activity in Mice with Chronically Implanted EEG Electrodes. J. Neurosci. 2020, 40, 2371–2380. [Google Scholar] [CrossRef]
- Ahuis, T.P.; Symk, M.K.; Laloux, C.; Jack, B.; Aulehner, K.; Waldron, A.-M.; Miljanovic, N.; Seiffert, I.; Dekun, S.; Boulanger, B.; et al. Evaluation of Variation in Preclinical EEG Spectral Power across Multiple Laboratories and Experiments: An EQIPD Study. PLoS ONE 2024, in press.
- Egnor, S.E.R.; Branson, K. Computational Analysis of Behavior. Annu. Rev. Neurosci. 2016, 39, 217–236. [Google Scholar] [CrossRef] [PubMed]
- Blanchard, D.C.; Summers, C.H.; Blanchard, R.J. The Role of Behavior in Translational Models for Psychopathology: Functionality and Dysfunctional Behaviors. Neurosci. Biobehav. Rev. 2013, 37, 1567–1577. [Google Scholar] [CrossRef] [PubMed]
- Lister, R.G. Ethologically-Based Animal Models of Anxiety Disorders. Pharmacol. Ther. 1990, 46, 321–340. [Google Scholar] [CrossRef] [PubMed]
- Peters, S.M.; Pothuizen, H.H.J.; Spruijt, B.M. Ethological Concepts Enhance the Translational Value of Animal Models. Eur. J. Pharmacol. 2015, 759, 42–50. [Google Scholar] [CrossRef] [PubMed]
- Akman, O.; Raol, Y.H.; Auvin, S.; Cortez, M.A.; Kubova, H.; de Curtis, M.; Ikeda, A.; Dudek, F.E.; Galanopoulou, A.S. Methodologic Recommendations and Possible Interpretations of Video-EEG Recordings in Immature Rodents Used as Experimental Controls: A TASK1-WG2 Report of the ILAE/AES Joint Translational Task Force. Epilepsia Open 2018, 3, 437–459. [Google Scholar] [CrossRef]
- Crouch, B.; Sommerlade, L.; Veselcic, P.; Riedel, G.; Schelter, B.; Platt, B. Detection of Time-, Frequency- and Direction-Resolved Communication within Brain Networks. Sci. Rep. 2018, 8, 1825. [Google Scholar] [CrossRef]

| Experiment 1 | Experiment 2 | |
|---|---|---|
| Study Outcome | Pharmacological studies without EEG attachments | Pharmacological studies in animals with EEG attachments |
| Persons involved (Blinder and experimenter) | 2 | 3 |
| Animals | ||
| Strain | C57BL/6J (Wildtype; total n = 29) | C57BL/6J (Wildtype; total n = 37; lost 10, see Section 2.3) |
| Supplier/ Breeder | Charles River Laboratories, Kent, UK | Charles River Laboratories, Kent, UK |
| Transport | By road | By road |
| Specific pathogen free conditions | Yes | Yes |
| Age at arrival and acclimatisation to facility | 10 weeks; 2 weeks of acclimatisation | 9 weeks; 2 weeks of acclimatisation |
| Housing/ husbandry; test room conditions | ||
| Cage type | Conventional shoe box cages with wire top feeders; single housing | Conventional shoe box cages with wire top feeders (only 1 was moved to IVC cage); single housing |
| Enrichment; bedding | Cardboard rolls in all cages; corncob and aspen shavings (ratio 3:1) | No enrichment; corncob and aspen shavings (ratio 3:1) |
| Temperature, humidity | 21 ± 2 °C; 50 ± 5% | 21 ± 2 °C; 50 ± 5% |
| Exposure of animal to handling | Two/three times a day by facility staff | Two/three times a day by facility staff |
| Noise/background noise | Background noise (music) during light phase | Background noise (music) during light phase |
| Dark/light cycle | 12:12 h; start of light phase at 07:00, no red light during dark phase | 12:12 h; start of light phase at 07:00, no red light during dark phase |
| Diet | Normal chow pellets (SDS CRM) and room-temperature water ad libitum | Normal chow pellets (SDS CRM) and room-temperature water ad libitum |
| Handling of cages | Cleaning once every 2 weeks; water and food changed/topped up twice a week. | Cleaning once every 2 weeks; water and food changed/topped up twice a week. |
| Experimental: animals | ||
| Age of animal at start to experiment | 12–13 weeks (at the start of testing) | 10–11 weeks (at surgery) and 12–13 weeks (at the start of testing) |
| Transport of animals in facility | Silent trolley type; cages were not blacked out or covered during transport | Silent trolley type; cages were not blacked out or covered during transport |
| Time of testing, day of week | Commencement at 10:00; testing was conducted from Monday to Thursday on the first week, and Monday to Wednesday on the second week. | Commencement at 10:00; testing was conducted from Monday to Thursday on the first week, and Monday to Wednesday on the second week. |
| Total duration of test phase per day | Approx. 5 h (4 animals tested am, 3 tested pm) | Approx. 5 h (3 animals tested am, 3 tested pm) |
| Animal under diet restrictions during experimental phase | No | No, except during NAT-1 application and drug administration: water bottles were removed, and cage lids were overturned to prevent NAT devices from accidentally wedging onto cage-lids and food-hoppers |
| * Naivety to experimental paradigm and drugs | Naïve to both experimental procedures and drugs | Home cage EEG recording and check, 24 h prior to open field test; naïve to drugs |
| Experimental: surgical protocols | ||
| * Time period between surgeries and start of experiment | N.A. | 2 weeks |
| * Total duration of surgery per day | N.A. | Approx. 7 h/day (commencement at 08.00; surgeries performed only on Mondays and Tuesdays |
| * Anaesthetic | N.A. | Gas anaesthesia (isoflurane) 1.0 mL saline (intraperitoneal) and 0.2 mL of 0.1 mg/kg buprenorphine (subcutaneous; Vetergesic®, Cera Animal Health Ltd., High Wycombe, UK). |
| * Analgesia | N.A. | Drinking water was supplemented with Rimadyl® (Zoetis UK Ltd., Surrey, UK) for 2 days before and after the surgery |
| * Surgical procedure | N.A. | 1 surgeon; 2 assistants |
| Experimental: design and methods/data analysis | ||
| Drug, and concentration | 0.9% saline; 0.65 mg/kg MK801; 0.85 mg/kg scopolamine. Intra-peritoneal administration of 10 mg/kg of treatment. | 0.9% saline; 0.65 mg/kg MK801; 0.85 mg/kg scopolamine. Intra-peritoneal administration of 10 mg/kg of treatment. |
| * Experimenter | 1 female | 2 females and 1 male |
| * Frequency of handling | Handling during drug injections, immediately before and after test. | Handling during NAT-1 applications, drug injections, immediately before and after test. |
| Randomisation method for allocation of animals to test groups | random.org (https://www.random.org/sequences/, accessed 29 October 2018; Williams square design. | random.org (https://www.random.org/sequences/, accessed 19 February 2018); Williams square design. |
| Blinding of experimenter to group allocation | Yes. | Yes. |
| Standardisation of animal handling across experimenters (protocol and training) | Yes (1 in randomisation and blinding, 1 in drug administration and experiment) | Yes (2 involved in NAT-1 device application and drug administration and randomisation, 1 in experiment) |
| Software used in recording and data extraction | Automatic tracking software, ANY-Maze (v.5.1) | Automatic tracking software, ANY-Maze (v.5.1) |
| Inclusion and exclusion criteria | No inclusion criteria. Exclusion criteria based on analysis using Grubb’s method before re-evaluation of animal behaviour (video). | No inclusion criteria. Exclusion criteria based on analysis using Grubb’s method before re-evaluation of animal behaviour (video). |
| Statistical analysis | Bootstrapped one-way ANOVA and t-test for conventional analysis; repeated measures ANOVA for binned analysis; and estimation statistics to determine the magnitude of differences. | Bootstrapped one-way ANOVA and t-test for conventional analysis; repeated measures ANOVA for binned analysis; and estimation statistics to determine the magnitude of differences. |
| Experimental: complexity of test arena | ||
| Test arena | Square; 50 × 50 × 50 cm; white Perspex | Square; 50 × 50 × 50 cm; white Perspex |
| Average light intensity in test arena | 320 lux | 320 lux |
| Environment in test room (temperature, humidity and decibels relative to the carrier) | 20 ± 2 °C; 48 ± 5%; 30 ± 5 dBc; dedicted sound-attenuated room | 20 ± 2 °C; 48 ± 5%; 30 ± 5 dBc; dedicted sound-attenuated room |
| Number of test arenas used at any given time | 1 | 1 |
| Cleaning agents | Non-fragrant and alcohol-free wet wipes | Non-fragrant and alcohol-free wet wipes |
| Parameters | Drug | Between-Experiment Comparisons | E2 minus E1 | ||
|---|---|---|---|---|---|
| E1 | E2 | p-Value | Mean Difference [95% CI] | ||
| Mean ± SD | Mean ± SD | ||||
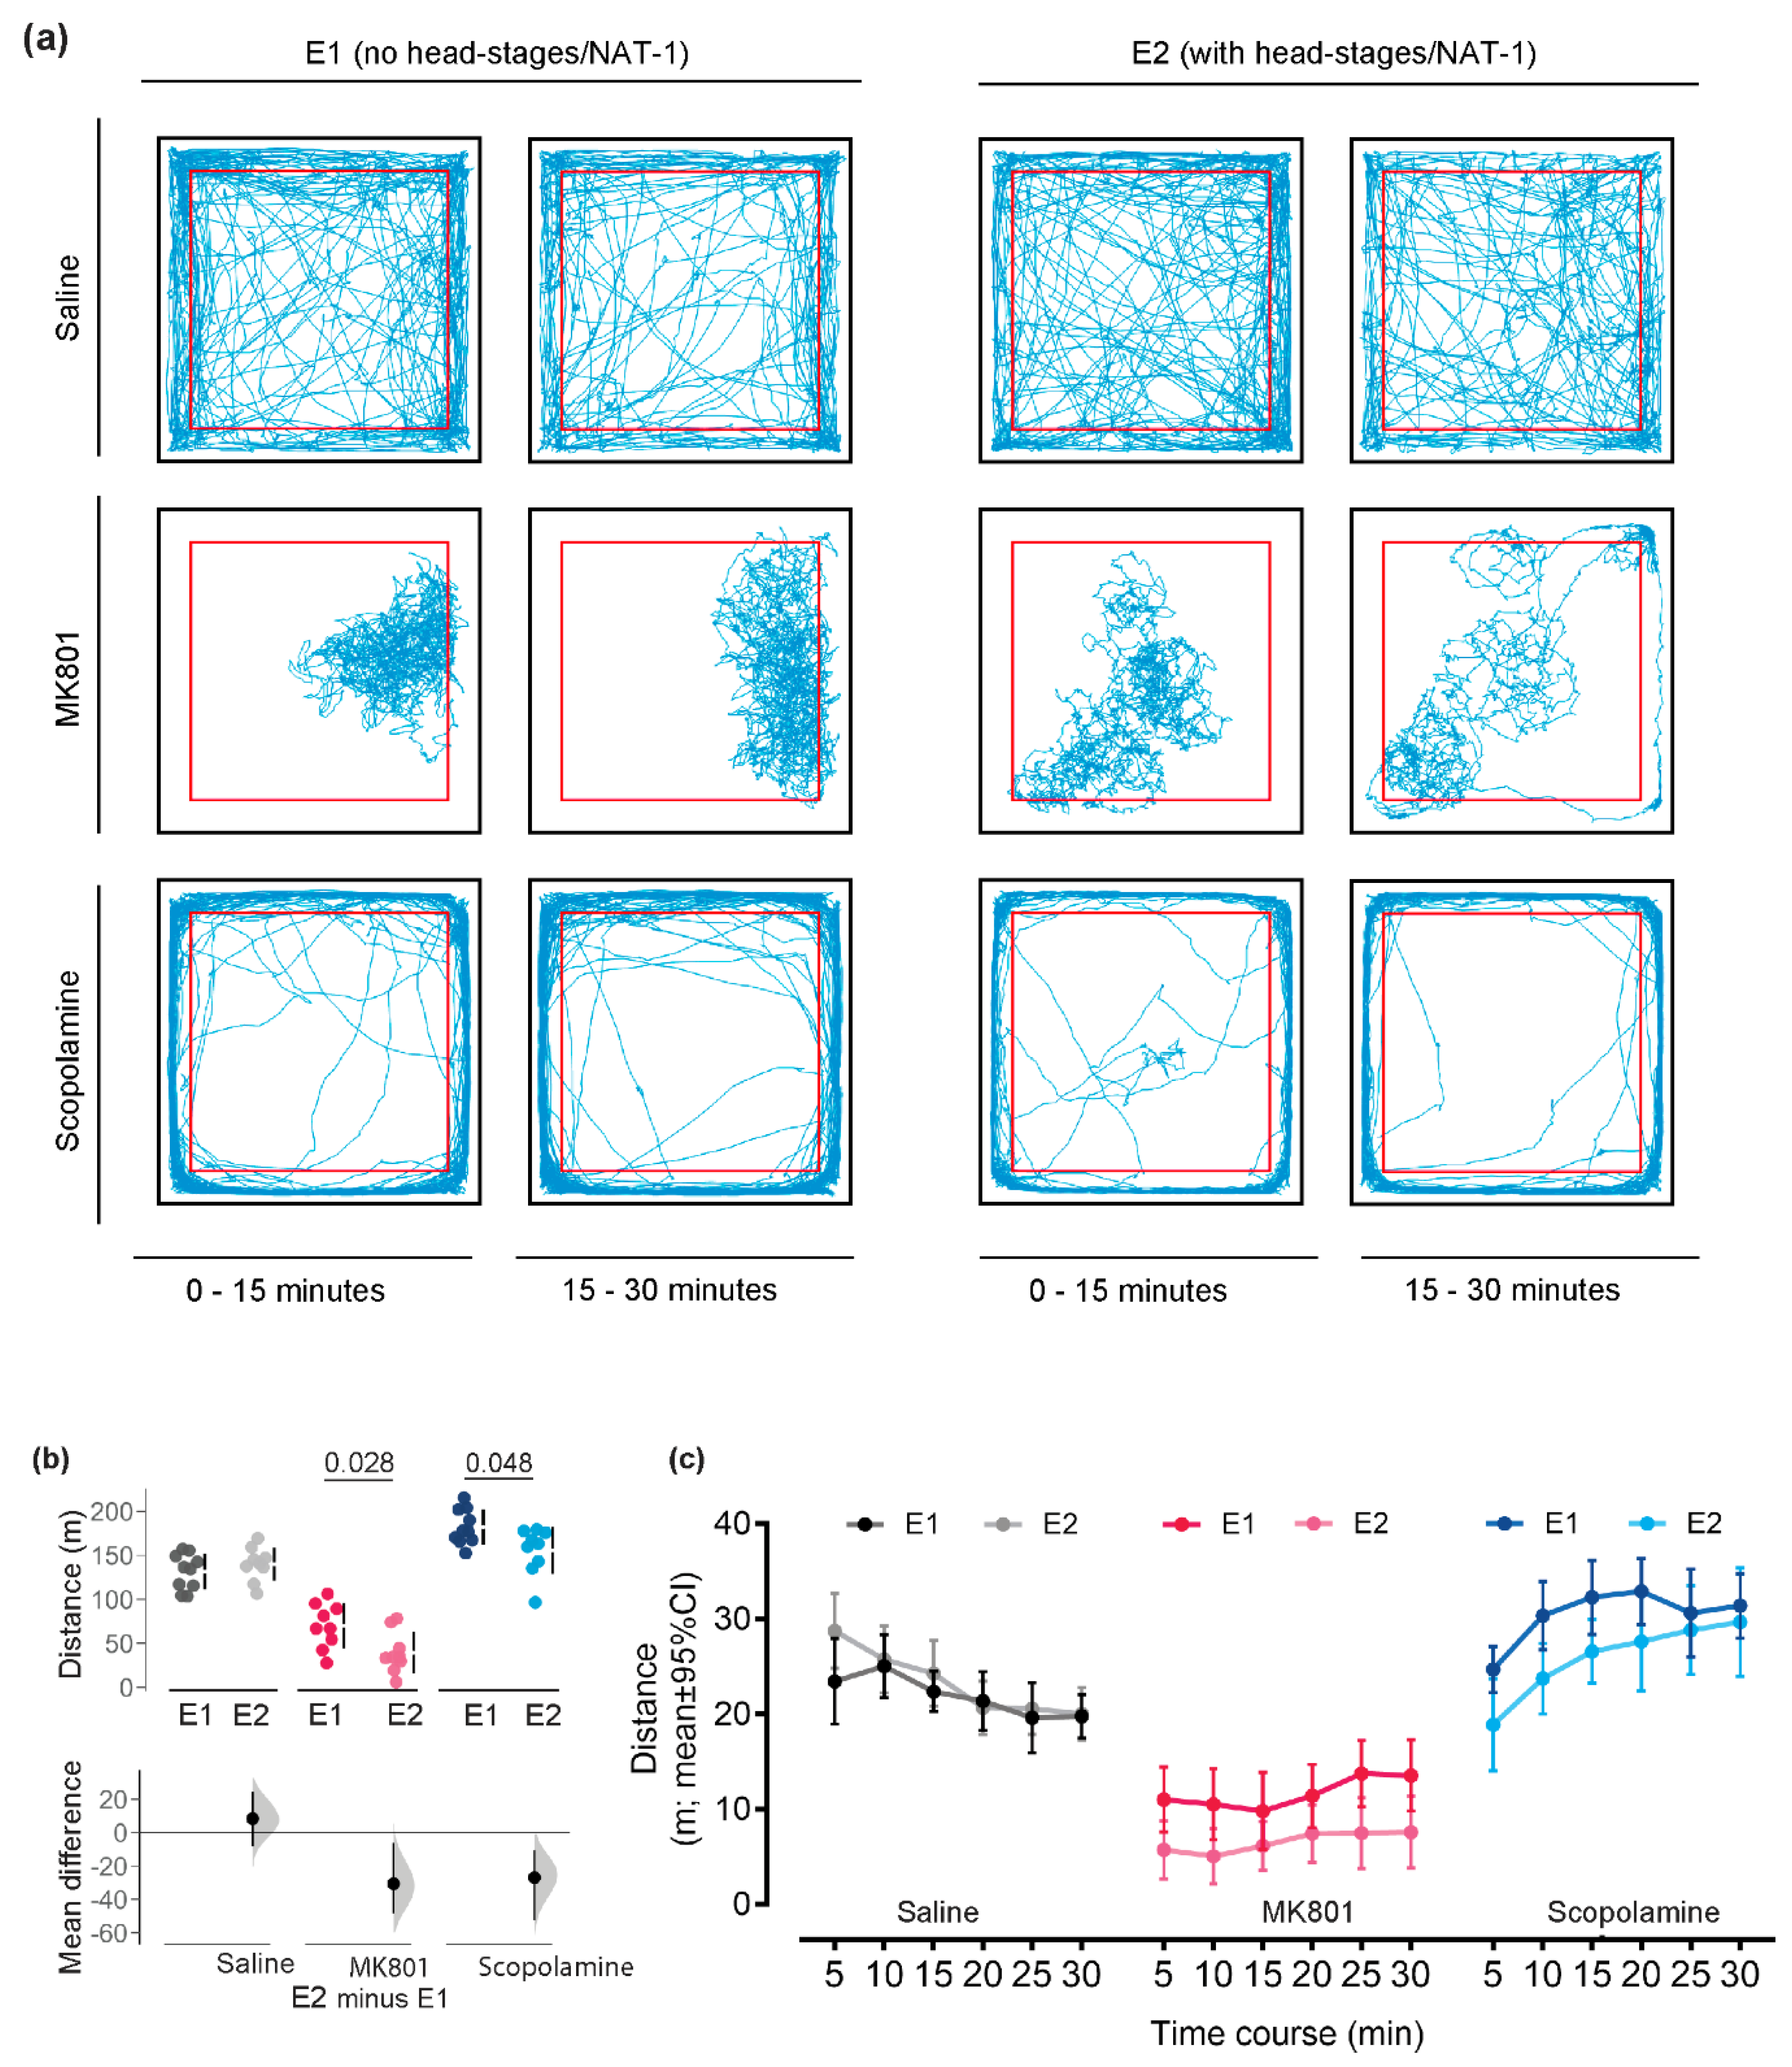
| Distance moved (m) | Saline | 131.6 ± 20.2 | 139.9 ± 19.2 | 0.347 | 8.4 [−8.1; 24.6] |
| MK801 | 70.0 ± 25.6 | 39.3 ± 23.5 | 0.028 | −30.6 [−48.6; −6.0] | |
| Scopolamine | 182.2 ± 20.0 | 155.2 ± 26.7 | 0.048 | −26.9 [−52.3; −10.4] | |
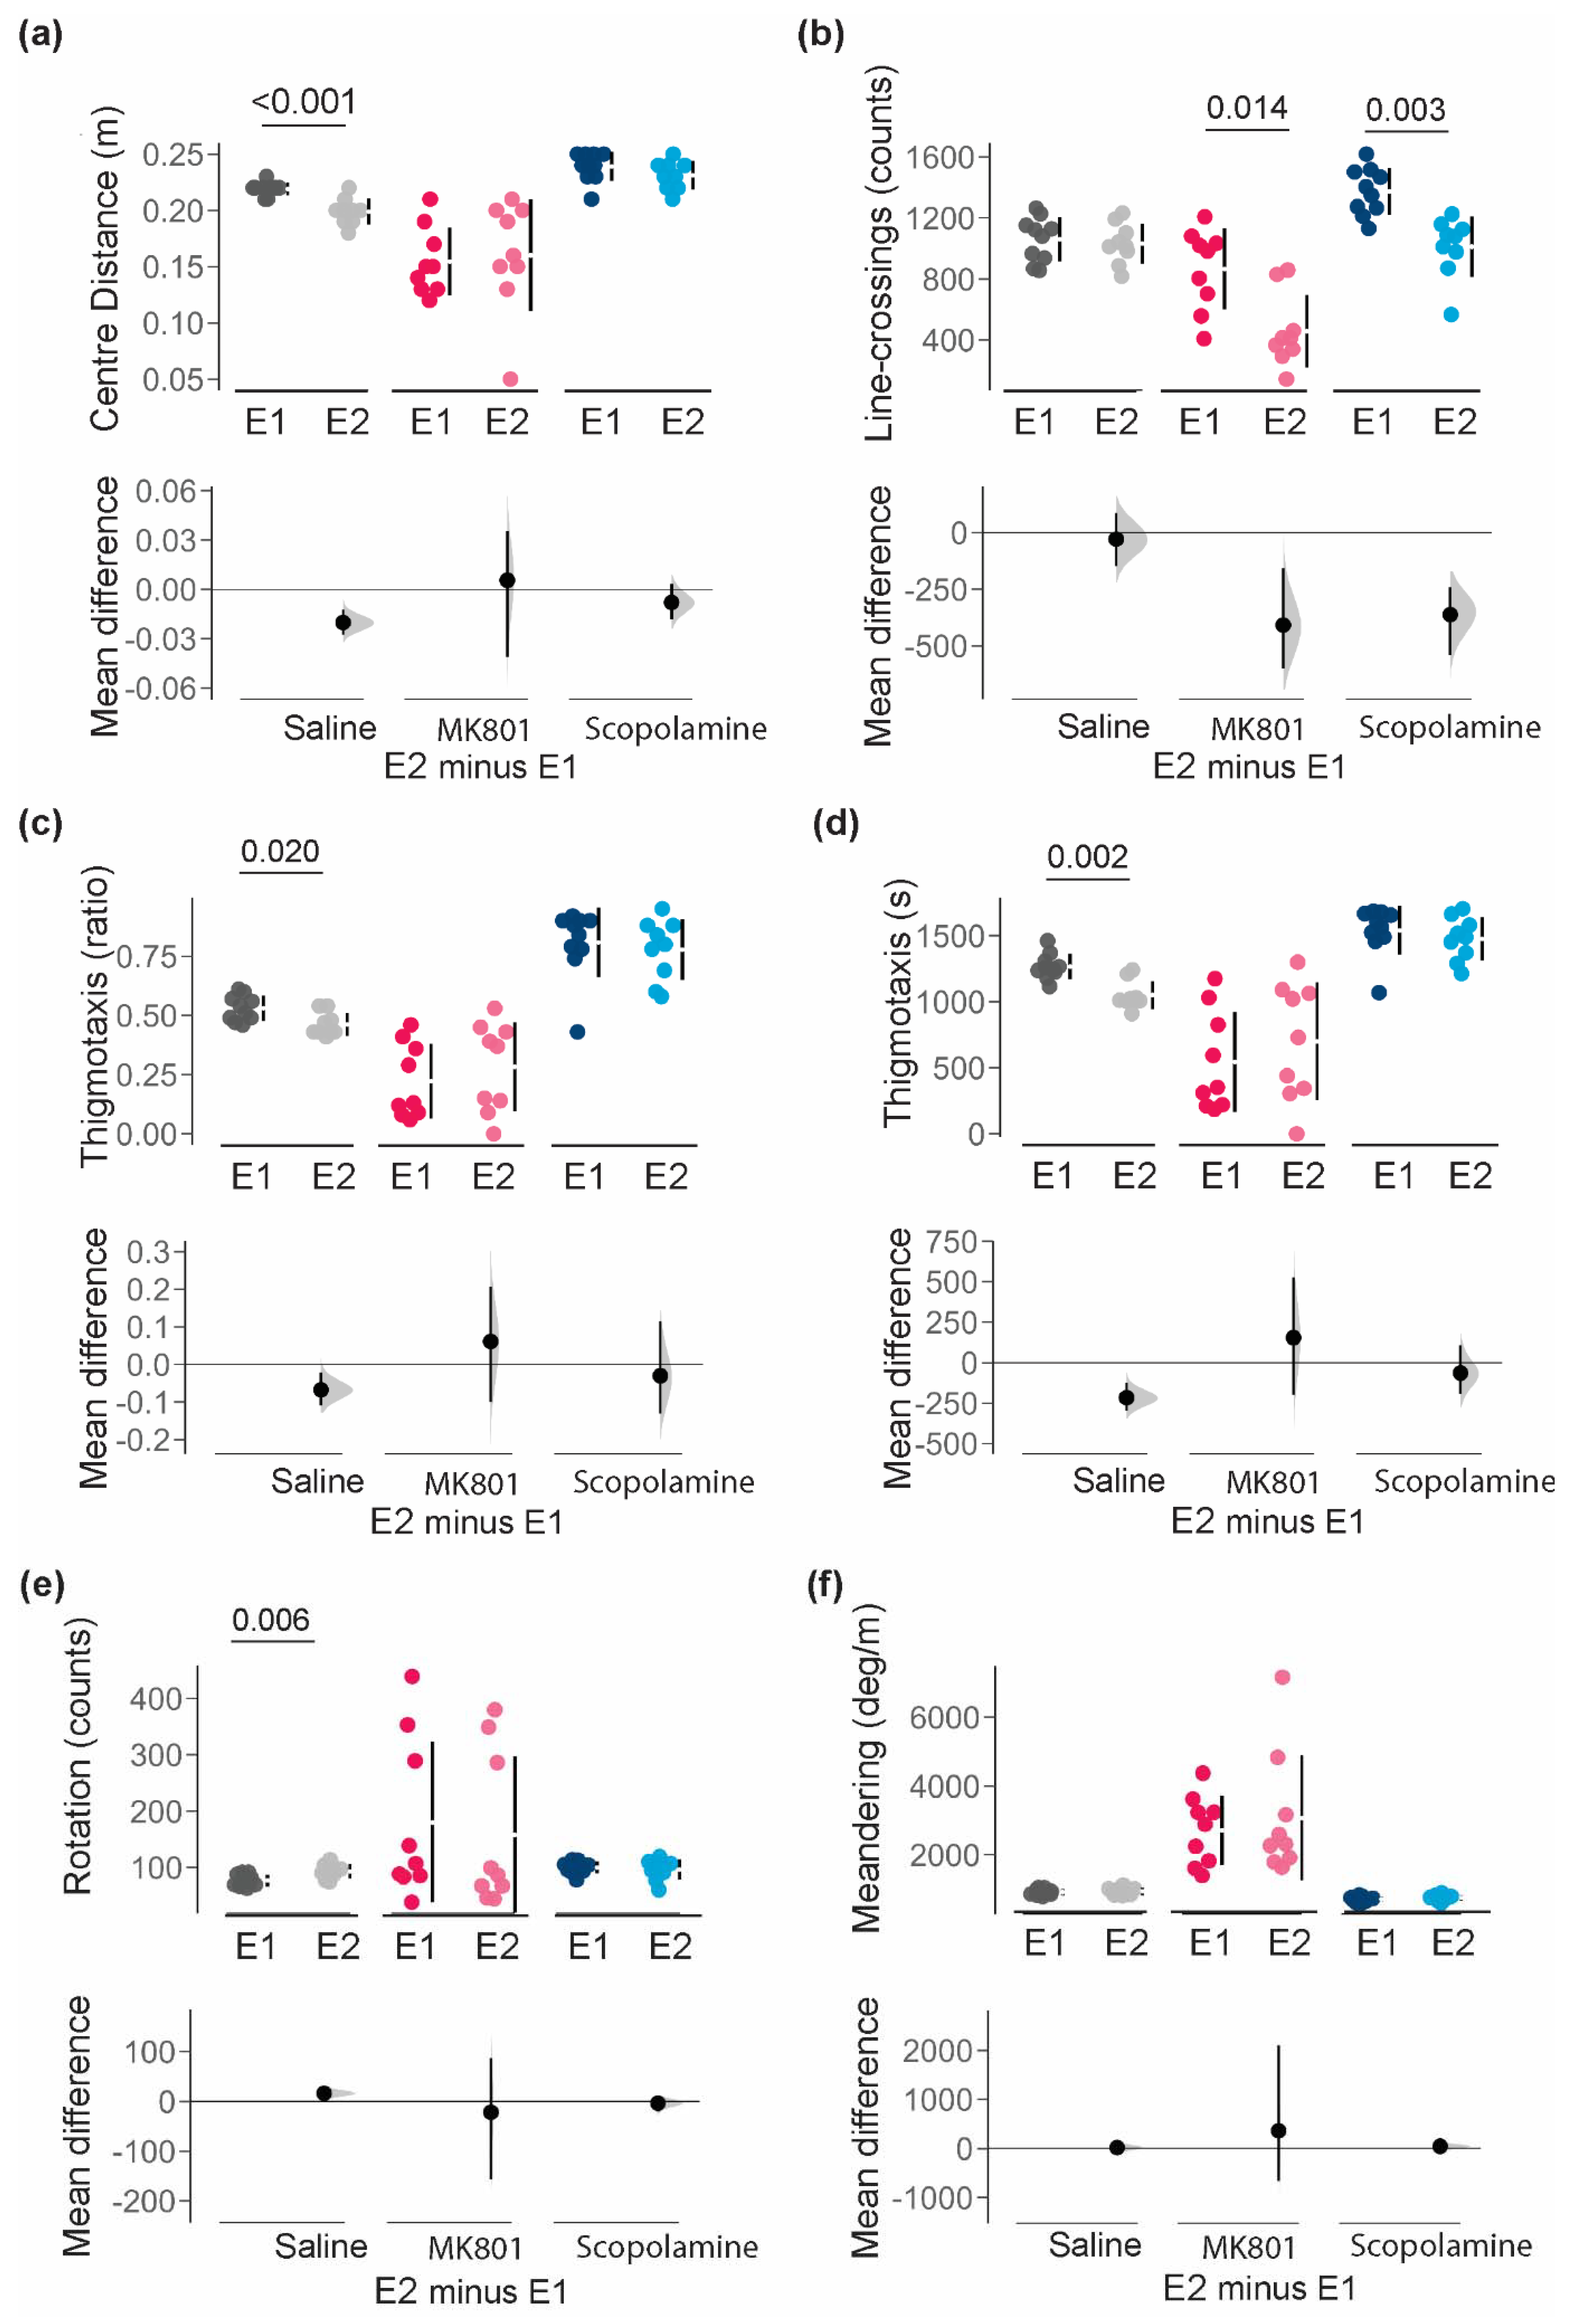
| Average distance from centre-point (cm) | Saline | 0.218 ± 0.007 | 0.199 ± 0.010 | 0.001 | −0.020 [−0.026; −0.012] |
| MK801 | 0.155 ± 0.030 | 0.161 ± 0.050 | 0.782 | 0.006 [−0.041; 0.036] | |
| Scopolamine | 0.237 ± 0.013 | 0.230 ± 0.012 | 0.275 | −0.008 [−0.018; 0.003] | |
| Thigmotaxis (ratio) | Saline | 0.532 ± 0.052 | 0.463 ± 0.049 | 0.020 | −0.068 [−0.11; −0.021] |
| MK801 | 0.223 ± 0.157 | 0.285 ± 0.189 | 0.471 | 0.061 [−0.1; 0.207] | |
| Scopolamine | 0.807 ± 0.147 | 0.777 ± 0.128 | 0.667 | −0.030 [−0.131; 0.115] | |
| Thigmotaxis (s) | Saline | 1266.1 ± 96.3 | 1050.0 ± 105.7 | 0.002 | −216 [−295; −123] |
| MK801 | 545.1 ± 379.3 | 699.2 ± 445.6 | 0.435 | 154 [−199; 527] | |
| Scopolamine | 1539.8 ± 184.5 | 1475.8 ± 163.8 | 0.437 | −64 [−192; 107] | |
| Line-crossings | Saline | 1060.6 ± 145.3 | 1030.0 ± 132.49 | 0.442 | −28.6 [−148; 86.7] |
| MK801 | 866.9 ± 265.1 | 458.3 ± 238.5 | 0.014 | −409 [−600; −158] | |
| Scopolamine | 1374.2 ± 154.3 | 1012.0 ± 196.9 | 0.003 | −362 [−541; −242] | |
| Meandering (degrees/s) | Saline | 912.5 ± 89.5 | 932.0 ± 107.4 | 0.668 | 19.5 [−63.6; 102] |
| MK801 | 2716.4 ± 1008.4 | 3077 ± 1813.4 | 0.603 | 361 [−663.0; 2100] | |
| Scopolamine | 705.6 ± 73.5 | 750.4 ± 89.2 | 0.325 | 44.7 [−25.6; 117] | |
| Rotation | Saline | 76.5 ± 10.5 | 98.8 ± 12.5 | 0.006 | 16.3 [5.6; 26] |
| MK801 | 180.1 ± 142.7 | 158.2 ± 138.3 | 0.758 | −21.9 [−156.0; 87.5] | |
| Scopolamine | 99.8 ± 10.6 | 96.1 ± 18.2 | 0.623 | −3.7 [−18.9; 7.16] | |
Disclaimer/Publisher’s Note: The statements, opinions and data contained in all publications are solely those of the individual author(s) and contributor(s) and not of MDPI and/or the editor(s). MDPI and/or the editor(s) disclaim responsibility for any injury to people or property resulting from any ideas, methods, instructions or products referred to in the content. |
© 2024 by the authors. Licensee MDPI, Basel, Switzerland. This article is an open access article distributed under the terms and conditions of the Creative Commons Attribution (CC BY) license (https://creativecommons.org/licenses/by/4.0/).
Share and Cite
Lim, C.J.M.; Bray, J.; Janhunen, S.K.; Platt, B.; Riedel, G. Mouse Exploratory Behaviour in the Open Field with and without NAT-1 EEG Device: Effects of MK801 and Scopolamine. Biomolecules 2024, 14, 1008. https://doi.org/10.3390/biom14081008
Lim CJM, Bray J, Janhunen SK, Platt B, Riedel G. Mouse Exploratory Behaviour in the Open Field with and without NAT-1 EEG Device: Effects of MK801 and Scopolamine. Biomolecules. 2024; 14(8):1008. https://doi.org/10.3390/biom14081008
Chicago/Turabian StyleLim, Charmaine J. M., Jack Bray, Sanna K. Janhunen, Bettina Platt, and Gernot Riedel. 2024. "Mouse Exploratory Behaviour in the Open Field with and without NAT-1 EEG Device: Effects of MK801 and Scopolamine" Biomolecules 14, no. 8: 1008. https://doi.org/10.3390/biom14081008