
Effects of Obesity and Exercise on Hepatic and Pancreatic Lipid Content and Glucose Metabolism: PET Studies in Twins Discordant for BMI

 , , , ,
  , ,
, ,
Abstract

1. Introduction
2. Materials and Methods
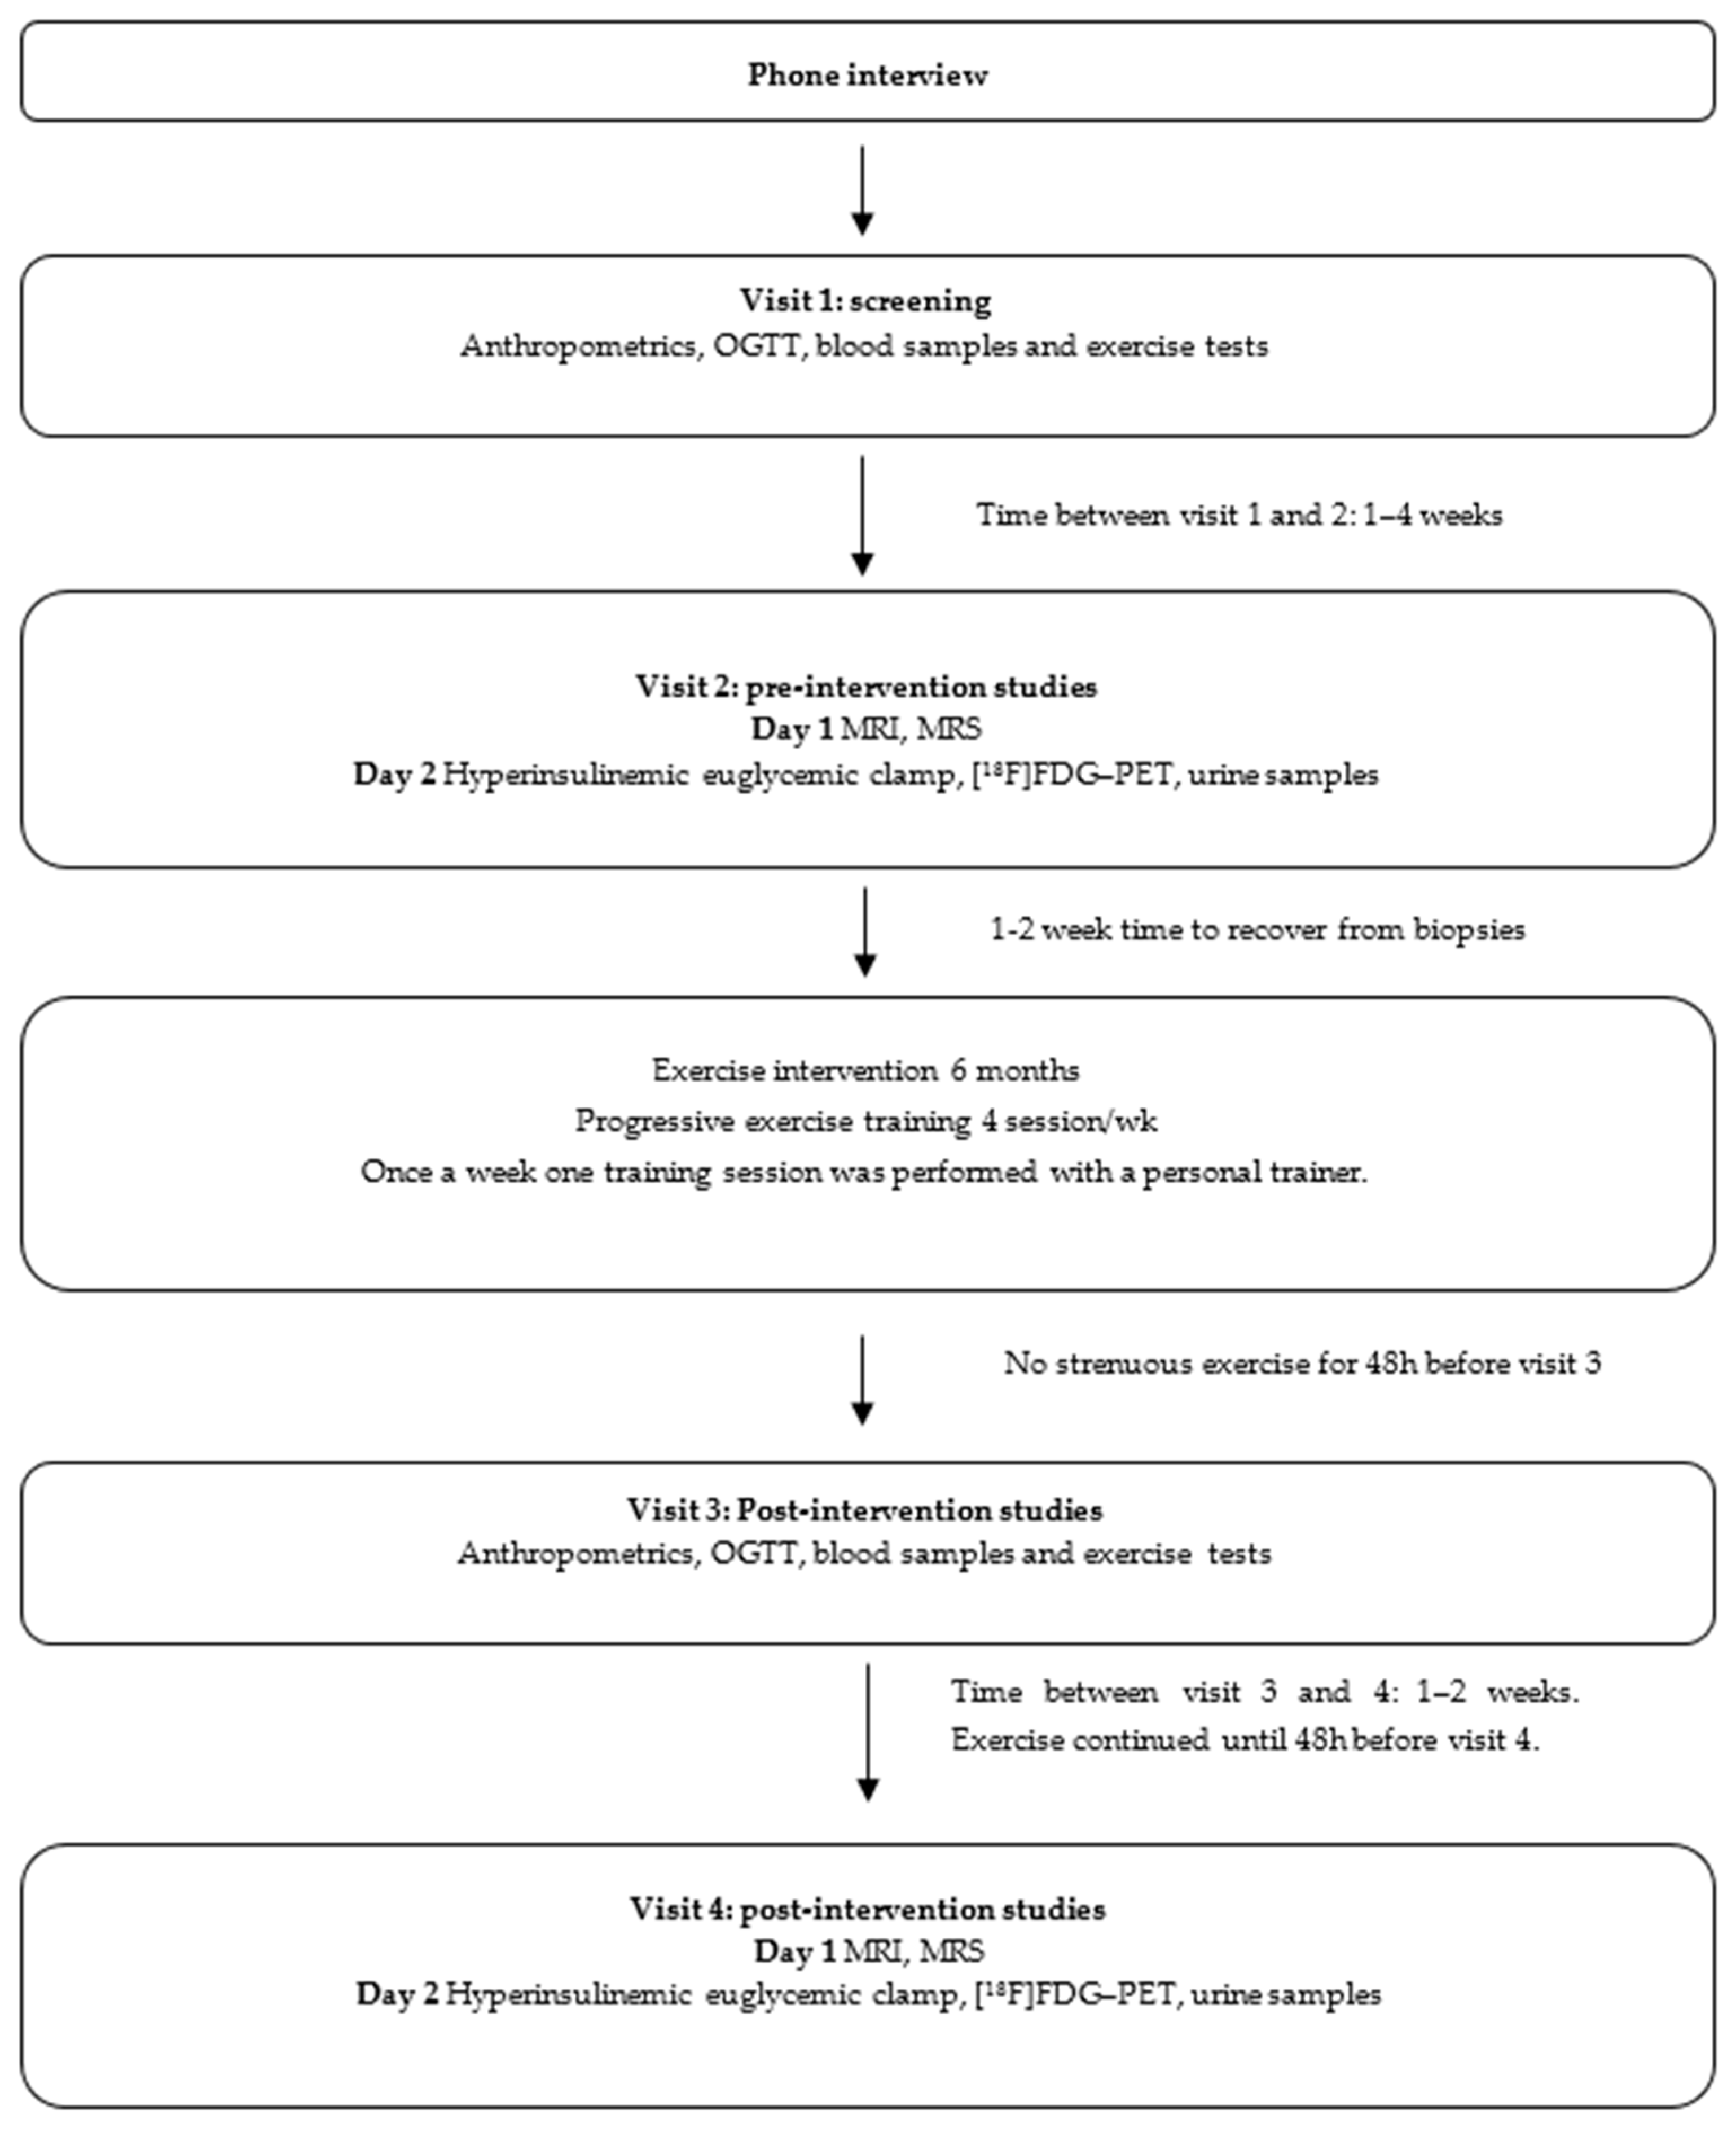
2.1. Study Design
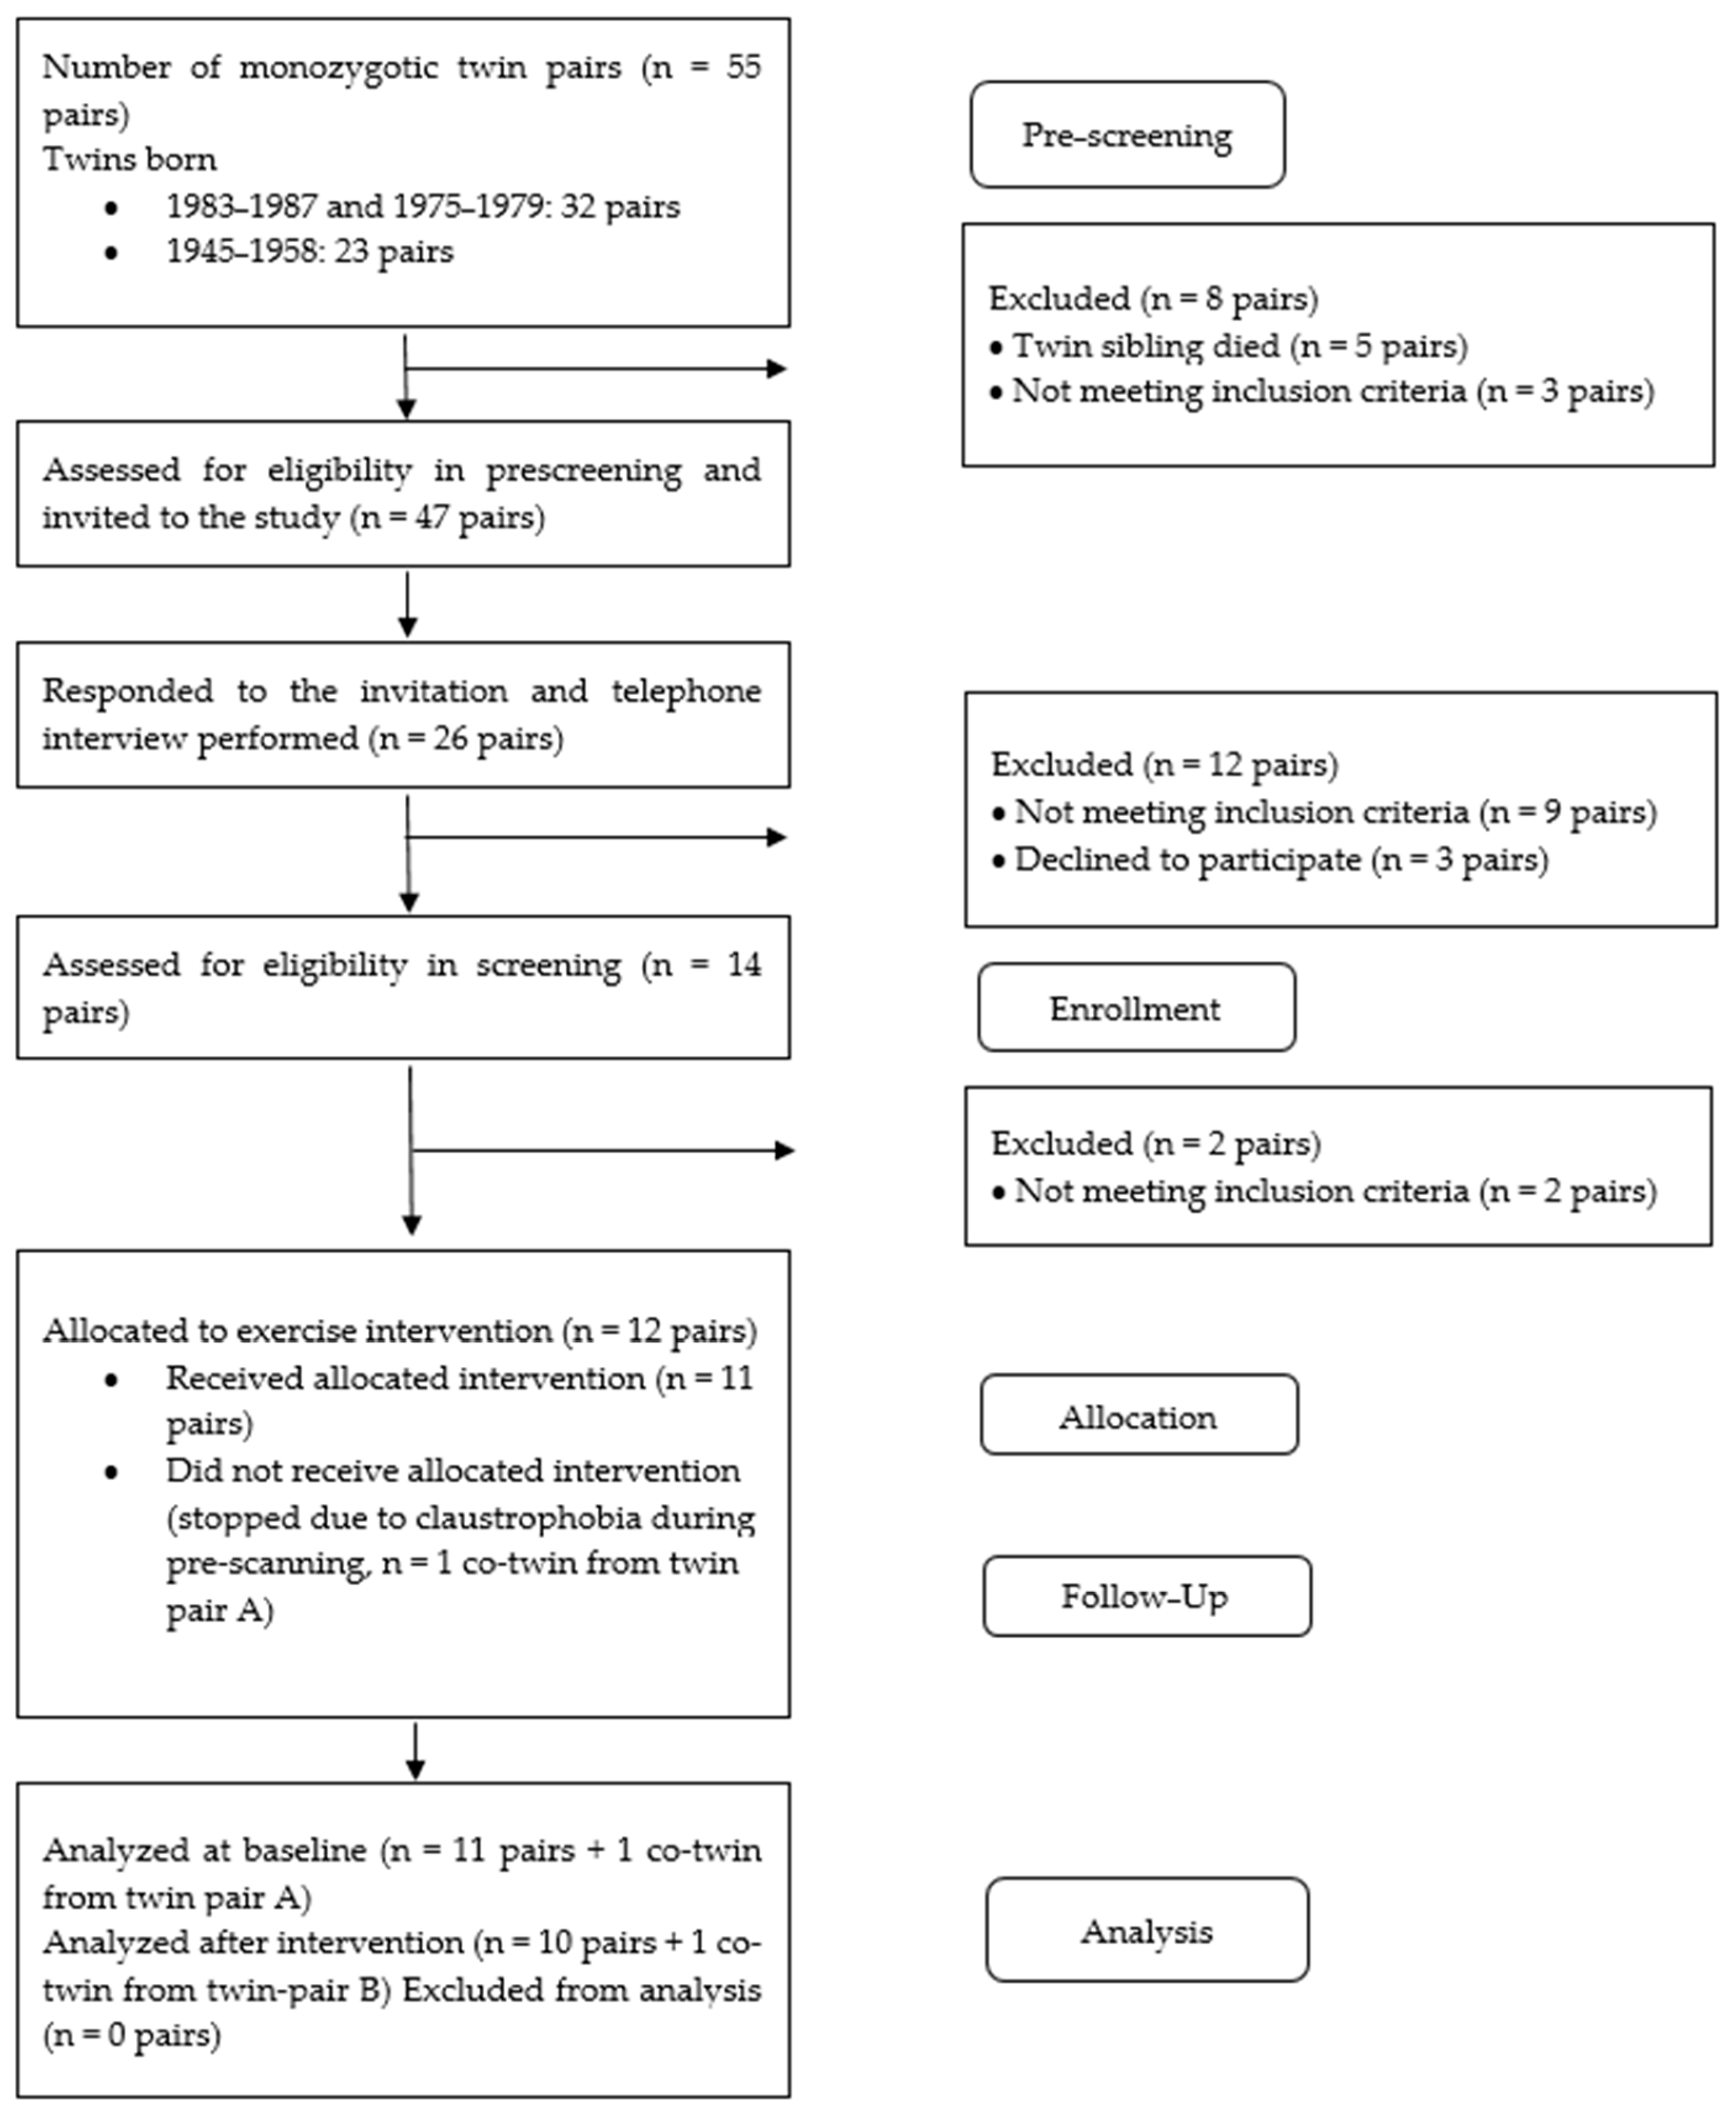
2.2. Participants
2.3. Training Intervention
2.4. Blood Tests
2.5. Euglycemic-Hyperinsulinemic Clamp and FDG-PET Study
2.6. Magnetic Resonance Imaging and Magnetic Resonance Spectroscopy
2.7. Oral Glucose Tolerance Test
2.8. Body Composition and Peak Aerobic Exercise Capacity Test
2.9. Statistical Analysis and Modeling
3. Results
4. Discussion
5. Conclusions
Author Contributions
Funding
Institutional Review Board Statement
Informed Consent Statement
Data Availability Statement
Acknowledgments
Conflicts of Interest
Abbreviations
| ALP | alkaline phosphatase |
| ALT | alanine aminotransferase |
| [18F]FDG | 2-[18F]Fluoro-D-glucose |
| GT | gamma-glutamyl transferase |
| HIIT | high-intensity interval training |
| IFG | impaired fasting glucose |
| IGT | impaired glucose tolerance |
| ISR | insulin secretion rate |
| LFC | liver fat content |
| MRI | magnetic resonance imaging |
| MRS | magnetic resonance spectroscopy |
| M-value | whole-body insulin-stimulated glucose uptake |
| OGTT | oral glucose tolerance test |
| PET | positron emission tomography |
| PFC | pancreatic fat content |
| PFR | potentiation factor ratio |
| SD | standard deviation |
| V̇O2peak | peak exercise capacity |
References
- Aune, D.; Norat, T.; Leitzmann, M.; Tonstad, S.; Vatten, L.J. Physical activity and the risk of type 2 diabetes: A systematic review and dose–response meta-analysis. Eur. J. Epidemiol. 2015, 30, 529–542. [Google Scholar] [CrossRef] [PubMed]
- Ismail, L.; Materwala, H.; Al Kaabi, J. Association of risk factors with type 2 diabetes: A systematic review. Comput. Struct. Biotechnol. J. 2021, 19, 1759–1785. [Google Scholar] [CrossRef]
- GBD 2015 Obesity Collaborators; Afshin, A.; Forouzanfar, M.H.; Reitsma, M.B.; Sur, P.; Estep, K.; Lee, A.; Marczak, L.; Mokdad, A.H.; Moradi-Lakeh, M.; et al. Health Effects of Overweight and Obesity in 195 Countries over 25 Years. N. Engl. J. Med. 2017, 377, 13–27. [Google Scholar] [CrossRef] [PubMed]
- Iozzo, P.; Hallsten, K.; Oikonen, V.; Virtanen, K.A.; Kemppainen, J.; Solin, O.; Ferrannini, E.; Knuuti, J.; Nuutila, P. Insulin-Mediated Hepatic Glucose Uptake Is Impaired in Type 2 Diabetes: Evidence for a Relationship with Glycemic Control. J. Clin. Endocrinol. Metab. 2003, 88, 2055–2060. [Google Scholar] [CrossRef]
- Borra, R.; Lautamäki, R.; Parkkola, R.; Komu, M.; Sijens, P.E.; Hällsten, K.; Bergman, J.; Iozzo, P.; Nuutila, P. Inverse association between liver fat content and hepatic glucose uptake in patients with type 2 diabetes mellitus. Metabolism 2008, 57, 1445–1451. [Google Scholar] [CrossRef]
- Immonen, H.; Hannukainen, J.C.; Iozzo, P.; Soinio, M.; Salminen, P.; Saunavaara, V.; Borra, R.; Parkkola, R.; Mari, A.; Lehtimäki, T.; et al. Effect of bariatric surgery on liver glucose metabolism in morbidly obese diabetic and non-diabetic patients. J. Hepatol. 2014, 60, 377–383. [Google Scholar] [CrossRef] [PubMed]
- Lee, J.S.; Kim, S.H.; Jun, D.W.; Han, J.H.; Jang, E.C.; Park, J.Y.; Son, B.K.; Kim, S.H.; Jo, Y.J.; Park, Y.S.; et al. Clinical implications of fatty pancreas: Correlations between fatty pancreas and metabolic syndrome. World J. Gastroenterol. 2009, 15, 1869–1875. [Google Scholar] [CrossRef]
- Type 2 Diabetes: Does Pancreatic Fat Really Matter?—Guglielmi—2018—Diabetes/Metabolism Research and Reviews—Wiley Online Library. Available online: https://onlinelibrary.wiley.com/doi/10.1002/dmrr.2955 (accessed on 1 March 2022).
- Tushuizen, M.E.; Bunck, M.C.; Pouwels, P.J.; Bontemps, S.; van Waesberghe, J.H.T.; Schindhelm, R.K.; Mari, A.; Heine, R.J.; Diamant, M. Pancreatic Fat Content and β-Cell Function in Men with and without Type 2 Diabetes. Diabetes Care 2007, 30, 2916–2921. [Google Scholar] [CrossRef]
- Heni, M.; Machann, J.; Staiger, H.; Schwenzer, N.F.; Peter, A.; Schick, F.; Claussen, C.D.; Stefan, N.; Häring, H.-U.; Fritsche, A. Pancreatic fat is negatively associated with insulin secretion in individuals with impaired fasting glucose and/or impaired glucose tolerance: A nuclear magnetic resonance study. Diabetes Metab. Res. Rev. 2010, 26, 200–205. [Google Scholar] [CrossRef]
- Wen, Y.; Chen, C.; Kong, X.; Xia, Z.; Kong, W.; Si, K.; Han, P.; Vivian Liu, W.; Li, X. Pancreatic fat infiltration, β-cell function and insulin resistance: A study of the young patients with obesity. Diabetes Res. Clin. Pract. 2022, 187, 109860. [Google Scholar] [CrossRef]
- Heiskanen, M.A.; Motiani, K.K.; Mari, A.; Saunavaara, V.; Eskelinen, J.-J.; Virtanen, K.A.; Koivumäki, M.; Löyttyniemi, E.; Nuutila, P.; Kalliokoski, K.K.; et al. Exercise training decreases pancreatic fat content and improves beta cell function regardless of baseline glucose tolerance: A randomised controlled trial. Diabetologia 2018, 61, 1817–1828. [Google Scholar] [CrossRef] [PubMed]
- Hallsworth, K.; Fattakhova, G.; Hollingsworth, K.G.; Thoma, C.; Moore, S.; Taylor, R.; Day, C.P.; Trenell, M.I. Resistance exercise reduces liver fat and its mediators in non-alcoholic fatty liver disease independent of weight loss. Gut 2011, 60, 1278–1283. [Google Scholar] [CrossRef]
- Johnson, N.A.; Sachinwalla, T.; Walton, D.W.; Smith, K.; Armstrong, A.; Thompson, M.W.; George, J. Aerobic exercise training reduces hepatic and visceral lipids in obese individuals without weight loss. Hepatology 2009, 50, 1105–1112. [Google Scholar] [CrossRef]
- Hannukainen, J.C.; Borra, R.; Linderborg, K.; Kallio, H.; Kiss, J.; Lepomäki, V.; Kalliokoski, K.K.; Kujala, U.M.; Kaprio, J.; Heinonen, O.J.; et al. Liver and pancreatic fat content and metabolism in healthy monozygotic twins with discordant physical activity. J. Hepatol. 2011, 54, 545–552. [Google Scholar] [CrossRef]
- Motiani, K.K.; Savolainen, A.M.; Toivanen, J.; Eskelinen, J.-J.; Yli-Karjanmaa, M.; Virtanen, K.A.; Saunavaara, V.; Heiskanen, M.A.; Parkkola, R.; Haaparanta-Solin, M.; et al. Effects of short-term sprint interval and moderate-intensity continuous training on liver fat content, lipoprotein profile, and substrate uptake: A randomized trial. J. Appl. Physiol. 2019, 126, 1756–1768. [Google Scholar] [CrossRef]
- Naukkarinen, J.; Rissanen, A.; Kaprio, J.; Pietiläinen, K.H. Causes and consequences of obesity: The contribution of recent twin studies. Int. J. Obes. 2012, 36, 1017–1024. [Google Scholar] [CrossRef] [PubMed]
- Solomon, T.P.J. Sources of Inter-individual Variability in the Therapeutic Response of Blood Glucose Control to Exercise in Type 2 Diabetes: Going Beyond Exercise Dose. Front. Physiol. 2018, 9, 896. [Google Scholar] [CrossRef]
- Martin-Rodriguez, E.; Guillen-Grima, F.; Martí, A.; Brugos-Larumbe, A. Comorbidity associated with obesity in a large population: The APNA study. Obes. Res. Clin. Pract. 2015, 9, 435–447. [Google Scholar] [CrossRef] [PubMed]
- Luo, H.; Liu, Y.; Tian, X.; Zhao, Y.; Liu, L.; Zhao, Z.; Luo, L.; Zhang, Y.; Jiang, X.; Liu, Y.; et al. Association of obesity with cardiovascular disease in the absence of traditional risk factors. Int. J. Obes. 2024, 48, 263–270. [Google Scholar] [CrossRef]
- Angelantonio, E.D.; Bhupathiraju, S.N.; Wormser, D.; Gao, P.; Kaptoge, S.; de Gonzalez, A.B.; Cairns, B.J.; Huxley, R.; Jackson, C.L.; Joshy, G.; et al. Body-mass index and all-cause mortality: Individual-participant-data meta-analysis of 239 prospective studies in four continents. Lancet 2016, 388, 776–786. [Google Scholar] [CrossRef]
- Aune, D.; Sen, A.; Prasad, M.; Norat, T.; Janszky, I.; Tonstad, S.; Romundstad, P.; Vatten, L.J. BMI and all cause mortality: Systematic review and non-linear dose-response meta-analysis of 230 cohort studies with 3.74 million deaths among 30.3 million participants. BMJ 2016, 353, i2156. [Google Scholar] [CrossRef] [PubMed]
- Chen, Y.; Zhang, X.-P.; Yuan, J.; Cai, B.; Wang, X.-L.; Wu, X.-L.; Zhang, Y.-H.; Zhang, X.-Y.; Yin, T.; Zhu, X.-H.; et al. Association of body mass index and age with incident diabetes in Chinese adults: A population-based cohort study. BMJ Open 2018, 8, e021768. [Google Scholar] [CrossRef]
- Ohno, R.; Kaneko, H.; Ueno, K.; Aoki, H.; Okada, A.; Kamiya, K.; Suzuki, Y.; Matsuoka, S.; Fujiu, K.; Takeda, N.; et al. Association of Body Mass Index and Its Change with Incident Diabetes Mellitus. J. Clin. Endocrinol. Metab. 2023, 108, 3145–3153. [Google Scholar] [CrossRef]
- van Dongen, J.; Willemsen, G.; Heijmans, B.T.; Neuteboom, J.; Kluft, C.; Jansen, R.; Penninx, B.W.J.; Slagboom, P.E.; de Geus, E.J.C.; Boomsma, D.I. Longitudinal weight differences, gene expression, and blood biomarkers in BMI discordant identical twins. Int. J. Obes. 2015, 39, 899–909. [Google Scholar] [CrossRef]
- Heiskanen, M.A.; Honkala, S.M.; Hentilä, J.; Ojala, R.; Lautamäki, R.; Koskensalo, K.; Lietzén, M.S.; Saunavaara, V.; Saunavaara, J.; Helmiö, M.; et al. Systemic cross-talk between brain, gut, and peripheral tissues in glucose homeostasis: Effects of exercise training (CROSSYS). Exercise training intervention in monozygotic twins discordant for body weight. BMC Sports Sci. Med. Rehabil. 2021, 13, 16. [Google Scholar] [CrossRef] [PubMed]
- Heinonen, S.; Saarinen, L.; Naukkarinen, J.; Rodríguez, A.; Frühbeck, G.; Hakkarainen, A.; Lundbom, J.; Lundbom, N.; Vuolteenaho, K.; Moilanen, E.; et al. Adipocyte morphology and implications for metabolic derangements in acquired obesity. Int. J. Obes. 2014, 38, 1423–1431. [Google Scholar] [CrossRef]
- American Diabetes Association 2. Classification and Diagnosis of Diabetes. Diabetes Care 2014, 38, S8–S16. [Google Scholar] [CrossRef]
- Voipio-Pulkki, L.-M.; Nuutila, P.; Knuuti, M.J.; Ruotsalainen, U.; Haaparanta, M.; Teräs, M.; Wegelius, U.; Koivisto, V.A. Heart and Skeletal Muscle Glucose Disposal in Type 2 Diabetic Patients as Determined by Positron Emission Tomography. J. Nucl. Med. 1993, 34, 2064–2067. [Google Scholar] [PubMed]
- DeFronzo, R.A.; Tobin, J.D.; Andres, R. Glucose clamp technique: A method for quantifying insulin secretion and resistance. Am. J. Physiol. 1979, 237, E214–E223. [Google Scholar] [CrossRef]
- Provencher, S.W. Estimation of metabolite concentrations from localized in vivo proton NMR spectra. Magn. Reson. Med. 1993, 30, 672–679. [Google Scholar] [CrossRef]
- Mari, A.; Tura, A.; Gastaldelli, A.; Ferrannini, E. Assessing insulin secretion by modeling in multiple-meal tests: Role of potentiation. Diabetes 2002, 51 (Suppl. S1), S221–S226. [Google Scholar] [CrossRef] [PubMed]
- Mari, A.; Schmitz, O.; Gastaldelli, A.; Oestergaard, T.; Nyholm, B.; Ferrannini, E. Meal and oral glucose tests for assessment of beta -cell function: Modeling analysis in normal subjects. Am. J. Physiol. Endocrinol. Metab. 2002, 283, E1159–E1166. [Google Scholar] [CrossRef] [PubMed]
- Pár, A.; Pár, G. Advances in the pathogenesis of non alcoholic fatty liver disease. Orv. Hetil. 2017, 158, 882–894. [Google Scholar] [CrossRef] [PubMed]
- Effects of Moderate and Vigorous Exercise on Nonalcoholic Fatty Liver Disease: A Randomized Clinical Trial|Lifestyle Behaviors|JAMA Internal Medicine|JAMA Network. Available online: https://jamanetwork-com.ezproxy.utu.fi/journals/jamainternalmedicine/fullarticle/2530904 (accessed on 22 June 2022).
- Szczepaniak, L.S.; Nurenberg, P.; Leonard, D.; Browning, J.D.; Reingold, J.S.; Grundy, S.; Hobbs, H.H.; Dobbins, R.L. Magnetic resonance spectroscopy to measure hepatic triglyceride content: Prevalence of hepatic steatosis in the general population. Am. J. Physiol.-Endocrinol. Metab. 2005, 288, E462–E468. [Google Scholar] [CrossRef]
- Nozaki, Y.; Petersen, M.C.; Zhang, D.; Vatner, D.F.; Perry, R.J.; Abulizi, A.; Haedersdal, S.; Zhang, X.-M.; Butrico, G.M.; Samuel, V.T.; et al. Metabolic control analysis of hepatic glycogen synthesis in vivo. Proc. Natl. Acad. Sci. USA 2020, 117, 8166–8176. [Google Scholar] [CrossRef]
- Guzzardi, M.A.; Guiducci, L.; Campani, D.; La Rosa, F.; Cacciato Insilla, A.; Bartoli, A.; Cabiati, M.; De Sena, V.; Del Ry, S.; Burchielli, S.; et al. Leptin resistance before and after obesity: Evidence that tissue glucose uptake underlies adipocyte enlargement and liver steatosis/steatohepatitis in Zucker rats from early-life stages. Int. J. Obes. 2022, 46, 50–58. [Google Scholar] [CrossRef]
- Keramida, G.; Potts, J.; Bush, J.; Verma, S.; Dizdarevic, S.; Peters, A.M. Accumulation of (18)F-FDG in the liver in hepatic steatosis. AJR Am. J. Roentgenol. 2014, 203, 643–648. [Google Scholar] [CrossRef]
- Batallés, S.M.; Villavicencio, R.L.; Quaranta, A.; Burgos, L.; Trezzo, S.; Staffieri, R.; Pezzotto, S.M. Variations of the hepatic SUV in relation to the body mass index in whole body PET-CT studies. Rev. Española Med. Nucl. Imagen Mol. Engl. Ed. 2013, 32, 26–32. [Google Scholar] [CrossRef]
- Fredrickson, G.; Barrow, F.; Dietsche, K.; Parthiban, P.; Khan, S.; Robert, S.; Demirchian, M.; Rhoades, H.; Wang, H.; Adeyi, O.; et al. Exercise of high intensity ameliorates hepatic inflammation and the progression of NASH. Mol. Metab. 2021, 53, 101270. [Google Scholar] [CrossRef]
- Fentiman, I.S. Gamma-glutamyl transferase: Risk and prognosis of cancer. Br. J. Cancer 2012, 106, 1467–1468. [Google Scholar] [CrossRef]
- Wiegand, S.; Thamm, M.; Kiess, W.; Körner, A.; Reinehr, T.; Krude, H.; Hoffmeister, U.; Holl, R.W. on behalf of the APV Study Group and the German Competence Network Adipositas. Gamma-glutamyl Transferase Is Strongly Associated with Degree of Overweight and Sex. J. Pediatr. Gastroenterol. Nutr. 2011, 52, 635–638. [Google Scholar] [CrossRef]
- Rossi, A.P.; Fantin, F.; Zamboni, G.A.; Mazzali, G.; Rinaldi, C.A.; Del Giglio, M.; Di Francesco, V.; Barillari, M.; Pozzi-Mucelli, R.; Zamboni, M. Predictors of Ectopic Fat Accumulation in Liver and Pancreas in Obese Men and Women. Obesity 2011, 19, 1747–1754. [Google Scholar] [CrossRef] [PubMed]
- Saisho, Y.; Butler, A.; Meier, J.; Monchamp, T.; Allen-Auerbach, M.; Rizza, R.; Butler, P. Pancreas volumes in humans from birth to age one hundred taking into account sex, obesity, and presence of type-2 diabetes. Clin. Anat. 2007, 20, 933–942. [Google Scholar] [CrossRef]
- Zhang, C.-L.; Wang, J.-J.; Li, J.-N.; Yang, Y. Nonalcoholic fatty pancreas disease: An emerging clinical challenge. World J. Clin. Cases 2021, 9, 6624–6638. [Google Scholar] [CrossRef] [PubMed]
- Lee, Y.; Lingvay, I.; Szczepaniak, L.S.; Ravazzola, M.; Orci, L.; Unger, R.H. Pancreatic steatosis: Harbinger of type 2 diabetes in obese rodents. Int. J. Obes. 2010, 34, 396–400. [Google Scholar] [CrossRef] [PubMed]
- Reaven, G.M. Role of Insulin Resistance in Human. Insul. Resist. 1988, 37, 1595–1607. [Google Scholar]
- Slentz, C.A.; Tanner, C.J.; Bateman, L.A.; Durheim, M.T.; Huffman, K.M.; Houmard, J.A.; Kraus, W.E. Effects of Exercise Training Intensity on Pancreatic β-Cell Function. Diabetes Care 2009, 32, 1807–1811. [Google Scholar] [CrossRef]
- Ferrannini, E.; Gastaldelli, A.; Miyazaki, Y.; Matsuda, M.; Pettiti, M.; Natali, A.; Mari, A.; DeFronzo, R.A. Predominant role of reduced beta-cell sensitivity to glucose over insulin resistance in impaired glucose tolerance. Diabetologia 2003, 46, 1211–1219. [Google Scholar] [CrossRef]
- Naukkarinen, J.; Heinonen, S.; Hakkarainen, A.; Lundbom, J.; Vuolteenaho, K.; Saarinen, L.; Hautaniemi, S.; Rodriguez, A.; Frühbeck, G.; Pajunen, P.; et al. Characterising metabolically healthy obesity in weight-discordant monozygotic twins. Diabetologia 2014, 57, 167–176. [Google Scholar] [CrossRef]


| Heavier | Leaner | |||
|---|---|---|---|---|
| Twin Pair ID | BMI (kg/m2) | Glycemic Status | BMI (kg/m2) | Glycemic Status |
| 1 | 42.6 | normal | 40.1 | IFG |
| 2 | 36.7 | IFG | 24.1 | normal |
| 3 | 30.8 | IFG, IGT | 25.4 | normal |
| 4 | 42.2 | IFG | 25.4 | normal |
| 5 | 33.8 | IFG | 27.8 | IFG, IGT |
| 6 | 30.1 | normal | 27.9 | normal |
| 7 | 47.0 | IFG | 42.7 | normal |
| 8 | 25.2 | IFG, IGT | 20.8 | IFG, IGT |
| 9 | 35.9 | normal | 27.4 | IFG |
| 10 | 47.7 | IFG | 29.3 | IFG |
| 11 | 31.1 | normal | 28.2 | normal |
| 12 | 37.2 | normal | 30.1 | normal |
| Heavier | Leaner | p-Value | |||||
|---|---|---|---|---|---|---|---|
| Pre | Post | Pre | Post | Baseline | Time | Time*group | |
| n | 12 | 11 | 12 | 10 | |||
| Male/female | 4/8 | 4/7 | 4/8 | 4/6 | |||
| Age, years | 40.4 (37.5;43.4) | 40.4 (37.5;43.4) | |||||
| Weight, kg | 108.7 (91.8;125.7) | 108.0 (93.1;122.9) | 86.4 (72.4;100.3) | 86.9 (72.6;101.2) | 0.001 * | 0.95 | 0.37 |
| BMI, kg/m2 | 36.7 (32.2;41.1) | 36.4 (32.4;40.4) | 29.1 (25.1;33.1) | 29.3 (25.3;33.2) | 0.001 * | 0.92 | 0.41 |
| Waist circumference, cm | 117.7 (106.3;129.2) | 115.0 (106.8;123.1) | 96.5 (84.7;108.3) | 94.4 (82.3;106.6) | 0.001 * | 0.17 | 0.74 |
| Fat-free mass, kg | 35.9 (31.0;40.7) | 36.2 (32.1;40.3) | 33.1 (29.0;37.2) | 33.9 (30.6;37.2) | 0.003 *† | 0.14 | 0.10 |
| Fat mass, kg | 45.5 (33.8;57.3) | 44.5 (34.6;54.4) | 27.8 (17.9;37.7) | 26.9 (14.4;39.4) | 0.001 *† | 0.70 † | 0.97 † |
| Visceral fat mass, kg | 5.9 (4.5;7.3) | 5.5 (4.4;6.5) | 3.1 (2.0;4.3) | 3.2 (2.0;4.4) | 0.002 *† | 0.07 | 0.29 |
| Fat percentage, % | 40.6 (35.5;45.7) | 40.0 (35.9;44.1) | 30.4 (24.0;36.9) | 29.5 (20.3;38.7) | 0.001 * | 0.37 | 0.72 |
| V̇O2peak, mL·kg−1·min−1 | 25.6 (22.7;28.5) | 28.3 (26.1;30.6) | 32.4 (27.3;37.4) | 35.1 (29.9;40.2) | 0.003 * | 0.001 * | 0.94 |
| Triglycerides, mmol/L | 1.4 (0.9;1.9) | 1.2 (0.9;1.5) | 0.8 (0.6;1.0) | 0.8 (0.6;1.0) | 0.040 * | 0.54 † | 0.49 † |
| FFA, mmol/L | 0.59 (0.51;0.67) | 0.68 (0.45; 0.91) | 0.52 (0.34;0.69) | 0.54 (0.14; 0.94) | 0.29 | 0.63 | 0.63 |
| ALT, u/L | 33.8 (23.3;44.2) | 31.4 (22.3;40.6) | 31.6 (13.1;50.1) | 31.5 (17.7;45.3) | 0.30 † | 0.95 † | 0.42 † |
| ALP, u/L | 59.4 (51.4;67.4) | 59.6 (51.5;67.8) | 51.8 (43.2;60.3) | 56.9 (47.2;66.7) | 0.08 † | 0.31 † | 0.11 † |
| AST, u/L | 22.2 (18.7;25.6) | 22.6 (18.3;26.9) | 27.5 (15.8;39.2) | 25.8 (14.8;36.9) | 0.28 † | 0.86 † | 0.92 † |
| CRP, mg/L | 2.8 (1.4;4.2) | 3.7 (1.3;6.2) | 2.1 (0.3;3.9) | 1.2 (−0.6;3.1) | 0.050 * | 0.69 † | 0.50 † |
| M-value, μmol/kg*min | 23.1 (16.3;30.0) | 31.4 (20.4;42.3) | 37.6 (26.7;48.5) | 46.9 (31.7;62.1) | 0.007 * | 0.022 * | 0.82 |
| Heavier | Leaner | p-Value | |||||
|---|---|---|---|---|---|---|---|
| Pre | Post | Pre | Post | Baseline | Time | Time*group | |
| n | 12 | 11 | 12 | 10 | |||
| Basal glucose, mmol/L | 5.7 (5.4;6.0) | 5.8 (5.6;6.1) | 5.5 (5.2;5.7) | 5.5 (5.2;5.7) | 0.39 | 0.37 | 0.42 |
| Mean glucose, mmol/L | 7.5 (6.7;8.2) | 7.7 (7.0;8.3) | 6.9 (6.1;7.8) | 7.0 (6.1;7.9) | 0.17 | 0.68 | 0.78 |
| 2 h glucose, mmol/L | 6.5 (5.7;7.3) | 6.6 (5.7;7.4) | 6.1 (4.9;7.2) | 5.8 (4.3;7.4) | 0.32 | 0.84 | 0.52 |
| Hba1c, mmol/mol | 36.5 (35.1;37.9) | 36.0 (34.2;37.7) | 34.9 (32.8;37.0) | 34.7 (32.2;37.1) | 0.047 *† | 0.58 | 0.68 |
| Basal ins, pmol/L | 70.5 (54.4;86.6) | 63.5 (32.0;95.0) | 44.0 (28.5;59.5) | 49.0 (26.2;71.9) | 0.006 *† | 0.50 † | 0.71 † |
| Mean insulin, pmol/L | 371.6 (229.9;513.3) | 339.4 (214.2;464.6) | 235.8 (163.3;308.4) | 258.2 (169.4;347.0) | 0.01 *† | 0.88 † | 0.66 † |
| Basal insulin secretion rate, pmol∙min−1∙m−2 | 111.4 (97.5;125.2) | 111.0 (95.4;126.5) | 87.4 (69.4;105.4) | 86.2 (69.6;102.7) | 0.030 * | 0.80 | 0.88 |
| Glucose sensitivity, pmol∙min−1∙m−2∙mM−1 | 92.5 (69.4;115.6) | 103.4 (75.3;131.5) | 98.5 (77.5;119.5) | 75.2 (48.6;101.9) | 0.66 | 0.44 | 0.049 * |
| p = 0.36 | p = 0.049 * | ||||||
| Rate sensitivity, pmol∙m−2 mM−1 | 1366.6 (906;1827) | 1169.9 (680;1660) | 1028.0 (668;1388) | 1107.5 (601;1614) | 0.049 * | 0.70 | 0.13 |
| PFR, dimensionless | 1.4 (1.1;1.8) | 1.3 (0.9;1.6) | 1.7 (1.2;2.2) | 1.5 (0.9;2.1) | 0.48 † | 0.30 † | 0.52 † |
| ISR early, nmol/m2 | 13.1 (9.7;16.6) | 12.3 (8.8;15.8) | 10.0 (7.1;12.9) | 9.3 (6.3;12.3) | 0.004 * | 0.50 | 0.92 |
| ISR late, nmol/m2 | 31.9 (28.5;35.4) | 29.1 (25.7;32.6) | 26.9 (20.9;32.9) | 25.7 (20.2;31.3) | 0.07 | 0.24 | 0.50 |
| Total ISR, nmol/m2 | 45.1 (39.2;50.9) | 41.5 (35.8;47.2) | 36.9 (29.6;44.2) | 35.1 (27.9;42.2) | 0.021 * | 0.23 | 0.52 |
| 2 h OGIS, mL∙min−1∙m−2 | 375.0 (354.1;395.8) | 369.0 (349.8;388.2) | 414.7 (384.3;445.1) | 415.8 (389.9;441.6) | 0.037 * | 0.75 | 0.63 |
| Baseline | Change | |||
|---|---|---|---|---|
| r | p | r | p | |
| Liver fat percentage | ||||
| ALT, U/L | 0.83 | <0.001 * | 0.49 | 0.05 *‡ |
| AST, U/L | 0.64 | 0.005 * | 0.34 | |
| ALP, U/L | 0.35 | 0.15 | 0.06 | 0.02 * |
| Liver glucose uptake | ||||
| ALT, U/L | −0.09 | 0.7 ‡ | 0.02 | 0.95 ‡ |
| AST, U/L | −0.37 | 0.09 ‡ | −0.06 | 0.79 |
| ALP, U/L | −0.04 | 0.85 | −0.18 | 0.45 |
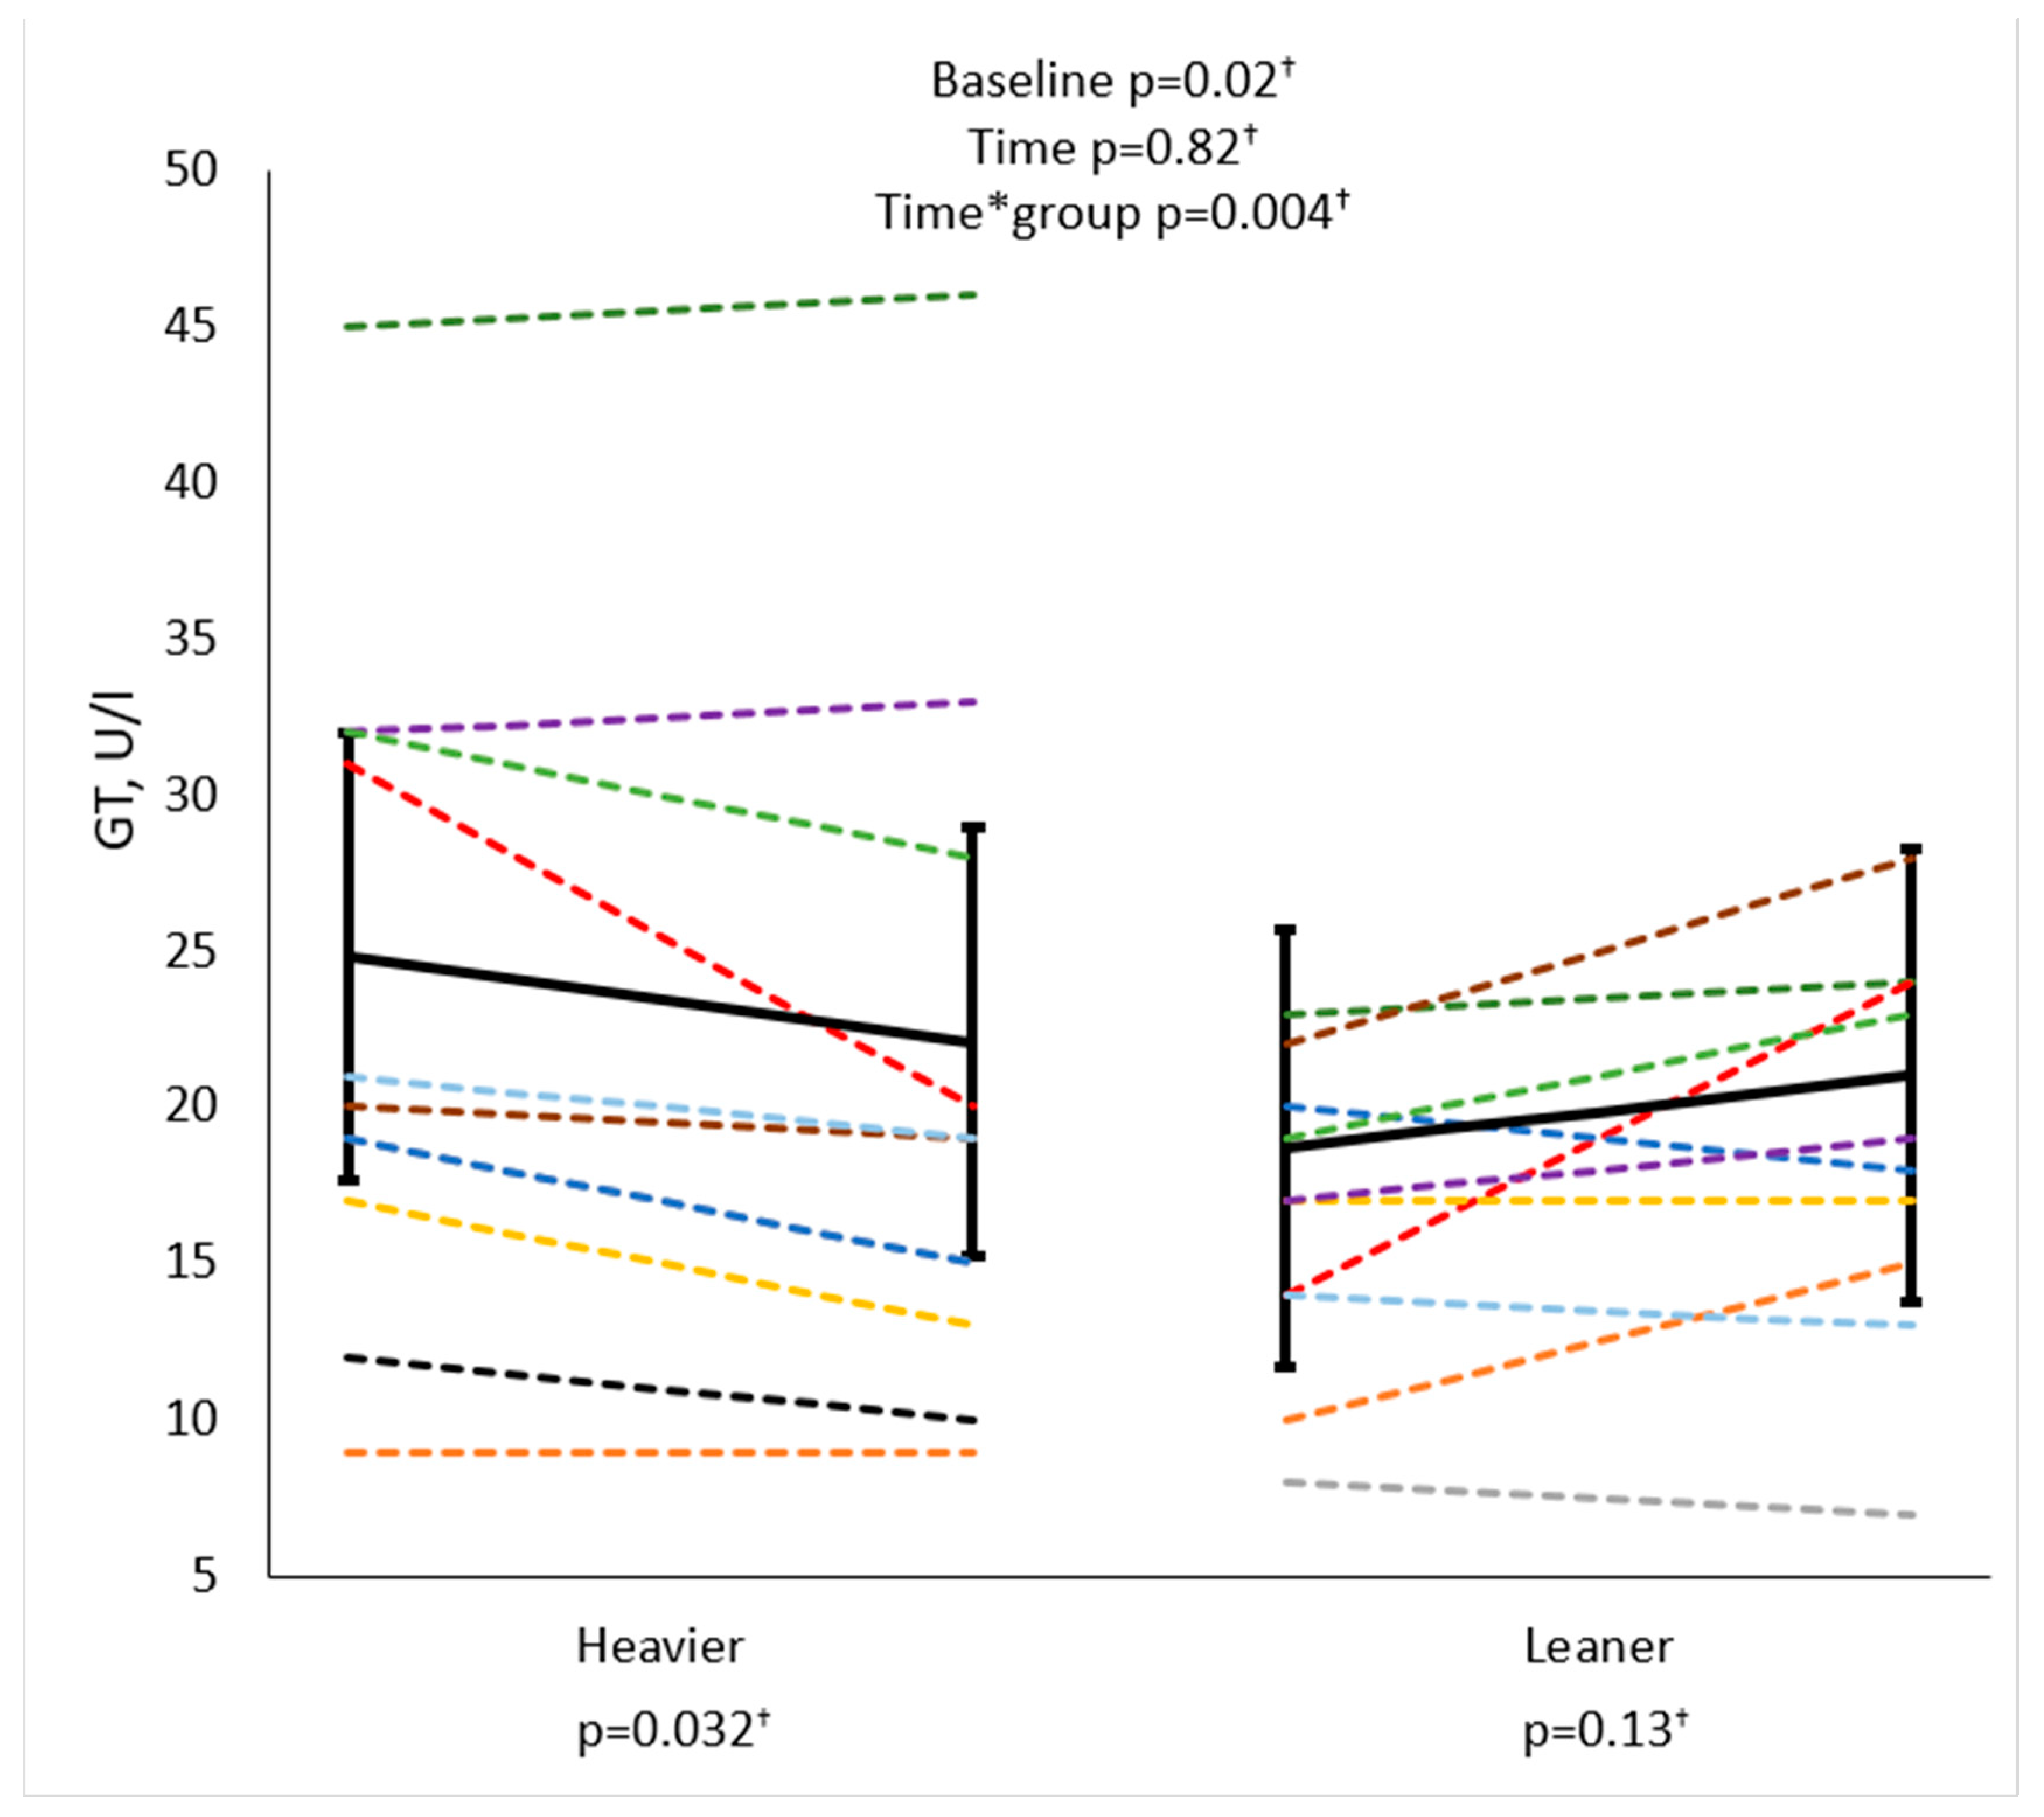
| GT, U/L | −0.40 | 0.06 † | −0.02 | 0.92 |
| GT | ||||
| Weight, kg | −0.09 | 0.68 | 0.46 | 0.04 *‡ |
| BMI, kg/m2 | 0.03 | 0.90 | 0.47 | 0.03 *‡ |
| Visceral fat, kg | 0.54 | 0.021 * | 0.12 | |
| Triglycerides, mmol/L | 0.44 | 0.031 *‡ | 0.42 | 0.06 |
| Glucose sensitivity | ||||
| Pancreatic fat content, % | −0.26 | 0.29 | −0.08 | 0.77 |
| M-value | ||||
| Basal insulin, pmol/L | −0.70 | <0.001 * | −0.17 | 0.46 |
| Mean insulin, pmol/L | −0.70 | <0.001 * | −0.24 | 0.31 |
| Basal insulin secretion rate, pmol∙min−1∙m−2 | −0.70 | <0.001 * | 0.01 | 0.95 |
| ISR early, nmol/m2 | −0.61 | 0.002 * | −0.27 | 0.23 |
| ISR late, nmol/m2 | −0.76 | <0.001 * | −0.05 | 0.84 |
| Total ISR, nmol/m2 | −0.83 | <0.001 * | −0.15 | 0.52 |
Disclaimer/Publisher’s Note: The statements, opinions and data contained in all publications are solely those of the individual author(s) and contributor(s) and not of MDPI and/or the editor(s). MDPI and/or the editor(s) disclaim responsibility for any injury to people or property resulting from any ideas, methods, instructions or products referred to in the content. |
© 2024 by the authors. Licensee MDPI, Basel, Switzerland. This article is an open access article distributed under the terms and conditions of the Creative Commons Attribution (CC BY) license (https://creativecommons.org/licenses/by/4.0/).
Share and Cite
Lietzén, M.S.; Mari, A.; Ojala, R.; Hentilä, J.; Koskensalo, K.; Lautamäki, R.; Löyttyniemi, E.; Parkkola, R.; Saunavaara, V.; Kirjavainen, A.K.; et al. Effects of Obesity and Exercise on Hepatic and Pancreatic Lipid Content and Glucose Metabolism: PET Studies in Twins Discordant for BMI. Biomolecules 2024, 14, 1070. https://doi.org/10.3390/biom14091070
Lietzén MS, Mari A, Ojala R, Hentilä J, Koskensalo K, Lautamäki R, Löyttyniemi E, Parkkola R, Saunavaara V, Kirjavainen AK, et al. Effects of Obesity and Exercise on Hepatic and Pancreatic Lipid Content and Glucose Metabolism: PET Studies in Twins Discordant for BMI. Biomolecules. 2024; 14(9):1070. https://doi.org/10.3390/biom14091070
Chicago/Turabian StyleLietzén, Martin S., Andrea Mari, Ronja Ojala, Jaakko Hentilä, Kalle Koskensalo, Riikka Lautamäki, Eliisa Löyttyniemi, Riitta Parkkola, Virva Saunavaara, Anna K. Kirjavainen, and et al. 2024. "Effects of Obesity and Exercise on Hepatic and Pancreatic Lipid Content and Glucose Metabolism: PET Studies in Twins Discordant for BMI" Biomolecules 14, no. 9: 1070. https://doi.org/10.3390/biom14091070
APA StyleLietzén, M. S., Mari, A., Ojala, R., Hentilä, J., Koskensalo, K., Lautamäki, R., Löyttyniemi, E., Parkkola, R., Saunavaara, V., Kirjavainen, A. K., Rajander, J., Malm, T., Lahti, L., Rinne, J. O., Pietiläinen, K. H., Iozzo, P., & Hannukainen, J. C. (2024). Effects of Obesity and Exercise on Hepatic and Pancreatic Lipid Content and Glucose Metabolism: PET Studies in Twins Discordant for BMI. Biomolecules, 14(9), 1070. https://doi.org/10.3390/biom14091070