
Vascular Cytokines and Atherosclerosis: Differential Serum Levels of TRAIL, IL-18, and OPG in Obstructive Coronary Artery Disease
 , , , , , , and
Abstract
:1. Introduction
2. Materials and Methods
2.1. Cohort Information
2.2. Biological Samples and Analysis
2.3. Imaging Acquisition and Analysis
2.4. Statistical Analysis
3. Results
3.1. Cohort Characteristics and Disease Burden
3.2. Relationships between Biomarkers and Disease Scores
3.3. Relationships between Biomarkers and Cardiac Risk Factor Scores
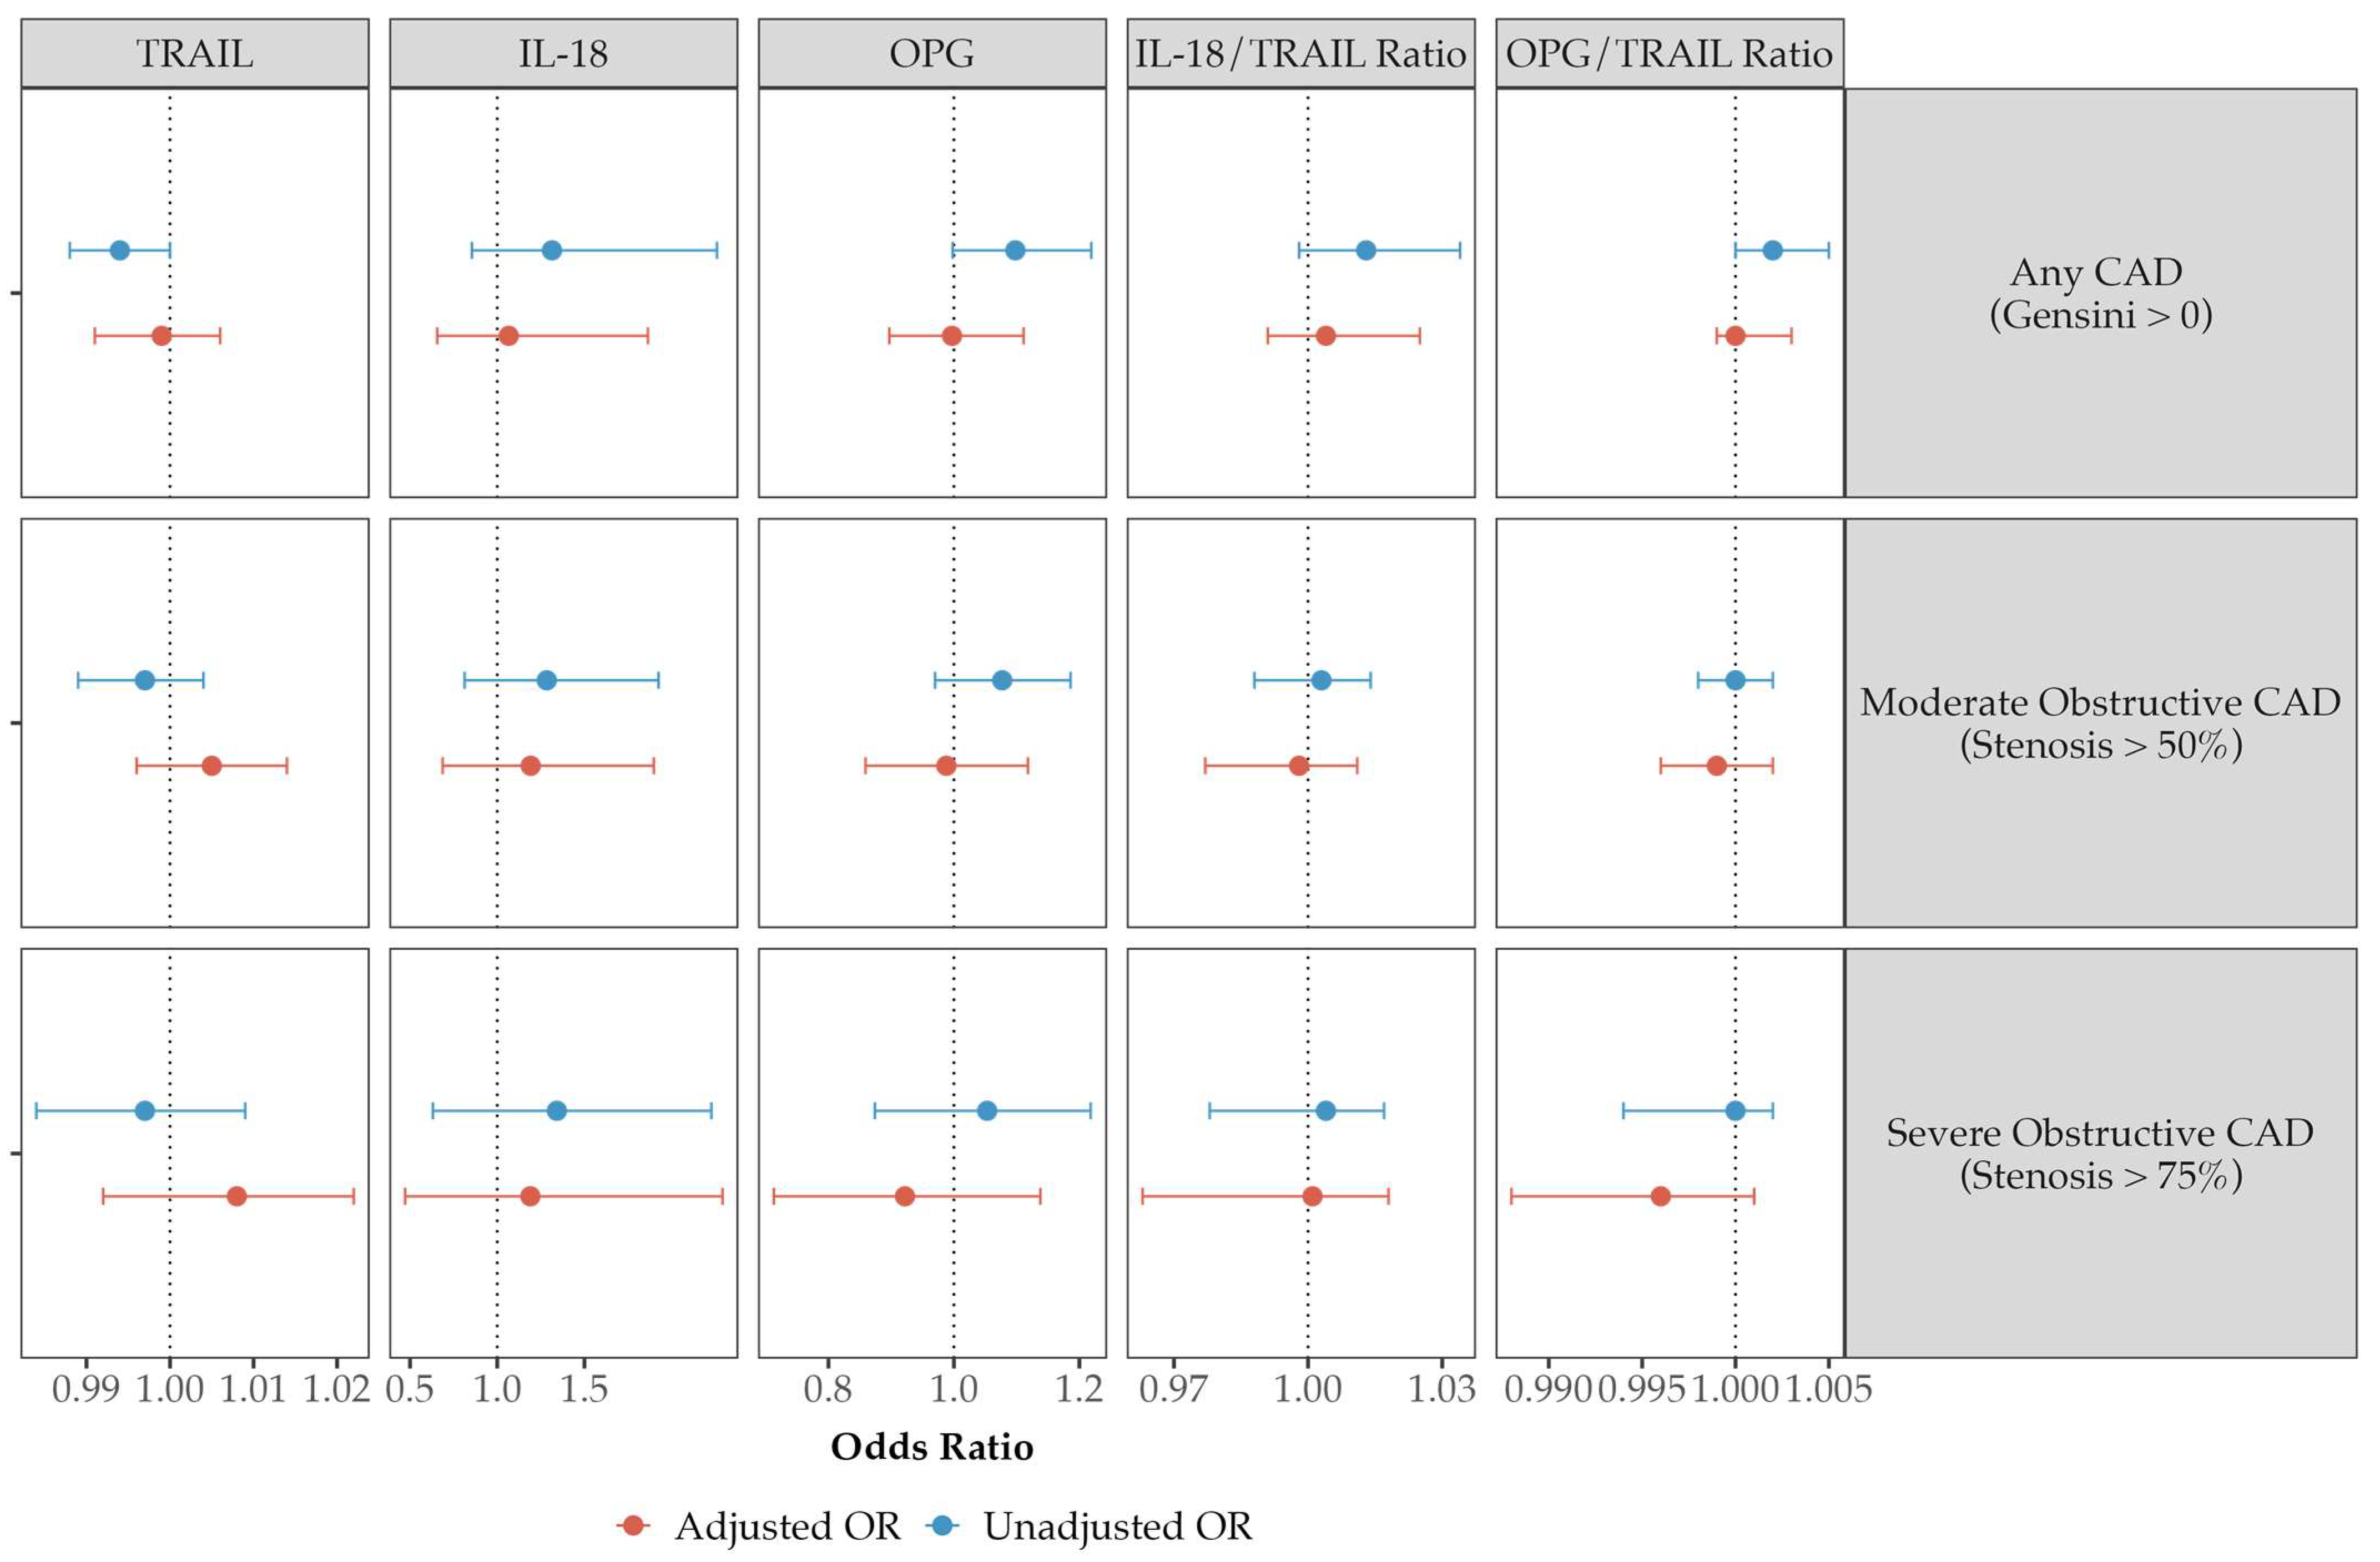
3.4. Modeling for Disease Prevalence and Severity
4. Discussion
5. Conclusions
Supplementary Materials
Author Contributions
Funding
Institutional Review Board Statement
Informed Consent Statement
Data Availability Statement
Acknowledgments
Conflicts of Interest
References
- Vos, T.; Lim, S.S.; Abbafati, C.; Abbas, K.M.; Abbasi, M.; Abbasifard, M.; Abbasi-Kangevari, M.; Abbastabar, H.; Abd-Allah, F.; Abdelalim, A.; et al. Global burden of 369 diseases and injuries in 204 countries and territories, 1990–2019: A systematic analysis for the Global Burden of Disease Study 2019. Lancet 2020, 396, 1204–1222. [Google Scholar] [CrossRef] [PubMed]
- Figtree, G.A.; Vernon, S.T.; Hadziosmanovic, N.; Sundström, J.; Alfredsson, J.; Arnott, C.; Delatour, V.; Leósdóttir, M.; Hagström, E. Mortality in STEMI patients without standard modifiable risk factors: A sex-disaggregated analysis of SWEDEHEART registry data. Lancet 2021, 397, 1085–1094. [Google Scholar] [CrossRef] [PubMed]
- Vernon, S.T.; Coffey, S.; D’Souza, M.; Chow, C.K.; Kilian, J.; Hyun, K.; Shaw, J.A.; Adams, M.; Roberts-Thomson, P.; Brieger, D.; et al. ST-Segment-Elevation Myocardial Infarction (STEMI) Patients Without Standard Modifiable Cardiovascular Risk Factors-How Common Are They, and What Are Their Outcomes? J. Am. Heart Assoc. 2019, 8, e013296. [Google Scholar] [CrossRef]
- Figtree, G.A.; Vernon, S.T.; Hadziosmanovic, N.; Sundström, J.; Alfredsson, J.; Nicholls, S.J.; Chow, C.K.; Psaltis, P.; Røsjø, H.; Leósdóttir, M.; et al. Mortality and Cardiovascular Outcomes in Patients Presenting With Non–ST Elevation Myocardial Infarction Despite No Standard Modifiable Risk Factors: Results From the SWEDEHEART Registry. J. Am. Heart Assoc. 2022, 11, e024818. [Google Scholar] [CrossRef]
- Tousoulis, D.; Oikonomou, E.; Economou, E.K.; Crea, F.; Kaski, J.C. Inflammatory cytokines in atherosclerosis: Current therapeutic approaches. Eur. Heart J. 2016, 37, 1723–1732. [Google Scholar] [CrossRef]
- Mori, K.; Ikari, Y.; Jono, S.; Shioi, A.; Ishimura, E.; Emoto, M.; Inaba, M.; Hara, K.; Nishizawa, Y. Association of serum TRAIL level with coronary artery disease. Thromb. Res. 2010, 125, 322–325. [Google Scholar] [CrossRef]
- Secchiero, P.; Corallini, F.; Ceconi, C.; Parrinello, G.; Volpato, S.; Ferrari, R.; Zauli, G. Potential prognostic significance of decreased serum levels of TRAIL after acute myocardial infarction. PLoS ONE 2009, 4, e4442. [Google Scholar] [CrossRef]
- Shaker, O.G.; El-Shehaby, A.; Nabih, M. Possible Role of Osteoprotegerin and Tumor Necrosis Factor-Related Apoptosis-Inducing Ligand as Markers of Plaque Instability in Coronary Artery Disease. Angiology 2010, 61, 756–762. [Google Scholar] [CrossRef] [PubMed]
- Martínez, G.J.; Robertson, S.; Barraclough, J.; Xia, Q.; Mallat, Z.; Bursill, C.; Celermajer, D.S.; Patel, S. Colchicine Acutely Suppresses Local Cardiac Production of Inflammatory Cytokines in Patients With an Acute Coronary Syndrome. J. Am. Heart Assoc. 2015, 4, e002128. [Google Scholar] [CrossRef]
- Di Bartolo, B.A.; Cartland, S.P.; Harith, H.H.; Bobryshev, Y.V.; Schoppet, M.; Kavurma, M.M. TRAIL-Deficiency Accelerates Vascular Calcification in Atherosclerosis via Modulation of RANKL. PLoS ONE 2013, 8, e74211. [Google Scholar] [CrossRef]
- Dutka, M.; Bobiński, R.; Wojakowski, W.; Francuz, T.; Pająk, C.; Zimmer, K. Osteoprotegerin and RANKL-RANK-OPG-TRAIL signalling axis in heart failure and other cardiovascular diseases. Heart Fail. Rev. 2022, 27, 1395–1411. [Google Scholar] [CrossRef] [PubMed]
- Abedin, M.; Omland, T.; Ueland, T.; Khera, A.; Aukrust, P.; Murphy, S.A.; Jain, T.; Gruntmanis, U.; McGuire, D.K.; de Lemos, J.A. Relation of osteoprotegerin to coronary calcium and aortic plaque (from the Dallas Heart Study). Am. J. Cardiol. 2007, 99, 513–518. [Google Scholar] [CrossRef] [PubMed]
- Cartland, S.P.; Genner, S.W.; Martínez, G.J.; Robertson, S.; Kockx, M.; Lin, R.C.Y.; O’Sullivan, J.F.; Koay, Y.C.; Manuneedhi Cholan, P.; Kebede, M.A.; et al. TRAIL-Expressing Monocyte/Macrophages Are Critical for Reducing Inflammation and Atherosclerosis. iScience 2019, 12, 41–52. [Google Scholar] [CrossRef] [PubMed]
- Di Bartolo, B.A.; Chan, J.; Bennett, M.R.; Cartland, S.; Bao, S.; Tuch, B.E.; Kavurma, M.M. TNF-related apoptosis-inducing ligand (TRAIL) protects against diabetes and atherosclerosis in Apoe−/− mice. Diabetologia 2011, 54, 3157–3167. [Google Scholar] [CrossRef]
- Montagnana, M.; Lippi, G.; Danese, E.; Guidi, G.C. The role of osteoprotegerin in cardiovascular disease. Ann. Med. 2013, 45, 254–264. [Google Scholar] [CrossRef]
- Bjerre, M.; Hilden, J.; Winkel, P.; Jensen, G.B.; Kjoller, E.; Sajadieh, A.; Kastrup, J.; Kolmos, H.J.; Larsson, A.; Arnlov, J.; et al. Serum osteoprotegerin as a long-term predictor for patients with stable coronary artery disease and its association with diabetes and statin treatment: A CLARICOR trial 10-year follow-up substudy. Atherosclerosis 2020, 301, 8–14. [Google Scholar] [CrossRef]
- Bjerre, M.; Munk, K.; Sloth, A.D.; Nielsen, S.S.; Flyvbjerg, A.; Bøtker, H.E. High osteoprotegerin levels predict MACCE in STEMI patients, but are not associated with myocardial salvage. Scand. Cardiovasc. J. 2014, 48, 209–215. [Google Scholar] [CrossRef]
- Vik, A.; Mathiesen, E.B.; Brox, J.; Wilsgaard, T.; Njølstad, I.; Jørgensen, L.; Hansen, J.B. Serum osteoprotegerin is a predictor for incident cardiovascular disease and mortality in a general population: The Tromsø Study. J. Thromb. Haemost. 2011, 9, 638–644. [Google Scholar] [CrossRef]
- Kuźniewski, M.; Fedak, D.; Dumnicka, P.; Stępień, E.; Kuśnierz-Cabala, B.; Cwynar, M.; Sułowicz, W. Osteoprotegerin and osteoprotegerin/TRAIL ratio are associated with cardiovascular dysfunction and mortality among patients with renal failure. Adv. Med. Sci. 2016, 61, 269–275. [Google Scholar] [CrossRef]
- Secchiero, P.; Corallini, F.; Beltrami, A.P.; Ceconi, C.; Bonasia, V.; Di Chiara, A.; Ferrari, R.; Zauli, G. An imbalanced OPG/TRAIL ratio is associated to severe acute myocardial infarction. Atherosclerosis 2010, 210, 274–277. [Google Scholar] [CrossRef]
- Kott, K.A.; Vernon, S.T.; Hansen, T.; Yu, C.; Bubb, K.J.; Coffey, S.; Sullivan, D.; Yang, J.; Sullivan, J.; Chow, C.; et al. Biobanking for discovery of novel cardiovascular biomarkers using imaging-quantified disease burden: Protocol for the longitudinal, prospective, BioHEART-CT cohort study. BMJ Open 2019, 9, e028649. [Google Scholar] [CrossRef] [PubMed]
- Abbara, S.; Blanke, P.; Maroules, C.D.; Cheezum, M.; Choi, A.D.; Han, B.K.; Marwan, M.; Naoum, C.; Norgaard, B.L.; Rubinshtein, R.; et al. SCCT guidelines for the performance and acquisition of coronary computed tomographic angiography: A report of the Society of Cardiovascular Computed Tomography Guidelines Committee. J. Cardiovasc. Comput. Tomogr. 2016, 10, 435–449. [Google Scholar] [CrossRef] [PubMed]
- Agatston, A.S.; Janowitz, W.R.; Hildner, F.J.; Zusmer, N.R.; Viamonte, M.; Detrano, R. Quantification of coronary artery calcium using ultrafast computed tomography. J. Am. Coll. Cardiol. 1990, 15, 827–832. [Google Scholar] [CrossRef] [PubMed]
- Leipsic, J.; Abbara, S.; Achenbach, S.; Cury, R.; Earls, J.P.; Mancini, G.J.; Nieman, K.; Pontone, G.; Raff, G.L. SCCT guidelines for the interpretation and reporting of coronary CT angiography: A report of the Society of Cardiovascular Computed Tomography Guidelines Committee. J. Cardiovasc. Comput. Tomogr. 2014, 8, 342–358. [Google Scholar] [CrossRef] [PubMed]
- Gensini, G.G. A more meaningful scoring system for determining the severity of coronary heart disease. Am. J. Cardiol. 1983, 51, 606. [Google Scholar] [CrossRef]
- Kim, H.Y. Statistical notes for clinical researchers: Assessing normal distribution (2) using skewness and kurtosis. Restor. Dent. Endod. 2013, 38, 52–54. [Google Scholar] [CrossRef]
- Ajala, O.; Zhang, Y.; Gupta, A.; Bon, J.; Sciurba, F.; Chandra, D. Decreased serum TRAIL is associated with increased mortality in smokers with comorbid emphysema and coronary artery disease. Respir. Med. 2018, 145, 21–27. [Google Scholar] [CrossRef]
- Schoppet, M.; Sattler, A.M.; Schaefer, J.R.; Herzum, M.; Maisch, B.; Hofbauer, L.C. Increased Osteoprotegerin Serum Levels in Men with Coronary Artery Disease. J. Clin. Endocrinol. Metab. 2003, 88, 1024–1028. [Google Scholar] [CrossRef]
- Volpato, S.; Ferrucci, L.; Secchiero, P.; Corallini, F.; Zuliani, G.; Fellin, R.; Guralnik, J.M.; Bandinelli, S.; Zauli, G. Association of tumor necrosis factor-related apoptosis-inducing ligand with total and cardiovascular mortality in older adults. Atherosclerosis 2011, 215, 452–458. [Google Scholar] [CrossRef]
- Kawano, N.; Mori, K.; Emoto, M.; Lee, E.; Kobayashi, I.; Yamazaki, Y.; Urata, H.; Morioka, T.; Koyama, H.; Shoji, T.; et al. Association of serum TRAIL levels with atherosclerosis in patients with type 2 diabetes mellitus. Diabetes Res. Clin. Pract. 2011, 91, 316–320. [Google Scholar] [CrossRef]
- Brombo, G.; Volpato, S.; Secchiero, P.; Passaro, A.; Bosi, C.; Zuliani, G.; Zauli, G. Association of soluble Tumor necrosis factor-Related Apoptosis-Inducing Ligand (TRAIL) with central adiposity and low-density lipoprotein cholesterol. PLoS ONE 2013, 8, e58225. [Google Scholar] [CrossRef] [PubMed]
- Harith, H.H.; Morris, M.J.; Kavurma, M.M. On the TRAIL of obesity and diabetes. Trends Endocrinol. Metab. 2013, 24, 578–587. [Google Scholar] [CrossRef]
- Zoller, V.; Funcke, J.-B.; Keuper, M.; Abd El Hay, M.; Debatin, K.-M.; Wabitsch, M.; Fischer-Posovszky, P. TRAIL (TNF-related apoptosis-inducing ligand) inhibits human adipocyte differentiation via caspase-mediated downregulation of adipogenic transcription factors. Cell Death Dis. 2016, 7, e2412. [Google Scholar] [CrossRef]
- Bernardi, S.; Zauli, G.; Tikellis, C.; Candido, R.; Fabris, B.; Secchiero, P.; Cooper, M.E.; Thomas, M.C. TNF-related apoptosis-inducing ligand significantly attenuates metabolic abnormalities in high-fat-fed mice reducing adiposity and systemic inflammation. Clin. Sci. 2012, 123, 547–555. [Google Scholar] [CrossRef] [PubMed]
- Mallat, Z.; Corbaz, A.; Scoazec, A.; Besnard, S.; Lesèche, G.; Chvatchko, Y.; Tedgui, A. Expression of Interleukin-18 in Human Atherosclerotic Plaques and Relation to Plaque Instability. Circulation 2001, 104, 1598–1603. [Google Scholar] [CrossRef]
- Ponasenko, A.V.; Tsepokina, A.V.; Khutornaya, M.V.; Sinitsky, M.Y.; Barbarash, O.L. IL18-family Genes Polymorphism Is Associated with the Risk of Myocardial Infarction and IL18 Concentration in Patients with Coronary Artery Disease. Immunol. Investig. 2022, 51, 802–816. [Google Scholar] [CrossRef]
- Sadeghi, M.; Gheraati, M.; Soleimani, A.; Amirpour, A.; Taheri, M.; Yazdekhasti, S.; Valikhani, E. Serum interleukin-18 and extent of coronary artery disease in unstable angina. ARYA Atheroscler. 2018, 14, 122–127. [Google Scholar]
- Chen, M.C.; Chen, C.J.; Yang, C.H.; Wu, C.J.; Fang, C.Y.; Hsieh, Y.K.; Chang, H.W. Interleukin-18: A strong predictor of the extent of coronary artery disease in patients with unstable angina. Heart Vessel. 2007, 22, 371–375. [Google Scholar] [CrossRef] [PubMed]
- Ridker, P.M.; MacFadyen, J.G.; Thuren, T.; Libby, P. Residual inflammatory risk associated with interleukin-18 and interleukin-6 after successful interleukin-1β inhibition with canakinumab: Further rationale for the development of targeted anti-cytokine therapies for the treatment of atherothrombosis. Eur. Heart J. 2020, 41, 2153–2163. [Google Scholar] [CrossRef]
- Lieb, W.; Gona, P.; Larson, M.G.; Massaro, J.M.; Lipinska, I.; Keaney, J.F., Jr.; Rong, J.; Corey, D.; Hoffmann, U.; Fox, C.S.; et al. Biomarkers of the osteoprotegerin pathway: Clinical correlates, subclinical disease, incident cardiovascular disease, and mortality. Arterioscler. Thromb. Vasc. Biol. 2010, 30, 1849–1854. [Google Scholar] [CrossRef]
- Mogelvang, R.; Pedersen, S.H.; Flyvbjerg, A.; Bjerre, M.; Iversen, A.Z.; Galatius, S.; Frystyk, J.; Jensen, J.S. Comparison of Osteoprotegerin to Traditional Atherosclerotic Risk Factors and High-Sensitivity C-Reactive Protein for Diagnosis of Atherosclerosis. Am. J. Cardiol. 2012, 109, 515–520. [Google Scholar] [CrossRef] [PubMed]
- Hosbond, S.E.; Diederichsen, A.C.P.; Saaby, L.; Rasmussen, L.M.; Lambrechtsen, J.; Munkholm, H.; Sand, N.P.R.; Gerke, O.; Poulsen, T.S.; Mickley, H. Can osteoprotegerin be used to identify the presence and severity of coronary artery disease in different clinical settings? Atherosclerosis 2014, 236, 230–236. [Google Scholar] [CrossRef]
- Zhu, D.; Vernon, S.T.; D’Agostino, Z.; Wu, J.; Giles, C.; Chan, A.S.; Kott, K.A.; Gray, M.P.; Gholipour, A.; Tang, O.; et al. Lipidomics Profiling and Risk of Coronary Artery Disease in the BioHEART-CT Discovery Cohort. Biomolecules 2023, 13, 917. [Google Scholar] [CrossRef] [PubMed]
- Kott, K.A.; Morel-Kopp, M.C.; Vernon, S.T.; Takagi, Y.; Di Bartolo, B.A.; Peter, K.; Yang, J.Y.; Grieve, S.M.; Ward, C.; Figtree, G.A. Association of Global Coagulation Profiles With Cardiovascular Risk Factors and Atherosclerosis: A Sex Disaggregated Analysis From the BioHEART-CT Study. J. Am. Heart Assoc. 2021, 10, e020604. [Google Scholar] [CrossRef] [PubMed]
- Vernon, S.T.; Kott, K.A.; Hansen, T.; Finemore, M.; Baumgart, K.W.; Bhindi, R.; Yang, J.; Hansen, P.S.; Nicholls, S.J.; Celermajer, D.S.; et al. Immunoglobulin E Sensitization to Mammalian Oligosaccharide Galactose-a-1,3 (α-Gal) Is Associated With Noncalcified Plaque, Obstructive Coronary Artery Disease, and ST-Segment Elevated Myocardial Infarction. Arterioscler. Thromb. Vasc. Biol. 2022, 42, 352–361. [Google Scholar] [CrossRef]
- Mahajan, K. Interleukin-18 and Atherosclerosis: Mediator or Biomarker. J. Clin. Exp. Cardiolog. 2014, 5, 1–4. [Google Scholar] [CrossRef]
- Manuneedhi Cholan, P.; Cartland, S.P.; Dang, L.; Rayner, B.S.; Patel, S.; Thomas, S.R.; Kavurma, M.M. TRAIL protects against endothelial dysfunction in vivo and inhibits angiotensin-II-induced oxidative stress in vascular endothelial cells in vitro. Free Radic. Biol. Med. 2018, 126, 341–349. [Google Scholar] [CrossRef]
- Bauersachs, R.; Zeymer, U.; Brière, J.-B.; Marre, C.; Bowrin, K.; Huelsebeck, M. Burden of Coronary Artery Disease and Peripheral Artery Disease: A Literature Review. Cardiovasc. Ther. 2019, 2019, 8295054. [Google Scholar] [CrossRef]
- Sechtem, U.; Brown, D.; Godo, S.; Lanza, G.A.; Shimokawa, H.; Sidik, N. Coronary microvascular dysfunction in stable ischaemic heart disease (non-obstructive coronary artery disease and obstructive coronary artery disease). Cardiovasc. Res. 2020, 116, 771–786. [Google Scholar] [CrossRef]


| Demographics and Risk Factors | No Detectable CAD | Non-Obstructive CAD (Stenosis < 50%) | Obstructive CAD (Stenosis ≥ 50%) | STEMI | p Value # |
|---|---|---|---|---|---|
| Number—n | 342 | 470 | 181 | 20 | |
| Age, years—mean (SD) | 53 (11) | 63 (10) | 69 (9) | 61 (10) | <0.001 |
| Sex, male—n (%) | 145 (42.4%) | 278 (59.1%) | 128 (70.7%) | 10 (50.0%) | <0.001 |
| SMuRFs—n (%) * | <0.001 | ||||
| 0 | 113 (33.0%) | 77 (16.4%) | 22 (12.2%) | 3 (15.0%) | |
| 1 | 155 (45.4%) | 199 (42.3%) | 60 (33.1%) | 5 (25.0%) | |
| 2 | 61 (17.8%) | 143 (30.4%) | 67 (37.0%) | 6 (30.0%) | |
| 3 | 13 (3.8%) | 41 (8.7%) | 28 (15.5%) | 4 (20.0%) | |
| 4 | 0 (0.0%) | 10 (2.1%) | 4 (2.2%) | 2 (10.0%) | |
| Hypertension—n (%) | 93 (27.2%) | 200 (42.6%) | 93 (51.4%) | 11 (55.0%) | <0.001 |
| Hyperlipidemia—n (%) | 162 (47.3%) | 306 (65.1%) | 119 (65.7%) | 13 (65.0%) | <0.001 |
| Diabetes Mellitus—n (%) | 21 (6.1%) | 43 (9.1%) | 22 (12.2%) | 6 (30.0%) | 0.003 |
| Significant Smoking History—n (%) | 40 (11.7%) | 99 (21.1%) | 60 (33.1%) | 7 (35.0%) | <0.001 |
| Significant Family History of Premature CAD—n (%) | 69 (20.2%) | 98 (20.9%) | 37 (20.4%) | 6 (30.0%) | 0.7 |
| Atrial Fibrillation—n (%) | 31 (9.1%) | 65 (13.8%) | 24 (13.3%) | 0 (0%) | 0.057 |
| Previous TIA/Stroke—n (%) | 12 (3.5%) | 34 (7.2%) | 5 (2.8%) | 0 (0%) | 0.035 |
| Peripheral Arterial Disease—n (%) | 3 (0.9%) | 5 (1.1%) | 6 (3.3%) | 0 (0%) | 0.14 |
| Anti-Platelet Medication—n (%) | 46 (13.5%) | 85 (18.1%) | 45 (24.9%) | 5 (25.0%) | 0.009 |
| Anti-Coagulant Medication—n (%) | 20 (5.8%) | 50 (10.6%) | 18 (9.9%) | 1 (5.0%) | 0.085 |
| Statin—n (%) | 62 (18.1%) | 184 (39.1%) | 84 (46.4%) | 5 (25.0%) | <0.001 |
| Beta Blocker—n (%) | 34 (9.9%) | 68 (14.5%) | 38 (21.0%) | 5 (25.0%) | 0.003 |
| ACE Inhibitor/ARB—n (%) | 68 (19.9%) | 169 (36.0%) | 79 (43.6%) | 9 (45.0%) | <0.001 |
| CACS—median (IQR) | 0 (0) | 38.2 (143) | 387.5 (807.6) | N/A | <0.001 |
| Calcium Percentile—median (IQR) | 0 (0) | 58 (44) | 77 (34) | N/A | <0.001 |
| Gensini Score—median (IQR) | 0 (0) | 6.0 (7.5) | 23.5 (17.0) | N/A | <0.001 |
| Soft Plaque Score—median (IQR) | 0 (0) | 4.5 (7.5) | 20.5 (16.0) | N/A | <0.001 |
| Serum Biomarker Levels | No Detectable CAD | Non-Obstructive CAD (Stenosis < 50%) | Obstructive CAD (Stenosis ≥ 50%) | STEMI | p Value # |
|---|---|---|---|---|---|
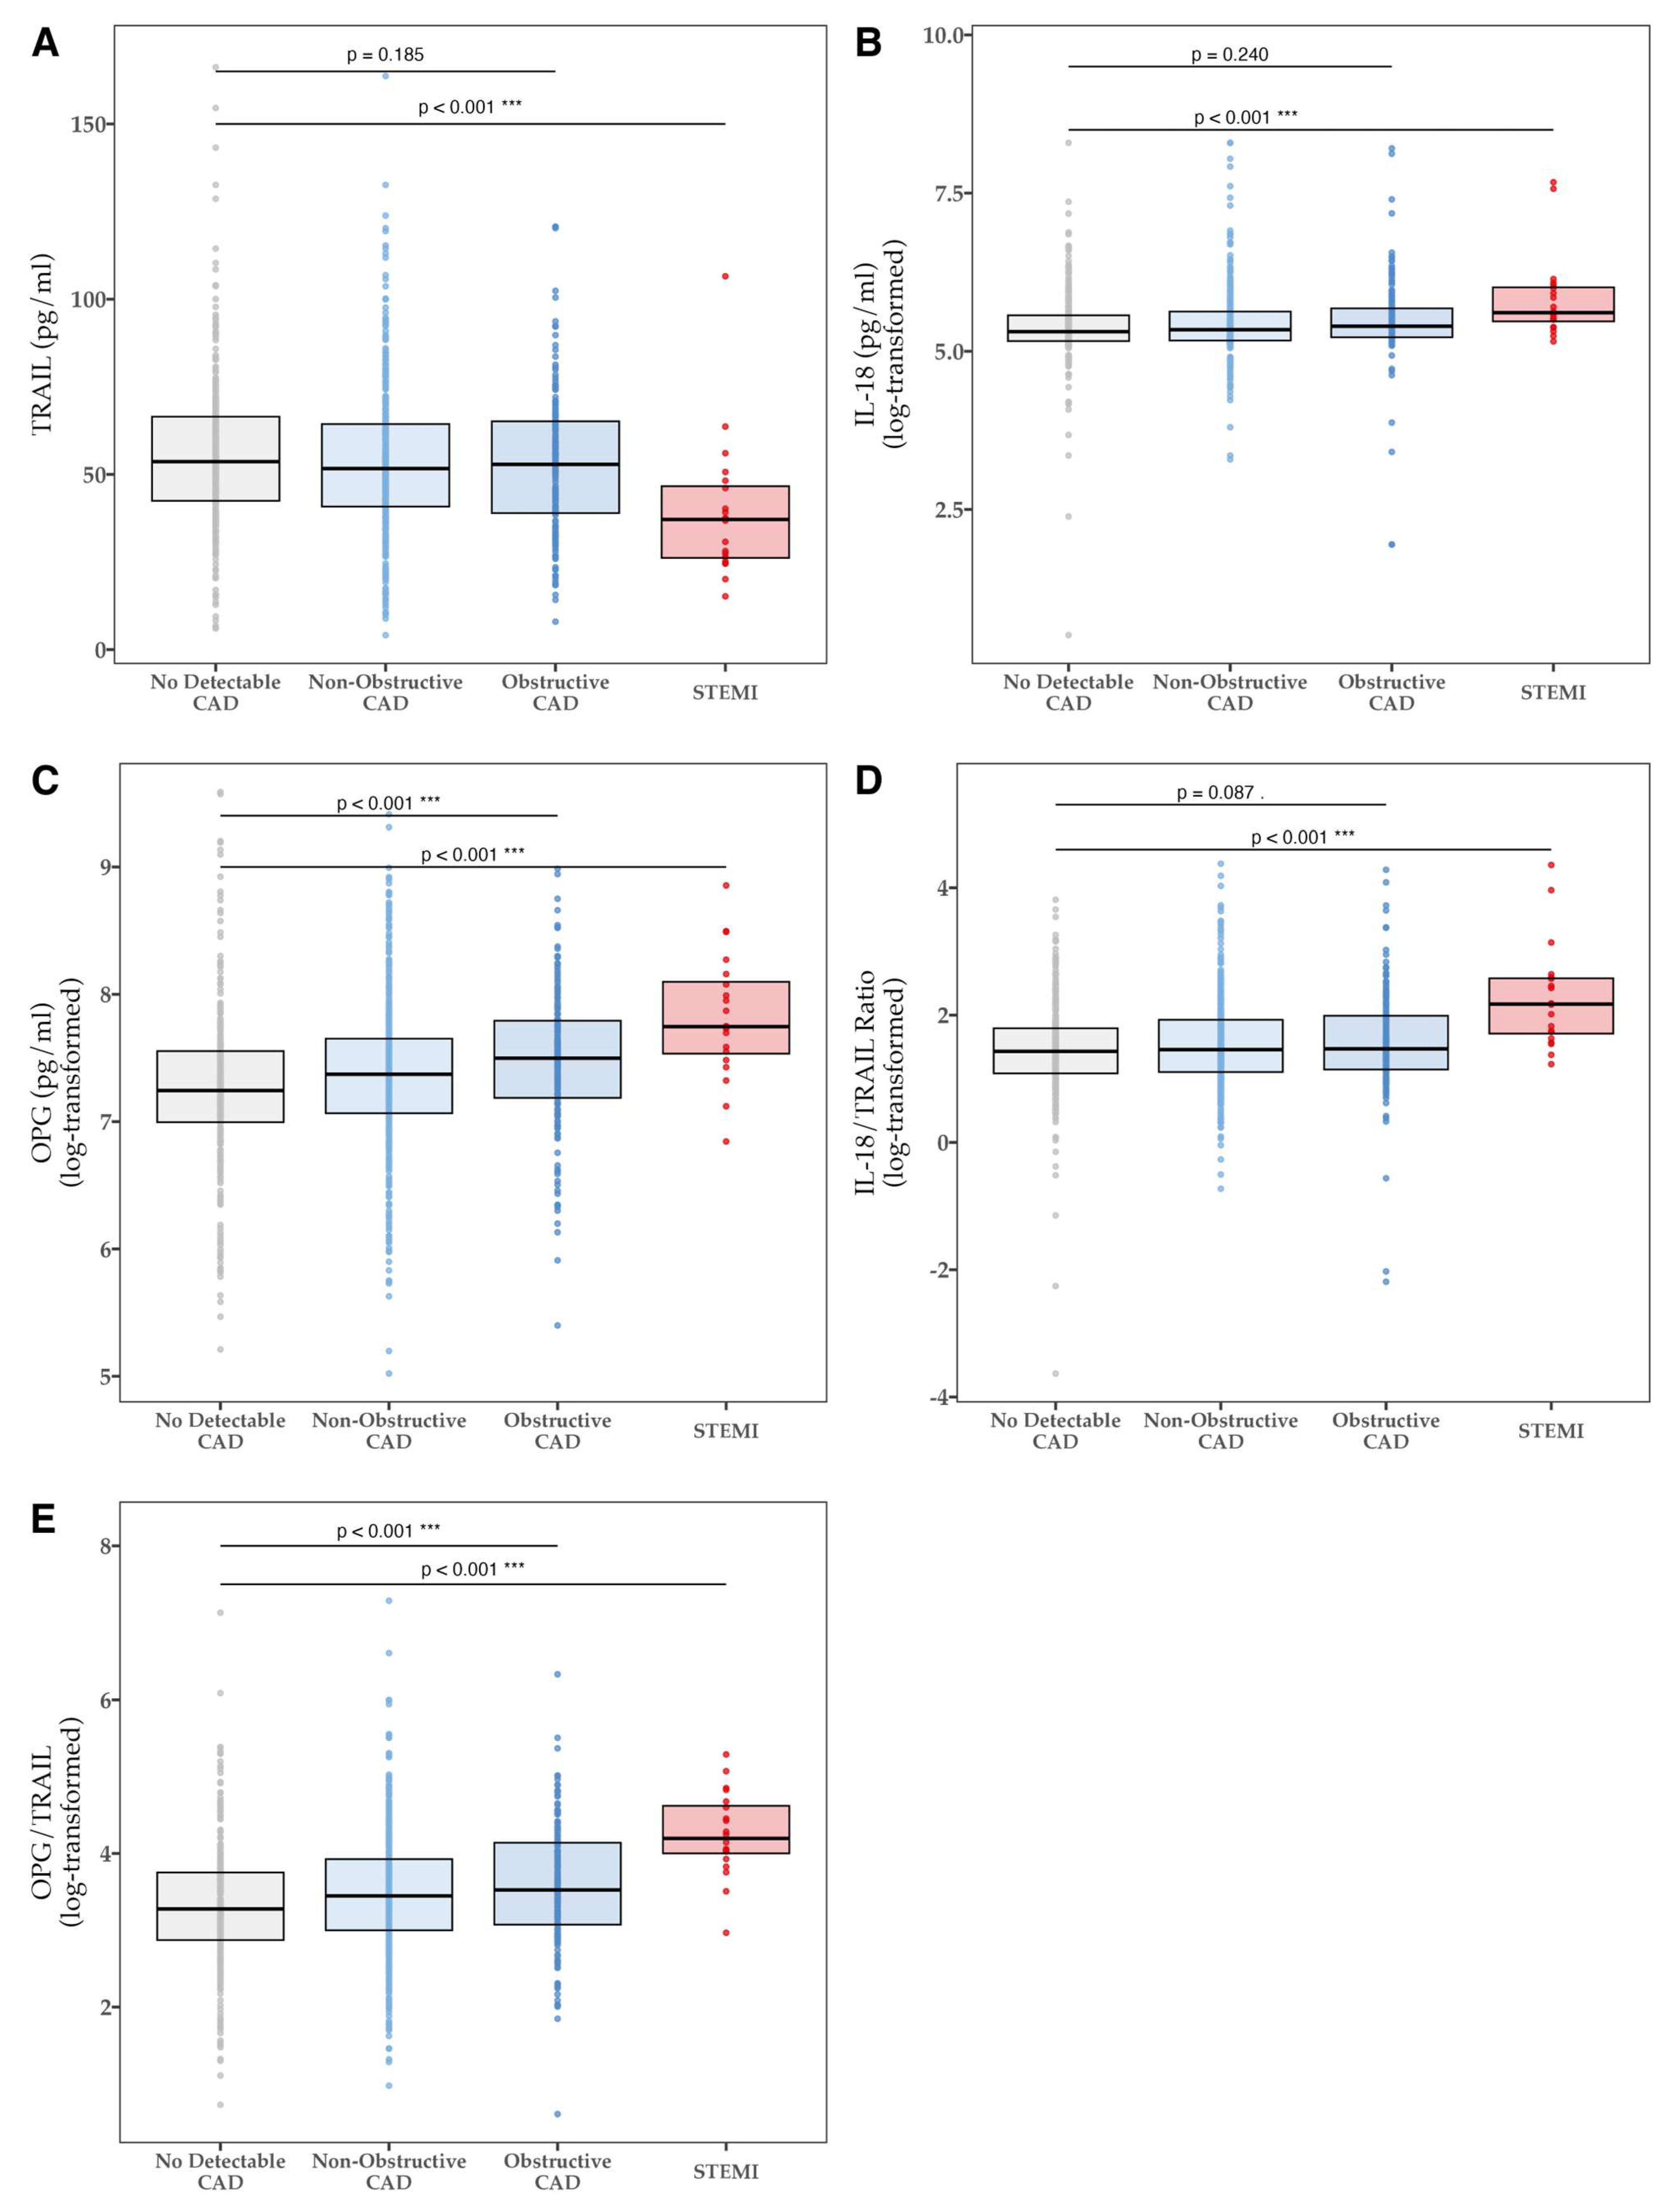
| TRAIL [pg/mL]—mean (SD) | 0.005 | ||||
| All | 55.78 (21.88) | 53.29 (21.34) | 52.90 (20.31) | 39.24 (20.19) | |
| SMuRFless | 55.77 (23.99) | 53.51 (21.07) | 56.14 (26.93) | ||
| IL-18 [pg/mL]—median (IQR) | 0.004 | ||||
| All | 202.4 (174.4–262.0) | 208.7 (175.9–278.0) | 220.1 (185.2–292.4) | 273.2 (238.3–407.8) | |
| SMuRFless | 204.7 (174.6–278.5) | 196.5 (171.2–252.0) | 206.1 (173.0–275.9) | ||
| IL-18/TRAIL ratio—median (IQR) | <0.001 | ||||
| All | 4.18 (2.96–6.01) | 4.30 (3.02–6.87) | 4.35 (3.14–7.32) | 8.79 (5.53–13.18) | |
| SMuRFless | 4.34 (3.05–6.67) | 3.81 (2.96–6.53) | 4.03 (2.81–7.43) | ||
| OPG [pg/mL]—median (IQR) | <0.001 | ||||
| All | 1396.9 (1091.7–1908.2) | 1591.2 (1171.4–2104.0) | 1805.1 (1321.6–2422.8) | 2312.5 (1871.3–3290.2) | |
| SMuRFless | 1294.6 (948.2–1974.4) | 1462.9 (1017.3–2051.6) | 1709.6 (1257.4–2695.2) | ||
| OPG/TRAIL ratio—median (IQR) | <0.001 | ||||
| All | 26.5 (17.7–42.6) | 31.4 (20.1–50.7) | 33.9 (21.6–62.8) | 66.5 (54.7–101.6) | |
| SMuRFless | 24.8 (14.8–42.6) | 29.6 (16.8–50.1) | 35.1 (19.8–85.7) |
| Biomarker Associations with Disease—Unadjusted | Quartile 1 (Lowest) | Quartile 2 | Quartile 3 | Quartile 4 (Highest) | Correlation Coefficient (τb) | p-Value |
|---|---|---|---|---|---|---|
| TRAIL [pg/mL]–median (IQR) | ||||||
| CACS | 28.6 (0.0, 203.9) | 7.1 (0.0, 98.1) | 4.5 (0.0, 162.5) | 5.2 (0.0, 118.0) | −0.056 | 0.027 |
| Gensini Score | 5.8 (0.0, 17.0) | 3.5 (0.0, 9.5) | 3.5 (0.0, 12.5) | 3.5 (0.0, 10.5) | −0.049 | 0.049 |
| Soft Plaque Score | 2.5 (0.0, 11.6) | 2.5 (0.0, 8.0) | 1.5 (0.0, 9.1) | 1.5 (0.0, 8.6) | −0.046 | 0.069 |
| IL-18 [pg/mL]–median (IQR) | ||||||
| CACS | 2.7 (0.0, 115.4) | 6.8 (0.0, 125.5) | 9.6 (0.0, 138.8) | 28.8 (0.0, 195.6) | 0.064 | 0.012 |
| Gensini Score | 2.5 (0.0, 9.5) | 4.0 (0.0, 11.3) | 3.5 (0.0, 11.5) | 5.0 (0.0, 13.0) | 0.059 | 0.020 |
| Soft Plaque Score | 0.0 (0.0, 8.0) | 2.5 (0.0, 10.0) | 2.3 (0.0, 8.5) | 3.0 (0.0, 10.1) | 0.053 | 0.040 |
| IL-18/TRAIL ratio–median (IQR) | ||||||
| CACS | 3.0 (0.0, 112.1) | 4.6 (0.0, 122.5) | 7.0 (0.0, 131.4) | 36.3 (0.0, 227.6) | 0.082 | 0.001 |
| Gensini Score | 2.5 (0.0, 10.0) | 3.5 (0.0, 10.6) | 2.8 (0.0, 11.0) | 6.0 (0.0, 14.8) | 0.068 | 0.009 |
| Soft Plaque Score | 0.0 (0.0, 8.5) | 3.0 (0.0, 9.0) | 0.0 (0.0, 8.1) | 3.5 (0.0, 10.8) | 0.055 | 0.039 |
| OPG [pg/mL]–median (IQR) | ||||||
| CACS | 0.1 (0.0, 77.4) | 1.5 (0.0, 91.2) | 20.7 (0.0, 194.5) | 32.6 (0.0, 237.6) | 0.139 | <0.001 |
| Gensini Score | 2.5 (0.0, 9.5) | 2.5 (0.0, 9.1) | 5.0 (0.0, 13.0) | 6.0 (0.0, 17.0) | 0.128 | <0.001 |
| Soft Plaque Score | 0.0 (0.0, 9.0) | 0.0 (0.0, 6.6) | 3.0 (0.0, 10.0) | 3.3 (0.0, 12.0) | 0.086 | <0.001 |
| OPG/TRAIL ratio—median (IQR) | ||||||
| CACS | 0.1 (0.0, 78.0) | 4.2 (0.0, 113.1) | 18.4 (0.0, 163.0) | 32.9 (0.0, 271.4) | 0.136 | <0.001 |
| Gensini Score | 2.5 (0.0, 10.0) | 3.5 (0.0, 10.0) | 3.5 (0.0, 11.5) | 6.5 (0.0, 17.3) | 0.114 | <0.001 |
| Soft Plaque Score | 0.0 (0.0, 9.0) | 0.0 (0.0, 8.0) | 2.5 (0.0, 9.0) | 3.5 (0.0, 11.8) | 0.078 | 0.003 |
| TRAIL | IL-18 | IL-18/TRAIL | OPG | OPG/TRAIL | |||||||
|---|---|---|---|---|---|---|---|---|---|---|---|
| Continuous Variables | n | Spearman’s rho (ρ) | p-value | Spearman’s rho (ρ) | p-value | Spearman’s rho (ρ) | p-value | Spearman’s rho (ρ) | p-value | Spearman’s rho (ρ) | p-value |
| Age (years) | 993 | −0.112 | <0.001 | 0.143 | <0.001 | 0.143 | <0.001 | 0.287 | <0.001 | 0.246 | <0.001 |
| BMI (kg/m2) | 990 | 0.097 | 0.002 | 0.001 | 0.830 | −0.059 | 0.044 | −0.033 | 0.323 | −0.071 | 0.023 |
| SMuRFs | 993 | −0.031 | 0.331 | 0.062 | 0.041 | 0.060 | 0.055 | 0.106 | <0.001 | 0.088 | 0.005 |
| Categorical Variables | n | |Cohen’s d| | p-value | |Cohen’s d| | p-value | |Cohen’s d| | p-value | |Cohen’s d| | p-value | |Cohen’s d| | p-value |
| Male | 551 | 0.039 | 0.545 | 0.024 | 0.735 | 0.037 | 0.616 | 0.030 | 0.634 | 0.008 | 0.914 |
| Hypertension | 386 | 0.024 | 0.707 | 0.030 | 0.632 | 0.034 | 0.587 | 0.121 | 0.070 | 0.041 | 0.532 |
| Hyper- lipidaemia | 587 | 0.006 | 0.920 | 0.033 | 0.611 | 0.030 | 0.631 | 0.017 | 0.797 | 0.032 | 0.660 |
| Diabetes Mellitus | 86 | 0.224 | 0.047 | 0.174 | 0.451 | 0.122 | 0.288 | 0.143 | 0.176 | 0.074 | 0.277 |
| Significant Smoking | 199 | 0.113 | 0.153 | 0.042 | 0.387 | 0.004 | 0.948 | 0.025 | 0.746 | 0.003 | 0.971 |
| Significant FH of CAD | 204 | 0.059 | 0.450 | 0.042 | 0.650 | 0.030 | 0.696 | 0.092 | 0.175 | 0.076 | 0.575 |
| TIA or Stroke | 51 | 0.079 | 0.584 | 0.388 | 0.432 | 0.472 | 0.428 | 0.080 | 0.505 | 0.022 | 0.784 |
| PAD | 14 | 0.040 | 0.880 | 0.221 | 0.573 | 0.296 | 0.467 | 0.016 | 0.960 | 0.004 | 0.982 |
| Inflammatory Arthritis | 105 | 0.005 | 0.963 | 0.007 | 0.886 | 0.021 | 0.746 | 0.017 | 0.842 | 0.049 | 0.485 |
| Atrial Fibrillation | 120 | 0.005 | 0.962 | 0.098 | 0.061 | 0.074 | 0.218 | 0.112 | 0.314 | 0.007 | 0.911 |
| Statin | 330 | 0.159 | 0.019 | 0.013 | 0.877 | 0.073 | 0.435 | 0.061 | 0.343 | 0.052 | 0.426 |
| Anti- Coagulant | 89 | 0.029 | 0.795 | 0.175 | 0.523 | 0.229 | 0.490 | 0.027 | 0.761 | 0.033 | 0.599 |
| Anti-Platelet | 176 | 0.149 | 0.074 | 0.053 | 0.0.293 | 0.027 | 0.645 | 0.026 | 0.728 | 0.008 | 0.898 |
| Beta Blocker | 140 | 0.009 | 0.917 | 0.060 | 0.619 | 0.014 | 0.854 | 0.085 | 0.241 | 0.041 | 0.674 |
| ACE Inhibitor or ARB | 316 | 0.091 | 0.180 | 0.096 | 0.308 | 0.121 | 0.257 | 0.089 | 0.190 | 0.105 | 0.175 |
| Comparison of Linear Regression Models | R2 | Adjusted R2 | F Value | p Value for Model | p Value for Model Change |
|---|---|---|---|---|---|
| Log(Gensini) | Total Cohort | ||||
| Risk Factors | 0.217 | 0.208 | 22.21 | <0.001 | |
| +TRAIL | 0.217 | 0.206 | 19.72 | <0.001 | 0.790 |
| +IL-18 | 0.218 | 0.207 | 19.75 | <0.001 | 0.621 |
| +IL18/TRAIL | 0.217 | 0.206 | 19.71 | <0.001 | 0.985 |
| +OPG | 0.217 | 0.206 | 19.71 | <0.001 | 0.962 |
| +OPG/TRAIL | 0.218 | 0.206 | 19.74 | <0.001 | 0.686 |
| Log(CACS) | Total Cohort | ||||
| Risk Factors | 0.247 | 0.236 | 23.64 | <0.001 | |
| +TRAIL | 0.247 | 0.235 | 20.98 | <0.001 | 0.895 |
| +IL-18 | 0.249 | 0.237 | 21.23 | <0.001 | 0.192 |
| +IL18/TRAIL | 0.247 | 0.235 | 21.03 | <0.001 | 0.564 |
| +OPG | 0.247 | 0.235 | 20.98 | <0.001 | 0.897 |
| +OPG/TRAIL | 0.248 | 0.236 | 21.14 | <0.001 | 0.302 |
| Log(SPS) | Total Cohort | ||||
| Risk Factors | 0.093 | 0.079 | 6.75 | <0.001 | |
| +TRAIL | 0.095 | 0.080 | 6.13 | <0.001 | 0.291 |
| +IL-18 | 0.093 | 0.078 | 6.01 | <0.001 | 0.729 |
| +IL18/TRAIL | 0.093 | 0.078 | 5.99 | <0.001 | 0.961 |
| +OPG | 0.100 | 0.084 | 6.45 | <0.001 | 0.054 |
| +OPG/TRAIL | 0.095 | 0.080 | 6.14 | <0.001 | 0.272 |
Disclaimer/Publisher’s Note: The statements, opinions and data contained in all publications are solely those of the individual author(s) and contributor(s) and not of MDPI and/or the editor(s). MDPI and/or the editor(s) disclaim responsibility for any injury to people or property resulting from any ideas, methods, instructions or products referred to in the content. |
© 2024 by the authors. Licensee MDPI, Basel, Switzerland. This article is an open access article distributed under the terms and conditions of the Creative Commons Attribution (CC BY) license (https://creativecommons.org/licenses/by/4.0/).
Share and Cite
Bate, K.A.; Genetzakis, E.; Vescovi, J.; Gray, M.P.; Celermajer, D.S.; McGuire, H.M.; Grieve, S.M.; Vernon, S.T.; Cartland, S.P.; Yang, J.Y.; et al. Vascular Cytokines and Atherosclerosis: Differential Serum Levels of TRAIL, IL-18, and OPG in Obstructive Coronary Artery Disease. Biomolecules 2024, 14, 1119. https://doi.org/10.3390/biom14091119
Bate KA, Genetzakis E, Vescovi J, Gray MP, Celermajer DS, McGuire HM, Grieve SM, Vernon ST, Cartland SP, Yang JY, et al. Vascular Cytokines and Atherosclerosis: Differential Serum Levels of TRAIL, IL-18, and OPG in Obstructive Coronary Artery Disease. Biomolecules. 2024; 14(9):1119. https://doi.org/10.3390/biom14091119
Chicago/Turabian StyleBate, Katharine A., Elijah Genetzakis, Joshua Vescovi, Michael P. Gray, David S. Celermajer, Helen M. McGuire, Stuart M. Grieve, Stephen T. Vernon, Siân P. Cartland, Jean Y. Yang, and et al. 2024. "Vascular Cytokines and Atherosclerosis: Differential Serum Levels of TRAIL, IL-18, and OPG in Obstructive Coronary Artery Disease" Biomolecules 14, no. 9: 1119. https://doi.org/10.3390/biom14091119