

Progressive Alcohol-Related Brain Atrophy and White Matter Pathology Are Linked to Long-Term Inhibitory Effects on mTOR Signaling
 ,
,
Abstract
1. Introduction
2. Materials and Methods
3. Results

| Feature | Ethanol F Ratio | p-Value | Duration F Ratio | p-Value | Ethanol × Duration F Ratio | p-Value |
|---|---|---|---|---|---|---|
| Blood Alcohol | 196.3 | <0.0001 | 1.90 | 0.09 | 1.639 | N.S. |
| Body Weight | 18.56 | <0.0001 | 57.05 | <0.0001 | 1.135 | N.S. |
| Brain Weight | 10.44 | 0.0018 | 4.527 | 0.0005 | 1.001 | N.S. |
| Liver Weight | 0.247 | N.S. | 18.54 | <0.0001 | 0.767 | N.S. |
| Molecule | Ethanol F Ratio | p-Value | Duration F Ratio | p-Value | Ethanol × Duration F Ratio | p-Value |
|---|---|---|---|---|---|---|
| CNPase | 0.719 | N.S. | 8.620 | <0.0001 | 1.65 | N.S. |
| PLP | 0.787 | N.S. | 15.46 | <0.0001 | 3.578 | 0.0038 |
| PDGFRA | 0.893 | N.S. | 5.880 | <0.0001 | 4.84 | 0.0003 |
| GalC | 2.885 | 0.093 | 26.81 | <0.0001 | 2.772 | 0.0178 |
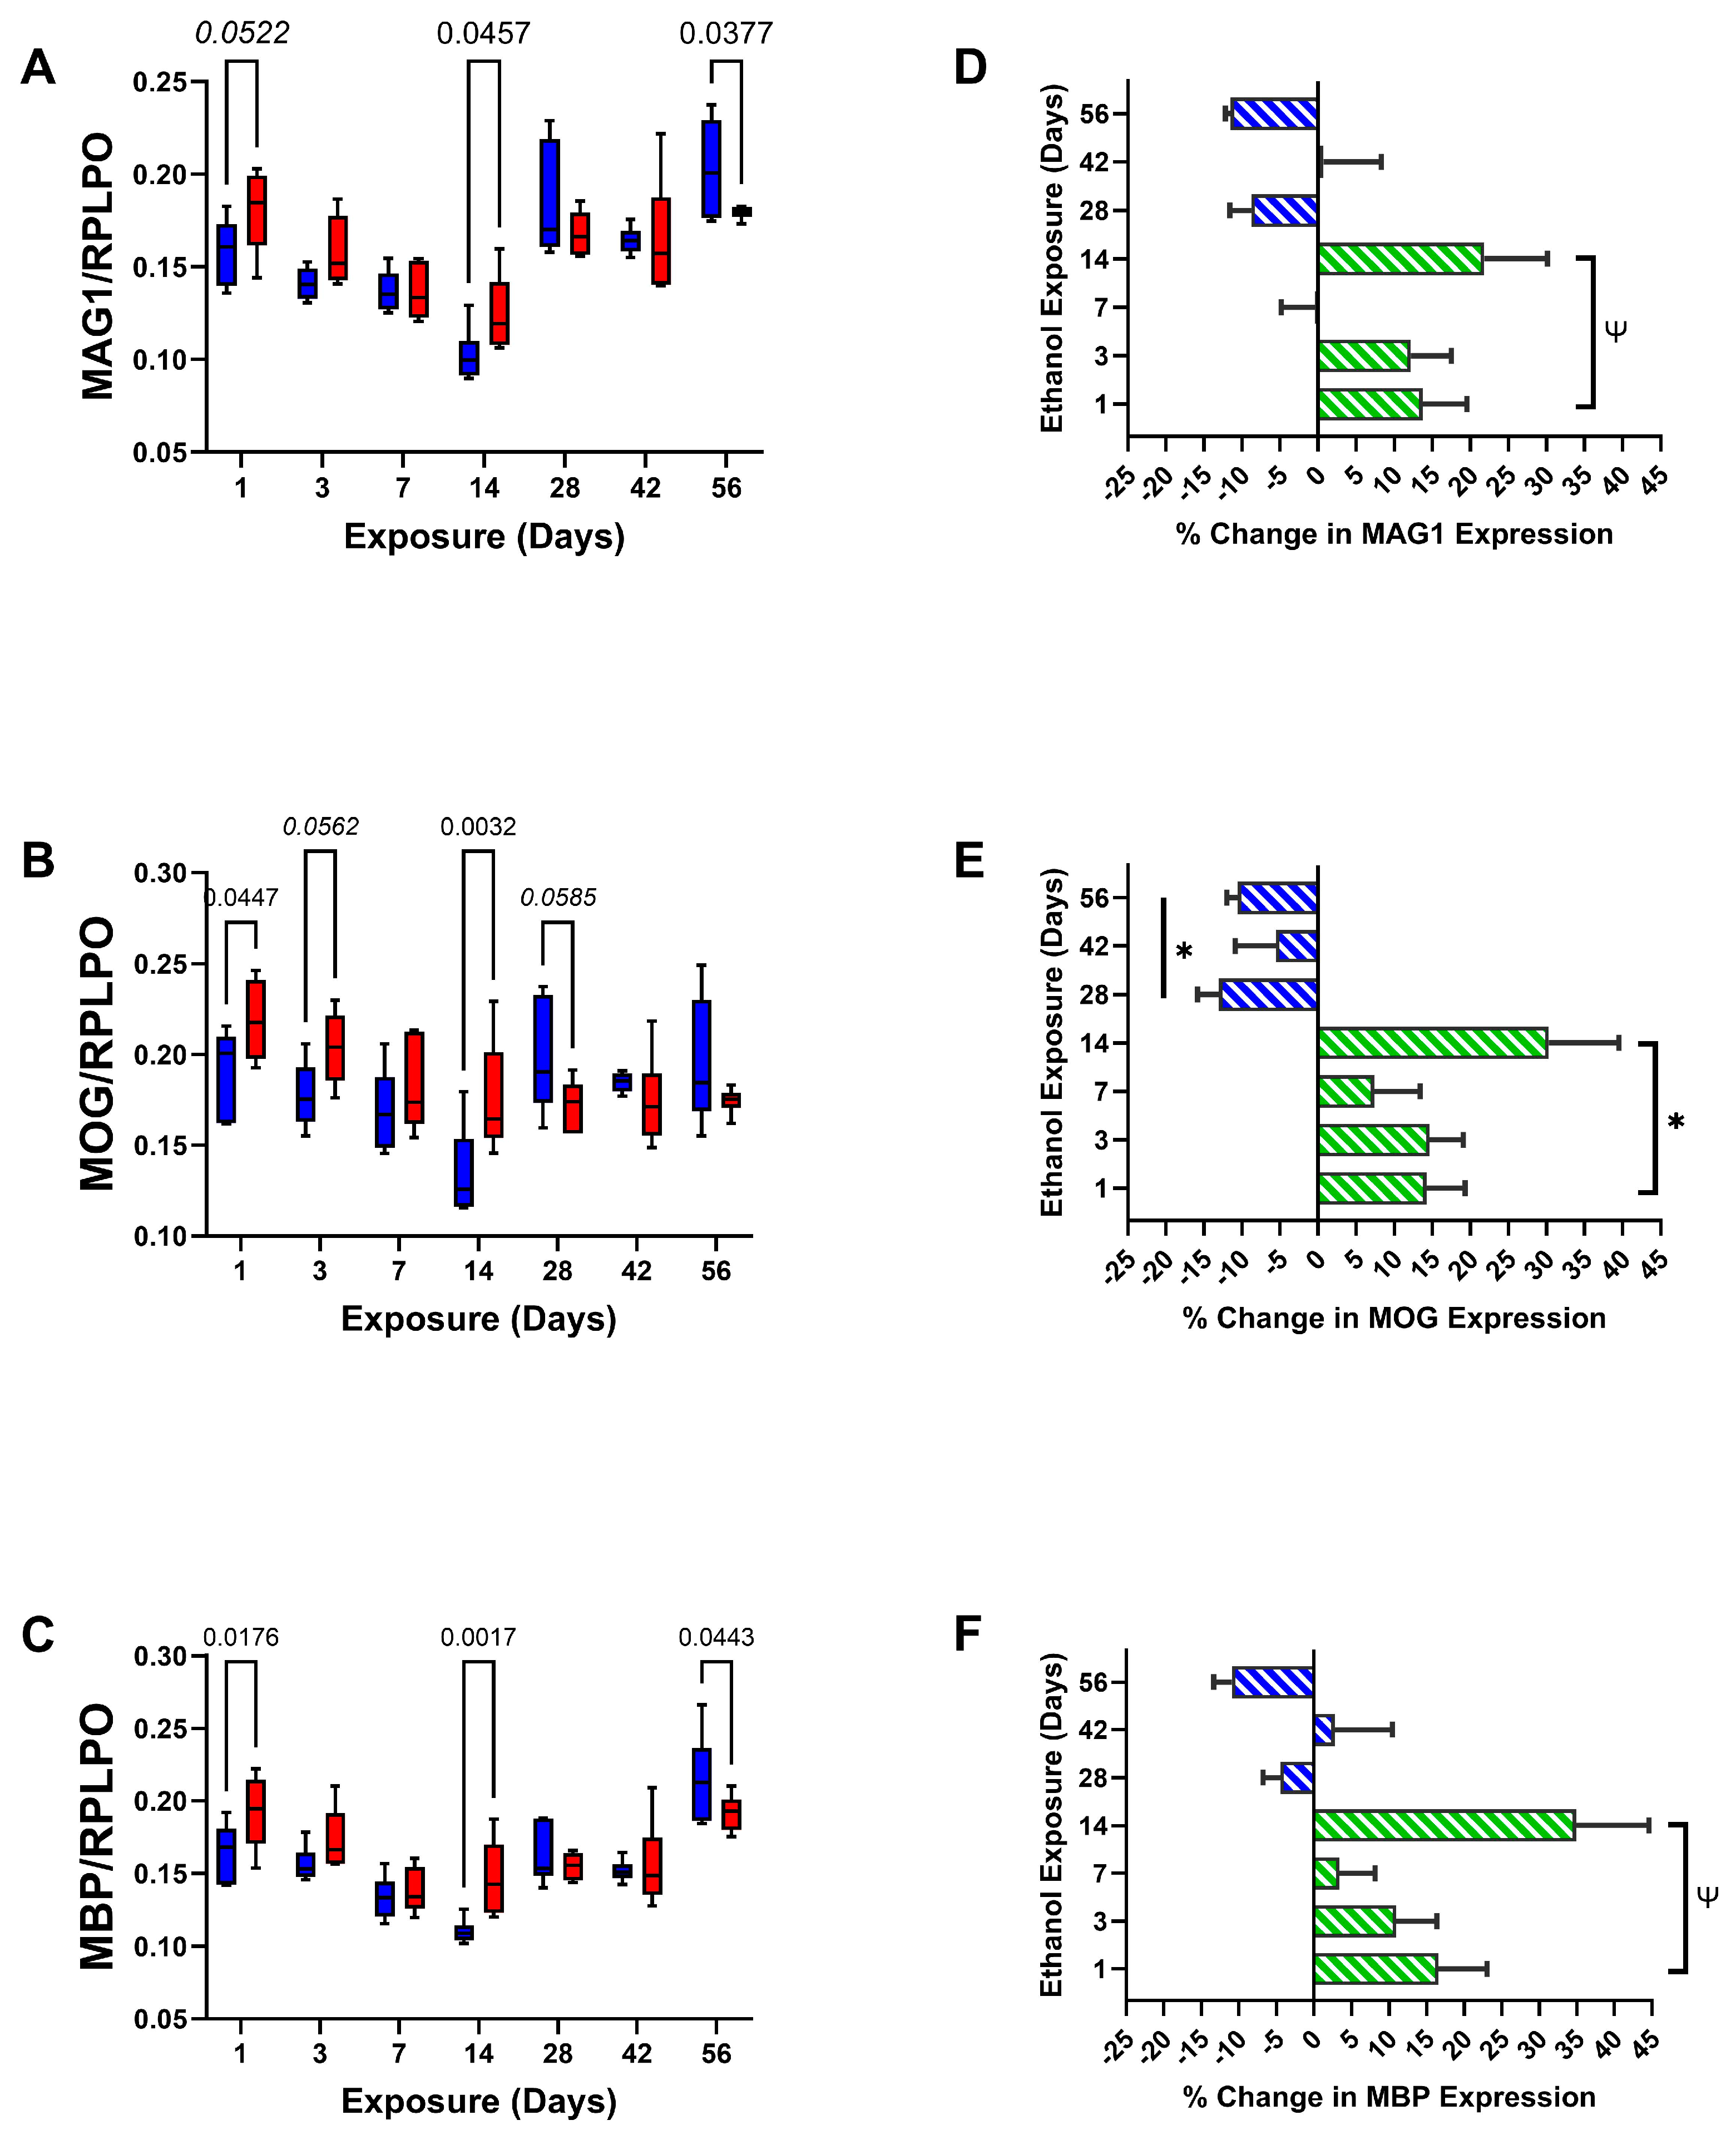
| MAG1 | 0.593 | N.S. | 22.63 | <0.0001 | 2.757 | 0.0183 |
| MOG | 2.001 | N.S. | 5.228 | 0.0002 | 3.798 | 0.0025 |
| MBP | 4.011 | 0.049 | 20.41 | <0.0001 | 3.303 | 0.0064 |
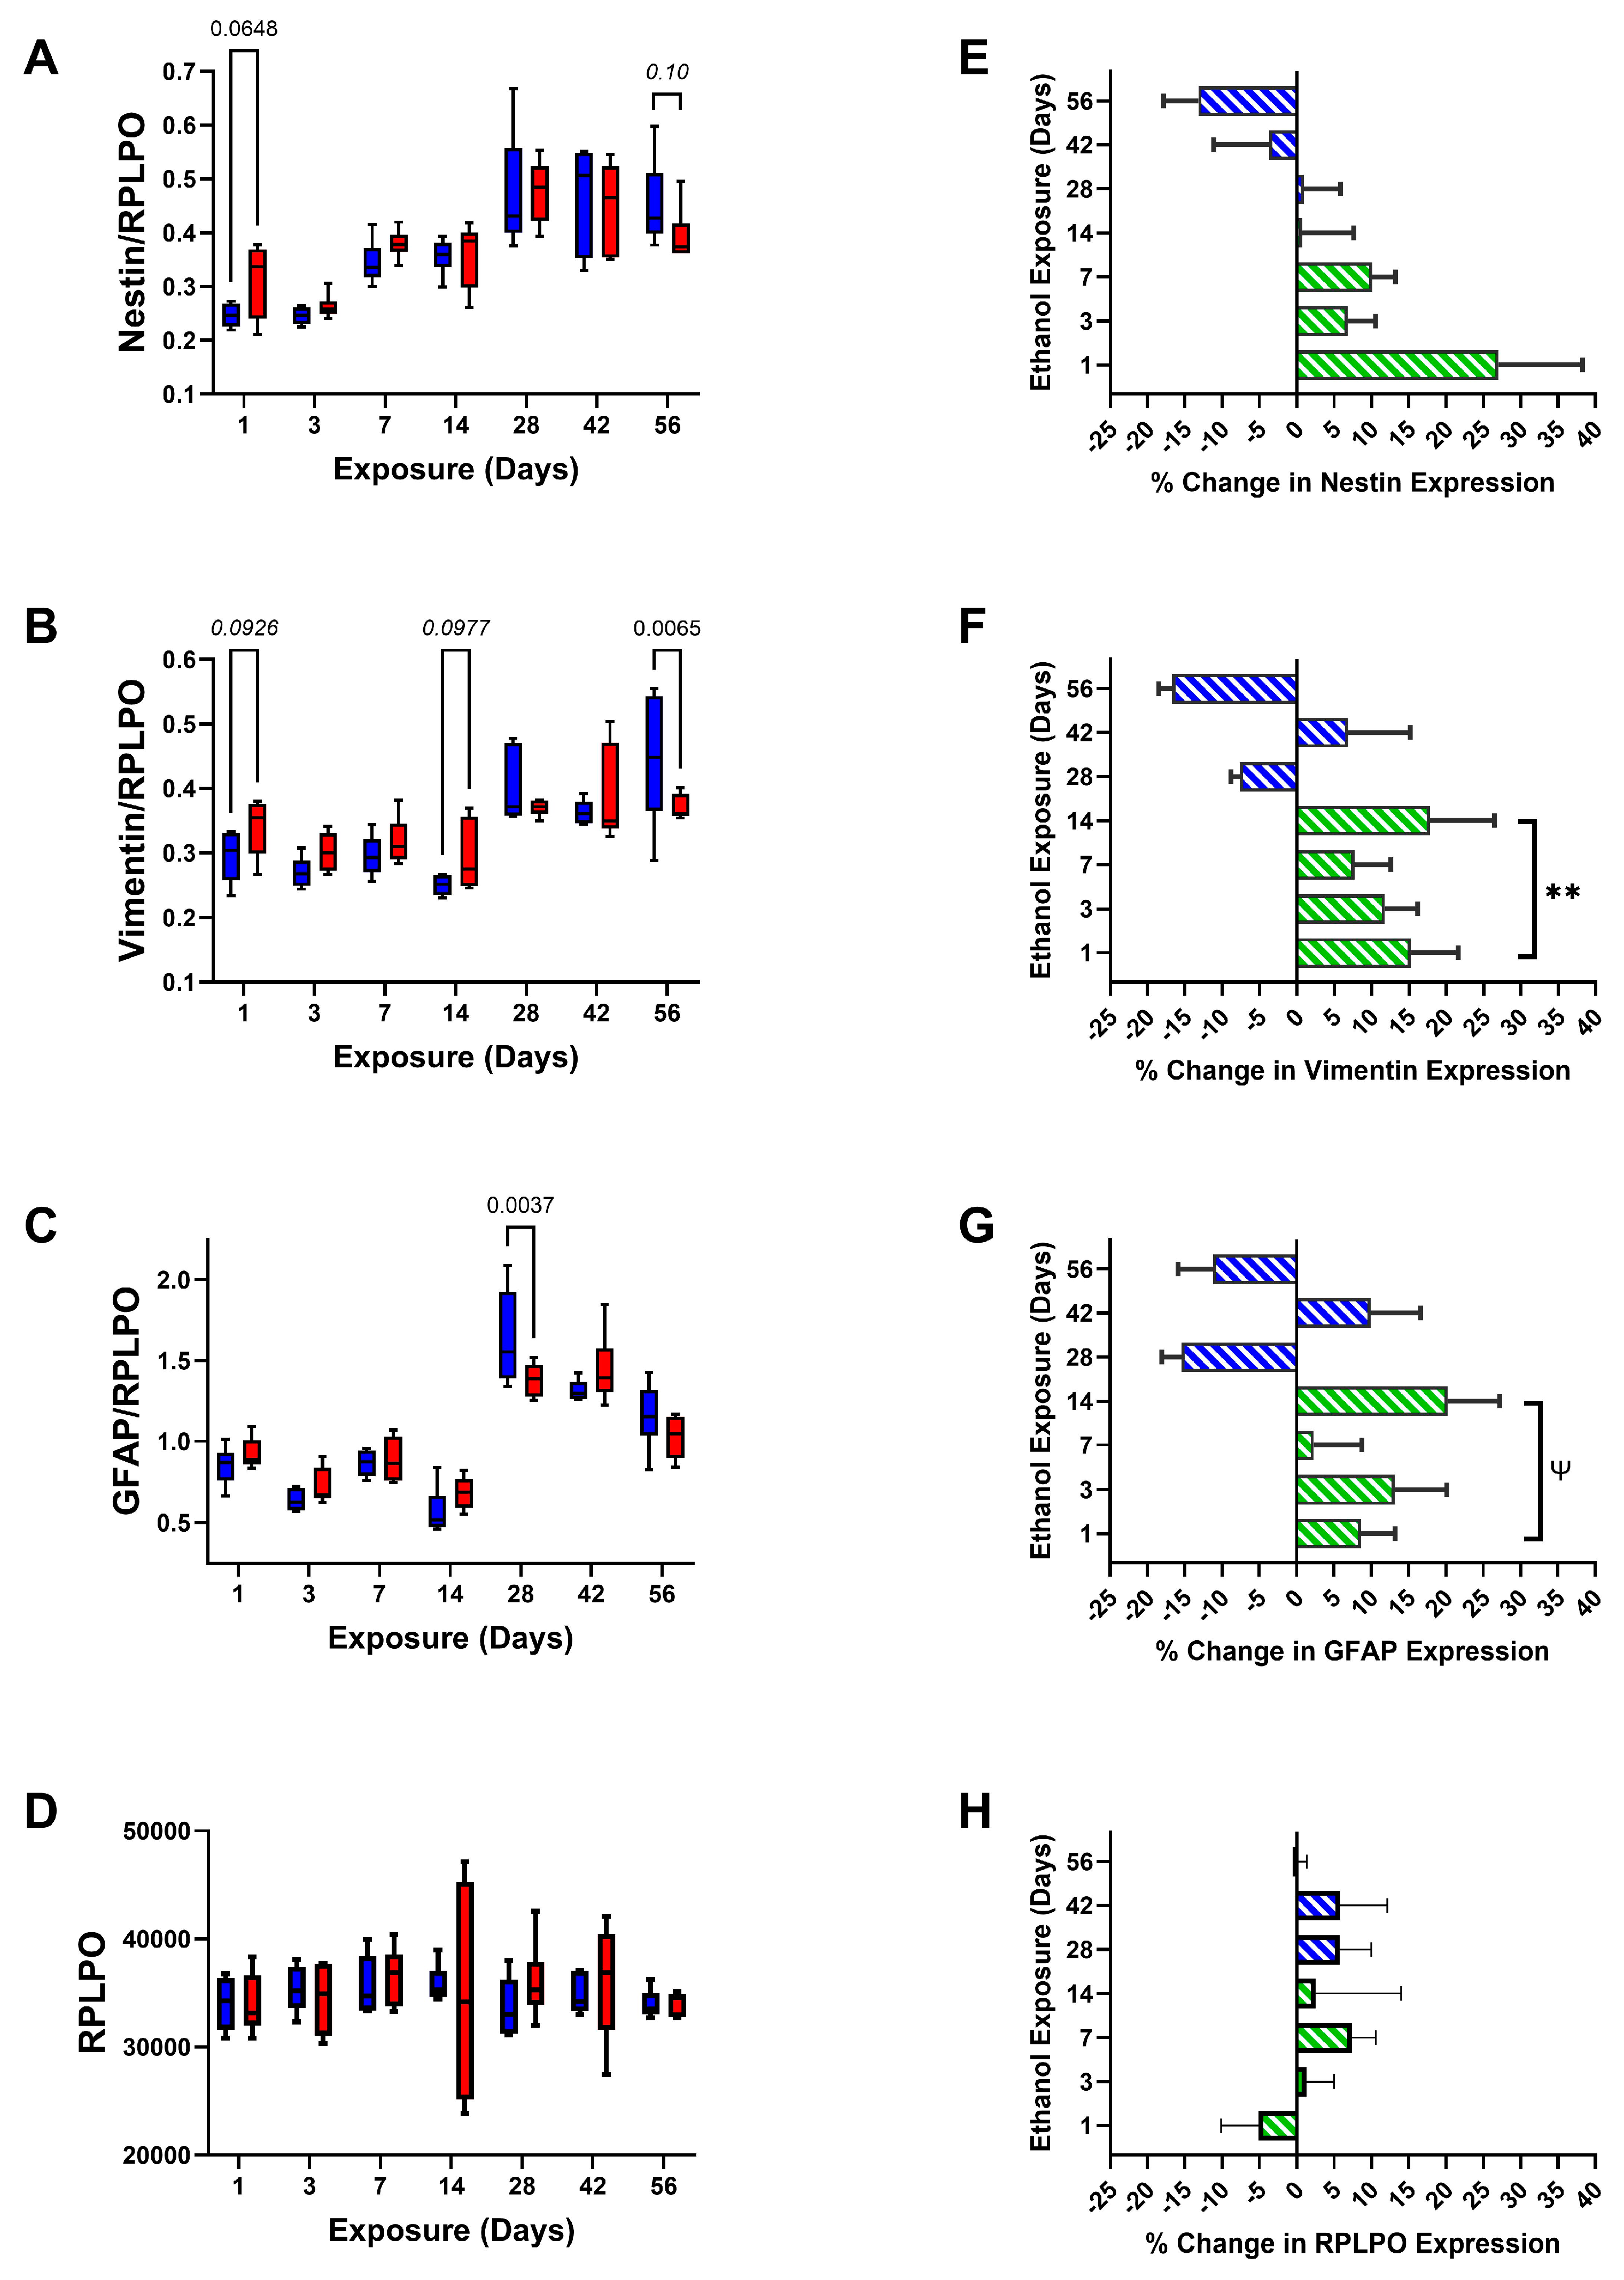
| Nestin | 0.262 | N.S. | 22.74 | <0.0001 | 1.252 | N.S. |
| Vimentin | 0.838 | N.S. | 16.10 | <0.0001 | 2.861 | 0.015 |
| GFAP | 0.0352 | N.S. | 63.87 | <0.0001 | 2.911 | 0.014 |
| RPLPO | 0.0305 | N.S. | 0.797 | N.S. | 0.427 | N.S. |
| Molecule | Early Phase Stimulation t-Statistic | p-Value | Late Phase Inhibition t-Statistic | p-Value |
|---|---|---|---|---|
| CNPase | 3.10 | 0.05 | 6.41 | 0.023 |
| PLP | 3.69 | 0.035 | 2.97 | 0.097 |
| PDGFRA | 3.72 | 0.034 | 5.56 | 0.031 |
| GalC | 2.89 | 0.063 | 2.29 | N.S. |
| MAG1 | 2.58 | 0.082 | 1.77 | N.S. |
| MOG | 3.43 | 0.041 | 4.42 | 0.048 |
| MBP | 2.45 | 0.092 | 1.07 | N.S. |
| Nestin | 1.98 | N.S. | 1.28 | N.S. |
| Vimentin | 5.99 | 0.009 | 0.85 | N.S. |
| GFAP | 2.93 | 0.061 | 0.71 | N.S. |
| RPLPO | 0.58 | N.S. | 0.18 | N.S. |
| Molecule | Ethanol F Ratio | p-Value | Duration F Ratio | p-Value | Ethanol × Duration F Ratio | p-Value |
|---|---|---|---|---|---|---|
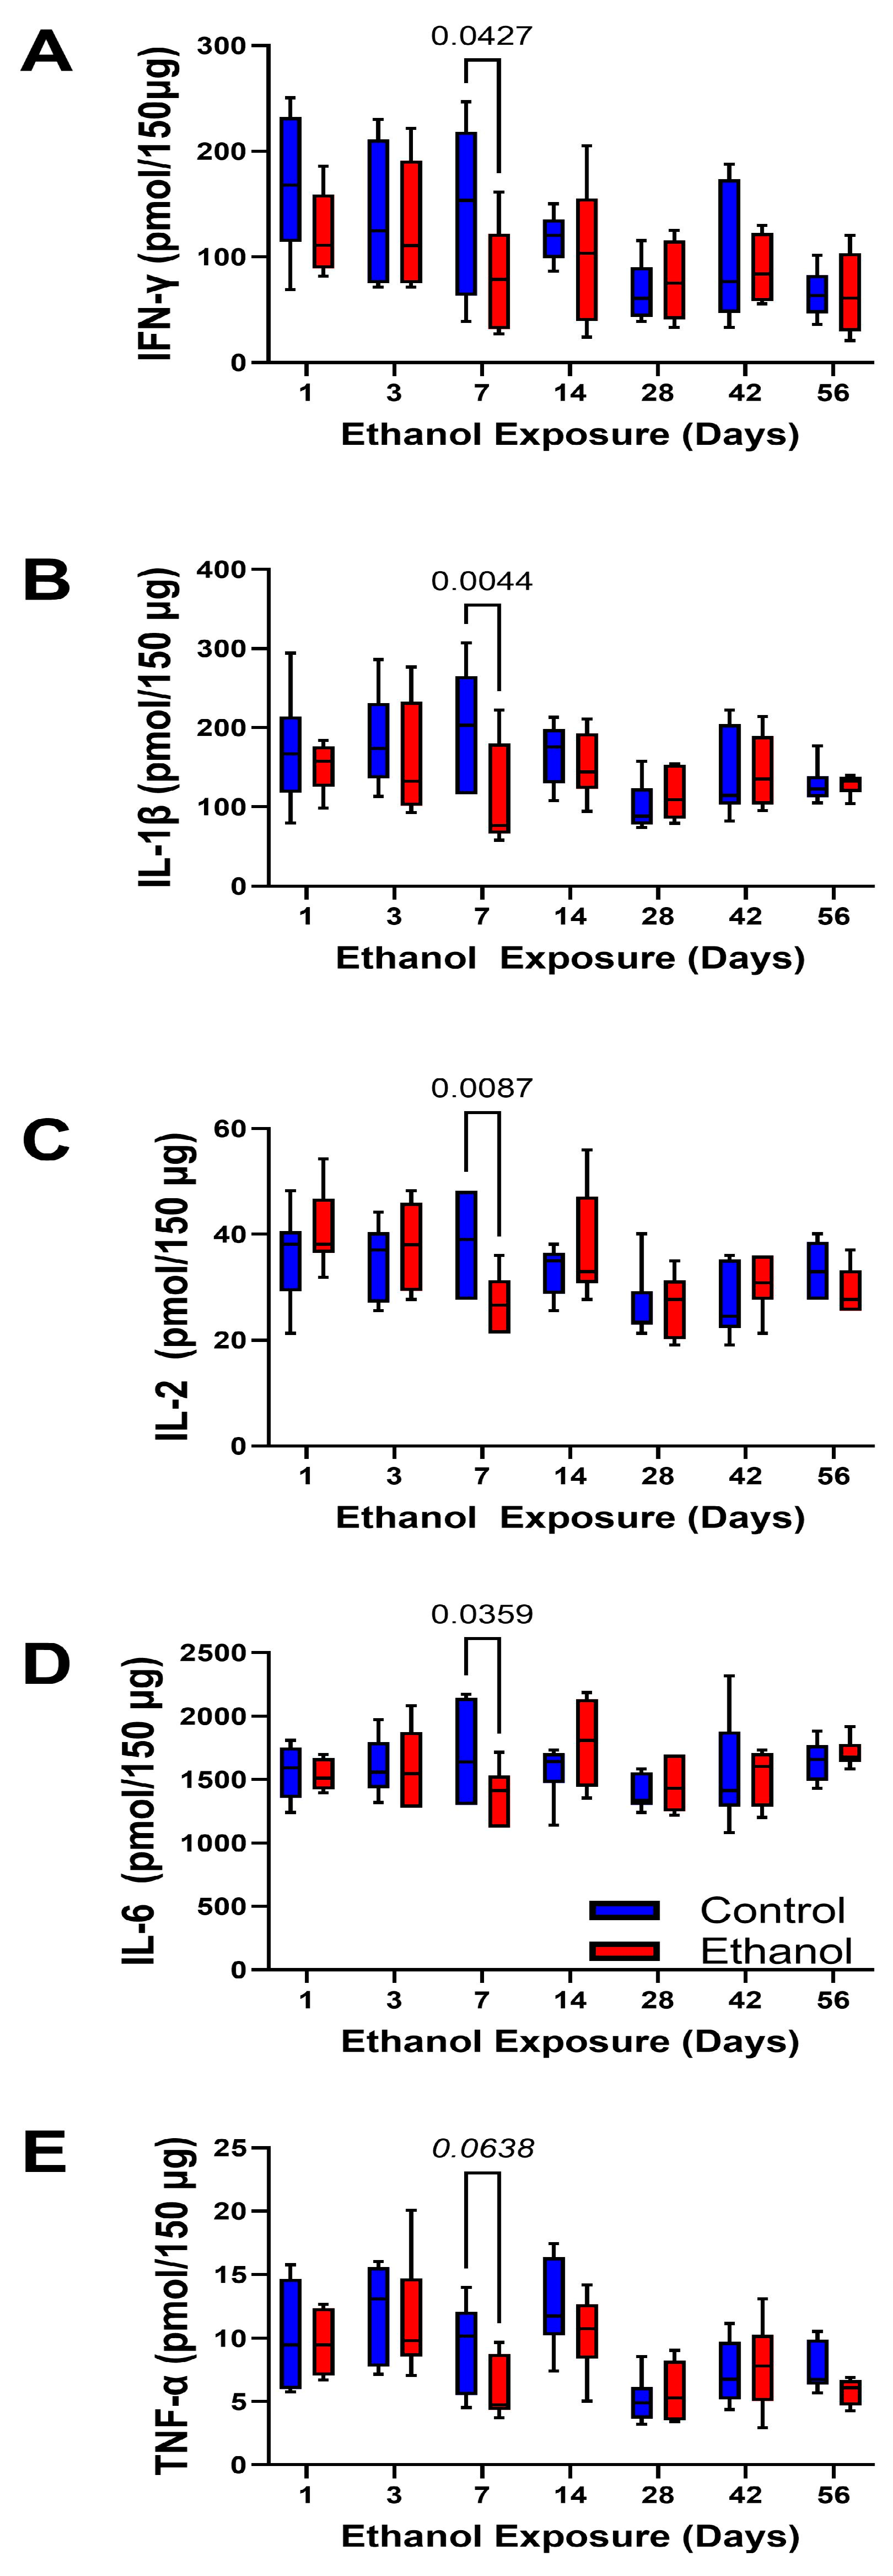
| IFN-γ | 2.62 | N.S. | 3.355 | 0.0062 | 0.672 | N.S. |
| IL-1β | 2.498 | N.S. | 2.068 | 0.068 | 1.287 | N.S. |
| IL-2 | 0.001 | N.S. | 4.056 | 0.0015 | 1.957 | 0.084 |
| IL-6 | 0.007 | N.S. | 1.340 | N.S. | 1.187 | N.S. |
| TNF-α | 2.448 | N.S. | 7.205 | <0.0001 | 0.660 | N.S. |
| Sample Group Cytokine | Equation | R2 | F-Slope = Non-Zero | p-Value | Control vs. Ethanol |
|---|---|---|---|---|---|
| Control-IFN-γ | Y = −1.621 × X + 149.9 | 0.254 | 12.92 | 0.0009 | |
| Ethanol-IFN-γ | Y = −0.8788 × X + 114.1 | 0.113 | 4.44 | 0.0423 | N.S. |
| Control-IL-1β | Y = −1.187 × X + 181.4 | 0.153 | 7.204 | 0.01 | |
| Ethanol-IL-1β | Y = −0.2625 × X + 144.0 | 0.012 | 0.481 | N.S. | N.S. |
| Control-IL-2 | Y = −0.1254 × X + 35.45 | 0.097 | 4.290 | 0.045 | |
| Ethanol-IL-2 | Y = −0.1525 × X + 36.19 | 0.123 | 5.480 | 0.024 | N.S. |
| Control-IL-6 | Y = −0.4226 × X + 1584 | 0.000 | 0.037 | N.S. | |
| Ethanol-IL-6 | Y = 1.815 × X + 1534 | 0.020 | 0.80 | N.S. | N.S. |
| Control-TNF-α | Y = −0.08180 × X + 10.95 | 0.175 | 8.503 | 0.0058 | |
| Ethanol-TNF-α | Y = −0.06645 × X + 9.602 | 0.140 | 6.331 | 0.016 | N.S. |
| Molecule | Ethanol F Ratio | p-Value | Duration F Ratio | p-Value | Ethanol × Duration F Ratio | p-Value |
|---|---|---|---|---|---|---|
| Insulin R | 2.817 | 0.097 | 13.95 | <0.0001 | 3.018 | 0.011 |
| IGF-1R | 0.297 | N.S. | 14.3 | <0.0001 | 2.410 | 0.035 |
| IRS-1 | 0.943 | N.S. | 11.89 | <0.0001 | 1.030 | N.S. |
| Akt | 1.332 | N.S. | 16.43 | <0.0001 | 0.034 | N.S. |
| PTEN | 0.002 | N.S. | 1.789 | N.S. | 1.245 | N.S. |
| GSK-3α | 0.101 | N.S. | 35.87 | <0.0001 | 4.334 | 0.0009 |
| GSK-3β | 0.005 | N.S. | 18.01 | <0.0001 | 1.708 | N.S. |
| RPS6 | 0.974 | N.S. | 15.41 | <0.0001 | 2.645 | 0.022 |
| P70S6K | 1.748 | N.S. | 6.583 | <0.0001 | 1.748 | N.S. |
| mTOR | 2.757 | 0.10 | 52.77 | <0.0001 | 3.002 | 0.011 |
| TSC2 | 0.028 | N.S. | 14.83 | <0.0001 | 1.274 | N.S. |
| Rictor | 19.73 | <0.0001 | 63.21 | <0.0001 | 6.865 | <0.0001 |
| Raptor | 38.70 | <0.0001 | 87.63 | <0.0001 | 6.646 | <0.0001 |
| Molecule | Ethanol F Ratio | p-Value | Duration F Ratio | p-Value | Ethanol × Duration F Ratio | p-Value |
|---|---|---|---|---|---|---|
| pYpY1162/1163-Insulin R | 0.219 | N.S. | 5.101 | 0.0002 | 2.886 | 0.014 |
| pYpY1162/1163-IGF-1R | 1.558 | N.S. | 16.14 | <0.0001 | 2.551 | 0.027 |
| pS636-IRS-1 | 0.405 | N.S. | 3.012 | 0.011 | 2.689 | 0.021 |
| pS473-Akt | 0.06 | N.S. | 26.58 | <0.0001 | 2.014 | 0.074 |
| pS380-PTEN | 0.812 | N.S. | 3.568 | 0.0038 | 1.206 | N.S. |
| pS21-GSK-3α | 0.114 | N.S. | 3.807 | 0.0024 | 3.100 | 0.009 |
| pS9-GSK-3β | 0.068 | N.S. | 2.179 | 0.05 | 3.266 | 0.0068 |
| pS235/S236-RPS6 | 0.005 | N.S. | 4.122 | 0.0013 | 1.749 | N.S. |
| pT412-P70S6K | 2.381 | N.S. | 8.247 | <0.0001 | 2.619 | 0.024 |
| pS2448-mTOR | 0.952 | N.S. | 4.196 | 0.001 | 2.21 | 0.05 |
| pS939-TSC2 | 1.668 | N.S. | 3.168 | 0.0082 | 2.437 | 0.033 |
| pS1591-Rictor | 18.08 | <0.0001 | 74.80 | <0.0001 | 7.23 | <0.0001 |
| pS792-Raptor | 42.46 | <0.0001 | 55.49 | <0.0001 | 5.174 | 0.0002 |
| Molecule | Ethanol F Ratio | p-Value | Duration F Ratio | p-Value | Ethanol × Duration F Ratio | p-Value |
|---|---|---|---|---|---|---|
| pYpY1162/1163-/Insulin R | 1.286 | N.S. | 17.91 | 0.0001 | 2.180 | 0.055 |
| pYpY1162/1163-/IGF-1R | 0.002 | N.S. | 4.880 | 0.0003 | 1.578 | N.S. |
| pS636-/IRS-1 | 0.638 | N.S. | 12.58 | 0.0001 | 0.404 | N.S. |
| pS473-/Akt | 0.258 | N.S. | 7.443 | <0.0001 | 2.263 | 0.047 |
| pS380-/PTEN | 0.671 | N.S. | 1.744 | N.S. | 2.913 | 0.013 |
| pS21-/GSK-3α | 1.011 | N.S. | 47.37 | <0.0001 | 1.591 | N.S. |
| pS9-/GSK-3β | 0.004 | N.S. | 22.77 | <0.0001 | 1.617 | N.S. |
| pS235/S236-/RPS6 | 0.285 | N.S. | 16.64 | <0.0001 | 2.845 | 0.015 |
| pT412-/P70S6K | 1.809 | N.S. | 5.680 | <0.0001 | 1.148 | N.S. |
| pS2448-/mTOR | 0.183 | N.S. | 56.38 | <0.0001 | 2.139 | 0.059 |
| pS939-/TSC2 | 3.099 | 0.083 | 3.820 | 0.0023 | 2.451 | 0.033 |
| pS1591-/Rictor | 1.176 | N.S. | 7.679 | <0.0001 | 0.992 | N.S. |
| pS792-/Raptor | 2.187 | N.S. | 43.12 | <0.0001 | 0.740 | N.S. |
4. Discussion
5. Conclusions
Supplementary Materials
Author Contributions
Funding
Institutional Review Board Statement
Informed Consent Statement
Data Availability Statement
Acknowledgments
Conflicts of Interest
References
- Bouchery, E.E.; Harwood, H.J.; Sacks, J.J.; Simon, C.J.; Brewer, R.D. Economic costs of excessive alcohol consumption in the U.S., 2006. Am. J. Prev. Med. 2011, 41, 516–524. [Google Scholar] [CrossRef] [PubMed]
- Rehm, J.; Baliunas, D.; Borges, G.L.; Graham, K.; Irving, H.; Kehoe, T.; Parry, C.D.; Patra, J.; Popova, S.; Poznyak, V.; et al. The relation between different dimensions of alcohol consumption and burden of disease: An overview. Addiction 2010, 105, 817–843. [Google Scholar] [CrossRef] [PubMed]
- Sacks, J.J.; Gonzales, K.R.; Bouchery, E.E.; Tomedi, L.E.; Brewer, R.D. 2010 National and State Costs of Excessive Alcohol Consumption. Am. J. Prev. Med. 2015, 49, e73–e79. [Google Scholar] [CrossRef] [PubMed]
- Stahre, M.; Roeber, J.; Kanny, D.; Brewer, R.D.; Zhang, X. Contribution of excessive alcohol consumption to deaths and years of potential life lost in the United States. Prev. Chronic Dis. 2014, 11, E109. [Google Scholar] [CrossRef]
- Brust, J. Ethanol and Cognition: Indirect Effects, Neurotoxicity and Neuroprotection: A Review. Int. J. Environ. Res. Public Health 2010, 7, 1540–1557. [Google Scholar] [CrossRef]
- de la Monte, S.M.; Kril, J.J. Human alcohol-related neuropathology. Acta Neuropathol. 2014, 127, 71–90. [Google Scholar] [CrossRef]
- Fortier, C.B.; Leritz, E.C.; Salat, D.H.; Lindemer, E.; Maksimovskiy, A.L.; Shepel, J.; Williams, V.; Venne, J.R.; Milberg, W.P.; McGlinchey, R.E. Widespread effects of alcohol on white matter microstructure. Alcohol. Clin. Exp. Res. 2014, 38, 2925–2933. [Google Scholar] [CrossRef]
- de la Monte, S.M. Disproportionate atrophy of cerebral white matter in chronic alcoholics. Arch Neurol. 1988, 45, 990–992. [Google Scholar] [CrossRef]
- Harper, C.; Dixon, G.; Sheedy, D.; Garrick, T. Neuropathological alterations in alcoholic brains. Studies arising from the New South Wales Tissue Resource Centre. Prog. Neuropsychopharmacol. Biol. Psychiatry 2003, 27, 951–961. [Google Scholar] [CrossRef]
- Sutherland, G.T.; Sheedy, D.; Kril, J.J. Neuropathology of alcoholism. Handb. Clin. Neurol. 2014, 125, 603–615. [Google Scholar] [CrossRef]
- Kuhn, S.; Gritti, L.; Crooks, D.; Dombrowski, Y. Oligodendrocytes in Development, Myelin Generation and Beyond. Cells 2019, 8, 1424. [Google Scholar] [CrossRef] [PubMed]
- Simons, M.; Nave, K.A. Oligodendrocytes: Myelination and Axonal Support. Cold Spring Harb. Perspect. Biol. 2015, 8, a020479. [Google Scholar] [CrossRef] [PubMed]
- Benjamins, J.A.; Nedelkoska, L.; Lisak, R.P.; Hannigan, J.H.; Sokol, R.J. Cytokines reduce toxic effects of ethanol on oligodendroglia. Neurochem. Res. 2011, 36, 1677–1686. [Google Scholar] [CrossRef] [PubMed]
- Creeley, C.E.; Dikranian, K.T.; Johnson, S.A.; Farber, N.B.; Olney, J.W. Alcohol-induced apoptosis of oligodendrocytes in the fetal macaque brain. Acta Neuropathol. Commun. 2013, 1, 23. [Google Scholar] [CrossRef]
- Joseph D’Ercole, A.; Ye, P. Expanding the mind: Insulin-like growth factor I and brain development. Endocrinology 2008, 149, 5958–5962. [Google Scholar] [CrossRef]
- Zeger, M.; Popken, G.; Zhang, J.; Xuan, S.; Lu, Q.R.; Schwab, M.H.; Nave, K.A.; Rowitch, D.; D’Ercole, A.J.; Ye, P. Insulin-like growth factor type 1 receptor signaling in the cells of oligodendrocyte lineage is required for normal in vivo oligodendrocyte development and myelination. Glia 2007, 55, 400–411. [Google Scholar] [CrossRef]
- Chesik, D.; De Keyser, J.; Wilczak, N. Insulin-like growth factor system regulates oligodendroglial cell behavior: Therapeutic potential in CNS. J. Mol. Neurosci. 2008, 35, 81–90. [Google Scholar] [CrossRef]
- Ewenczyk, A.; Ziplow, J.; Tong, M.; Le, T.; de la Monte, S.M. Sustained Impairments in Brain Insulin/IGF Signaling in Adolescent Rats Subjected to Binge Alcohol Exposures during Development. J. Clin. Exp. Pathol. 2012, 2, 106. [Google Scholar] [CrossRef]
- Le, T.; Tong, M.; Nguyen, V.; de la Monte, S.M. PPAR Agonist Rescue of Ethanol-Impaired Brain Insulin Signaling: Cerebellar Slice Culture Model. J. Drug Alcohol Res. 2013, 2, 235611. [Google Scholar] [CrossRef]
- Tong, M.; Yu, R.; Deochand, C.; de la Monte, S.M. Differential Contributions of Alcohol and the Nicotine-Derived Nitrosamine Ketone (NNK) to Insulin and Insulin-Like Growth Factor Resistance in the Adolescent Rat Brain. Alcohol Alcohol. 2015, 50, 670–679. [Google Scholar] [CrossRef]
- Spear, L. The Teenage Brain: Adolescents and Alcohol. Curr. Dir. Psychol. Sci. 2013, 22, 152–157. [Google Scholar] [CrossRef] [PubMed]
- de Goede, J.; van der Mark-Reeuwijk, K.G.; Braun, K.P.; le Cessie, S.; Durston, S.; Engels, R.C.M.E.; Goudriaan, A.E.; Moons, K.G.M.; Vollebergh, W.A.M.; de Vries, T.J.; et al. Alcohol and Brain Development in Adolescents and Young Adults: A Systematic Review of the Literature and Advisory Report of the Health Council of The Netherlands. Adv. Nutr. 2021, 12, 1379–1410. [Google Scholar] [CrossRef] [PubMed]
- Lam, V.Y.Y.; Raineki, C.; Ellis, L.; Yu, W.; Weinberg, J. Interactive effects of prenatal alcohol exposure and chronic stress in adulthood on anxiety-like behavior and central stress-related receptor mRNA expression: Sex- and time-dependent effects. Psychoneuroendocrinology 2018, 97, 8–19. [Google Scholar] [CrossRef] [PubMed]
- Lees, B.; Meredith, L.R.; Kirkland, A.E.; Bryant, B.E.; Squeglia, L.M. Effect of alcohol use on the adolescent brain and behavior. Pharmacol. Biochem. Behav. 2020, 192, 172906. [Google Scholar] [CrossRef]
- Lees, B.; Mewton, L.; Jacobus, J.; Valadez, E.A.; Stapinski, L.A.; Teesson, M.; Tapert, S.F.; Squeglia, L.M. Association of Prenatal Alcohol Exposure with Psychological, Behavioral, and Neurodevelopmental Outcomes in Children from the Adolescent Brain Cognitive Development Study. Am. J. Psychiatry 2020, 177, 1060–1072. [Google Scholar] [CrossRef]
- Pfefferbaum, A.; Sullivan, E.V.; Pohl, K.M.; Bischoff-Grethe, A.; Stoner, S.A.; Moore, E.M.; Riley, E.P. Brain Volume in Fetal Alcohol Spectrum Disorders Over a 20-Year Span. JAMA Netw. Open 2023, 6, e2343618. [Google Scholar] [CrossRef]
- Li, Q.; Ren, J. Chronic alcohol consumption alters mammalian target of rapamycin (mTOR), reduces ribosomal p70s6 kinase and p4E-BP1 levels in mouse cerebral cortex. Exp. Neurol. 2007, 204, 840–844. [Google Scholar] [CrossRef]
- de la Monte, S.M.; Tong, M.; Delikkaya, B. Differential Early Mechanistic Frontal Lobe Responses to Choline Chloride and Soy Isoflavones in an Experimental Model of Fetal Alcohol Spectrum Disorder. Int. J. Mol. Sci. 2023, 24, 7595. [Google Scholar] [CrossRef]
- Yalcin, E.B.; Tong, M.; Delikkaya, B.; Pelit, W.; Yang, Y.; de la Monte, S.M. Differential effects of moderate chronic ethanol consumption on neurobehavior, white matter glial protein expression, and mTOR pathway signaling with adolescent brain maturation. Am. J. Drug Alcohol Abus. 2024, 50, 492–516. [Google Scholar] [CrossRef]
- Figlia, G.; Gerber, D.; Suter, U. Myelination and mTOR. Glia 2018, 66, 693–707. [Google Scholar] [CrossRef]
- Narayanan, S.P.; Flores, A.I.; Wang, F.; Macklin, W.B. Akt signals through the mammalian target of rapamycin pathway to regulate CNS myelination. J. Neurosci. 2009, 29, 6860–6870. [Google Scholar] [CrossRef] [PubMed]
- Zhou, H.; Huang, S. The complexes of mammalian target of rapamycin. Curr Protein Pept Sci 2010, 11, 409–424. [Google Scholar] [CrossRef] [PubMed]
- Tyler, W.A.; Gangoli, N.; Gokina, P.; Kim, H.A.; Covey, M.; Levison, S.W.; Wood, T.L. Activation of the mammalian target of rapamycin (mTOR) is essential for oligodendrocyte differentiation. J. Neurosci. 2009, 29, 6367–6378. [Google Scholar] [CrossRef] [PubMed]
- Goebbels, S.; Oltrogge, J.H.; Kemper, R.; Heilmann, I.; Bormuth, I.; Wolfer, S.; Wichert, S.P.; Mobius, W.; Liu, X.; Lappe-Siefke, C.; et al. Elevated phosphatidylinositol 3,4,5-trisphosphate in glia triggers cell-autonomous membrane wrapping and myelination. J. Neurosci. 2010, 30, 8953–8964. [Google Scholar] [CrossRef]
- Dubois, J.; Dehaene-Lambertz, G.; Kulikova, S.; Poupon, C.; Huppi, P.S.; Hertz-Pannier, L. The early development of brain white matter: A review of imaging studies in fetuses, newborns and infants. Neuroscience 2014, 276, 48–71. [Google Scholar] [CrossRef]
- Laplante, M.; Sabatini, D.M. mTOR Signaling. Cold Spring Harb. Perspect. Biol. 2012, 4, a011593. [Google Scholar] [CrossRef]
- Jacobus, J.; Squeglia, L.M.; Bava, S.; Tapert, S.F. White matter characterization of adolescent binge drinking with and without co-occurring marijuana use: A 3-year investigation. Psychiatry Res. 2013, 214, 374–381. [Google Scholar] [CrossRef]
- Estruch, R.; Nicolas, J.M.; Salamero, M.; Aragon, C.; Sacanella, E.; Fernandez-Sola, J.; Urbano-Marquez, A. Atrophy of the corpus callosum in chronic alcoholism. J. Neurol. Sci. 1997, 146, 145–151. [Google Scholar] [CrossRef]
- Pfefferbaum, A.; Sullivan, E.V. Microstructural but not macrostructural disruption of white matter in women with chronic alcoholism. Neuroimage 2002, 15, 708–718. [Google Scholar] [CrossRef]
- Woods, A.J.; Porges, E.C.; Bryant, V.E.; Seider, T.; Gongvatana, A.; Kahler, C.W.; de la Monte, S.; Monti, P.M.; Cohen, R.A. Current Heavy Alcohol Consumption is Associated with Greater Cognitive Impairment in Older Adults. Alcohol. Clin. Exp. Res. 2016, 40, 2435–2444. [Google Scholar] [CrossRef]
- Estilaei, M.R.; Matson, G.B.; Payne, G.S.; Leach, M.O.; Fein, G.; Meyerhoff, D.J. Effects of abstinence from alcohol on the broad phospholipid signal in human brain: An in vivo 31P magnetic resonance spectroscopy study. Alcohol. Clin. Exp. Res. 2001, 25, 1213–1220. [Google Scholar] [CrossRef] [PubMed]
- Bartsch, A.J.; Homola, G.; Biller, A.; Smith, S.M.; Weijers, H.G.; Wiesbeck, G.A.; Jenkinson, M.; De Stefano, N.; Solymosi, L.; Bendszus, M. Manifestations of early brain recovery associated with abstinence from alcoholism. Brain A J. Neurol. 2007, 130, 36–47. [Google Scholar] [CrossRef] [PubMed]
- Mon, A.; Delucchi, K.; Durazzo, T.C.; Gazdzinski, S.; Meyerhoff, D.J. A mathematical formula for prediction of gray and white matter volume recovery in abstinent alcohol dependent individuals. Psychiatry Res. 2011, 194, 198–204. [Google Scholar] [CrossRef] [PubMed]
- Yalcin, E.B.; McLean, T.; Tong, M.; de la Monte, S.M. Progressive white matter atrophy with altered lipid profiles is partially reversed by short-term abstinence in an experimental model of alcohol-related neurodegeneration. Alcohol 2017, 65, 51–62. [Google Scholar] [CrossRef]
- Gazdzinski, S.; Durazzo, T.C.; Mon, A.; Yeh, P.H.; Meyerhoff, D.J. Cerebral white matter recovery in abstinent alcoholics—A multimodality magnetic resonance study. Brain A J. Neurol. 2010, 133, 1043–1053. [Google Scholar] [CrossRef]
- Tong, M.; Ziplow, J.L.; Mark, P.; de la Monte, S.M. Dietary Soy Prevents Alcohol-Mediated Neurocognitive Dysfunction and Associated Impairments in Brain Insulin Pathway Signaling in an Adolescent Rat Model. Biomolecules 2022, 12, 676. [Google Scholar] [CrossRef]
- DaDalt, A.A.; Bonham, C.A.; Lotze, G.P.; Luiso, A.A.; Vacratsis, P.O. Src-mediated phosphorylation of the ribosome biogenesis factor hYVH1 affects its localization, promoting partitioning to the 60S ribosomal subunit. J. Biol. Chem. 2022, 298, 102679. [Google Scholar] [CrossRef]
- Liu, H.T.; Zou, Y.X.; Zhu, W.J.; Sen, L.; Zhang, G.H.; Ma, R.R.; Guo, X.Y.; Gao, P. lncRNA THAP7-AS1, transcriptionally activated by SP1 and post-transcriptionally stabilized by METTL3-mediated m6A modification, exerts oncogenic properties by improving CUL4B entry into the nucleus. Cell Death Differ. 2022, 29, 627–641. [Google Scholar] [CrossRef]
- Xie, J.J.; Jiang, Y.Y.; Jiang, Y.; Li, C.Q.; Lim, M.C.; An, O.; Mayakonda, A.; Ding, L.W.; Long, L.; Sun, C.; et al. Super-Enhancer-Driven Long Non-Coding RNA LINC01503, Regulated by TP63, Is Over-Expressed and Oncogenic in Squamous Cell Carcinoma. Gastroenterology 2018, 154, 2137–2151.e1. [Google Scholar] [CrossRef]
- White, N.M. 3.02—Multiple Memory Systems in the Brain: Cooperation and Competition. In Learning and Memory: A Comprehensive Reference; Byrne, J.H., Ed.; Academic Press: Oxford, UK, 2008; pp. 9–46. [Google Scholar]
- Cohen, A.C.; Tong, M.; Wands, J.R.; De La Monte, S.M. Insulin and Insulin-Like Growth Factor Resistance With Neurodegeneration in an Adult Chronic Ethanol Exposure Model. Alcohol. Clin. Exp. Res. 2007, 31, 1558–1573. [Google Scholar] [CrossRef]
- Chanraud, S.; Martelli, C.; Delain, F.; Kostogianni, N.; Douaud, G.; Aubin, H.J.; Reynaud, M.; Martinot, J.L. Brain morphometry and cognitive performance in detoxified alcohol-dependents with preserved psychosocial functioning. Neuropsychopharmacol. Off. Publ. Am. Coll. Neuropsychopharmacol. 2007, 32, 429–438. [Google Scholar] [CrossRef] [PubMed]
- Onoda, A.; Maruki, Y.; Matsuzaki, M.; Narabayasi, Y.; Sawada, M.; Iwasaki, A.; Enokida, M.; Kanaya, M.; Akiyama, H.; Yamauchi, T. Abstinence from drink ameliorated cerebral blood flow and vasoreactivity in patients with chronic alcoholism. Keio J. Med. 2000, 49 (Suppl. S1), A107–A108. [Google Scholar] [PubMed]
- Pfefferbaum, A.; Adalsteinsson, E.; Sullivan, E.V. Dysmorphology and microstructural degradation of the corpus callosum: Interaction of age and alcoholism. Neurobiol. Aging 2006, 27, 994–1009. [Google Scholar] [CrossRef] [PubMed]
- Yalcin, E.B.; Tong, M.; de la Monte, S.M. Altered Oligodendroglial and Neuroglial Gene Expression in Adult Rat Cerebral White Matter Following Short- and Long-Term Ethanol Exposures and Abbreviated Abstinence. J. Drug Alcohol Res. 2018, 8, 1–9. [Google Scholar] [CrossRef]
- Homans, C.; Yalcin, E.B.; Tong, M.; Gallucci, G.; Bautista, D.; Moriel, N.; Monte, S.d.l. Therapeutic Effects of Myriocin in Experimental Alcohol-Related Neurobehavioral Dysfunction and Frontal Lobe White Matter Biochemical Pathology. J. Behav. Brain Sci. 2022, 12, 23–42. [Google Scholar] [CrossRef]
- Yalcin, E.B.; Delikkaya, B.N.; Pelit, W.; Tong, M.; De La Monte, S.M.; Rounds, S. The Differential Effects of Chronic Alcohol and Cigarette Smoke Exposures on Cognitive-Behavioral Dysfunction in Long Evans Rats. J. Behav. Brain Sci. 2022, 12, 413–432. [Google Scholar] [CrossRef]
- Liran, M.; Fischer, I.; Elboim, M.; Rahamim, N.; Gordon, T.; Urshansky, N.; Assaf, Y.; Barak, B.; Barak, S. Long-term excessive alcohol consumption enhances myelination in the mouse nucleus accumbens. J. Neurosci. 2025, e0280242025. [Google Scholar] [CrossRef]
- Quiros Cognuck, S.; Reis, W.L.; Silva, M.; Debarba, L.K.; Mecawi, A.S.; de Paula, F.J.A.; Rodrigues Franci, C.; Elias, L.L.K.; Antunes-Rodrigues, J. Sex differences in body composition, metabolism-related hormones, and energy homeostasis during aging in Wistar rats. Physiol. Rep. 2020, 8, e14597. [Google Scholar] [CrossRef]
- Santiago, H.A.; De Pierro, L.R.; Reis, R.M.; Caluz, A.G.; Ribeiro, V.B.; Volpon, J.B. Allometric relationships among body mass, MUZZLE-tail length, and tibia length during the growth of Wistar rats. Acta Cir. Bras. 2015, 30, 743–748. [Google Scholar] [CrossRef]
- Calabrese, E.; Badea, A.; Watson, C.; Johnson, G.A. A quantitative magnetic resonance histology atlas of postnatal rat brain development with regional estimates of growth and variability. Neuroimage 2013, 71, 196–206. [Google Scholar] [CrossRef]
- Semple, B.D.; Blomgren, K.; Gimlin, K.; Ferriero, D.M.; Noble-Haeusslein, L.J. Brain development in rodents and humans: Identifying benchmarks of maturation and vulnerability to injury across species. Prog. Neurobiol. 2013, 106–107, 1–16. [Google Scholar] [CrossRef] [PubMed]
- Halsted, C.H.; Medici, V. Alcohol: Metabolism and Health Effects. In Encyclopedia of Food and Health; Caballero, B., Finglas, P.M., Toldrá, F., Eds.; Academic Press: Cambridge, MA, USA, 2016; pp. 82–87. [Google Scholar]
- Papp-Peka, A.; Tong, M.; Kril, J.J.; De La Monte, S.M.; Sutherland, G.T. The Differential Effects of Alcohol and Nicotine-Specific Nitrosamine Ketone on White Matter Ultrastructure. Alcohol Alcohol. 2017, 52, 165–171. [Google Scholar] [CrossRef] [PubMed]
- Wang, J.J.; Durazzo, T.C.; Gazdzinski, S.; Yeh, P.H.; Mon, A.; Meyerhoff, D.J. MRSI and DTI: A multimodal approach for improved detection of white matter abnormalities in alcohol and nicotine dependence. NMR Biomed. 2009, 22, 516–522. [Google Scholar] [CrossRef] [PubMed]
- Elofson, J.; Gongvatana, W.; Carey, K.B. Alcohol use and cerebral white matter compromise in adolescence. Addict. Behav. 2013, 38, 2295–2305. [Google Scholar] [CrossRef]
- Monnig, M.A.; Tonigan, J.S.; Yeo, R.A.; Thoma, R.J.; McCrady, B.S. White matter volume in alcohol use disorders: A meta-analysis. Addict. Biol. 2013, 18, 581–592. [Google Scholar] [CrossRef]
- Lyoo, I.K.; Streeter, C.C.; Ahn, K.H.; Lee, H.K.; Pollack, M.H.; Silveri, M.M.; Nassar, L.; Levin, J.M.; Sarid-Segal, O.; Ciraulo, D.A.; et al. White matter hyperintensities in subjects with cocaine and opiate dependence and healthy comparison subjects. Psychiatry Res. 2004, 131, 135–145. [Google Scholar] [CrossRef]
- Schulte, T.; Sullivan, E.V.; Muller-Oehring, E.M.; Adalsteinsson, E.; Pfefferbaum, A. Corpus callosal microstructural integrity influences interhemispheric processing: A diffusion tensor imaging study. Cereb. Cortex 2005, 15, 1384–1392. [Google Scholar] [CrossRef]
- Ihn, Y.K.; Hwang, S.S.; Park, Y.H. Acute Marchiafava-Bignami disease: Diffusion-weighted MRI in cortical and callosal involvement. Yonsei Med. J. 2007, 48, 321–324. [Google Scholar] [CrossRef]
- Roux, A.; Muller, L.; Jackson, S.N.; Baldwin, K.; Womack, V.; Pagiazitis, J.G.; O’Rourke, J.R.; Thanos, P.K.; Balaban, C.; Schultz, J.A.; et al. Chronic ethanol consumption profoundly alters regional brain ceramide and sphingomyelin content in rodents. ACS Chem. Neurosci. 2015, 6, 247–259. [Google Scholar] [CrossRef]
- Yalcin, E.B.; Nunez, K.; Tong, M.; Cornett, S.D.; de la Monte, S.M. MALDI-IMS Detects Differential White Matter Degeneration-Associated Lipid Profiles in Rat Models of Chronic Alcohol, Tobacco Nitrosamine, or Both Exposures. J. Am. Soc. Mass Spectrom. 2015, 26, 95. [Google Scholar]
- Gameiro-Ros, I.; Noble, L.; Tong, M.; Yalcin, E.; de la Monte, S.M. Tissue Microarray Lipidomic Imaging Mass Spectrometry Method: Application to the Study of Alcohol-Related White Matter Neurodegeneration. Appl. Biosci. 2023, 2, 173–193. [Google Scholar] [CrossRef] [PubMed]
- Qu, W.; Zhang, B.; Wu, D.; Xiao, B. Effects of alcohol on membrane lipid fluidity of astrocytes and oligodendrocytes. Wei Sheng Yan Jiu = J. Hyg. Res. 1999, 28, 153–154. [Google Scholar]
- Ingolfsson, H.I.; Andersen, O.S. Alcohol’s effects on lipid bilayer properties. Biophys. J. 2011, 101, 847–855. [Google Scholar] [CrossRef] [PubMed]
- Crews, F.T.; Nixon, K. Mechanisms of neurodegeneration and regeneration in alcoholism. Alcohol Alcohol. 2009, 44, 115–127. [Google Scholar] [CrossRef]
- Schreiber, J.A.; Tajuddin, N.F.; Kouzoukas, D.E.; Kevala, K.; Kim, H.Y.; Collins, M.A. Moderate blood alcohol and brain neurovulnerability: Selective depletion of calcium-independent phospholipase A2, omega-3 docosahexaenoic acid, and its synaptamide derivative as a potential harbinger of deficits in anti-inflammatory reserve. Alcohol. Clin. Exp. Res. 2021, 45, 2506–2517. [Google Scholar] [CrossRef]
- Tiwari, V.; Kuhad, A.; Chopra, K. Epigallocatechin-3-gallate ameliorates alcohol-induced cognitive dysfunctions and apoptotic neurodegeneration in the developing rat brain. Int. J. Neuropsychopharmacol. 2010, 13, 1053–1066. [Google Scholar] [CrossRef]
- Tiwari, V.; Chopra, K. Resveratrol abrogates alcohol-induced cognitive deficits by attenuating oxidative-nitrosative stress and inflammatory cascade in the adult rat brain. Neurochem. Int. 2013, 62, 861–869. [Google Scholar] [CrossRef]
- Topper, L.A.; Baculis, B.C.; Valenzuela, C.F. Exposure of neonatal rats to alcohol has differential effects on neuroinflammation and neuronal survival in the cerebellum and hippocampus. J. Neuroinflamm. 2015, 12, 160. [Google Scholar] [CrossRef]
- Marcondes, M.C.; Watry, D.; Zandonatti, M.; Flynn, C.; Taffe, M.A.; Fox, H. Chronic alcohol consumption generates a vulnerable immune environment during early SIV infection in rhesus macaques. Alcohol. Clin. Exp. Res. 2008, 32, 1583–1592. [Google Scholar] [CrossRef]
- Cippitelli, A.; Domi, E.; Ubaldi, M.; Douglas, J.C.; Li, H.W.; Demopulos, G.; Gaitanaris, G.; Roberto, M.; Drew, P.D.; Kane, C.J.M.; et al. Protection against alcohol-induced neuronal and cognitive damage by the PPARgamma receptor agonist pioglitazone. Brain Behav. Immun. 2017, 64, 320–329. [Google Scholar] [CrossRef]
- Liu, W.; Rohlman, A.R.; Vetreno, R.; Crews, F.T. Expression of Oligodendrocyte and Oligoprogenitor Cell Proteins in Frontal Cortical White and Gray Matter: Impact of Adolescent Development and Ethanol Exposure. Front. Pharmacol. 2021, 12, 651418. [Google Scholar] [CrossRef] [PubMed]
- Miguel-Hidalgo, J.J. Molecular Neuropathology of Astrocytes and Oligodendrocytes in Alcohol Use Disorders. Front. Mol. Neurosci. 2018, 11, 78. [Google Scholar] [CrossRef] [PubMed]
- Patro, N.; Naik, A.A.; Patro, I.K. Developmental Changes in Oligodendrocyte Genesis, Myelination, and Associated Behavioral Dysfunction in a Rat Model of Intra-generational Protein Malnutrition. Mol. Neurobiol. 2019, 56, 595–610. [Google Scholar] [CrossRef] [PubMed]
- Breen, M.S.; Ozcan, S.; Ramsey, J.M.; Wang, Z.; Ma’ayan, A.; Rustogi, N.; Gottschalk, M.G.; Webster, M.J.; Weickert, C.S.; Buxbaum, J.D.; et al. Temporal proteomic profiling of postnatal human cortical development. Transl. Psychiatry 2018, 8, 267. [Google Scholar] [CrossRef]
- Tong, M.; Gonzalez-Navarrete, H.; Kirchberg, T.; Gotama, B.; Yalcin, E.B.; Kay, J.; de la Monte, S.M. Ethanol-Induced White Matter Atrophy Is Associated with Impaired Expression of Aspartyl-Asparaginyl-beta-Hydroxylase (ASPH) and Notch Signaling in an Experimental Rat Model. J. Drug Alcohol Res. 2017, 6, 236033. [Google Scholar] [CrossRef]
- Campagnoni, A.T.; Macklin, W.B. Cellular and molecular aspects of myelin protein gene expression. Mol. Neurobiol. 1988, 2, 41–89. [Google Scholar] [CrossRef]
- Yang, Z.; Wang, K.K. Glial fibrillary acidic protein: From intermediate filament assembly and gliosis to neurobiomarker. Trends Neurosci. 2015, 38, 364–374. [Google Scholar] [CrossRef]
- Middeldorp, J.; Hol, E.M. GFAP in health and disease. Prog. Neurobiol. 2011, 93, 421–443. [Google Scholar] [CrossRef]
- Osman, I.; Wang, L.; Hu, G.; Zheng, Z.; Zhou, J. GFAP (Glial Fibrillary Acidic Protein)-Positive Progenitor Cells Contribute to the Development of Vascular Smooth Muscle Cells and Endothelial Cells-Brief Report. Arter. Thromb. Vasc. Biol. 2020, 40, 1231–1238. [Google Scholar] [CrossRef]
- Persson, L.; Rosengren, L. Increased blood-brain barrier permeability around cerebral stab wounds, aggravated by acute ethanol intoxication. Acta Neurol. Scand. 1977, 56, 7–16. [Google Scholar] [CrossRef]
- Rosengren, L.; Persson, L.; Johansson, B. Enhanced blood-brain barrier leakage to evans blue-labelled albumin after air embolism in ethanol-intoxicated rats. Acta Neuropathol. 1977, 38, 149–152. [Google Scholar] [CrossRef] [PubMed]
- Carrino, D.; Branca, J.J.V.; Becatti, M.; Paternostro, F. Alcohol-Induced Blood-Brain Barrier Impairment: An In Vitro Study. Int. J. Environ. Res. Public Health 2021, 18, 2683. [Google Scholar] [CrossRef] [PubMed]
- Avchalumov, Y.; Mandyam, C.D. Synaptic Plasticity and its Modulation by Alcohol. Brain Plast. 2020, 6, 103–111. [Google Scholar] [CrossRef] [PubMed]
- Figlia, G.; Norrmen, C.; Pereira, J.A.; Gerber, D.; Suter, U. Dual function of the PI3K-Akt-mTORC1 axis in myelination of the peripheral nervous system. eLife 2017, 6, e29241. [Google Scholar] [CrossRef]
- Grier, M.D.; West, K.L.; Kelm, N.D.; Fu, C.; Does, M.D.; Parker, B.; McBrier, E.; Lagrange, A.H.; Ess, K.C.; Carson, R.P. Loss of mTORC2 signaling in oligodendrocyte precursor cells delays myelination. PLoS ONE 2017, 12, e0188417. [Google Scholar] [CrossRef]
- de la Monte, S.M.; Sutherland, G. Dual Stages of Alcohol-Related Cerebral White Matter Degeneration Reviewed: Early-Stage Stress/Neuroinflammation Versus Late-Stage Impaired Insulin/IGF Signaling Through Akt-mTOR–Review. ASN Neuro 2025, in press.
- de la Monte, S.M.; Wands, J.R. Role of central nervous system insulin resistance in fetal alcohol spectrum disorders. J. Popul. Ther. Clin. Pharmacol. 2010, 17, e390–e404. [Google Scholar]
- Biever, A.; Valjent, E.; Puighermanal, E. Ribosomal Protein S6 Phosphorylation in the Nervous System: From Regulation to Function. Front. Mol. Neurosci. 2015, 8, 75. [Google Scholar] [CrossRef]
- Rosner, M.; Siegel, N.; Valli, A.; Fuchs, C.; Hengstschlager, M. mTOR phosphorylated at S2448 binds to raptor and rictor. Amino Acids 2010, 38, 223–228. [Google Scholar] [CrossRef]
- Liu, Y.; Ma, L.; Jiao, L.; Gao, M.; Guo, W.; Chen, L.; Pan, N.; Ma, Y. Mammalian target of rapamycin/p70 ribosomal S6 protein kinase signaling is altered by sevoflurane and/or surgery in aged rats. Mol. Med. Rep. 2015, 12, 8253–8260. [Google Scholar] [CrossRef]
- Querfurth, H.; Lee, H.K. Mammalian/mechanistic target of rapamycin (mTOR) complexes in neurodegeneration. Mol. Neurodegener. 2021, 16, 44. [Google Scholar] [CrossRef] [PubMed]
- Bockaert, J.; Marin, P. mTOR in Brain Physiology and Pathologies. Physiol. Rev. 2015, 95, 1157–1187. [Google Scholar] [CrossRef] [PubMed]
- Graber, T.E.; McCamphill, P.K.; Sossin, W.S. A recollection of mTOR signaling in learning and memory. Learn. Mem. 2013, 20, 518–530. [Google Scholar] [CrossRef] [PubMed]
- Hoeffer, C.A.; Klann, E. mTOR signaling: At the crossroads of plasticity, memory and disease. Trends Neurosci. 2010, 33, 67–75. [Google Scholar] [CrossRef]
- Yang, W.; Zhou, X.; Ma, T. Memory Decline and Behavioral Inflexibility in Aged Mice Are Correlated With Dysregulation of Protein Synthesis Capacity. Front. Aging Neurosci. 2019, 11, 246. [Google Scholar] [CrossRef]
- Zhou, X.; Lin, D.S.; Zheng, F.; Sutton, M.A.; Wang, H. Intracellular calcium and calmodulin link brain-derived neurotrophic factor to p70S6 kinase phosphorylation and dendritic protein synthesis. J. Neurosci. Res. 2010, 88, 1420–1432. [Google Scholar] [CrossRef]
- Hu, Y.; Mai, W.; Chen, L.; Cao, K.; Zhang, B.; Zhang, Z.; Liu, Y.; Lou, H.; Duan, S.; Gao, Z. mTOR-mediated metabolic reprogramming shapes distinct microglia functions in response to lipopolysaccharide and ATP. Glia 2019, 68, 1031–1045. [Google Scholar] [CrossRef]
- Laplante, M.; Sabatini, D.M. mTOR signaling in growth control and disease. Cell 2012, 149, 274–293. [Google Scholar] [CrossRef]
- Harper, C.G.; Smith, N.A.; Kril, J.J. The effects of alcohol on the female brain: A neuropathological study. Alcohol Alcohol. 1990, 25, 445–448. [Google Scholar]
- Harada, H.; Andersen, J.S.; Mann, M.; Terada, N.; Korsmeyer, S.J. p70S6 kinase signals cell survival as well as growth, inactivating the pro-apoptotic molecule BAD. Proc. Natl. Acad. Sci. USA 2001, 98, 9666–9670. [Google Scholar] [CrossRef]
- Carson, R.P.; Kelm, N.D.; West, K.L.; Does, M.D.; Fu, C.; Weaver, G.; McBrier, E.; Parker, B.; Grier, M.D.; Ess, K.C. Hypomyelination following deletion of Tsc2 in oligodendrocyte precursors. Ann. Clin. Transl. Neurol. 2015, 2, 1041–1054. [Google Scholar] [CrossRef] [PubMed]
- de la Monte, S.M.; Tong, M. Dysregulated mTOR networks in experimental sporadic Alzheimer’s disease. Front. Cell. Neurosci. 2024, 18, 1432359. [Google Scholar] [CrossRef] [PubMed]
- Dudek, H.; Datta, S.R.; Franke, T.F.; Birnbaum, M.J.; Yao, R.; Cooper, G.M.; Segal, R.A.; Kaplan, D.R.; Greenberg, M.E. Regulation of neuronal survival by the serine-threonine protein kinase Akt. Science 1997, 275, 661–665. [Google Scholar] [CrossRef] [PubMed]
- de la Monte, S.M.; Wands, J.R. Review of insulin and insulin-like growth factor expression, signaling, and malfunction in the central nervous system: Relevance to Alzheimer’s disease. J. Alzheimer’s Dis. JAD 2005, 7, 45–61. [Google Scholar] [CrossRef]
- Yoon, M.S. The Role of Mammalian Target of Rapamycin (mTOR) in Insulin Signaling. Nutrients 2017, 9, 1176. [Google Scholar] [CrossRef]
- Myers, M.G., Jr.; Sun, X.J.; White, M.F. The IRS-1 signaling system. Trends Biochem. Sci. 1994, 19, 289–293. [Google Scholar] [CrossRef]
- White, M.F. IRS proteins and the common path to diabetes. Am. J. Physiol. Endocrinol. Metab. 2002, 283, E413–E422. [Google Scholar] [CrossRef]
- Schmitz-Peiffer, C.; Whitehead, J.P. IRS-1 regulation in health and disease. IUBMB Life 2003, 55, 367–374. [Google Scholar] [CrossRef]
- Schubert, M.; Brazil, D.P.; Burks, D.J.; Kushner, J.A.; Ye, J.; Flint, C.L.; Farhang-Fallah, J.; Dikkes, P.; Warot, X.M.; Rio, C.; et al. Insulin receptor substrate-2 deficiency impairs brain growth and promotes tau phosphorylation. J. Neurosci. 2003, 23, 7084–7092. [Google Scholar] [CrossRef]
- Freude, S.; Leeser, U.; Muller, M.; Hettich, M.M.; Udelhoven, M.; Schilbach, K.; Tobe, K.; Kadowaki, T.; Kohler, C.; Schroder, H.; et al. IRS-2 branch of IGF-1 receptor signaling is essential for appropriate timing of myelination. J. Neurochem. 2008, 107, 907–917. [Google Scholar] [CrossRef]
- Copps, K.D.; White, M.F. Regulation of insulin sensitivity by serine/threonine phosphorylation of insulin receptor substrate proteins IRS1 and IRS2. Diabetologia 2012, 55, 2565–2582. [Google Scholar] [CrossRef] [PubMed]
- Morino, K.; Petersen, K.F.; Dufour, S.; Befroy, D.; Frattini, J.; Shatzkes, N.; Neschen, S.; White, M.F.; Bilz, S.; Sono, S.; et al. Reduced mitochondrial density and increased IRS-1 serine phosphorylation in muscle of insulin-resistant offspring of type 2 diabetic parents. J. Clin. Investig. 2005, 115, 3587–3593. [Google Scholar] [CrossRef] [PubMed]
- Pearl, L.H.; Barford, D. Regulation of protein kinases in insulin, growth factor and Wnt signalling. Curr. Opin. Struct. Biol. 2002, 12, 761–767. [Google Scholar] [CrossRef] [PubMed]
- Hers, I.; Vincent, E.E.; Tavare, J.M. Akt signalling in health and disease. Cell. Signal. 2011, 23, 1515–1527. [Google Scholar] [CrossRef]
- Lindtner, C.; Scherer, T.; Zielinski, E.; Filatova, N.; Fasshauer, M.; Tonks, N.K.; Puchowicz, M.; Buettner, C. Binge drinking induces whole-body insulin resistance by impairing hypothalamic insulin action. Sci. Transl. Med. 2013, 5, 170ra114. [Google Scholar] [CrossRef]
- Xu, J.; Yeon, J.E.; Chang, H.; Tison, G.; Chen, G.J.; Wands, J.; de la Monte, S. Ethanol impairs insulin-stimulated neuronal survival in the developing brain: Role of PTEN phosphatase. J. Biol. Chem. 2003, 278, 26929–26937. [Google Scholar] [CrossRef]
- de la Monte, S.M.; Wands, J.R. Chronic gestational exposure to ethanol impairs insulin-stimulated survival and mitochondrial function in cerebellar neurons. Cell. Mol. Life Sci. 2002, 59, 882–893. [Google Scholar] [CrossRef]
- Bercury, K.K.; Dai, J.; Sachs, H.H.; Ahrendsen, J.T.; Wood, T.L.; Macklin, W.B. Conditional ablation of raptor or rictor has differential impact on oligodendrocyte differentiation and CNS myelination. J. Neurosci. 2014, 34, 4466–4480. [Google Scholar] [CrossRef]
- Rosner, M.; Hengstschlager, M. Cytoplasmic and nuclear distribution of the protein complexes mTORC1 and mTORC2: Rapamycin triggers dephosphorylation and delocalization of the mTORC2 components rictor and sin1. Hum. Mol. Genet. 2008, 17, 2934–2948. [Google Scholar] [CrossRef]
- Cai, S.L.; Tee, A.R.; Short, J.D.; Bergeron, J.M.; Kim, J.; Shen, J.; Guo, R.; Johnson, C.L.; Kiguchi, K.; Walker, C.L. Activity of TSC2 is inhibited by AKT-mediated phosphorylation and membrane partitioning. J. Cell Biol. 2006, 173, 279–289. [Google Scholar] [CrossRef]
- Matsuda, T.; Zhai, P.; Maejima, Y.; Hong, C.; Gao, S.; Tian, B.; Goto, K.; Takagi, H.; Tamamori-Adachi, M.; Kitajima, S.; et al. Distinct roles of GSK-3alpha and GSK-3beta phosphorylation in the heart under pressure overload. Proc. Natl. Acad. Sci. USA 2008, 105, 20900–20905. [Google Scholar] [CrossRef] [PubMed]
- Zhou, J.; Freeman, T.A.; Ahmad, F.; Shang, X.; Mangano, E.; Gao, E.; Farber, J.; Wang, Y.; Ma, X.L.; Woodgett, J.; et al. GSK-3alpha is a central regulator of age-related pathologies in mice. J. Clin. Investig. 2013, 123, 1821–1832. [Google Scholar] [CrossRef]
- Kaidanovich-Beilin, O.; Lipina, T.V.; Takao, K.; van Eede, M.; Hattori, S.; Laliberte, C.; Khan, M.; Okamoto, K.; Chambers, J.W.; Fletcher, P.J.; et al. Abnormalities in brain structure and behavior in GSK-3alpha mutant mice. Mol. Brain 2009, 2, 35. [Google Scholar] [CrossRef] [PubMed]
- Pavlov, D.; Markova, N.; Bettendorff, L.; Chekhonin, V.; Pomytkin, I.; Lioudyno, V.; Svistunov, A.; Ponomarev, E.; Lesch, K.P.; Strekalova, T. Elucidating the functions of brain GSK3alpha: Possible synergy with GSK3beta upregulation and reversal by antidepressant treatment in a mouse model of depressive-like behaviour. Behav. Brain Res. 2017, 335, 122–127. [Google Scholar] [CrossRef] [PubMed]
- Gulen, M.F.; Bulek, K.; Xiao, H.; Yu, M.; Gao, J.; Sun, L.; Beurel, E.; Kaidanovich-Beilin, O.; Fox, P.L.; DiCorleto, P.E.; et al. Inactivation of the enzyme GSK3alpha by the kinase IKKi promotes AKT-mTOR signaling pathway that mediates interleukin-1-induced Th17 cell maintenance. Immunity 2012, 37, 800–812. [Google Scholar] [CrossRef]
- Doble, B.W.; Woodgett, J.R. GSK-3: Tricks of the trade for a multi-tasking kinase. J Cell Sci 2003, 116, 1175–1186. [Google Scholar] [CrossRef]
- Carter, J.J.; Tong, M.; Silbermann, E.; Lahousse, S.A.; Ding, F.F.; Longato, L.; Roper, N.; Wands, J.R.; de la Monte, S.M. Ethanol impaired neuronal migration is associated with reduced aspartyl-asparaginyl-beta-hydroxylase expression. Acta Neuropathol. 2008, 116, 303–315. [Google Scholar] [CrossRef]
- Vincent, T.; Kukalev, A.; Andang, M.; Pettersson, R.; Percipalle, P. The glycogen synthase kinase (GSK) 3beta represses RNA polymerase I transcription. Oncogene 2008, 27, 5254–5259. [Google Scholar] [CrossRef]
- Luo, J. Lithium-mediated protection against ethanol neurotoxicity. Front. Neurosci. 2010, 4, 41. [Google Scholar] [CrossRef]
- He, J.; de la Monte, S.; Wands, J.R. Acute ethanol exposure inhibits insulin signaling in the liver. Hepatology 2007, 46, 1791–1800. [Google Scholar] [CrossRef]
- Hermida, M.A.; Dinesh Kumar, J.; Leslie, N.R. GSK3 and its interactions with the PI3K/AKT/mTOR signalling network. Adv Biol. Regul. 2017, 65, 5–15. [Google Scholar] [CrossRef] [PubMed]
- Noori, T.; Dehpour, A.R.; Sureda, A.; Fakhri, S.; Sobarzo-Sanchez, E.; Farzaei, M.H.; Kupeli Akkol, E.; Khodarahmi, Z.; Hosseini, S.Z.; Alavi, S.D.; et al. The role of glycogen synthase kinase 3 beta in multiple sclerosis. Biomed. Pharmacother. 2020, 132, 110874. [Google Scholar] [CrossRef] [PubMed]
- Toral-Rios, D.; Pichardo-Rojas, P.S.; Alonso-Vanegas, M.; Campos-Pena, V. GSK3beta and Tau Protein in Alzheimer’s Disease and Epilepsy. Front. Cell. Neurosci. 2020, 14, 19. [Google Scholar] [CrossRef]
- Akhtar, A.; Sah, S.P. Insulin signaling pathway and related molecules: Role in neurodegeneration and Alzheimer’s disease. Neurochem. Int. 2020, 135, 104707. [Google Scholar] [CrossRef] [PubMed]
- Luo, J. GSK3beta in ethanol neurotoxicity. Mol. Neurobiol. 2009, 40, 108–121. [Google Scholar] [CrossRef]
- Takashima, A. GSK-3 is essential in the pathogenesis of Alzheimer’s disease. J. Alzheimer’s Dis. JAD 2006, 9, 309–317. [Google Scholar] [CrossRef]
- Xiong, T.; Qu, Y.; Wang, H.; Chen, H.; Zhu, J.; Zhao, F.; Zou, R.; Zhang, L.; Mu, D. GSK-3beta/mTORC1 Couples Synaptogenesis and Axonal Repair to Reduce Hypoxia Ischemia-Mediated Brain Injury in Neonatal Rats. J. Neuropathol. Exp. Neurol. 2018, 77, 383–394. [Google Scholar] [CrossRef]
- Liu, R.J.; Fuchikami, M.; Dwyer, J.M.; Lepack, A.E.; Duman, R.S.; Aghajanian, G.K. GSK-3 inhibition potentiates the synaptogenic and antidepressant-like effects of subthreshold doses of ketamine. Neuropsychopharmacology 2013, 38, 2268–2277. [Google Scholar] [CrossRef]
- Krishnankutty, A.; Kimura, T.; Saito, T.; Aoyagi, K.; Asada, A.; Takahashi, S.I.; Ando, K.; Ohara-Imaizumi, M.; Ishiguro, K.; Hisanaga, S.I. In vivo regulation of glycogen synthase kinase 3beta activity in neurons and brains. Sci. Rep. 2017, 7, 8602. [Google Scholar] [CrossRef]
- Skelton, P.D.; Stan, R.V.; Luikart, B.W. The Role of PTEN in Neurodevelopment. Mol. Neuropsychiatry 2020, 5, 60–71. [Google Scholar] [CrossRef]
- van Diepen, M.T.; Eickholt, B.J. Function of PTEN during the formation and maintenance of neuronal circuits in the brain. Dev. Neurosci. 2008, 30, 59–64. [Google Scholar] [CrossRef] [PubMed]
- Mukherjee, R.; Vanaja, K.G.; Boyer, J.A.; Gadal, S.; Solomon, H.; Chandarlapaty, S.; Levchenko, A.; Rosen, N. Regulation of PTEN translation by PI3K signaling maintains pathway homeostasis. Mol. Cell 2021, 81, 708–723.e5. [Google Scholar] [CrossRef] [PubMed]
- Bhattacharya, K.; Maiti, S.; Mandal, C. PTEN negatively regulates mTORC2 formation and signaling in grade IV glioma via Rictor hyperphosphorylation at Thr1135 and direct the mode of action of an mTORC1/2 inhibitor. Oncogenesis 2016, 5, e227. [Google Scholar] [CrossRef] [PubMed]
- Vazquez, F.; Grossman, S.R.; Takahashi, Y.; Rokas, M.V.; Nakamura, N.; Sellers, W.R. Phosphorylation of the PTEN tail acts as an inhibitory switch by preventing its recruitment into a protein complex. J. Biol. Chem. 2001, 276, 48627–48630. [Google Scholar] [CrossRef]
- Vazquez, F.; Ramaswamy, S.; Nakamura, N.; Sellers, W.R. Phosphorylation of the PTEN tail regulates protein stability and function. Mol. Cell. Biol. 2000, 20, 5010–5018. [Google Scholar] [CrossRef]
- Bartolome, A.; Kimura-Koyanagi, M.; Asahara, S.; Guillen, C.; Inoue, H.; Teruyama, K.; Shimizu, S.; Kanno, A.; Garcia-Aguilar, A.; Koike, M.; et al. Pancreatic beta-cell failure mediated by mTORC1 hyperactivity and autophagic impairment. Diabetes 2014, 63, 2996–3008. [Google Scholar] [CrossRef]
- Huang, J.; Dibble, C.C.; Matsuzaki, M.; Manning, B.D. The TSC1-TSC2 complex is required for proper activation of mTOR complex 2. Mol. Cell. Biol. 2008, 28, 4104–4115. [Google Scholar] [CrossRef]
- Orlova, K.A.; Crino, P.B. The tuberous sclerosis complex. Ann. N. Y. Acad. Sci. 2010, 1184, 87–105. [Google Scholar] [CrossRef]
- Inoki, K.; Li, Y.; Xu, T.; Guan, K.L. Rheb GTPase is a direct target of TSC2 GAP activity and regulates mTOR signaling. Genes Dev. 2003, 17, 1829–1834. [Google Scholar] [CrossRef]
- Inoki, K.; Li, Y.; Zhu, T.; Wu, J.; Guan, K.L. TSC2 is phosphorylated and inhibited by Akt and suppresses mTOR signalling. Nat. Cell Biol. 2002, 4, 648–657. [Google Scholar] [CrossRef]
- Agarwal, S.; Bell, C.M.; Rothbart, S.B.; Moran, R.G. AMP-activated Protein Kinase (AMPK) Control of mTORC1 Is p53- and TSC2-independent in Pemetrexed-treated Carcinoma Cells. J. Biol. Chem. 2015, 290, 27473–27486. [Google Scholar] [CrossRef] [PubMed]
- Inoki, K.; Ouyang, H.; Zhu, T.; Lindvall, C.; Wang, Y.; Zhang, X.; Yang, Q.; Bennett, C.; Harada, Y.; Stankunas, K.; et al. TSC2 integrates Wnt and energy signals via a coordinated phosphorylation by AMPK and GSK3 to regulate cell growth. Cell 2006, 126, 955–968. [Google Scholar] [CrossRef] [PubMed]
- Tian, T.; Li, X.; Zhang, J. mTOR Signaling in Cancer and mTOR Inhibitors in Solid Tumor Targeting Therapy. Int. J. Mol. Sci. 2019, 20, 755. [Google Scholar] [CrossRef] [PubMed]
- Lee, D.Y. Roles of mTOR Signaling in Brain Development. Exp. Neurobiol. 2015, 24, 177–185. [Google Scholar] [CrossRef]
- Ishizuka, Y.; Kakiya, N.; Nawa, H.; Takei, N. Leucine induces phosphorylation and activation of p70S6K in cortical neurons via the system L amino acid transporter. J. Neurochem. 2008, 106, 934–942. [Google Scholar] [CrossRef]
- Copp, J.; Manning, G.; Hunter, T. TORC-specific phosphorylation of mammalian target of rapamycin (mTOR): Phospho-Ser2481 is a marker for intact mTOR signaling complex 2. Cancer Res. 2009, 69, 1821–1827. [Google Scholar] [CrossRef]
- Chiang, G.G.; Abraham, R.T. Phosphorylation of mammalian target of rapamycin (mTOR) at Ser-2448 is mediated by p70S6 kinase. J. Biol. Chem. 2005, 280, 25485. [Google Scholar] [CrossRef]
- Kyriakis, J.M.; Avruch, J. Insulin and Growth Factor Signaling Pathways. In Endocrinology, Jameson, J.L., De Groot, L.J., Eds.; W.B. Saunders: Philadelphia, PA, USA, 2010; Volume 1, pp. 38–82. [Google Scholar]
- Rosner, M.; Schipany, K.; Hengstschlager, M. p70 S6K1 nuclear localization depends on its mTOR-mediated phosphorylation at T389, but not on its kinase activity towards S6. Amino Acids 2012, 42, 2251–2256. [Google Scholar] [CrossRef]
- Oddo, S. The Mtor/P70s6k Pathway Plays a Key Role in the Pathogenesis of Alzheimer’s Disease. Gerontologist 2015, 55, 198. [Google Scholar] [CrossRef]
- Acosta-Jaquez, H.A.; Keller, J.A.; Foster, K.G.; Ekim, B.; Soliman, G.A.; Feener, E.P.; Ballif, B.A.; Fingar, D.C. Site-specific mTOR phosphorylation promotes mTORC1-mediated signaling and cell growth. Mol. Cell. Biol. 2009, 29, 4308–4324. [Google Scholar] [CrossRef]
- Arif, A.; Jia, J.; Willard, B.; Li, X.; Fox, P.L. Multisite Phosphorylation of S6K1 Directs a Kinase Phospho-code that Determines Substrate Selection. Mol. Cell 2019, 73, 446–457.e6. [Google Scholar] [CrossRef] [PubMed]
- de la Monte, S.M.; Tong, M.; Schiano, I.; Didsbury, J. Improved Brain Insulin/IGF Signaling and Reduced Neuroinflammation with T3D-959 in an Experimental Model of Sporadic Alzheimer’s Disease. J. Alzheimer’s Dis. JAD 2017, 55, 849–864. [Google Scholar] [CrossRef] [PubMed]
- Nguyen, V.A.; Le, T.; Tong, M.; Silbermann, E.; Gundogan, F.; de la Monte, S.M. Impaired insulin/IGF signaling in experimental alcohol-related myopathy. Nutrients 2012, 4, 1058–1075. [Google Scholar] [CrossRef] [PubMed]
- Lu, T.; Zhu, Z.; Wu, J.; She, H.; Han, R.; Xu, H.; Qin, Z.H. DRAM1 regulates autophagy and cell proliferation via inhibition of the phosphoinositide 3-kinase-Akt-mTOR-ribosomal protein S6 pathway. Cell Commun. Signal. 2019, 17, 28. [Google Scholar] [CrossRef] [PubMed]
- Kim, D.H.; Sarbassov, D.D.; Ali, S.M.; King, J.E.; Latek, R.R.; Erdjument-Bromage, H.; Tempst, P.; Sabatini, D.M. mTOR interacts with raptor to form a nutrient-sensitive complex that signals to the cell growth machinery. Cell 2002, 110, 163–175. [Google Scholar] [CrossRef]
- Liu, L.; Luo, Y.; Chen, L.; Shen, T.; Xu, B.; Chen, W.; Zhou, H.; Han, X.; Huang, S. Rapamycin inhibits cytoskeleton reorganization and cell motility by suppressing RhoA expression and activity. J. Biol. Chem. 2010, 285, 38362–38373. [Google Scholar] [CrossRef]
- Gwinn, D.M.; Shackelford, D.B.; Egan, D.F.; Mihaylova, M.M.; Mery, A.; Vasquez, D.S.; Turk, B.E.; Shaw, R.J. AMPK phosphorylation of raptor mediates a metabolic checkpoint. Mol. Cell 2008, 30, 214–226. [Google Scholar] [CrossRef]
- Garza-Lombo, C.; Schroder, A.; Reyes-Reyes, E.M.; Franco, R. mTOR/AMPK signaling in the brain: Cell metabolism, proteostasis and survival. Curr. Opin. Toxicol. 2018, 8, 102–110. [Google Scholar] [CrossRef]
- Sarbassov, D.D.; Ali, S.M.; Kim, D.H.; Guertin, D.A.; Latek, R.R.; Erdjument-Bromage, H.; Tempst, P.; Sabatini, D.M. Rictor, a novel binding partner of mTOR, defines a rapamycin-insensitive and raptor-independent pathway that regulates the cytoskeleton. Curr. Biol. 2004, 14, 1296–1302. [Google Scholar] [CrossRef]
- Kocalis, H.E.; Hagan, S.L.; George, L.; Turney, M.K.; Siuta, M.A.; Laryea, G.N.; Morris, L.C.; Muglia, L.J.; Printz, R.L.; Stanwood, G.D.; et al. Rictor/mTORC2 facilitates central regulation of energy and glucose homeostasis. Mol. Metab. 2014, 3, 394–407. [Google Scholar] [CrossRef]
- Thomanetz, V.; Angliker, N.; Cloetta, D.; Lustenberger, R.M.; Schweighauser, M.; Oliveri, F.; Suzuki, N.; Ruegg, M.A. Ablation of the mTORC2 component rictor in brain or Purkinje cells affects size and neuron morphology. J. Cell Biol. 2013, 201, 293–308. [Google Scholar] [CrossRef]
- Julien, L.A.; Carriere, A.; Moreau, J.; Roux, P.P. mTORC1-activated S6K1 phosphorylates Rictor on threonine 1135 and regulates mTORC2 signaling. Mol. Cell. Biol. 2010, 30, 908–921. [Google Scholar] [CrossRef]


Disclaimer/Publisher’s Note: The statements, opinions and data contained in all publications are solely those of the individual author(s) and contributor(s) and not of MDPI and/or the editor(s). MDPI and/or the editor(s) disclaim responsibility for any injury to people or property resulting from any ideas, methods, instructions or products referred to in the content. |
© 2025 by the authors. Licensee MDPI, Basel, Switzerland. This article is an open access article distributed under the terms and conditions of the Creative Commons Attribution (CC BY) license (https://creativecommons.org/licenses/by/4.0/).
Share and Cite
Tong, M.; Homans, C.; Pelit, W.; Delikkaya, B.; de la Monte, S.M. Progressive Alcohol-Related Brain Atrophy and White Matter Pathology Are Linked to Long-Term Inhibitory Effects on mTOR Signaling. Biomolecules 2025, 15, 413. https://doi.org/10.3390/biom15030413
Tong M, Homans C, Pelit W, Delikkaya B, de la Monte SM. Progressive Alcohol-Related Brain Atrophy and White Matter Pathology Are Linked to Long-Term Inhibitory Effects on mTOR Signaling. Biomolecules. 2025; 15(3):413. https://doi.org/10.3390/biom15030413
Chicago/Turabian StyleTong, Ming, Camilla Homans, William Pelit, Busra Delikkaya, and Suzanne M. de la Monte. 2025. "Progressive Alcohol-Related Brain Atrophy and White Matter Pathology Are Linked to Long-Term Inhibitory Effects on mTOR Signaling" Biomolecules 15, no. 3: 413. https://doi.org/10.3390/biom15030413
APA StyleTong, M., Homans, C., Pelit, W., Delikkaya, B., & de la Monte, S. M. (2025). Progressive Alcohol-Related Brain Atrophy and White Matter Pathology Are Linked to Long-Term Inhibitory Effects on mTOR Signaling. Biomolecules, 15(3), 413. https://doi.org/10.3390/biom15030413