

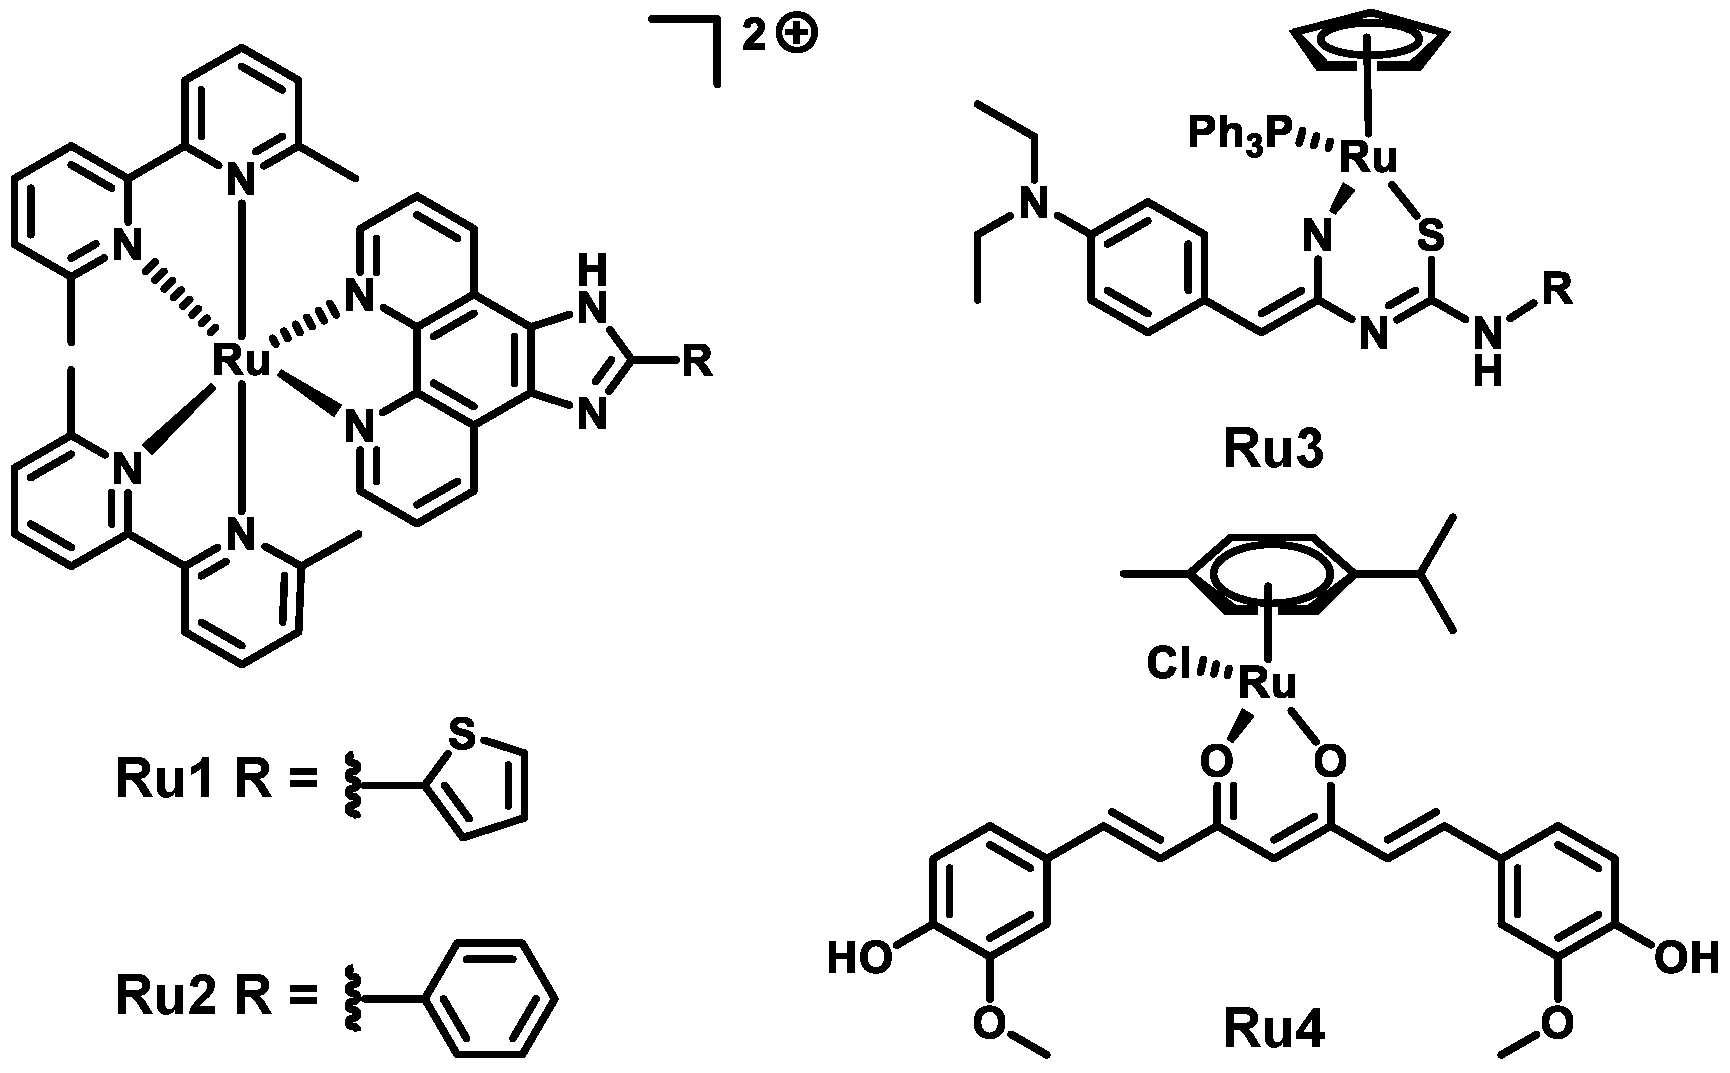
Ruthenium(II)–Arene Complexes with a 2,2′-Bipyridine Ligand as Anti-Aβ Agents

 , and
, and
Abstract
:
1. Introduction
2. Materials and Methods
2.1. Materials
2.2. Instrumental Methods
2.3. Synthesis Procedures
2.3.1. Ru–Arene Dimer
2.3.2. General Procedure for the Ru Complexes
2.3.3. RuB ([Ru(η6-p-cymene)(2,2′-bipyridine)Cl]PF6)
2.3.4. RuBMe ([Ru(η6-p-cymene)(4,4′-dimethyl-2,2′-bipyridine)Cl]PF6)
2.3.5. RuBMeO ([Ru(η6-p-cymene)(4,4′-dimethoxy-2,2′-bipyridine)Cl]PF6)
2.3.6. RuBA ([Ru(η6-p-cymene)(4,4′-diamino-2,2′-bipyridine)Cl]PF6)
2.3.7. RuBtB ([Ru(η6-p-cymene)(4,4′-di-tert-butyl-2,2′-bipyridine)Cl]PF6)
2.4. Log D
2.5. Thioflavin T Fluorescence Assay
2.6. DLS Sample Preparation
2.7. TEM Sample Preparation
2.8. Protein Binding Assay
2.9. Cell Viability Assays
3. Results and Discussion
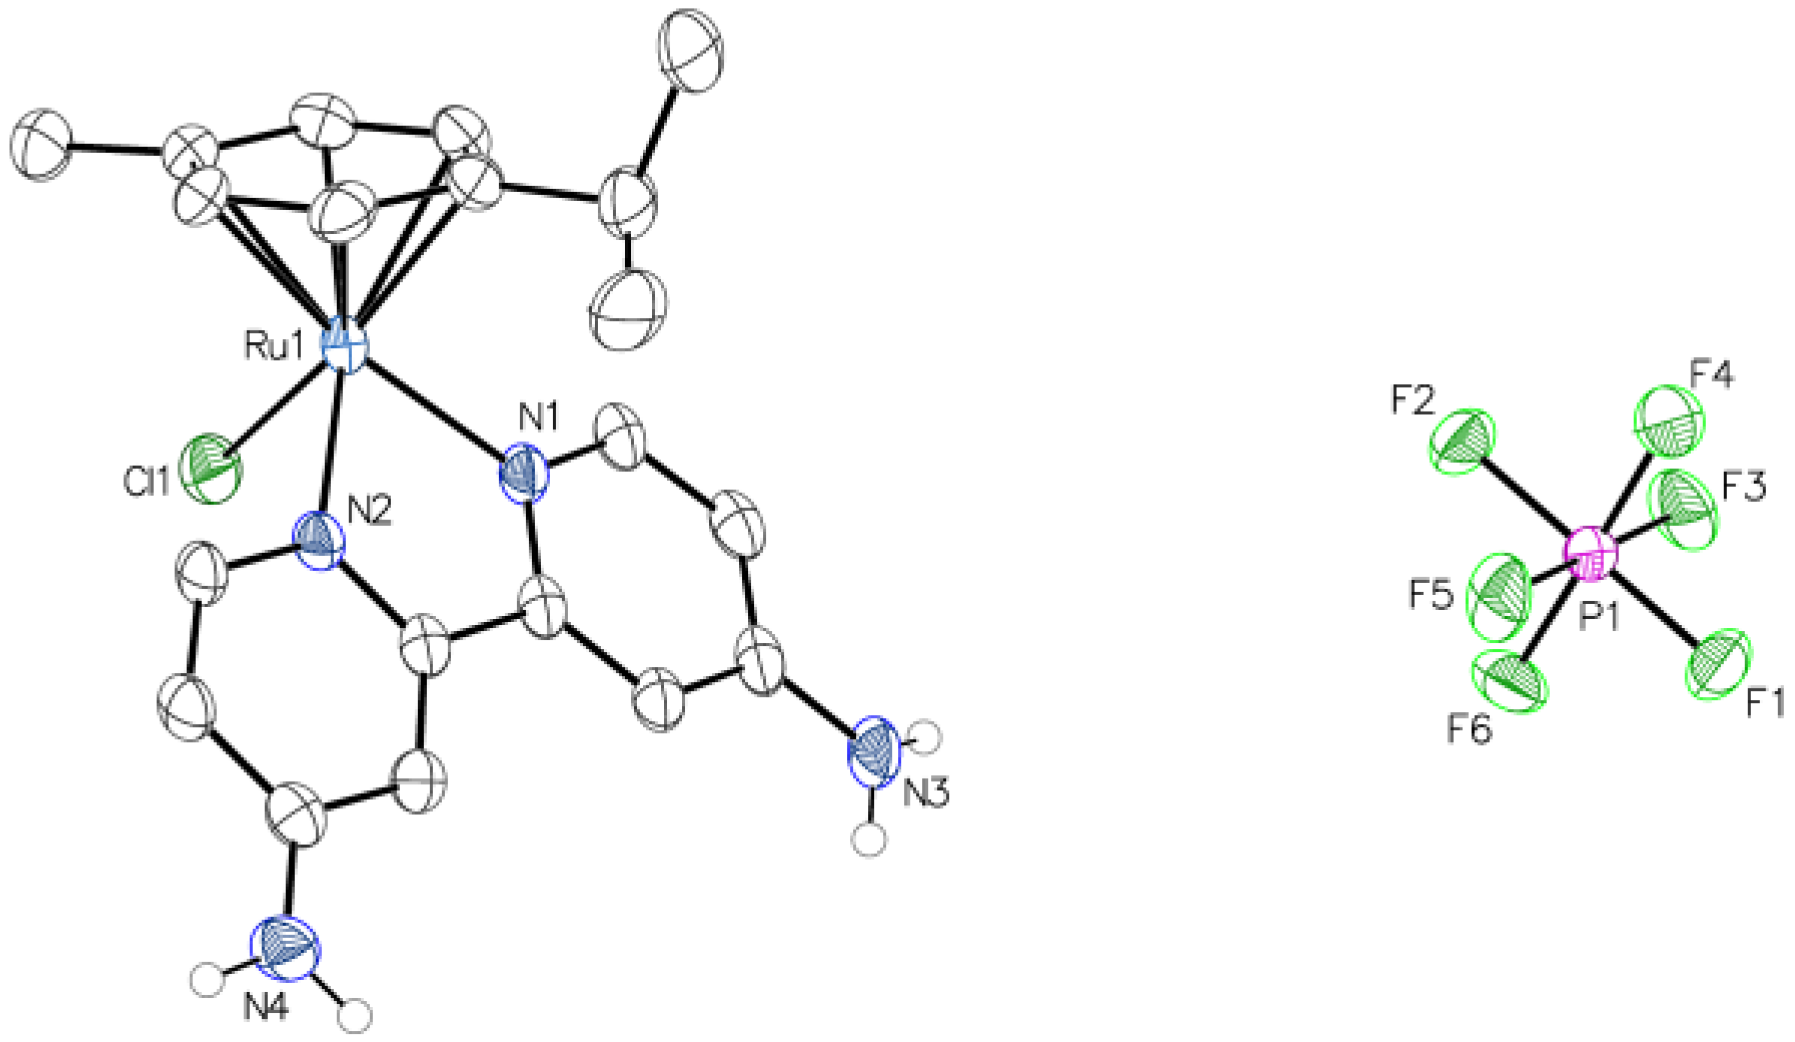
3.1. Synthesis of the Ru Complexes
3.2. Log P
3.3. Aqueous Stability
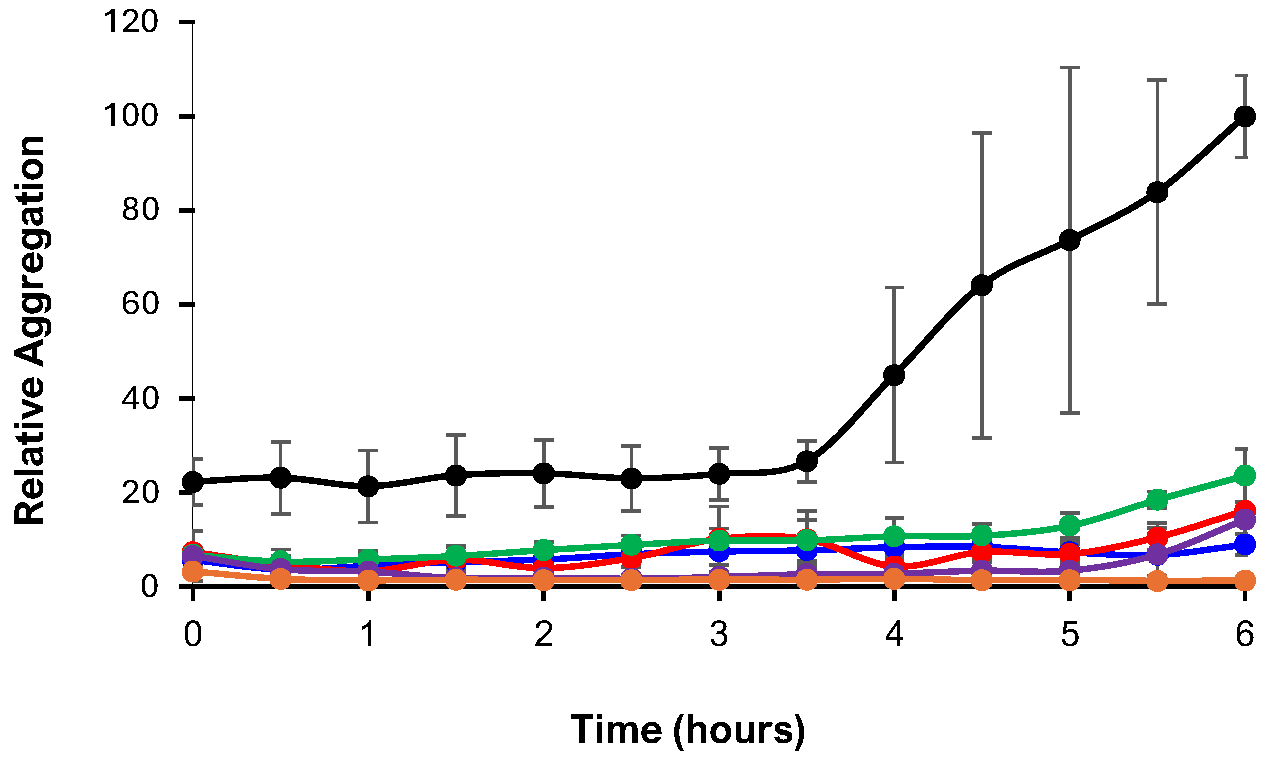
3.4. ThT Assay
3.5. DLS
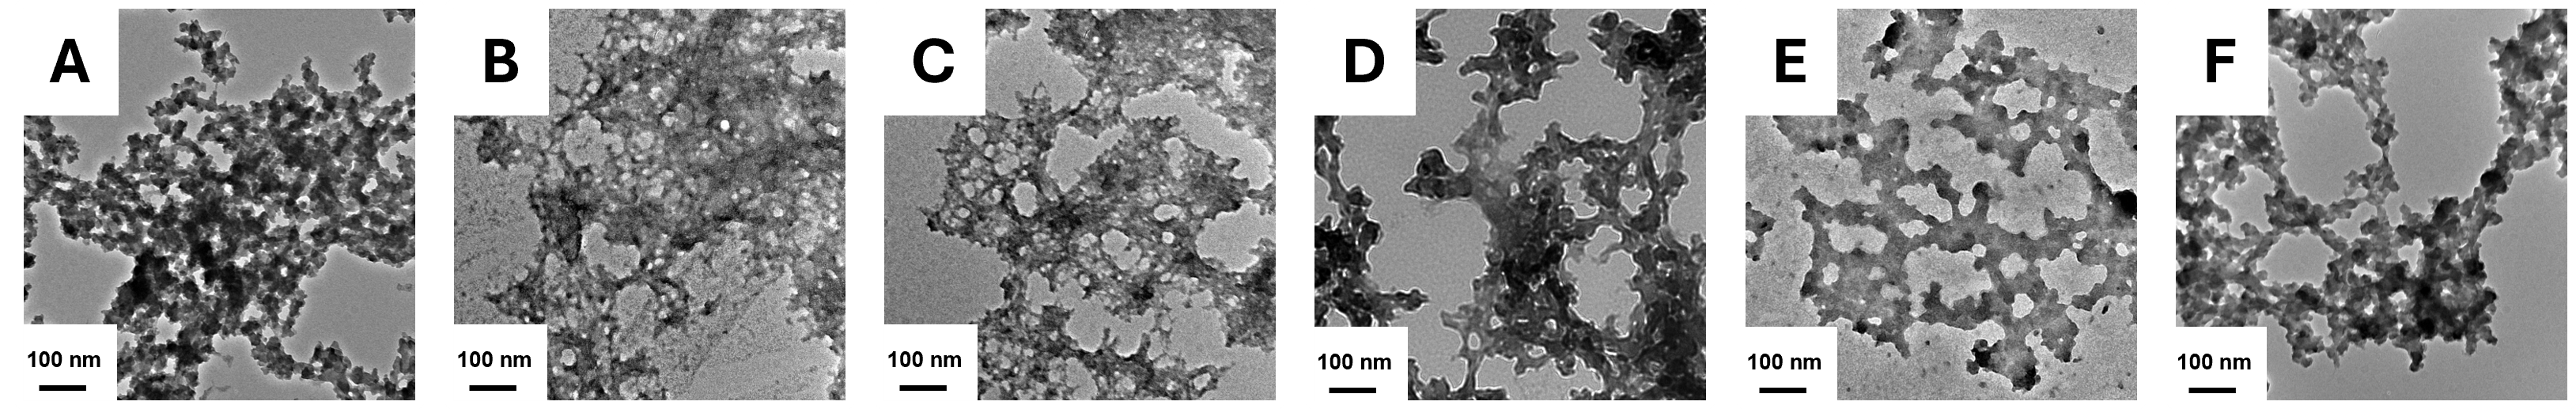
3.6. TEM
3.7. HSA Binding
3.8. Cell Viability Assay
4. Conclusions
Supplementary Materials
Author Contributions
Funding
Institutional Review Board Statement
Informed Consent Statement
Data Availability Statement
Acknowledgments
Conflicts of Interest
References
- Walker, L.C. Aβ Plaques. Free Neuropathol. 2020, 1, 1–31. [Google Scholar] [CrossRef]
- Zhang, Y.W.; Thompson, R.; Zhang, H.; Xu, H.X. APP processing in Alzheimer’s disease. Mol. Brain 2011, 4, 1–13. [Google Scholar] [CrossRef] [PubMed]
- Hampel, H.; Hardy, J.; Blennow, K.; Chen, C.; Perry, G.; Kim, S.H.; Villemagne, V.L.; Aisen, P.; Vendruscolo, M.; Iwatsubo, T.; et al. The Amyloid-beta Pathway in Alzheimer’s Disease. Mol. Psychiatry 2021, 26, 5481–5503. [Google Scholar] [CrossRef] [PubMed]
- Lovell, M.A.; Robertson, J.D.; Teesdale, W.J.; Campbell, J.L.; Markesbery, W.R. Copper, iron and zinc in Alzheimer’s disease senile plaques. J. Neurol. Sci. 1998, 158, 47–52. [Google Scholar] [CrossRef]
- Mutter, S.T.; Turner, M.; Deeth, R.J.; Platts, J.A. Metal Binding to Amyloid-beta(1-42): A Ligand Field Molecular Dynamics Study. Acs Chem. Neurosci. 2018, 9, 2795–2806. [Google Scholar] [CrossRef]
- Gomes, L.M.F.; Bataglioli, J.C.; Storr, T. Metal complexes that bind to the amyloid-beta peptide of relevance to Alzheimer’s disease. Coord. Chem. Rev. 2020, 412, 213255. [Google Scholar] [CrossRef]
- Ferreira, S.T.; Lourenco, M.V.; Oliveira, M.M.; De Felice, F.G. Soluble amyloid-beta oligomers as synaptotoxins leading to cognitive impairment in Alzheimer’s disease. Front. Cell. Neurosci. 2015, 9, 191. [Google Scholar] [CrossRef]
- Cline, E.N.; Bicca, M.A.; Viola, K.L.; Klein, W.L. The Amyloid-β Oligomer Hypothesis: Beginning of the Third Decade. J. Alzheimers Dis. 2018, 64, S567–S610. [Google Scholar] [CrossRef]
- Yadollahikhales, G.; Rojas, J.C. Anti-Amyloid Immunotherapies for Alzheimer’s Disease: A 2023 Clinical Update. Neurotherapeutics 2023, 20, 914–931. [Google Scholar] [CrossRef]
- Huffman, S.E.; Yawson, G.K.; Fisher, S.S.; Bothwell, P.J.; Platt, D.C.; Jones, M.A.; Hamaker, C.G.; Webb, M.I. Ruthenium(III) complexes containing thiazole-based ligands that modulate amyloid-beta aggregation. Metallomics 2020, 12, 491–503. [Google Scholar] [CrossRef]
- Wall, B.J.; Will, M.F.; Yawson, G.K.; Bothwell, P.J.; Platt, D.C.; Apuzzo, C.F.; Jones, M.A.; Ferrence, G.M.; Webb, M.I. Importance of Hydrogen Bonding: Structure-Activity Relationships of Ruthenium(III) Complexes with Pyridine-Based Ligands for Alzheimer’s Disease Therapy. J. Med. Chem. 2021, 64, 10124–10138. [Google Scholar] [CrossRef] [PubMed]
- Yawson, G.K.; Will, M.F.; Huffman, S.E.; Strandquist, E.T.; Bothwell, P.J.; Oliver, E.B.; Apuzzo, C.F.; Platt, D.C.; Weitzel, C.S.; Jones, M.A.; et al. A Dual-Pronged Approach: A Ruthenium(III) Complex That Modulates Amyloid-beta Aggregation and Disrupts Its Formed Aggregates. Inorg. Chem. 2022, 61, 2733–2744. [Google Scholar] [CrossRef]
- Shum, J.; Leung, P.K.K.; Lo, K.K.W. Luminescent Ruthenium(II) Polypyridine Complexes for a Wide Variety of Biomolecular and Cellular Applications. Inorg. Chem. 2019, 58, 2231–2247. [Google Scholar] [CrossRef] [PubMed]
- Cook, N.P.; Ozbil, M.; Katsampes, C.; Prabhakar, R.; Marti, A.A. Unraveling the Photoluminescence Response of Light-Switching Ruthenium(II) Complexes Bound to Amyloid-beta. J. Am. Chem. Soc. 2013, 135, 10810–10816. [Google Scholar] [CrossRef]
- Cook, N.P.; Torres, V.; Jain, D.; Marti, A.A. Sensing Amyloid-beta Aggregation Using Luminescent Dipyridophenazine Ruthenium(II) Complexes. J. Am. Chem. Soc. 2011, 133, 11121–11123. [Google Scholar] [CrossRef]
- Bataglioli, J.C.; Gomes, L.M.F.; Maunoir, C.; Smith, J.R.; Cole, H.D.; McCain, J.; Sainuddin, T.; Cameron, C.G.; McFarland, S.A.; Storr, T. Modification of amyloid-beta peptide aggregation via photoactivation of strained Ru(ii) polypyridyl complexes. Chem. Sci. 2021, 12, 7510–7520. [Google Scholar] [CrossRef]
- Meiss, C.J.; Bothwell, P.J.; Webb, M.I. Ruthenium(II)-arene complexes with chelating quinoline ligands as anti-amyloid agents. Can. J. Chem. 2022, 100, 18–24. [Google Scholar] [CrossRef]
- Devagi, G.; Shanmugam, G.; Mohankumar, A.; Sundararaj, P.; Dallemer, F.; Kalaivani, P.; Prabhakaran, R. Caenorhabditis elegans as a model for exploring the efficacy of synthesized organoruthenium complexes for aging and Alzheimer’s disease a neurodegenerative disorder: A systematic approach. J. Organomet. Chem. 2017, 838, 12–23. [Google Scholar] [CrossRef]
- Cuccioloni, M.; Cecarini, V.; Bonfili, L.; Pettinari, R.; Tombesi, A.; Pagliaricci, N.; Petetta, L.; Angeletti, M.; Eleuteri, A.M. Enhancing the Amyloid-beta Anti-Aggregation Properties of Curcumin via Arene-Ruthenium(II) Derivatization. Int. J. Mol. Sci. 2022, 23, 8710. [Google Scholar] [CrossRef]
- Constable, E.C.; Housecroft, C.E. The Early Years of 2,2′-Bipyridine-A Ligand in Its Own Lifetime. Molecules 2019, 24, 3951. [Google Scholar] [CrossRef]
- Son, G.; Lee, B.I.; Chung, Y.J.; Park, C.B. Light-triggered dissociation of self-assembled beta-amyloid aggregates into small, nontoxic fragments by ruthenium (II) complex. Acta Biomater. 2018, 67, 147–155. [Google Scholar] [CrossRef] [PubMed]
- Kumar, A.; Moody, L.; Olaivar, J.F.; Lewis, N.A.; Khade, R.L.; Holder, A.A.; Zhang, Y.; Rangachari, V. Inhibition of A beta 42 Peptide Aggregation by a Binuclear Ruthenium(II)-Platinum(II) Complex: Potential for Multimetal Organometallics as Anti-amyloid Agents. ACS Chem. Neurosci. 2010, 1, 691–701. [Google Scholar] [CrossRef]
- Sheldrick, G.M. SHELXL—Integrated space-group and crystal-structure determination. Acta Crystallogr. A Found. Adv. 2015, 71, 3–8. [Google Scholar] [CrossRef] [PubMed]
- Sheldrick, G.M. Crystal structure refinement with SHELXL. Acta Crystallogr. Sect. C Struct. Chem. 2015, 71, 3–8. [Google Scholar] [CrossRef]
- Chadwick, N.; Kumar, D.K.; Ivaturi, A.; Grew, B.A.; Upadhyaya, H.M.; Yellowlees, L.J.; Robertson, N. Isomer Dependence of Efficiency and Charge Recombination in Dye-Sensitized Solar Cells Using Ru Complex Dyes Bearing Halogen Substituents. Eur. J. Inorg. Chem. 2015, 2015, 4878–4884. [Google Scholar] [CrossRef]
- Sabate, R.; Gallardo, M.; Estelrich, J. An autocatalytic reaction, as a model for the kinetics of the aggregation of beta-amyloid. Biopolymers 2003, 71, 190–195. [Google Scholar] [CrossRef]
- Pace, C.N.; Vajdos, F.; Fee, L.; Grimsley, G.; Gray, T. How to Measure and Predict the Molar Absorption-Coefficient of a Protein. Protein Sci. 1995, 4, 2411–2423. [Google Scholar] [CrossRef]
- Platt, D.C.; Apuzzo, C.F.; Jones, M.A.; Cedeno, D.L.; Vallejo, R. Development of a C6 Glioma Cell Model System to Assess Effects of Cathodic Passively Balanced Electrical Stimulation on Responses to Neurotransmitters: Implications for Modulation of Intracellular Nitric Oxide, Chloride, and Calcium Ions. Brain Sci. 2022, 12, 1504. [Google Scholar] [CrossRef]
- Mosmann, T. Rapid Colorimetric Assay For Cellular Growth And Survival—Application To Proliferation And Cyto-toxicity Assays. J. Immunol. Methods 1983, 65, 55–63. [Google Scholar] [CrossRef]
- Kaim, W.; Reinhardt, R.; Sieger, M. Chemical and Electrochemical Generation of Hydride-Forming Catalytic Intermediates (bpy)M(CnRn): M = Rh, Ir (n = 5); M = Ru, Os (n = 6). Coordinatively Unsaturated Ground State Models of MLCT Excited States. Inorg. Chem. 1994, 33, 4453–4459. [Google Scholar] [CrossRef]
- Welby, C.E.; Armitage, G.K.; Bartley, H.; Sinopoli, A.; Uppal, B.S.; Elliott, P.I.P. Photochemical ligand ejection from non- sterically promoted Ru(II)bis(diimine) 4,4′-bi-1,2,3-triazolyl complexes. Photochem. Photobiol. Sci. 2014, 13, 735–738. [Google Scholar] [CrossRef]
- Colina-Vegas, L.; Villarreal, W.; Navarro, M.; de Oliveira, C.R.; Graminha, A.E.; Maia, P.I.D.; Deflon, V.M.; Ferreira, A.G.; Cominetti, M.R.; Batista, A.A. Cytotoxicity of Ru(II) piano-stool complexes with chloroquine and chelating ligands against breast and lung tumor cells: Interactions with DNA and BSA. J. Inorg. Biochem. 2015, 153, 150–161. [Google Scholar] [CrossRef] [PubMed]
- Aliende, C.; Pérez-Manrique, M.; Jalón, F.A.; Manzano, B.R.; Rodríguez, A.M.; Espino, G. Arene Ruthenium Complexes as Versatile Catalysts in Water in both Transfer Hydrogenation of Ketones and Oxidation of Alcohols. Selective Deuterium Labeling of rac-1-Phenylethanol. Organometallics 2012, 31, 6106–6123. [Google Scholar] [CrossRef]
- Telleria, A.; Vicent, C.; San Nacianceno, V.; Garralda, M.A.; Freixa, Z. Experimental Evidence Supporting Related Mechanisms for Ru(II)-Catalyzed Dehydrocoupling and Hydrolysis of Amine-Boranes. Acs Catal. 2017, 7, 8394–8405. [Google Scholar] [CrossRef]
- Wu, X.F.; Liu, J.K.; Di Tommaso, D.; Iggo, J.A.; Catlow, C.R.A.; Bacsa, J.; Xiao, J.L. A multilateral mechanistic study into asymmetric transfer hydrogenation in water. Chem. Eur. J. 2008, 14, 7699–7715. [Google Scholar] [CrossRef] [PubMed]
- Geldenhuys, W.J.; Mohammad, A.S.; Adkins, C.E.; Lockman, P.R. Molecular determinants of blood-brain barrier permeation. Ther. Deliv. 2015, 6, 961–971. [Google Scholar] [CrossRef]
- Hitchcock, S.A. Blood-brain barrier permeability considerations for CNS-targeted compound library design. Curr. Opin. Chem. Biol. 2008, 12, 318–323. [Google Scholar] [CrossRef]
- Swaminathan, S.; Karvembu, R. Dichloro Ru(II)-p-cymene-1,3,5-triaza-7-phosphaadamantane (RAPTA-C): A Case Study. ACS Pharmacol. Transl. Sci. 2023, 6, 982–996. [Google Scholar] [CrossRef]
- Alessio, E.; Messori, L. NAMI-A and KP1019/1339, Two Iconic Ruthenium Anticancer Drug Candidates Face-to-Face: A Case Story in Medicinal Inorganic Chemistry. Molecules 2019, 24, 1995. [Google Scholar] [CrossRef]
- Mensah, S.; Rosenthal, J.D.; Dagar, M.; Brown, T.; Mills, J.J.; Hamaker, C.G.; Ferrence, G.M.; Webb, M.I. A Ru(ii)-arene-ferrocene complex with promising antibacterial activity. Dalton Trans. 2022, 51, 17609–17619. [Google Scholar] [CrossRef]
- Boros, E.; Dyson, P.J.; Gasser, G. Classification of Metal-Based Drugs according to Their Mechanisms of Action. Chem 2020, 6, 41–60. [Google Scholar] [CrossRef] [PubMed]
- Biggs, G.S.; Klein, O.J.; Maslen, S.L.; Skehel, J.M.; Rutherford, T.J.; Freund, S.M.V.; Hollfelder, F.; Boss, S.R.; Barker, P.D. Controlled Ligand Exchange Between Ruthenium Organometallic Cofactor Precursors and a Naive Protein Scaffold Generates Artificial Metalloenzymes Catalysing Transfer Hydrogenation. Angew. Chem. Int. Ed. 2021, 60, 10919–10927. [Google Scholar] [CrossRef]
- Turner, M.; Platts, J.A.; Deeth, R.J. Modeling of Platinum-Aryl Interaction with Amyloid-beta Peptide. J. Chem. Theory Comput. 2016, 12, 1385–1392. [Google Scholar] [CrossRef] [PubMed]
- Gao, N.; Sun, H.J.; Dong, K.; Ren, J.S.; Duan, T.C.; Xu, C.; Qu, X.G. Transition-metal-substituted polyoxometalate derivatives as functional anti-amyloid agents for Alzheimer’s disease. Nat. Commun. 2014, 5, 3422. [Google Scholar] [CrossRef]
- Heffern, M.C.; Velasco, P.T.; Matosziuk, L.M.; Coomes, J.L.; Karras, C.; Ratner, M.A.; Klein, W.L.; Eckermann, A.L.; Meade, T.J. Modulation of Amyloid-beta Aggregation by Histidine-Coordinating Cobalt(III) Schiff Base Complexes. Chembiochem 2014, 15, 1584–1589. [Google Scholar] [CrossRef] [PubMed]
- Levine, H. Thioflavine-T Interaction With Synthetic Alzheimers-Disease Beta-Amyloid Peptides—Detection of Amyloid Aggregation in Solution. Protein Sci. 1993, 2, 404–410. [Google Scholar] [CrossRef]
- LeVine, H. Quantification of beta-sheet amyloid fibril structures with thioflavin T. Amyloid Prions Other Protein Aggreg. 1999, 309, 274–284. [Google Scholar] [CrossRef]
- Nag, S.; Sarkar, B.; Bandyopadhyay, A.; Sahoo, B.; Sreenivasan, V.K.A.; Kombrabail, M.; Muralidharan, C.; Maiti, S. Nature of the Amyloid-beta Monomer and the Monomer-Oligomer Equilibrium. J. Biol. Chem. 2011, 286, 13827–13833. [Google Scholar] [CrossRef]
- Shardlow, E.; Khan, B.; Exley, C. Monitoring the early aggregatory behaviour and size of Aβ1-42 in the absence & presence of metal ions using dynamic light scattering. J. Trace Elem. Med. Biol. 2021, 67, 126766. [Google Scholar] [CrossRef]
- Stetefeld, J.; McKenna, S.A.; Patel, T.R. Dynamic light scattering: A practical guide and applications in biomedical sciences. Biophys. Rev. 2016, 8, 409–427. [Google Scholar] [CrossRef] [PubMed]
- Ehlbeck, J.T.; Grimard, D.M.; Hacker, R.M.; Garcia, J.A.; Wall, B.J.; Bothwell, P.J.; Jones, M.A.; Webb, M.I. Finding the Best Location: Improving the Anti-Amyloid Ability of Ruthenium(III) Complexes with Pyridine Ligands. J. Inorg. Biochem. 2024, 250, 112424. [Google Scholar] [CrossRef]
- Guglielmelli, A.; Rizzuti, B.; Guzzi, R. Stereoselective and domain-specific effects of ibuprofen on the thermal stability of human serum albumin. Eur. J. Pharm. Sci. 2018, 112, 122–131. [Google Scholar] [CrossRef] [PubMed]
- Gradishar, W.J. Albumin-bound paclitaxel: A next-generation taxane. Expert. Opin. Pharmacother. 2006, 7, 1041–1053. [Google Scholar] [CrossRef]
- Tseng, Y.J.; Huang, S.Y.; Kuo, C.H.; Wang, C.Y.; Wang, K.C.; Wu, C.C. Factors to influence the accuracy of albumin adjusted free valproic acid concentration. J. Formos. Med. Assoc. 2021, 120, 1114–1120. [Google Scholar] [CrossRef] [PubMed]
- Bos, O.J.M.; Remijn, J.P.M.; Fischer, M.J.E.; Wilting, J.; Janssen, L.H.M. Location and Characterization of the Warfarin-binding Site of Human-Serum Albumin—A Comparative-Study of 2 Large Fragments. Biochem. Pharmacol. 1988, 37, 3905–3909. [Google Scholar] [CrossRef]
- Muller, N.; Lapicque, F.; Drelon, E.; Netter, P. Binding Sites of Fluorescent Probes on Human Serum Albumin. J. Pharm. Pharmacol. 1994, 46, 300–304. [Google Scholar] [CrossRef]
- Kragh-Hansen, U.; Chuang, V.T.G.; Otagiri, M. Practical aspects of the ligand-binding and enzymatic properties of human serum albumin. Biol. Pharm. Bull. 2002, 25, 695–704. [Google Scholar] [CrossRef]
- Hacker, R.M.; Grimard, D.M.; Morgan, K.A.; Saleh, E.; Wrublik, M.M.; Meiss, C.J.; Kant, C.C.; Jones, M.A.; Brennessel, W.W.; Webb, M.I. Ru(II)-Arene Azole Complexes as Anti-Amyloid-β Agents. Dalton Trans. 2024, 53, 18845–18855. [Google Scholar] [CrossRef]
- Rahman, M.H.; Maruyama, T.; Okada, T.; Imai, T.; Otagiri, M. Study of Interaction of Carprofen and Its Enantiomers With Human Serum-Albumin 2. Stereoselective Site-to-Site Displacement of Carprofen By Ibuprofen. Biochem. Pharmacol. 1993, 46, 1733–1740. [Google Scholar] [CrossRef]
- Sedov, I.; Nikiforova, A.; Khaibrakhmanova, D. Binding Constants of Clinical Drugs and Other Organic Ligands with Human and Mammalian Serum Albumins. Biophysica 2021, 1, 344–358. [Google Scholar] [CrossRef]
- Nirzhor, S.S.R.; Khan, R.I.; Neelotpol, S. The Biology of Glial Cells and Their Complex Roles in Alzheimer’s Disease: New Opportunities in Therapy. Biomolecules 2018, 8, 93. [Google Scholar] [CrossRef] [PubMed]
- Carmichael, S.W.; Winkler, H. The Adrenal Chromaffin Cell. Sci. Am. 1985, 253, 40–49. [Google Scholar] [CrossRef] [PubMed]
- Blunden, B.M.; Stenzel, M.H. Incorporating ruthenium into advanced drug delivery carriers-an innovative generation of chemotherapeutics. J. Chem. Technol. Biotechnol. 2015, 90, 1177–1195. [Google Scholar] [CrossRef]
- Domotor, O.; Hartinger, C.G.; Bytzek, A.K.; Kiss, T.; Keppler, B.K.; Enyedy, E.A. Characterization of the binding sites of the anticancer ruthenium(III) complexes KP1019 and KP1339 on human serum albumin via competition studies. J. Biol. Inorg. Chem. 2013, 18, 9–17. [Google Scholar] [CrossRef]
- Hairat, S.; Zaki, M. Half sandwiched Ruthenium(II) complexes: En Route towards the targeted delivery by Human Serum Albumin (HSA). J. Organomet. Chem. 2021, 937, 121732. [Google Scholar] [CrossRef]


| Log D7.4 | Log K (DG) | Log K (WF) | |
|---|---|---|---|
| RuB | −1.90 ± 0.15 | 3.96 | 4.24 |
| RuBMe | −0.99 ± 0.13 | 3.99 | 4.56 |
| RuBMeO | −0.74 ± 0.08 | 3.91 | 4.00 |
| RuBA | −0.55 ± 0.03 | 4.07 | 4.38 |
| RuBtB | 0.84 ± 0.03 | 3.85 | — |
| ThT | DLS | TEM | HSA | Cytotoxicity | Average | |
|---|---|---|---|---|---|---|
| RuB | 2 | 3 | 2 | 3 | 4 | 2.8 |
| RuBMe | 5 | 1 | 3 | 4 | 2 | 3 |
| RuBMeO | 4 | 2 | 5 | 2 | 3 | 3.2 |
| RuBA | 1 | 4 | 1 | 5 | 1 | 2.4 |
| RuBtB | 3 | 5 | 4 | 1 | 5 | 3.6 |
Disclaimer/Publisher’s Note: The statements, opinions and data contained in all publications are solely those of the individual author(s) and contributor(s) and not of MDPI and/or the editor(s). MDPI and/or the editor(s) disclaim responsibility for any injury to people or property resulting from any ideas, methods, instructions or products referred to in the content. |
© 2025 by the authors. Licensee MDPI, Basel, Switzerland. This article is an open access article distributed under the terms and conditions of the Creative Commons Attribution (CC BY) license (https://creativecommons.org/licenses/by/4.0/).
Share and Cite
Hacker, R.M.; Smith, J.J.; Platt, D.C.; Brennessel, W.W.; Jones, M.A.; Webb, M.I. Ruthenium(II)–Arene Complexes with a 2,2′-Bipyridine Ligand as Anti-Aβ Agents. Biomolecules 2025, 15, 475. https://doi.org/10.3390/biom15040475
Hacker RM, Smith JJ, Platt DC, Brennessel WW, Jones MA, Webb MI. Ruthenium(II)–Arene Complexes with a 2,2′-Bipyridine Ligand as Anti-Aβ Agents. Biomolecules. 2025; 15(4):475. https://doi.org/10.3390/biom15040475
Chicago/Turabian StyleHacker, Ryan M., Jacob J. Smith, David C. Platt, William W. Brennessel, Marjorie A. Jones, and Michael I. Webb. 2025. "Ruthenium(II)–Arene Complexes with a 2,2′-Bipyridine Ligand as Anti-Aβ Agents" Biomolecules 15, no. 4: 475. https://doi.org/10.3390/biom15040475
APA StyleHacker, R. M., Smith, J. J., Platt, D. C., Brennessel, W. W., Jones, M. A., & Webb, M. I. (2025). Ruthenium(II)–Arene Complexes with a 2,2′-Bipyridine Ligand as Anti-Aβ Agents. Biomolecules, 15(4), 475. https://doi.org/10.3390/biom15040475