Article

Structural Characteristics of Mitochondrial Genomes of Two Species of Mackerel and Phylogenetic Analysis of Scombridae Family

1
State Key Laboratory of Mariculture Biobreeding and Sustainable Goods, Yellow Sea Fisheries Research Institute, Chinese Academy of Fishery Sciences, Qingdao 266071, China
2
College of Fisheries and Life Sciences, Dalian Ocean University, Dalian 116023, China
3
Laboratory for Marine Fisheries Science and Food Production Processes, Qingdao Marine Science and Technology Center, Qingdao 266237, China
*
Author to whom correspondence should be addressed.
These authors contributed equally to this work.
Biomolecules 2025, 15(4), 555; https://doi.org/10.3390/biom15040555
Submission received: 28 October 2024 / Revised: 23 December 2024 / Accepted: 3 April 2025 / Published: 9 April 2025
(This article belongs to the Section Molecular Biology)

Abstract

:
Scomberomorus guttatus and Scomberomorus commerson are both important marine economic fish species worldwide, with high scientific and ecological value. In this study, the complete mitochondrial genome sequences of these two species of mackerel were obtained by using next-generation sequencing technology, with total lengths of 16,562 bp and 16,594 bp, respectively. Like most teleosts, both species possess 13 protein-coding genes, 22 tRNA genes, 2 rRNA genes, and 1 non-coding region D-loop. The base composition showed significant AT bias (55.1%, 53.4%) and anti-G bias (16.0%, 16.2%). In their control area, the terminal-associated sequence (TAS) was identified, and a total of three core sequences with repeated “---TACAT---ATGTA---” were found. There are typical CSB-E structures and CSB-D-like structures in the central conserved domain (CD), but no CSB-F structures have been found. Meanwhile, the CSB-2 and CSB-3 structures were identified in the conserved sequence block (CSB), but the CSB-1 structure was missing. To further investigate the phylogenetic relationships within the Scombridae family, this study conducted a comparative analysis of mitochondrial genomes from 30 Scombridae species. Phylogenetic trees encompassing 60% of the documented Scombridae species were constructed using the Neighbor-Joining (NJ) and Maximum Likelihood (ML) methods. The results revealed a close evolutionary relationship between the genus Scomber and Rastrelliger, while the genus Scomberomorus exhibited closer affinities to Thunnus, Euthynnus, and Katsuwonus. At the species level, Scomberomorus guttatus diverged earlier from Scomberomorus commerson. These findings refine and update the phylogenetic relationships among Scombridae species, providing critical molecular evidence and insights for deeper exploration of their evolutionary history and genetic affinities.

1. Introduction

Scomberomorus guttatus and Scomberomorus commerson, both belonging to the family Scombridae of the order Scombriformes, are important marine economic fish species worldwide. They are widely distributed in the seas around the Korean Peninsula, Japan, and the Indo-West Pacific continental shelf. Research by domestic and foreign scholars on S. guttatus and S. commerson has mainly focused on morphological, growth, reproductive, and dietary characteristics, as well as ecological features such as migration and distribution, with relatively little attention given to their genetics [1]. Molecular genetic data provide crucial evidence for elucidating the population’s genetic structure and evolutionary relationships [2]. However, there has been no study on the complete mitochondrial genome sequences of S. guttatus and S. commerson.
Currently, the family Scombridae comprises 15 genera and 51 species [3]. Research on species within this family has primarily focused on population structure, stock identification, and phylogeography [4,5,6,7], with relatively less attention paid to systematic classification and evolution. Only a few scholars have previously analyzed their phylogenetic relationships based on single gene fragments [8,9,10]. However, single-gene fragments can only provide limited genetic information and fail to fully reflect the genetic diversity and evolutionary history. The resulting phylogenetic trees typically exhibit low resolution, making it difficult to accurately distinguish closely related species or reveal subtle differentiation within species. Additionally, taxonomic controversies persist regarding the genus Thunnus [11,12], and certain species identification issues remain within Scombridae [13]. Therefore, analyzing the phylogenetic relationships of Scombridae using mitochondrial genome protein-coding sequences holds significant scientific importance.
Mitochondrial DNA (mtDNA) is a circular, double-stranded, independent genome of approximately 15–20 kb in length, distinct from the nuclear genome. Due to its maternal inheritance, simple structure, ability for independent replication, high mutation rate, and relatively stable probability of occurrence of variations, mtDNA has been widely applied in studies of species evolution, phylogenetic relationships, and population genetics. It has become a powerful tool for resolving genetic differentiation among closely related species and populations [14,15,16]. In recent years, advancements in DNA sequencing technologies have greatly facilitated the rapid and accurate acquisition of mitochondrial genome data for fish species. Consequently, an increasing number of complete mitochondrial DNA sequences of fish have been reported [17,18,19,20]. This study determined and analyzed the complete mitochondrial genome sequences of S. guttatus and S. commerson. By comparing these sequences with those of 30 other species within the Scombridae family, we further explored the molecular phylogenetic relationships of Scombridae fish. The results of this research aim to provide basic information for the genetic diversity of Scomberomorus genus and the phylogenetic relationships of Scombridae family.

2. Materials and Methods

2.1. Experimental Materials and DNA Extraction

The samples of S. guttatus and S. commerson used in this study were obtained from the National Marine Fisheries Bioresource Repository’s fish DNA barcode voucher specimen library. Partial dorsal muscle tissue was excised and placed in 1.5 mL EP centrifuge tubes, fixed in 95% ethanol for 48 h, and then stored at −20 °C in a freezer for subsequent use. Genomic DNA was extracted from the tissue samples using the marine organism genomic DNA extraction kit from Beijing Tiangen Biotechnology Co., Ltd., China. DNA integrity was assessed by 1% agarose gel electrophoresis.

2.2. Sequencing, Gene Annotation, and Analysis

We commissioned Wuhan BGI to perform mitochondrial whole genome sequencing. The mitochondrial genome was extracted and assembled using NOVOPlasty 4.3 software [21]. Between October and November 2023, the complete mitochondrial genome sequence obtained from the assembly was uploaded to the MITOS web server (http://mitofish.aori.u-tokyo.ac.jp/, accessed on 15 October 2023) for annotation, with the reference sequences of closely related species, Australian Spanish mackerel (Scomberomorus munroi: JX559743.1) and Barred Spanish mackerel (Scomberomorus semifasciatus: NC_021391.1). The final positions and lengths of each gene were determined and verified through manual alignment.
We used the online tRNAscan-SE 2.0 software (http://trna.ucsc.edu/tRNAscan-SE/, accessed on 15 October 2023) [22] to predict the secondary structure of tRNA genes. MEGA 7 software [23] was employed to analyze base composition and codon usage, calculate AT-skew and GC-skew values, and graphical analysis was conducted using Microsoft Excel software (https://www.microsoft.com/en-us/microsoft-365/excel, accessed on 15 October 2023).

2.3. Phylogenetic Analysis

In addition to the two new mitochondrial genomes obtained in this study, the GenBank database also records mitochondrial genome sequences of 30 species from 11 genera in the family Scombridae (Table 1). We extracted the mitochondrial genome protein-coding sequences of all mackerel fish, with Siniperca chuatsi and Girella punctate as outgroups. We used the Kimura-2-parameter model of Mega7.0 software to construct Neighbor-Joining (NJ) and Maximum Likelihood (ML) phylogenetic trees, respectively.

3. Results and Analysis

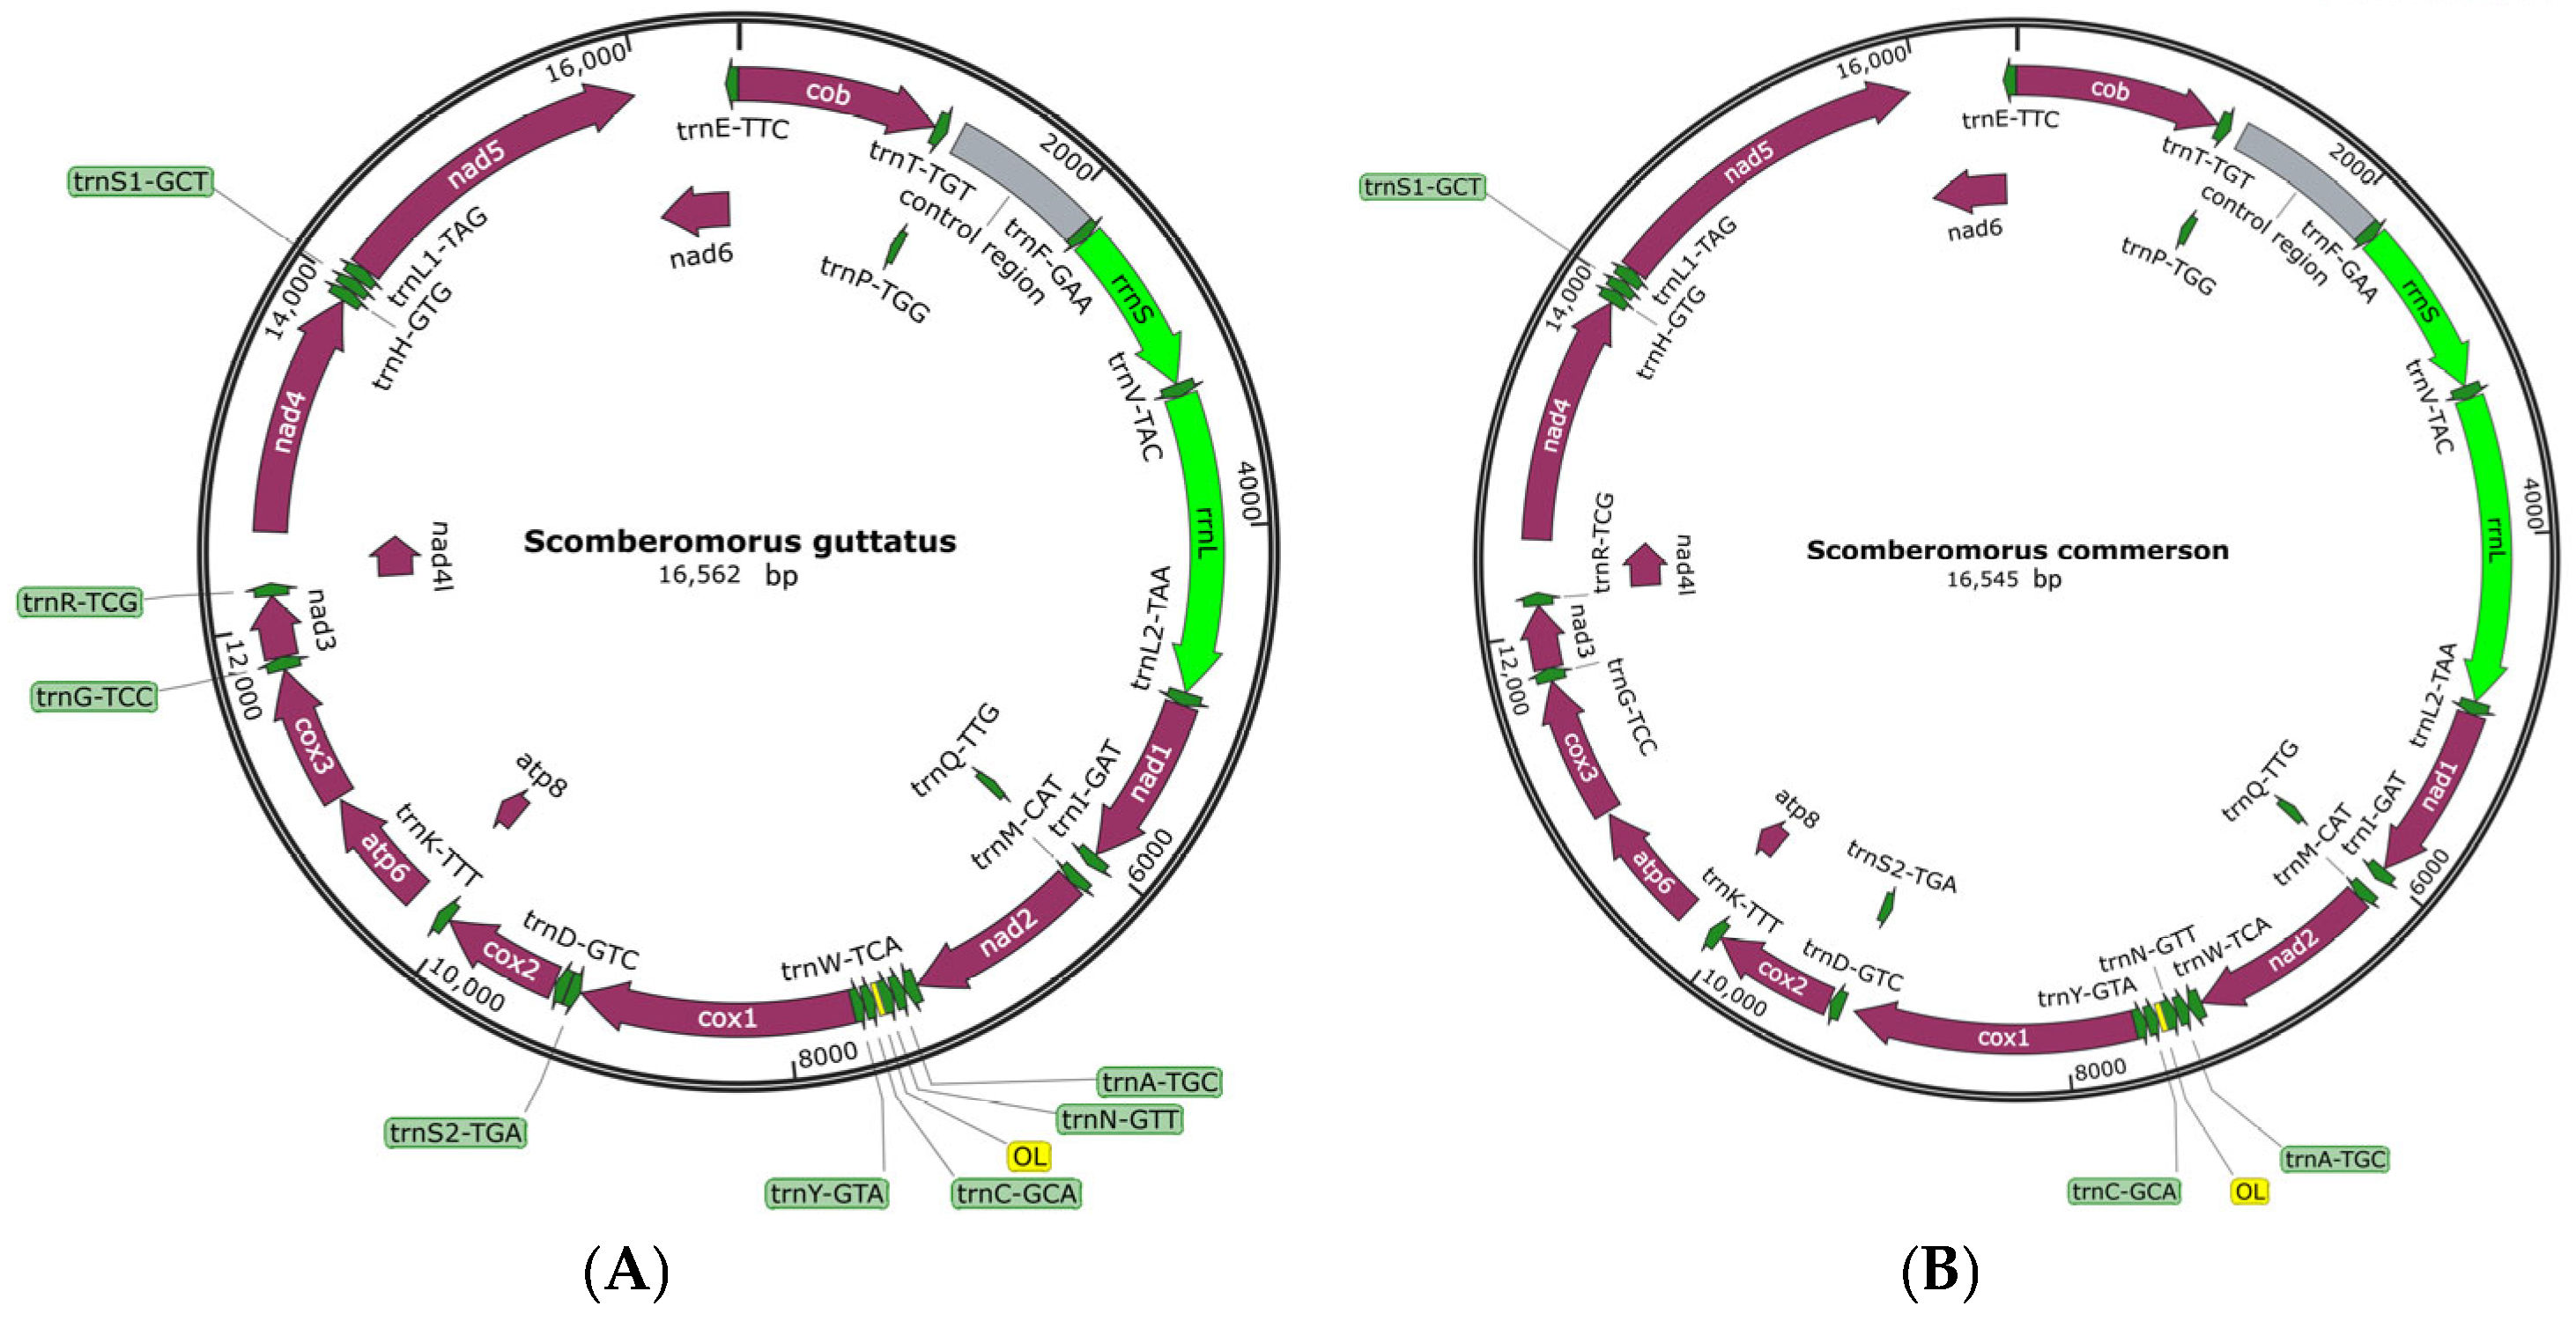
3.1. Composition and Localization of Mitochondrial Genome

Analysis of the mitochondrial genomes of S. guttatus and S. commerson showed that their total lengths are 16,562 bp and 16,545 bp (Figure 1), respectively, comprising 37 genes and non-coding regions. The structure is highly conserved, with the types and arrangement of each gene conforming to the typical structure of vertebrate mitochondrial genomes (Table 2). Specifically, they include 13 protein-coding genes (PCGs); 7 NADH dehydrogenase subunits (ND1, ND2, ND3, ND4, ND4L, ND5, ND6); 3 cytochrome c oxidase subunits (COI, COII, COIII); 2 ATP synthase subunits (ATP6, ATP8); 1 cytochrome b gene (Cytb); 2 rRNA genes (12S rRNA, 16S rRNA); and 1 control region (D-loop). The non-coding region mainly consists of two parts: the control region and the light strand replication origin.

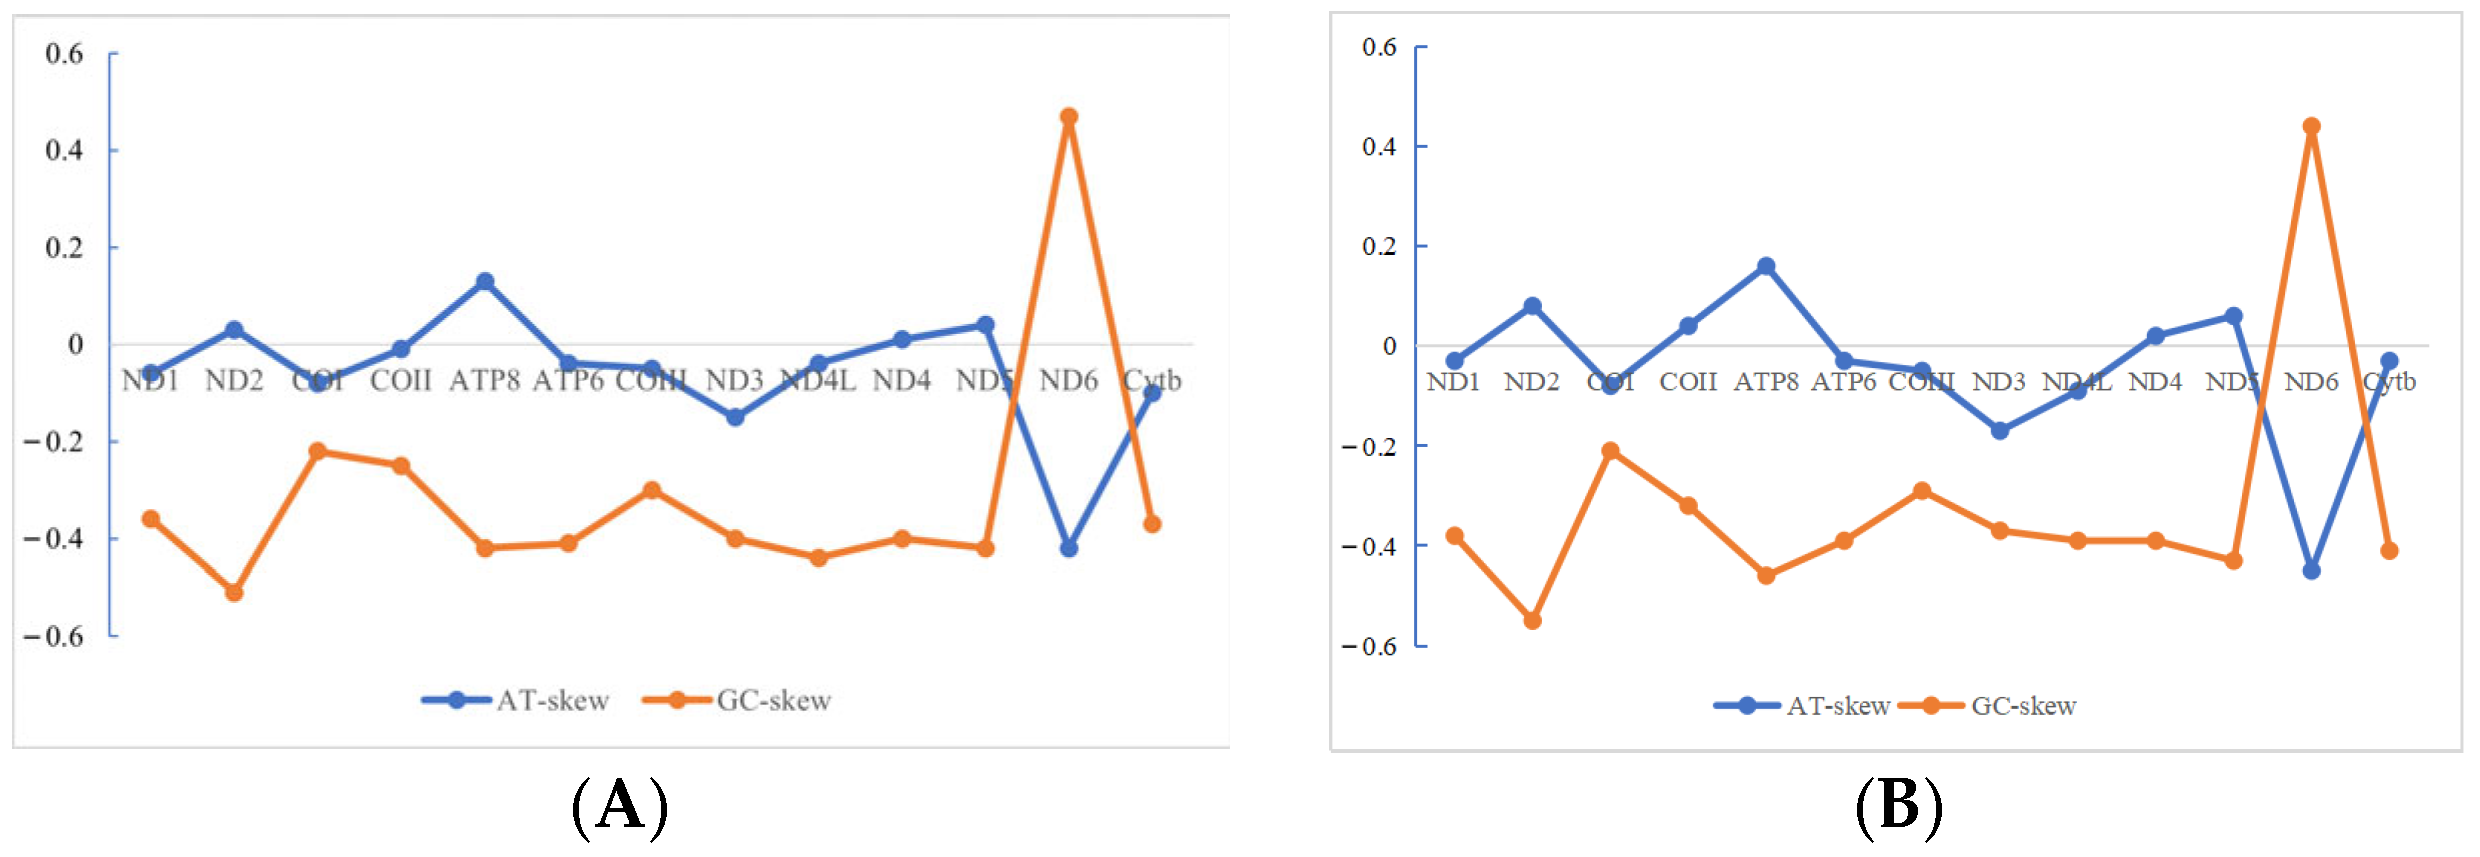
3.2. Analysis of Mitochondrial Genome Base Composition

Based on the analysis of nucleotide composition of the mitochondrial genome sequences of S. guttatus and S. commerson, it was observed that the A + T base content was significantly higher than G + C, indicating a pronounced AT bias (55.1% and 53.5%, respectively). Additionally, both species showed low guanine (G) content (16.0% and 16.2%, respectively), indicating a significant anti-G bias in the base composition of their mitochondrial genomes. This anti-G bias was particularly prominent in protein-coding genes, with G content only 15.3% and 15.6%, respectively (Table 3).

3.3. Analysis of Gene Segments in Mitochondrial Genome

3.3.1. Base Composition and Content of Protein-Coding Genes

The distribution of bases in protein-coding genes of mitochondrial genomes of S. guttatus and S. commerson is uneven. Specifically, the highest T base content is observed in ND6 located on the L chain (39.5% and 39.1%), while the lowest is in ATP8 (23.8% and 22.6%); the highest C base content is in ND4L (35.7%), while the lowest is in COII (26.6%); the highest A base content is in ATP8 (31.0%), while the lowest is in ND6 (16.1% and 14.8%); the highest G base content is in ND6 (32.6% and 33.3%), while the lowest is in ND2 (11.3% and 10.6%). Regarding the base composition of codons, the four bases at the first position of codons are relatively similar in content, indicating no clear preference for base usage. At the second position of codons, the T base content is highest (35%), while the G base content is lowest (14.9%), indicating a significant T bias and anti-G bias. At the third position of codons, the C base content is highest (32.4%), while the G base content is lowest (11.2%). In summary, the mitochondrial protein-encoding gene ND6 of both S. guttatus and S. commerson exhibited a strong GC bias in the mitochondrial protein-coding gene ND6, while the rest of the genes showed an AT bias (Figure 2).
A preliminary analysis of the relative synonymous codon usage (RSCU) and the types and quantities of amino acids of the 13 protein-coding genes in the mitochondrial genome was conducted. The results show that both species encode a total of 3812 and 3816 amino acids, with Leucine being the most frequently used amino acid (17.23%, 17.39%), and termination codons being the least frequent, accounting for 0.34% each (Figure 3). There are 34 preferred codons (RSCU ≥ 1) among the 13 protein-coding genes. For S. guttatus, the codon UAA, encoding Leucine, is the most common (RSCU = 3.6924), followed by AUA, encoding Methionine (RSCU = 3.225). While for S. commerson, the codon AUA, encoding Methionine, is the most common (RSCU = 3.1595), followed by CGA, encoding Arginine (RSCU = 2.5456).

3.3.2. rRNA and tRNA Structural Features

The 12s rRNA gene in S. guttatus and S. commerson is between tRNA-Phe and tRNA-Val, while the 16S rRNA gene is between tRNA-Val and tRNA-Leu. The H chain encodes both and has no intergenic or overlapping regions. The AT content of rRNAs is 53.8% and 53.7%, respectively, while the GC content is 46.2% and 46.3%, with A bases being the most prevalent at 31.3% and 32.2%, respectively (Table 3). The secondary structure of rRNA genes forms several stem-loop structures, with a predicted free energy of −259.70 kcal/mol for 12S rRNA and −433.20 kcal/mol for 16S rRNA in S. guttatus. In S. commerson, the predicted free energy is −255.30 kcal/mol for 12S rRNA and −269.52 kcal/mol for 16S rRNA.
Both S. guttatus and S. commerson mtDNA contains 22 tRNA genes ranging in length from 65 to 76 bp. These tRNAs are encoded on both the H chain and the L chain, with tRNA-Pro, tRNA-Gln, tRNA-Ala, tRNA-Asn, tRNA-Cys, tRNA-Tyr, tRNA-Ser (TGA), and tRNA-Glu located on the L chain, while the remaining 14 tRNAs are encoded on the H chain (Table 2). The AT content of tRNA genes in S. guttatus and S. commerson is 54.7% and 53.9%, respectively, while the GC content is 45.3% and 46.0%, respectively (Table 3). The tRNA-Ser lacks the dihydrouridine (DHU) arm, forming only a 12 bp loop, a structure commonly observed in vertebrates. The remaining 21 tRNAs can fold into typical cloverleaf secondary structures (Figure 4), each comprising multiple stem-loop structures, including the aminoacyl acceptor arm, aminoacyl acceptor loop, anticodon arm, anticodon loop, TYC arm, TV loop, DHU arm, DHU loop, and aminoacyl acceptor arm.
Comparative analysis of the sequences and structures of various tRNA genes reveals that only six tRNA genes—tRNA-Met, tRNA-Ala, tRNA-Cys, tRNA-Asp, tRNA-Gly, and tRNA-Glu—underwent mutations between S. guttatus and S. commerson. Each gene had only one mutation site, which did not affect the formation of their secondary structures and did not occur in the anticodon’s three bases. In the tRNA gene structure of S. guttatus, a total of 13 pairs of non-paired bases were detected, involving six types of base mismatches: A-C, A-A, A-G, C-C, U-C, and U-U mismatches. Among these 13 pairs of mismatched bases, 10 pairs occurred in the aminoacyl acceptor arm, involving tRNA-Phe, tRNA-Leu, tRNA-Ile, tRNA-Trp, tRNA-Ser, tRNA-His, tRNA-Leu, tRNA-Thr, tRNA-Pro, and tRNA-Ser. One pair occurred in the anticodon arm of tRNA-Met, one pair in the DHU arm of tRNA-Arg, and one pair in the TψC arm of tRNA-Glu. Such mismatched bases mainly occur in the aminoacyl acceptor arm, a phenomenon observed in other fish species as well. Some mismatches can be corrected through later RNA editing, without causing amino acid transport disorders [24].

3.3.3. Structural Features of the Mitochondrial Genome Control Region

The mitochondrial control region (D-loop) is a non-coding region of mitochondrial DNA with the fastest evolutionary rate, and is therefore widely used in population genetics and molecular systematics studies of fish. In the mitochondrial genomes of S. guttatu and S. commerson, the control region is located between tRNA-Pro and tRNA-Phe, with a length of 857bp. The A (32.2%, 31.1%) and T (30.9%, 32.1%) base contents in the D-loop region are relatively high, while the C (20.9%, 22.0%) and G (16%, 14.9%) base contents are relatively low. From the 5′ end adjacent to tRNA-Pro, it can be divided into the terminal-associated sequence (TAS), the central conserved domain (CD), and the conserved sequence block (CSB). The research revealed certain differences in the position, quantity, and base composition of these regions between S. guttatu and S. commerson (Figure 5).

Termination-Associated Sequence Region

Liu Huanzhang [25] pointed out that the main structure of fish extended termination-related sequences is formed by “---TACAT---ATGTA---”. In this research, via sequence alignment of closely related fish species within the genus Scomberomorus, we have identified three recurring core sequences of “---TACAT---ATGTA---” in the control region sequences of both S. guttatu and S. commerson. Additionally, the control region sequences of other closely related species within the Scomberomorus genus also encompass these three recurring core sequences of “---TACAT---ATGTA---”.

Central Conserved Domain Translation

This study revealed that S. guttatu and S. commerson exhibit typical CSB-E and CSB-D structures. Notably, the CSB-E critical sequence contains a GTGGG-box, while no CSB-F structure was identified. Due to variations in the central conserved domain among fish species, some species rarely have all three structures of CSB-D, CSB-E, and CSB-F simultaneously. Lee et al. [26] analyzed the mitochondrial control regions of 23 species from 6 genera of fish and only identified the presence of CSB-D. Similarly, Zeng et al. [27] only identified CSB-D in the mitochondrial control region of the large yellow croaker.

The Conservative Sequence Region

In this study, CSB-2 and CSB-3 structures were identified in the conservative sequence region, while the CSB-1 structure was not recognized. CSB-2 and CSB-3 were identified as 5ʹ-TAAACCCCCCTACCCCCC-3ʹ and 5ʹ-TGTAAACCCCCCGTAAACA-3ʹ, respectively. By comparing the fish control region sequences with those of S. guttatus and S. commerson, it was found that CSB-2 is the most conservative among fish species, with nearly identical sequences containing two segments of C repeats interspaced by two–three pyrimidine nucleotides. CSB-3 exhibits greater variation among fish species and is difficult to identify. Studies have indicated its association with the replication origin of mitochondria, particularly in mammals, where CSB-1 is highly conserved. However, in fish, CSB-1 shows the greatest variability within the conservative sequence region. The phenomenon is also observed in other fish species [28].

3.4. Results of Phylogenetic Analysis

The constructed phylogenetic tree is shown in Figure 6. Both phylogenetic trees clearly divide the 32 species of Scombridae into two clades: one cluster includes the genus Scomber and the genus Rastrelliger, while the other cluster comprises the remaining species including the genera Thunnus, Katsuwonus, Auxis, Euthynnus, Gymnosarda, Acanthocybium, Sarda, and Scomberomorus. Clustering of species in the same genus is more effective. The NJ phylogenetic tree constructed using protein-coding sequences shows slightly lower confidence values in some evolutionary branches compared to the ML phylogenetic tree. The genus Scomber forms a monophyletic group, with relatively close phylogenetic relationships to the tribe Thunnini compared to the genus Scomberomorus. Both NJ and ML phylogenetic trees indicate that within the genus Scomberomorus, S. niphonius and the S. munroi form one cluster, while the S. concolor, S. sierra, and S. maculatus form another cluster, with the divergence time between the S. guttatus and S. commerson being relatively early within the genus Scomberomorus. Within the tribe Thunnini, the genera Thunnus, Auxis, and Euthynnus are sister groups. The genus Thunnus is divided into two evolutionary branches: one branch includes T.alalunga and T.orientalis, while the other branch comprises T. albacares, T. atlanticus, T. maccoyii, T. obesus, T. thynnus, and T. tonggol. Unlike the NJ phylogenetic tree, the ML phylogenetic tree shows that T. thynnus and T. maccoyii form a separate cluster; in the NJ phylogenetic tree, T. albacares clusters with T. maccoyii, while in the ML phylogenetic tree, T. albacares clusters with T. atlanticus.

4. Discussion

This study employed next-generation sequencing technology to obtain the complete mitochondrial genome sequences of S. guttatus and S. commerson. An analysis of the mitochondrial DNA gene structures of these two species was conducted. Additionally, the molecular phylogenetic relationships within the Scombridae family were investigated using concatenated sequences of 12 protein-coding genes (PCGs) from 32 species of mackerel-like fishes, employing Neighbor-Joining (NJ) and Maximum Likelihood (ML) methods.

4.1. Mitochondrial DNA Sequence Structural Features of S. guttatus and S. commerson

The mitochondrial DNA sequences of both S. guttatus and S. commerson exhibit relatively high A + T content and low G + C content, demonstrating a pronounced AT bias. This phenomenon is also observed in other fish species, albeit with slight variations in content due to species differences. The underlying reasons for this base preference are likely associated with natural mutations and selection pressures during replication and transcription processes [29].
The protein-coding genes of both species, except for the first codon position, exhibit a relatively uniform distribution of each base. However, the second and third codon positions show a distinct bias against G, indicating a preference for other nucleotides. The restrictive influence of amino acids on base distribution and the corresponding differences in codon usage frequency are important factors contributing to the uneven distribution of bases in protein-coding genes [30]. Among the 20 amino acids encoded, Leucine (Leu) is the most frequently utilized, a phenomenon commonly observed in other fish species as well [31,32]. This study found that the absolute value of the free energy of the 12S rRNA gene is lower than that of the 16S rRNA gene. Generally, lower free energy values indicate greater molecular stability, suggesting that the former is more conservative than the latter. Additionally, the secondary structure prediction of the 16S rRNA gene also reveals more frequent nucleotide substitutions, insertions, and rearrangements, indicating a higher degree of variation compared to the 12S rRNA gene. Therefore, the 12S rRNA gene is often used as a DNA barcode for fish identification and phylogenetic studies [33].
Among the 22 tRNAs, both species exhibit a tRNA-Ser that cannot form a cloverleaf structure, a common feature in the mitochondrial gene genomes of most vertebrates, including fish. Studies have shown that such tRNAs lacking the DHU arm can adjust their structure and function later to integrate into the ribosome, facilitating their role in carrying and transporting amino acids [34]. Additionally, the phenomenon of base mismatches is widespread in the secondary structure of tRNAs. Since the mitochondrial genome is not influenced by the recombination process, base mismatches are allowed, and these mismatches help eliminate harmful mutations [35]. The mitochondrial control region primarily comprises regulatory elements controlling mitochondrial genome replication and expression. Investigating its structural and functional aspects will contribute to understanding DNA replication, transcription mechanisms, and evolutionary patterns [36,37].
In the control area of S. guttatus and S. commerson, the terminal-associated sequence (TAS) was identified, and a total of three core sequences with repeated “---TACAT---ATGTA---” were found. Additionally, the control region sequences of other closely related species within the Scomberomorus genus also encompass these three recurring core sequences of “---TACAT---ATGTA---”. The central conserved domain exhibited a typical CSB-E structure and CSB-D structure, while no CSB-F structure was found. In the conserved sequence region, we identified CSB-2 and CSB-3 structures but failed to identify the CSB-1 structure.

4.2. Molecular Phylogenetic Analysis of Scombridae

Presently, phylogenetic studies on Scombridae fishes are mostly based on single genes such as mitochondrial Cytb or ATP [38,39]. However, single gene information has limitations and cannot fully elucidate the complex evolutionary history and relationships among species. The use of a multi-gene approach can more accurately reflect genetic differences and evolutionary relationships among species. Considering that only the ND6 gene is located on the L strand, and the heterogeneity of its nucleotide composition can lead to poor performance in phylogenetic analysis [40]. Therefore, in this study, concatenated sequences of the 12 protein-coding genes encoded by the H strand were used to construct the phylogenetic tree of Scombridae based on the NJ and ML methods.
In this study, each node was labeled with support scores, which were calculated by combining data from multiple genes. Compared with the support rate based on single-gene data alone [38,39], this polygenic dataset significantly improves the support rate of key nodes, thereby enhancing the reliability and comprehensiveness of the phylogenetic tree
Chen Ying et al. [41] constructed phylogenetic relationships based on the protein-coding genes of 8 genera and 20 species of Scombridae, while our study further enriched and refined this phylogenetic framework based on mitochondrial genome sequences of 11 genera and 32 species of Scombridae. Our results showed that 6 species within the genus Scomber and Rastrelliger have close genetic relationships, as do 26 species across the genera Seriola, Thunnus, Neothunnus, Katsuwonus, Auxis, Gymnosarda, Alepisaurus, and Xenisthmidae. These findings not only support the conclusions of Chen Ying et al. [41]. but also provide more robust evidence for the phylogenetic relationships of Scombridae through a broader sample range and more comprehensive genomic data.
Compared to the studies by Jeena, Qiu Fan, and others [41,42], our results further refine the phylogenetic relationships within the genus Seriola. Their research was based on COI and Cytb gene fragments, as well as partial sequences of ITS1 for analyzing the molecular systematic evolution of Scombridae. In contrast, we utilized a more comprehensive mitochondrial genome dataset, providing higher resolution and a more accurate phylogenetic tree.
In addition, the mitochondrial genomes of S. guttatus and S. commerson have not been studied in detail. This study fills this gap, enriches the data resources of the mitochondrial genomes of Scombridae fishes, and further updates and refines the phylogenetic relationships among Scombridae fishes. Through this study, we not only deepen our understanding of the genetic diversity of Scombridae fishes, but also provide valuable basic information for future scientific research in related fields.
Although our study provides important phylogenetic information, the limited sample size may not fully represent the diversity of the entire Scombridae family. Future research should expand the sample range to obtain more comprehensive results. Future studies should focus on sequencing the mitochondrial genomes of more Scombridae species to further validate and refine our phylogenetic tree. Additionally, incorporating nuclear genomic data could provide a more comprehensive perspective.

5. Conclusions

In summary, this study conducted an analysis of the mitochondrial DNA genome structure of S. guttatus and S. commerson. Utilizing concatenated sequences of 12 protein-coding genes from 32 Scombridae species, the molecular phylogenetic relationships within the Scombridae family were analyzed using both Neighbor-Joining (NJ) and Maximum Likelihood (ML) methods. The main findings of the study are summarized as follows:
(1)
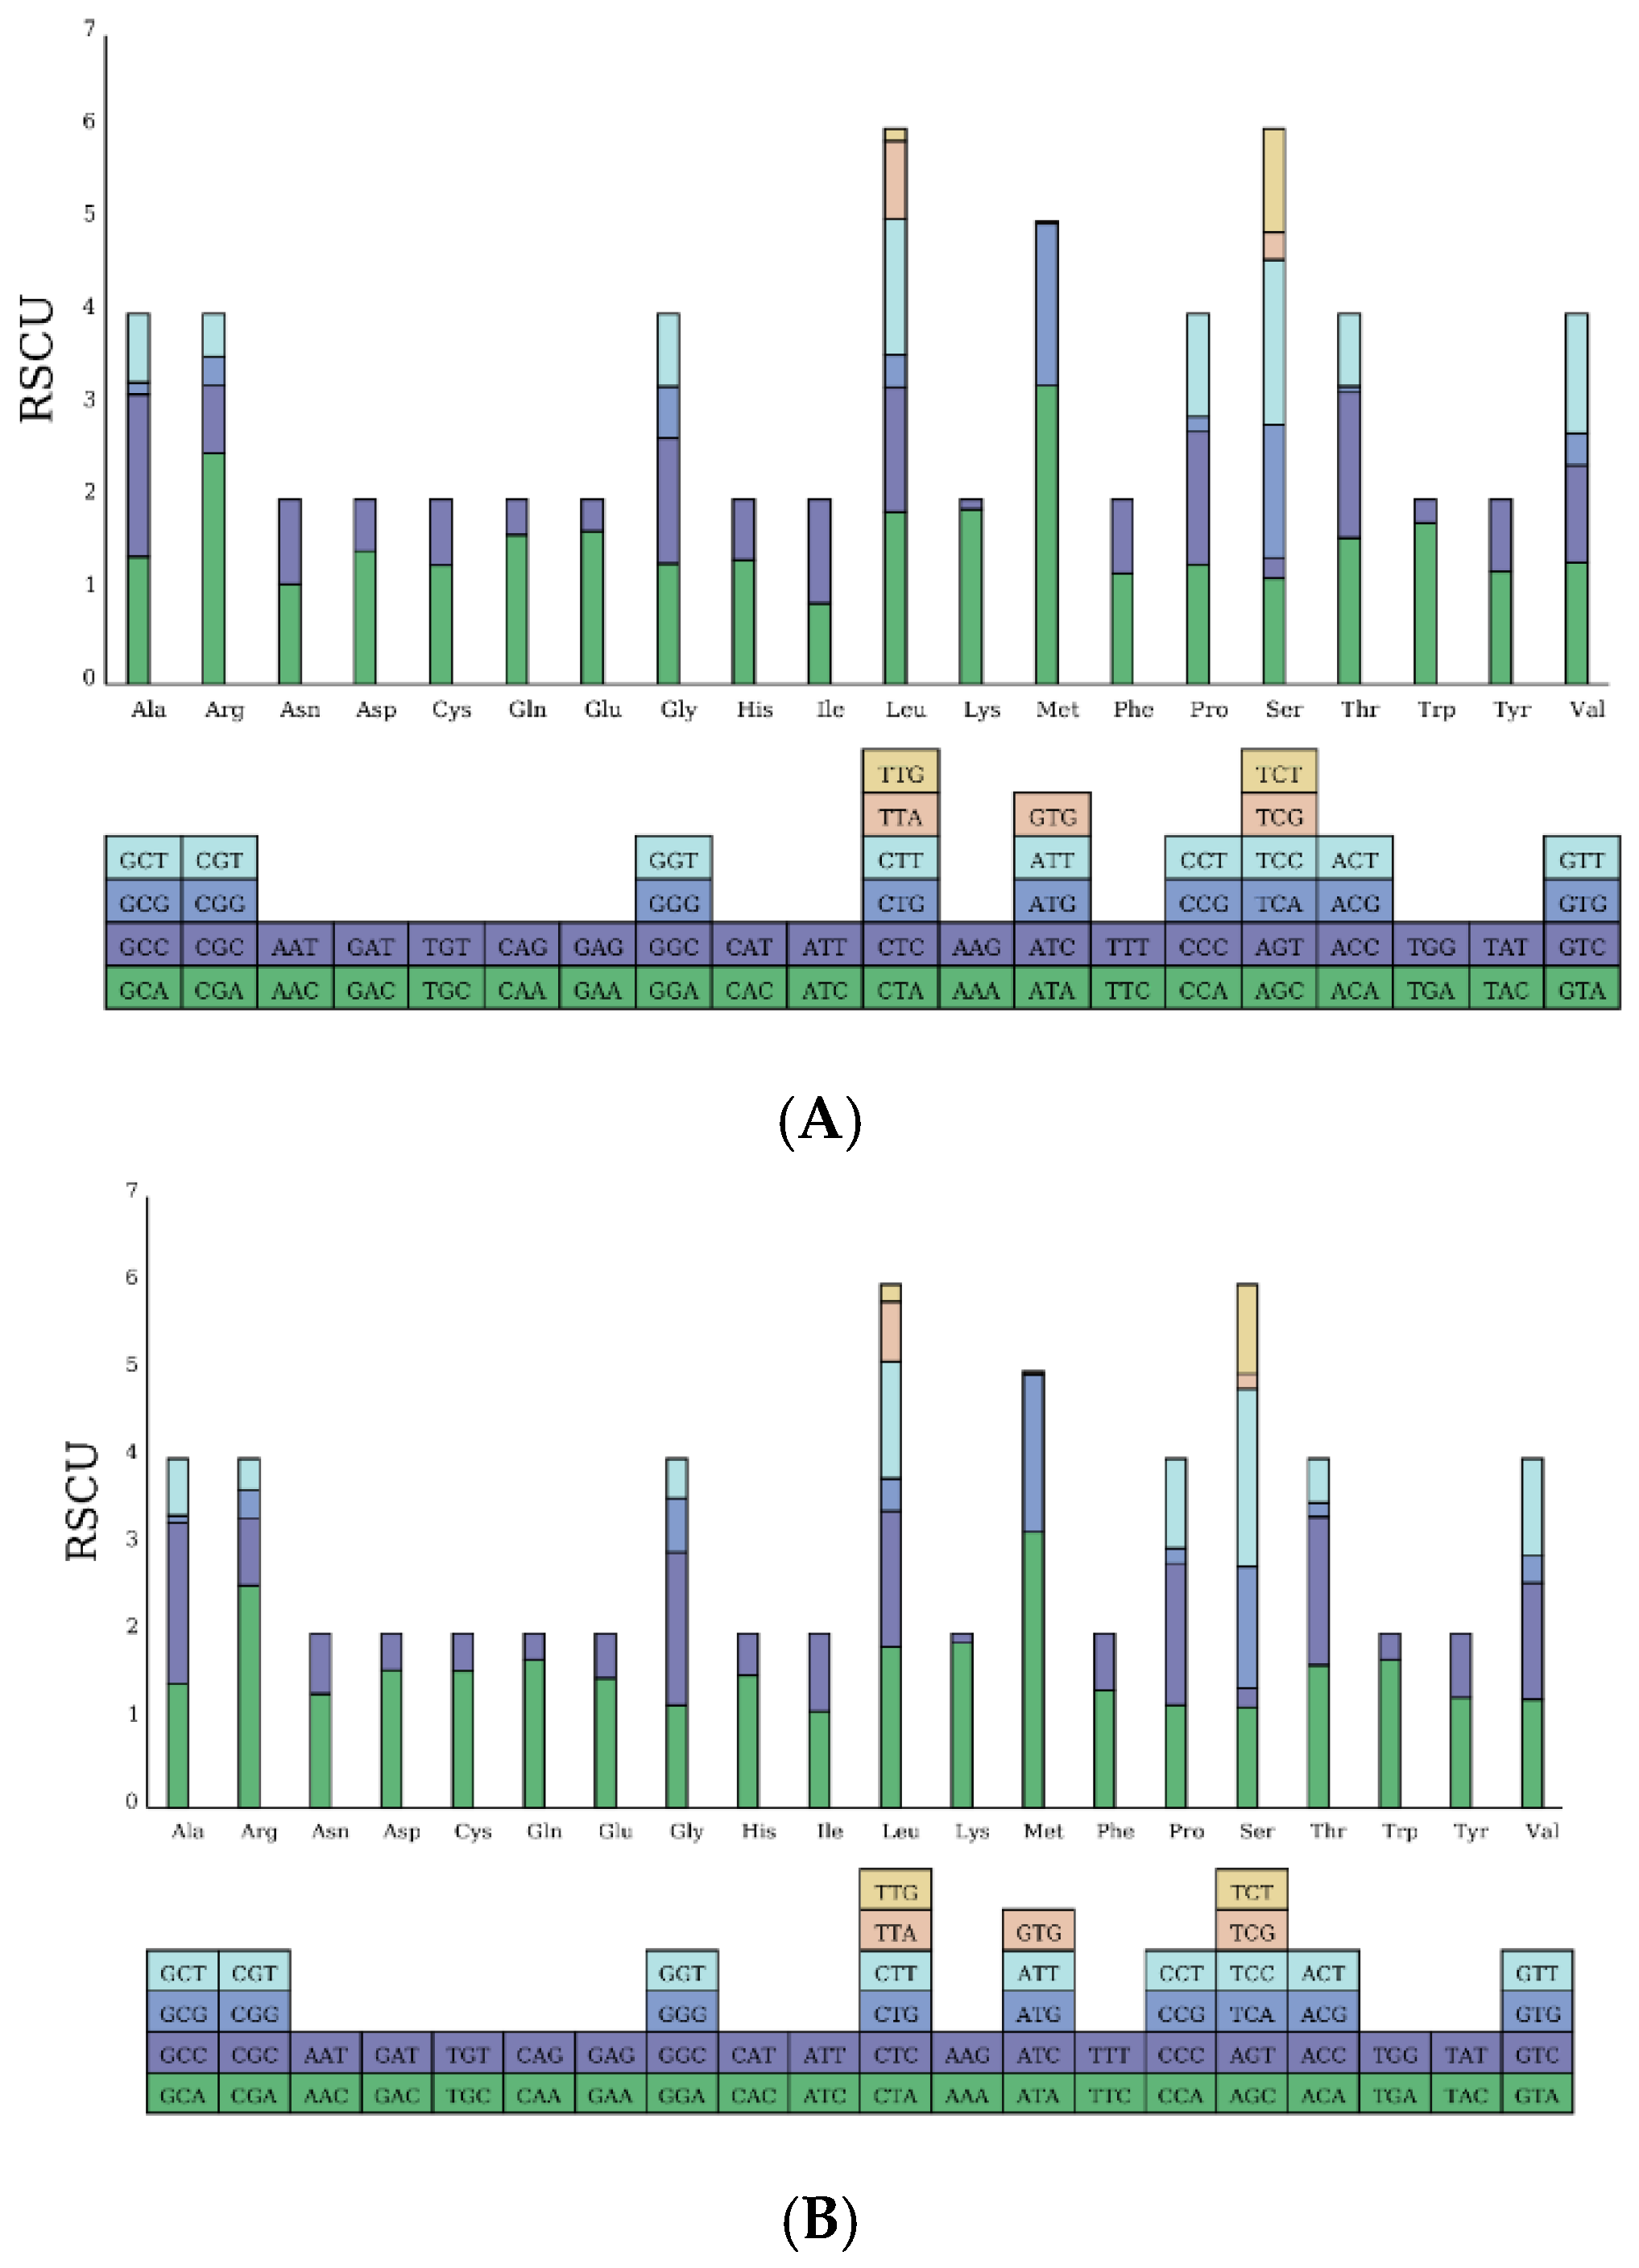
The mitochondrial DNA sequences of spotted mackerel and king mackerel are 16,562 bp and 16,545 bp, respectively. Both species possess 13 protein-coding genes, 22 tRNA genes, 2 rRNA genes, and 1 non-coding region (D-loop). The base composition consists of A (28.5%, 28.1%), T (26.6%, 25.3%), G (16.0%, 16.2%), and C (28.9%, 30.3%), indicating a high A + T content and a low G + C content, demonstrating a significant AT bias. Protein-coding genes in both species exhibit a relatively uniform distribution of bases at the first codon position, while the second and third positions show a clear anti-G bias. Among the 20 amino acids encoded, Leucine (Leu) is the most frequently used. This study reveals that the absolute value of the free energy of the 12S rRNA gene is lower than that of the 16S rRNA gene. In both species, the tRNA-Ser lacks the DHU arm, preventing the formation of a cloverleaf structure. In control area of S. guttatus and S. commerson, the terminal-associated sequence (TAS) was identified, and a total of three core sequences with repeated “---TACAT---ATGTA---” were found. In the control region of S. guttatus and S. commerson, termination signal regions, central conserved regions. The central conserved region exhibits a typical CSB-E structure and CSB-D structure, but no CSB-F structure was found. The conserved sequence block did not reveal a CSB-1 structure.
(2)
In this study, a phylogenetic tree of 60% of the Scombridae fish species was constructed using concatenated sequences of 12 protein-coding genes encoded by the heavy (H) strand of the mitochondrial genome. The tree was built using the NJ and ML methods. The results revealed a close relationship between the Scomber genus and the Acanthocybium genus, while the genus Scomberomorus showed closer affinity with the genera Thunnus, Auxis, Katsuwonus, Acanthocybium, Gymnosarda, Scomberomorus, Grammatorcynus, and Rastrelliger. Furthermore, within the genus Scomberomorus, a monophyletic group was formed, with the spotted mackerel and the king mackerel diverging early. S. niphonius and the S. munroi formed a separate clade, whereas S. concolor, S. sierra, and S. maculatus were sister groups. This study provides a more comprehensive understanding of the phylogenetic relationships within the Scombridae family, further confirming the evolutionary relationships among its members.
This study enriches the mitochondrial genome information of the Scombridae family, leading to a deeper understanding of the evolutionary overview and phylogenetic relationships of Scombridae fish. These findings offer a novel perspective, prompting a deeper exploration of the mitochondrial DNA sequences and evolutionary mechanisms of Scombridae fish, facilitating a better understanding of their evolutionary history, population genetic structure, as well as their roles and functions in ecosystems.

Author Contributions

Institutional Review Board Statement: J.Y.; conceptualization, J.Y., S.L. and A.L.; data curation, J.Y.; formal analysis, J.Y.; funding acquisition, A.L. and S.L.; investigation, J.Y.; methodology, J.Y. and A.L.; project administration, S.L. and A.L.; software, J.Y.; validation, J.Y. and S.L.; visualization, J.Y.; writing—original draft, J.Y.; writing—review and editing, J.Y., A.L. and S.L. All authors have read and agreed to the published version of the manuscript.

Funding

This research was funded by the National Key R&D Program (2024YFD2400401), and the Central Public-interest Scientific Institution Basal Research Fund (20603022022024).

Institutional Review Board Statement

The study was approved by the Institutional Animal Careand Use Committee of the Yellow Sea Fisheries Research Institute (YSFRI), Chinese Academy ofFishery Sciences (Approval code: YSFRI-2025058, 7 April 2025).

Informed Consent Statement

Not applicable.

Data Availability Statement

The complete mitogenomes of S. guttatus and S. commerson has been published inthe Genbank public database with accession number pp437201 and pp437202.

Conflicts of Interest

The authors declare no conflicts of interest.

References

  1. Chen, D.; Zhang, M. Chinese Marine Fish; Ocean University of China Press: Qingdao, China, 2015. [Google Scholar]
  2. Holland, L.Z.; Holland, P.W.H.; Holland, N.D.; Ferraris, J.D.; Palumbi, S.R. Molecular Zoology: Advances, Strategies, and Protocols; Wiley: New York, NY, USA, 1996; pp. 267–282. [Google Scholar]
  3. Nelson, J.S.; Grande, T.C.; Wilson, M.V.H. Fishes of the World; John Wiley & Sons: Hoboken, NJ, USA, 2016. [Google Scholar]
  4. Welch, D.J.; Newman, S.J.; Buckworth, R.C.; Ovenden, J.R.; Broderick, D.; Lester, R.J.; Newman, S.J.; Buckworth, R.C.; Ovenden, J.R.; Broderick, D.; et al. Integrating different approaches in the definition of biological stocks: A northern Australian multi-jurisdictional fisheries example using grey mackerel. Scomberomorus Semifasciatus 2015, 55, 73–80. [Google Scholar]
  5. Broderick, D.; Ovenden, J.R.; Buckworth, R.C.; Newman, S.J.; Lester, R.J.G.; Welch, D.J. Genetic population structure of grey mackerel Scomberomorus semifasciatus in northern Australia. J. Fish Biol. 2011, 79, 633–661. [Google Scholar] [PubMed]
  6. Da Cunha, D.B.; Rodrigues-Filho LF, S.; de Luna Sales, J.B.; Rêgo, P.; Queiroz, C.; Sampaio, I.; Vallinoto, M. Molecular inferences on Scomberomorus brasiliensis, from the Western South Atlantic, based on two mitochondrial genes. Front. Mar. Sci. 2020, 7, 558902. [Google Scholar]
  7. López, M.D.; Alcocer, M.U.; Jaimes, P.D. Phylogeography and historical demography of the Pacific Sierra mackerel (Scomberomorus sierra) in the Eastern Pacific. BMC Genet. 2010, 11, 34. [Google Scholar]
  8. Milá, B.; Van Tassell, J.L.; Calderón, J.A.; Rüber, L.; Zardoya, R. Cryptic Lineage Divergence in Marine Environments: Genetic Differentiation at Multiple Spatial and Temporal Scales in the Widespread Intertidal Goby Gobiosoma Bosc. Ecol. Evol. 2017, 7, 5514–5523. [Google Scholar]
  9. Santa Brígida, E.L.; Cunha, D.B.D.; Rego, P.S.D.; Sampaio, I.; Schneider, H.; Vallinoto, M. Population Analysis of Scomberomorus Cavalla (Cuvie) (Perciformes, Scombridae) From the Northern and Northeastern Coast of Brazil. Braz. J. Biol. 2007, 67, 919–924. [Google Scholar]
  10. Abedi, E.; Mohammadi, M.; Qasemi, A. Genetic Stock Structure of Scomberomorus Guttatus Using Microsatellite Markers in the Persian Gulf. J. Oceanogr. 2011, 2, 15–21. [Google Scholar]
  11. Takeyama, H.; Chow, S.; Tsuzuki, H.; Matunaga, T. Mitochondrial DNA sequence variation within and between tuna Thunnus species and its application to species identification. J. Fish Biol. 2001, 58, 1646–1657. [Google Scholar]
  12. Chow, S.; Nohara, K.; Tanabe, T.; Itoh, T.; Tsuji, S.; Nishikawa, Y.; Uyeyanagi, S.; Uchikawa, K. Genetic and morphological identification of larval and small juvenile tunas (Pisces: Scombridae) caught by a mid-water trawl in the western Pacific. Bull.-Fish. Res. Agency Jpn. 2003, 8, 1–14. [Google Scholar]
  13. Huang, H.; Cheng, Q.; Zheng, J. New identification methods for three Scombridae fishes based on morphological and molecular markers. MarineFisheries 2011, 33, 297–303. [Google Scholar]
  14. Inoue, J.G.; Miya, M.; Tsukamoto, K.; Nishida, M. A mitogenomic perspective on the basal teleostean phylogeny: Resolving higher-level relationships with longer DNA sequences. Mol. Phylogenetics Evol. 2001, 20, 275–285. [Google Scholar]
  15. Harrison, R.G. Animal mitochondrial DNA as a genetic marker in population and evolutionary biology. Trends Ecol. Evol. 1989, 4, 6–11. [Google Scholar] [PubMed]
  16. Boore, J.L. Animal mitochondrial genomes. Nucleic Acids Res. 1999, 27, 1767–1780. [Google Scholar]
  17. Liu, Y.; Hu, J.; Ning, Z.; Xiao, P.; Yang, T. Mitochondrial genome sequence characteristics and phylogenetic analysis of Schizothorax argentatus. Chin. J. Biotechnol. 2023, 39, 2965–2985. [Google Scholar]
  18. Liu, S.F.; Wu, R.X.; Zhu, L.; Zhuang, Z.M. Complete Sequence and Gene Organization of Mitochondrial DNA of The Small Yellow Croaker Larimichthys polyactis. Oceanol. Limnol. Sin. 2010, 41, 885–894. [Google Scholar]
  19. Liang, Y.; Zhang, G.; Chen, C.; Zhao, X.; Gao, N.; Li, J.; Fang, T.; Yang, K.; Yin, F.; Guo, W. Complete mitochondrial genome sequencing and phylogeny analysis of goby (Taenioides cirratus). J. Dalian Ocean. Unive Rsity 2023, 38, 772–778. [Google Scholar]
  20. Li, Z.; Li, C.; Kong, L.; Bao, C.; He, C.; Jin, W.; Chen, X. Mitochondrial genome structure and phylogenetic analysis oftriploid rainbow trout. J. Northwest AF Univ. (Nat. Sci. Ed.) 2023, 51, 9–17+28. [Google Scholar]
  21. Dierckxsens, N.; Mardulyn, P.; Smits, G. NOVOPlasty: De novo assembly of organelle genomes from whole genome data. Nucleic Acids Res. 2017, 45, e18. [Google Scholar]
  22. Lowe, T.M.; Chan, P.P. tRNAscan-SE on-line: Integrating search and context for analysis of transfer RNA genes. Nucleic Acids Res. 2016, 44, W54–W57. [Google Scholar]
  23. Kumar, S.; Nei, M.; Dudley, J.; Tamura, K. MEGA: A biologist-centric software for evolutionary analysis of DNA and protein sequences. Brief. Bioinform. 2008, 9, 299–306. [Google Scholar]
  24. Tomita, K.; Ueda, T.; Watanabe, K. RNA editing in the acceptor stem of squid mitochondrial tRNATyr. Nucleic Acids Res. 1996, 24, 4987–4991. [Google Scholar] [PubMed]
  25. Liu, H. Structure and Evolution of the Mitochondrial DNA Control Region in Fishes: A Case Study of Rhodeus ocellatus. Adv. Nat. Sci. 2002, 3, 44–48. [Google Scholar]
  26. Lee, W.J.; Conroy, J.; Howell, W.H.; Kocher, T.D. Structure and evolution of teleost mitochondrial control regions. Mol. Evol. 1995, 41, 54–66. [Google Scholar]
  27. Zeng, Q.; Liu, H. Study on mitochondrial DNA control region of the Ictiobus cyprinellus. J. Hubei Univ. Nat. Sci. Ed. 2001, 23, 261–264. [Google Scholar]
  28. Lee, W.J.; Kocher, T.D. Complete sequence of a sea lamprey (Petromyzonmarinus) mitochondrial genome: Early establishment of the vertebrate genome organization. Genetics 1995, 139, 873–887. [Google Scholar]
  29. Zhong, D.; Zhao, G.; Zhang, Z.S.; Xun, A.L. Advance in the Entire Balance and Local Unbalance of Base Distribution in Genome. Hereditas 2002, 24, 351–355. [Google Scholar]
  30. Frank, A.C.; Lobry, J.R. Asymmetric substitution patterns: A review of possible underlying mutational or selective mechanisms. Gene 1999, 238, 65–77. [Google Scholar]
  31. Li, Y. Determination and Molecular Evolution Analysis of Mitochondrial Genomes of Three Species of Schizothoracine Fishes from the Qinghai-Tibetan Plateau. Ph.D. Thesis, Fudan University, Shanghai, China, 2012. [Google Scholar]
  32. Bao, M. The Staructure Analysis of Complete Mitochondrial Genome and Development of Microsatellite Markers for Schizothorax pseudaksaieusis; Huazhong Agricultural University: Wuhan, China, 2015. [Google Scholar]
  33. Miya, M.; Sato, Y.; Fukunaga, T.; Sado, T.; Poulsen, J.Y.; Sato, K.; Minamoto, T.; Yamamoto, S.; Yamanaka, H.; Araki, H.; et al. MiFish, a set of universal PCR primers for metabarcoding environmental DNA from fishes: Detection of more than 230 subtropical marine species. R. Soc. Open Sci. 2015, 2, 150088. [Google Scholar]
  34. Lian, Z.Q.; Gun, S.B.; Li, L.; Zhang, F.; Xiao, W.; Wu, X.D. Sequencing and Analysis of The Complete Mitochondrial Genome of Silurus Lanzhouensis Based on Next Generation Sequencing Technologies. Acta Hydrobiol. Sin. 2017, 41, 334–345. [Google Scholar]
  35. Lynch, M. Mutation accumulation in nuclear, organelle, and prokaryotic transfer RNA genes. Mol. Biol. Evol. 1997, 14, 914–925. [Google Scholar]
  36. Xiao, W.; Zhang, Y. Genetics and evolution of mitochondrial DNA in fish. Acta Hydrobiol. Sin. 2000, 24, 384–391. [Google Scholar] [CrossRef]
  37. Liu, H.; Yu, L.; Zhang, F. Molecular Structure and Application Progress of Fish Mitochondrial DNA Control Region. Water Conserv. Fish. 2008, 28, 4–8. [Google Scholar]
  38. Qiu, F.; Su, Y.; Fu, M.; Wang, J. Molecular phylogenetic analysis in Scombridae based on Cytb and ITS1 fragment sequences. J. Fish. Sci. China 2010, 17, 201–211. [Google Scholar]
  39. Qiu, F. Genetic Diversity of Western Pacific Bluefin Tuna and Yellowfin Tuna and Molecular Systematics of Scombridae; Xiamen University: Xiamen, China, 2009. [Google Scholar]
  40. Miya, M.; Takeshima, H.; Endo, H.; Ishiguro, N.B.; Inoue, J.G.; Mukai, T.; Satoh, T.P.; Yamaguchi, M.; Kawaguchi, A.; Mabuchi, K. Major patterns of higher teleostean phylogenies: A new perspective based on 100 complete mitochondrial DNA sequences. Mol. Phylogenetics Evol. 2003, 26, 121–138. [Google Scholar] [CrossRef]
  41. Chen, Y. Phylogenetic Study of Scombridae Fishes and Molecular Phylogeography of Katsuwonus Pelamis Inferred from Mitochondrial DNA; Shanghai Ocean University: Shanghai, China, 2014. [Google Scholar]
  42. Jeena, N.S.; Rahuman, S.; Roul, S.K.; Azeez, P.A.; Vinothkumar, R.; Manas, H.M.; Nesnas, E.A.; Rathinam, A.M.M.; Surya, S.; Rohit, P. Resolved and redeemed: A new fleck to the evolutionary divergence in the genus Scomberomorus Lacepède, 1801 (Scombridae) with cryptic speciation. Front. Mar. Sci. 2022, 9, 888463. [Google Scholar] [CrossRef]
Figure 1. Mitochondrial Genome Structure of S. guttatus (A) and S. commerson (B).
Biomolecules 15 00555 g001
Figure 2. The distribution of biases in protein-coding genes of the mitochondrial genomes of S. guttatus (A) and S. commerson (B).
Biomolecules 15 00555 g002
Figure 3. Amino acid types and quantities in protein-coding genes of S. guttatus (A) and S. commerson (B).
Biomolecules 15 00555 g003
Figure 4. Predicted secondary structures of the 22 tRNAs in S. guttatus (A) and S. commerson (B) mitochondrial genomes.
Biomolecules 15 00555 g004aBiomolecules 15 00555 g004b
Figure 5. The analysis of the mitochondrial D-loop structure components in S. guttatus and S. commerson.
Biomolecules 15 00555 g005
Figure 6. Molecular phylogenetic trees based on concatenated sequences of 12 PCGs constructed using NJ (A) and ML (B) methods.
Biomolecules 15 00555 g006
Table 1. The mitochondrial genome information of scombroid fishes used for constructing phylogenetic trees.
GeneraSpeciesGenBank ID
AuxisAuxis rocheiNC_005313
Auxis thazardNC_005318
EuthynnusEuthynnus alletteratusNC_004530
Euthynnus affinisAP012946.1
GasterochismaGasterochisma melampusHQ425781
KatsuwonusKatsuwonus pelamisNC_005316
RastrelligerRastrelliger brachysomaNC_013485
Rastrelliger kanagurtaJX524134
ScomberScomber australasicusNC_013725
Scomber coliasNC_013724
Scomber japonicusNC_013723
Scomber scombrusNC_006398
ScomberomorusScomberomorus cavallaDQ536428.1
Scomberomorus niphoniusNC_016420
Scomberomorus concolorKX925518.1
Scomberomorus guttatusthis study
Scomberomorus commersonthis study
Scomberomorus maculatusOP056995.2
Scomberomorus munroiNC_021390.1
Scomberomorus semifasciatusNC_021391.1
Scomberomorus sierraKX925517.1
ThunnusThunnus alalungaNC_005317
Thunnus albacaresNC_014061
Thunnus atlanticusNC_025519.1
Thunnus maccoyiiNC_014101
Thunnus obesusNC_014059
Thunnus orientalisNC_008455
Thunnus thynnusNC_014052
Thunnus tonggolHQ425780
AcanthocybiumAcanthocybium solandriNC_067731.1
SardaSarda orientalisAP012949.1
GymnosardaGymnosarda unicolorAP012510.1
Table 2. Composition of the mitochondrial genome sequences of S. guttatus (S.g) and S. commerson (S.c).
SequencePositionLengthStart CodonStop CodonSpacing Nucleotide CountCoding Strand
S.gS.cS.gS.cS.gS.cS.gS.cS.gS.cS.gS.c
Cytb1–1141-1141-ATGT---4-H
tRNA-Thr1142–12151142–12137472 0-H
tRNA-Pro1215–12841213–128270- −1-L
D-loop1285–21411283–2137857855 0-H
tRNA-Phe2142–22092138–220568- 0-H
s-rRNA2210–31762206–3162967957 0-H
tRNA-Val3177–32483163–323472- 0-H
l-rRNA3249–49453235–492716971693 0-H
tRNA-Leu4946–50194928–500174- 0-H
ND15020–59945002–5976975-ATGTAA-0-H
tRNA-Ile5999–60695981–605171- 4-H
tRNA-Gln6069–61396051–612171- −1-L
tRNA-Met6139–62076121–618969- −1-H
ND26208–72536190–72351046-ATGTA--0-H
tRNA-Trp7254–73267236–730873- 0-H
tRNA-Ala7328–73967310–737869- 1-L
tRNA-Asn7398–74707380–745273- 1-L
OL(rep_origin)7471–75037453–74863334 0-H
tRNA-Cys7504–75697487–755266- 0-L
tRNA-Tyr7570–76367553–76206768 0-L
COI7638–91857622–918115481560GTGAGAAGG1-H
tRNA-Ser9188–92599173–924472- 2−9L
tRNA-Asp9263–93359248–932073- 3-H
COII9344–10,0349329–10,019691-ATGT---8-H
tRNA-Lys10,035–10,10810,020–10,09374- 0-H
ATP810,110–10,27710,095–10,262168-ATGTAA-1-H
ATP610,268–10,95110,253–10,936684-ATGTAA-−10-H
COIII10,971–11,75510,955–11,739785-ATGTA--1918H
tRNA-Gly11,756–11,82711,740–11,81172- 0-H
ND311,828–12,17611,812–12,160349-ATGT---0-H
tRNA-Arg12,177–12,24512,161–12,22969- 0-H
ND4L12,246–12,54212,230–12,526297-ATGTAA-0-H
ND412,536–13,91612,520–13,9001381-ATGT---−7-H
tRNA-His13,917–13,98713,901–13,9707170 0-H
tRNA-Ser13,988–14,05513,971–14,03868- 0-H
tRNA-Leu14,060–14,13214,043–14,11573- 4-H
ND514,133–15,97114,116–15,9541839-ATGTAA-0-H
ND615,968–16,48915,951–16,472522-ATGTAATAG−4-L
tRNA-Glu16,490–16,55816,473–16,54169- 0-L
Table 3. Base composition of gene segments in S. guttatus and S. commerson.
SequenceA%T%G%C%A + T%G + C%Total
S.gS.cS.gS.cS.gS.cS.gS.cS.gS.cS.gS.cS.gS.c
mtDNA complete sequence28.528.126.625.31616.228.930.355.153.544.946.516,56216,545
Protein-coding genes26.225.728.627.115.315.629.931.654.852.845.247.311,42611,438
tRNA genes27.52727.226.923.724.421.621.754.753.945.34615581556
rRNA gene31.332.222.521.521.12125.125.353.853.746.246.326642650
Control region32.231.130.932.11614.920.92263.163.136.936.8857855
PS: S.g: S. guttatus. S.c: S. commerson.
Disclaimer/Publisher’s Note: The statements, opinions and data contained in all publications are solely those of the individual author(s) and contributor(s) and not of MDPI and/or the editor(s). MDPI and/or the editor(s) disclaim responsibility for any injury to people or property resulting from any ideas, methods, instructions or products referred to in the content.

