Abstract
Advances in unmanned aircraft systems (UAS) have paved the way for progressively higher levels of intelligence and autonomy, supporting new modes of operation, such as the one-to-many (OTM) concept, where a single human operator is responsible for monitoring and coordinating the tasks of multiple unmanned aerial vehicles (UAVs). This paper presents the development and evaluation of cognitive human-machine interfaces and interactions (CHMI2) supporting adaptive automation in OTM applications. A CHMI2 system comprises a network of neurophysiological sensors and machine-learning based models for inferring user cognitive states, as well as the adaptation engine containing a set of transition logics for control/display functions and discrete autonomy levels. Models of the user’s cognitive states are trained on past performance and neurophysiological data during an offline calibration phase, and subsequently used in the online adaptation phase for real-time inference of these cognitive states. To investigate adaptive automation in OTM applications, a scenario involving bushfire detection was developed where a single human operator is responsible for tasking multiple UAV platforms to search for and localize bushfires over a wide area. We present the architecture and design of the UAS simulation environment that was developed, together with various human-machine interface (HMI) formats and functions, to evaluate the CHMI2 system’s feasibility through human-in-the-loop (HITL) experiments. The CHMI2 module was subsequently integrated into the simulation environment, providing the sensing, inference, and adaptation capabilities needed to realise adaptive automation. HITL experiments were performed to verify the CHMI2 module’s functionalities in the offline calibration and online adaptation phases. In particular, results from the online adaptation phase showed that the system was able to support real-time inference and human-machine interface and interaction (HMI2) adaptation. However, the accuracy of the inferred workload was variable across the different participants (with a root mean squared error (RMSE) ranging from 0.2 to 0.6), partly due to the reduced number of neurophysiological features available as real-time inputs and also due to limited training stages in the offline calibration phase. To improve the performance of the system, future work will investigate the use of alternative machine learning techniques, additional neurophysiological input features, and a more extensive training stage.
Keywords:
aerial robotics; autonomous systems; avionics; unmanned aircraft system; unmanned aerial vehicle; remote pilot; human-in-the-loop; human-machine system; human-machine interface; human-machine interaction; human-robot interactions; mental workload; neurophysiology; neuroergonomics; neurophysiological response; cyber-physical systems 1. Introduction
In recent decades, advances in remote sensing as well as developments in system automation and human-machine interfaces (HMI) have been supporting new unmanned aircraft systems (UAS) operational concepts. The term UAS here refers to the combination of the unmanned aerial vehicles (UAVs) and ground control stations. Multi-UAV operations, characterized by the control of multiple UAVs by a centralized system comprising one or multiple human operators, have emerged as a topic of interest. Multi-UAV technology has the potential to bring about a paradigm shift in current UAV operations by offering a myriad of new operational possibilities in terms of mission and aircraft design, leading to enhanced operational safety, efficiency, and effectiveness [1,2]. Novel algorithms, frameworks, and systems are being conceived, and the implementation of these concepts will in turn drive the adoption of higher levels of automation and autonomy to support such an operational shift [3,4,5]. As a result, the responsibilities of human operators are expected to take on a more supervisory nature, overseeing and managing groups of UAV as a whole rather than controlling individual units [6,7,8]. Additionally, it is envisaged that advanced systems possessing high levels of autonomy would act as independent agents, teaming up with human operators to achieve common objectives. From a human factors perspective, one of the key enablers for achieving higher levels of autonomy is the use of adaptive automation, allowing systems to dynamically sense and infer the needs of the human operator, while adjusting their levels of automation to achieve a complementary distribution of task load among the human-machine team.
To support the implementation of adaptive automation in aerospace systems, the concept of cognitive human-machine interfaces and interactions (CHMI2) had been previously proposed by the authors, revolving around closed-loop human-machine systems that sense and adapt to the human operator’s cognitive states. In this paper, the CHMI2 concept is applied to investigate the use of adaptative automation in a one-to-many (OTM) UAS in a bushfire detection scenario, where a single human operator is responsible for coordinating multiple UAV platforms to search for and localize bushfires over a large area. The paper presents the mission design and concept of operations (CONOPS), along with the system implementation and an overview of the associated HMI functionality. Preliminary results from the human-in-the-loop (HITL) evaluation activities are also presented, focusing on the offline training of the operator cognitive model in the CHMI2 system, as well as the use of the model to drive online adaptation of the automation levels in system functions.
1.1. Background and Research Objectives
A growing interest in multi-UAV research has led to the development of several notable multi-UAV simulator testbeds over the last decade [9,10,11,12,13]. These simulator testbeds have been used in multi-UAV human factors research across different applications, ranging from sense-and-avoid [14,15] to disaster response [16] and defence [17,18,19]. The research focus of these testbeds has been on evaluating the HMI suitability for a specific CONOPS or application, with limited scope on the neuroergonomics aspects. While neuroergonomics has been studied in the context of air traffic control (ATC) [20,21] and piloting [22,23,24] tasks, there has been limited research in the UAV or multi-UAV domains. There is a common purpose underlying the study of neuroergonomics in these domains: to support the real-time inference of the human operators’ cognitive state, in turn driving the development of adaptive automation needed for more autonomous operations. The objectives of this research are as follows:
- Develop a CHMI2 framework to support adaptive automation in aerospace applications.
- Implement the CHMI2 framework as a system comprising the CHMI2 module, sensor network, and HMI front-end.
- Verify the CHMI2 proof-of-concept within a lab environment through HITL evaluations in a realistic multi-UAV scenario.
- Explore possible applications of the CHMI2 framework to the piloting, air traffic management (ATM), UAS traffic management (UTM), and space traffic management (STM) domains.
1.2. CHMI2 Framework
Research in human-machine interfaces and interaction (HMI2), particularly for advanced aerospace systems [25], has progressively evolved towards enhancing human-machine teaming and overall system performance. One aspect of this research focuses on tailoring the system automation to support human operators, especially in complex and safety-critical operations. When performing complex tasks, an inadequate response of these highly automated systems may further increase the scenario complexity and task load for human operators, leading to high mental workload and distrust. To mitigate such situations, a careful consideration of human engagement is required when defining the system response. A potential solution is in the development of systems supporting human cognitive state monitoring/enhancement, which can prevent cognitive overload (or underload) and unintentional omission while supporting increased levels of autonomy in decision support systems [26,27,28,29,30,31]. Our research efforts therefore focus on developing CHMI2 to monitor the cognitive load of human operators and provide appropriate automation support in time-critical and complex missions [32].
The CHMI2 concept is an advanced cyber-physical system (CPS) that is built upon a seamless integration of physical and computational components while also integrating human-machine feedback at the highest level. The overall CHMI2 framework accounts for human operator cognitive states together with relevant operational and environmental observables when modulating the system automation support, as illustrated in Figure 1. The concept is initially detailed in [30,32] describing the foundation of the CHMI2 with three important modules:
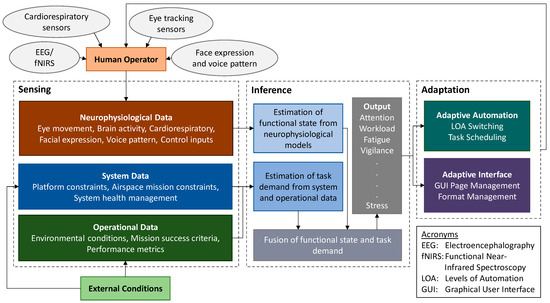
Figure 1.
CHMI2 framework for sensing, inferencing, and adapting to cognitive states.
- Sensing—this module tracks both human and system environment aspects. For the human side, a variety of both remote and wearable neurophysiological sensors are exploited to monitor the neurophysiological parameters of operators in real time, along with control inputs from human operators. The system’s environmental sensing comprises of the system and operational data which are collected in real time;
- Inference—the system and operational data are sent to the inference module to track the current task load/performance, which is then mapped onto the processed neurophysiological responses through a machine learning algorithm. These two inputs are then used to infer and predict the human cognitive states as the outputs of this module (e.g., mental workload and attention); and
- Adaptation—system automation level and HMI2 formats and functions are dynamically driven by the predicted cognitive states from the inference module. The changes from the adaptation module are then presented back to the human operator via front-end display.
To define the adaptation logic, specific mission tasks are first defined along with the relevant cognitive states that are affected when performing such tasks (e.g., workload, attention, situational awareness), as well as the neurophysiological observables required to infer the user’s cognitive states. As individuals have different neurophysiological responses to external stimuli, an offline calibration phase is required to train the cognitive models used in the inference module before they are deployed for real-time prediction and adaptation [33]. In this phase, user-specific neurophysiological and task performance data from previous runs (with each run typically lasting a half-hour to an hour) are used to calibrate the cognitive model. To enhance the accuracy and reliability of the cognitive state’s estimation, multiple neurophysiological parameters are monitored since they are complex phenomena [34]; each parameter has a different response rate and is affected by various disturbances. A well-designed sensor network is implemented in the CHMI2 sensing and inference module to optimize the usage of multiple neurophysiological sensors and increase the data fusion efficiency for improved overall inference accuracy. A detailed description of the neurophysiological sensor network used in our CHMI2 is provided in [28].
1.3. Article Structure
The remainder of the paper is structured as follows: Section 2 presents the system architecture of the OTM simulator, along with the HMI2 design elements of the ground control station (GCS). The bushfire fighting scenario is subsequently presented in Section 3, and the experimental evaluation of the CHMI2 system’s offline calibration and online adaptation phases are presented in Section 4. Section 5 presents a discussion of the experimental results, and the conclusion is provided in Section 6.
2. UAS Simulation Environment
This section presents the simulation environment used for evaluating the CHMI2 system in a multi-UAV context. The environment is implemented in Javascript and utilizes a server-client architecture (Figure 2), where the simulation engine is hosted on a centralized server which communicates with browser-based clients serving as the user interface (UI) for the GCS.
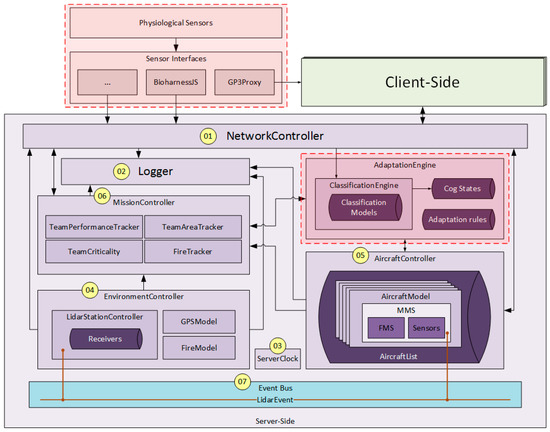
Figure 2.
Architecture of the server-side simulation environment, with the core CHMI2 components outlined in red dashed lines.
The simulation engine hosted by the server contains the aircraft and environment models and also acts as a centralized node for data processing, storage, and logging. Table 1 provides further descriptions of the functionalities associated with the main server components.

Table 1.
Main components of the server.
Clients (Figure 3) serve as the simulation UI, performing the GCS functions of visualizing, planning, and coordinating UAV tasks. The “base” interface consists of a tactical map built on CesiumJS, a popular open-source library typically used for dynamic 3D geospatial visualization and mapping applications.
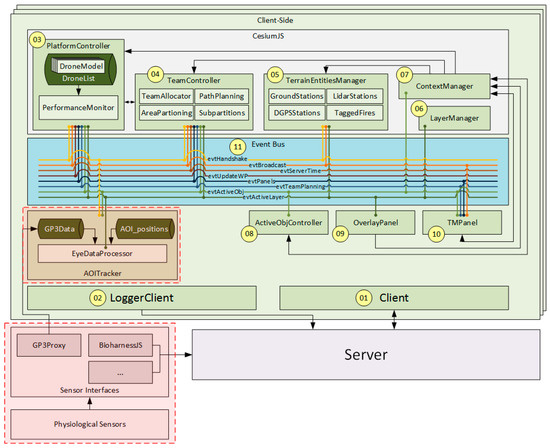
Figure 3.
Architecture of the client-side simulation environment, with the core CHMI2 components outlined in red dashed lines.
Additional modules extend the capabilities of this base tactical map by providing path-planning, sensor usage, and platform management capabilities, as well as allowing for the visualization of mission-related metrics. Further details of the functionalities of the main software modules are provided in Table 2.
Table 2.
Main components of the client.
In addition to server and client components, core CHMI2 modules are also included in the system architectures shown in Figure 2 and Figure 3. These modules, outlined in red, are used to provide adaptive automation based on a sensing of the user’s neurophysiological state and are designed to be easily integrated with other applications outside of the multi-UAV case. The CHMI2 modules include:
- Various neurophysiological sensors, which comprise the hardware components used to obtain neurophysiological measurables.
- Sensor interfaces, which comprise the software components for interfacing the sensors with the CHMI2 ClassificationEngine module. The sensor interface typically contains some pre-processing and feature extraction functionalities to reduce the computational load of the ClassificationEngine. For example, the eye tracking interface contains a proxy and a processor. The proxy forwards raw sensor data to the processor, which is integrated into the client-side module in order to keep track of dynamically changing areas of interest (AOI) and to also provide gaze-based UI functionalities. On the other hand, the cardiorespiratory interface is a standalone module that takes in raw data, extracts relevant features from the data, and passes these features to the ClassificationEngine.
- AdaptationEngine, which is integrated in the server-side and comprises the ClassificationEngine that estimates the user’s cognitive states from the extracted neurophysiological features, and the actual adaptation logics to infer the automation level from a combination of the estimated cognitive states and other operational or mission inputs. The automation level is then passed to the relevant modules in the server, which in this case could be either MissionController or AircraftController.
2.1. HMI Formats and Functions
This section presents a number of key HMI elements used in the multi-UAV GCS which provide vital information and automation support for successfully executing the mission. The HMI elements include glyphs, panels, and support in the form of automated functions. The CHMI2 adapts these elements by changing the visual appearance of information sources or the level of automation of the automation support.
2.1.1. Glyphs
Glyphs are used to provide a pictorial representation of different categories of information. They are located below the UAV icons on the tactical map and are only visible when a UAV is selected or upon mouse-over of a UAV. Glyphs are color-coded to indicate the health/performance/status of the specified system/task. The standard coloring convention is followed: green represents an active/good flag, amber represents a caution flag, and red represents a warning flag. Glyphs with on/off status are color-coded with a green/gray scheme respectively. Right mouse clicking on a glyph also brings up different context menus with options that are relevant to the glyph. Table 3 provides a brief description of the different glyphs.
Table 3.
Glyphs and the information associated with each glyph type.
2.1.2. Team Management Panel (TM Panel)
The Team Management (TM) Panel supports team and individual platform management by providing essential information on UAV teams, tasks, task progress, and platform system status. A UAV team is defined as two or more UAVs that are controlled together as a group, but do not necessarily have to be of the same type (e.g., in terms of sensor equipage) or perform the same task. The panel is located at the left side of the tactical map and as shown in Figure 4, is divided into two panes allowing the user to drill down to different levels of information. The top pane is the Summary Panel providing a summary of groups of entities while the bottom pane is the Info Panel providing more detailed information on the selected entity.
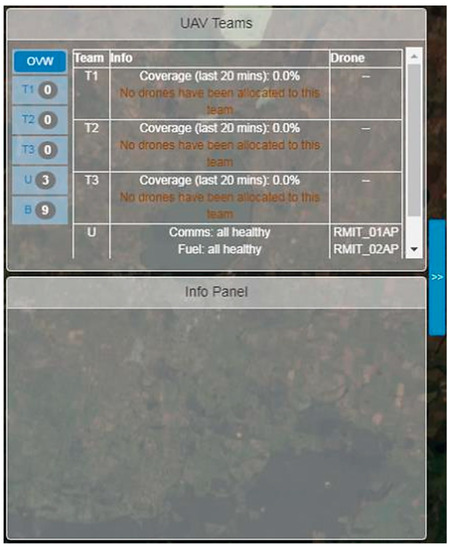
Figure 4.
Team Management Panel containing the Summary Panel (top) and Info Panel (bottom).
The Summary Panel provides summary-level information on UAV teams and individual UAV platforms. A group of tabs on the left side of the panel allows cycling through different pages in the panel, comprising the overview page (selected through the OVW tab), individual team page (selected through the T1/T2/T3 tab), unassigned page (selected through the U tab), and base page (selected through the B tab). The overview page provides a summary of all UAV teams, including any team-level cautions and warnings. Selecting a team or UAV on this page will bring up additional details of the team of UAV in the Info Panel. The individual team page, unassigned page, and base page provide a more detailed overview of UAV within the selected group—either platforms within one of the teams, platforms which have not been assigned a team, or platforms that are stationed in the base and have not been deployed. The page displays a summary of information on the task and system performance of each UAV corresponding to the selected group. When a team tab is selected, further details of the team will be displayed on the Info Panel.
The Info Panel is composed of two modes, either the Team Info Panel or the UAV Info Panel, and provides more detailed UAV team or platform information to support the management of team or platform-level automation modes. The Team Info Panel allows the user to control the level of automation for the team-level automation support and allows for toggling between different views on the map. Two types of automation support are available, comprising resource allocation and path planning. The area morphing functionality shown in the figure had not been developed at the time of the experiment and is thus not discussed in this paper. Three automation modes (manual, prompt, and automated) are associated with each support functionality, with further details presented in the “adaption elements” subsection towards the end of this section. The Team Info Panel also allows switching between trajectory and subpartition views, as illustrated in Figure 5. The trajectory view shows the planned paths of all drones in the selected team while the subpartition view shows the partitions within the team area, where each partition can be assigned to an individual UAV platform, and also allows the partitions to be modified.
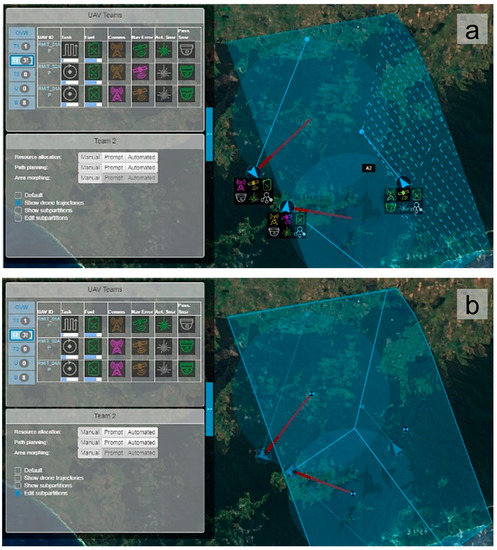
Figure 5.
Different view modes accessible via the Team Info Panel (the lower panel in the team management (TM) Panel): (a) trajectory view and (b) subpartition editing view.
The UAV Info Panel provides additional details on UAV system health, supports control of sensors and systems, and allows the management of UAV automation modes. The panel is displayed when a UAV platform is selected, either by left-clicking on the platform on the tactical map or by clicking on the UAV via the Summary Panel. The UAV Info Panel is shown in Figure 6 and comprises several pages, which are displayed by clicking on the appropriate tab on the left side of the panel. These include a systems overview page (via the SYS tab), UAV trajectory page (via the TRAJ tab), navigation systems page (via the NAV tab), sky-plot page (via the SKYPLT tab), communication systems page (via the COMMS tab), and sensor system page (via the IR/VIS/LID tab). Each page provides detailed information on the given system, along with controls for the system, where available. Additionally, switching to a particular page would trigger visual changes in the tactical map to display information relevant to the given system.
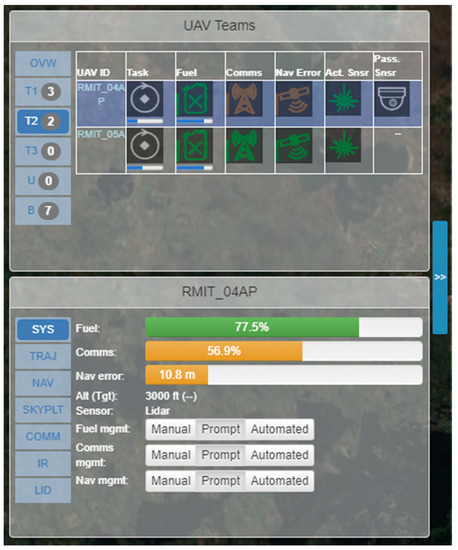
Figure 6.
TM Panel with Summary Panel above and the unmanned aerial vehicle (UAV) Info Panel below.
2.1.3. UAV Tasking
Due to the dynamic nature of the mission, the command and control of UAV platforms in this scenario relies heavily on tactical planning and ad hoc re-tasking. UAV platforms are able to change operational modes depending on the type of assigned task. The different modes include:
- Guided, where the UAV is tasked with flying along a given set of waypoints.
- Line Search, an extension of the Guided mode in which the UAV searches a given area using its visual sensor by flying along a predetermined search path.
- Tracking, where the UAV maps the CO2 concentration of a given area by firing intermittent Lidar pulses towards a ground receiver. The strength of each Lidar pulse can be used to determine the column CO2 concentration.
- Hold, where the UAV is tasked to hold at its current position. A UAV that has completed its assigned trajectory (either under the Guided or Line Search mode) will automatically enter the Hold mode.
- Monitor Fire, where a UAV is tasked with holding over a fixed location while activating its visual sensor.
- Return to Base, where the UAV is tasked to return to a launch base for refueling/recharging.
2.2. Remote Pilot Tasks
As shown in Table 4, remote pilots are required to perform the primary search task along with secondary system management tasks to maintain acceptable performance of various on-board systems. In addition to the sensors, the three systems being simulated in this mission are the navigation, communication, and fuel/battery systems.
Table 4.
Remote pilot tasks and associated user interface (UI) components.
2.2.1. Navigation
The remote pilot is required to monitor the navigation accuracy using the NAV page (Figure 7) to ensure that it is kept within operational range during the mission. The navigation accuracy is derived from the best value from 3 separate navigation sources: global positioning system (GPS), differential GPS (DGPS), and relayed DGPS. GPS refers to the accuracy obtained from GPS satellites, and can degrade due to masking effects based on the orientation of the aircraft. DGPS utilizes differential corrections which are broadcast by ground stations to improve the positioning accuracy obtained through GPS. Relayed DGPS uses proximate UAV platforms to relay these corrections to other platforms, effectively extending the broadcast range of the DGPS ground stations. Real time kinematics (RTK) is another well-established technique for improving positioning precision, and the implementation of such a module can be considered in future versions of the simulation environment
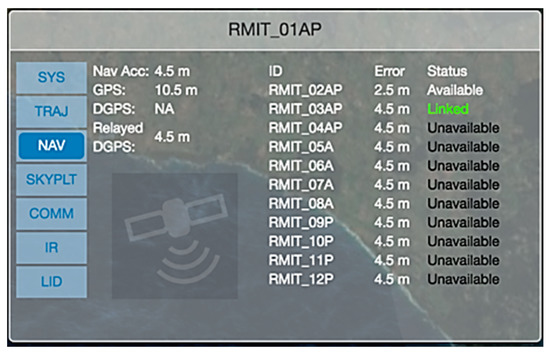
Figure 7.
The NAV page in the UAV Info Panel showing the accuracy of different navigation sources and the navigation status of other UAV platforms.
For the scenario, a GPS accuracy of approximately 10 m can be obtained without differential corrections, while differential corrections can further improve the accuracy up to 2.5 m. These corrections are broadcast by differential GPS (DGPS) stations within the area of responsibility (AOR). DGPS stations are co-located with a number of ground Lidar stations within the AOR and as shown in Figure 8, appear as a  symbol surrounded by two co-centric rings. The inner ring represents the communication range of the station, typically 8 km. Aircraft within this range are able to receive differential corrections from the station and relay these corrections to other aircraft within comms range and with DGPS availability. The outer ring represents the validity range of the differential corrections, typically 40 km. The differential corrections are valid within this range, providing improved positioning accuracy for aircraft operating in the DGPS or relayed DGPS mode. Outside of the validity range, the navigation accuracy provided by the DGPS or relayed DGPS mode will degrade exponentially with distance.
symbol surrounded by two co-centric rings. The inner ring represents the communication range of the station, typically 8 km. Aircraft within this range are able to receive differential corrections from the station and relay these corrections to other aircraft within comms range and with DGPS availability. The outer ring represents the validity range of the differential corrections, typically 40 km. The differential corrections are valid within this range, providing improved positioning accuracy for aircraft operating in the DGPS or relayed DGPS mode. Outside of the validity range, the navigation accuracy provided by the DGPS or relayed DGPS mode will degrade exponentially with distance.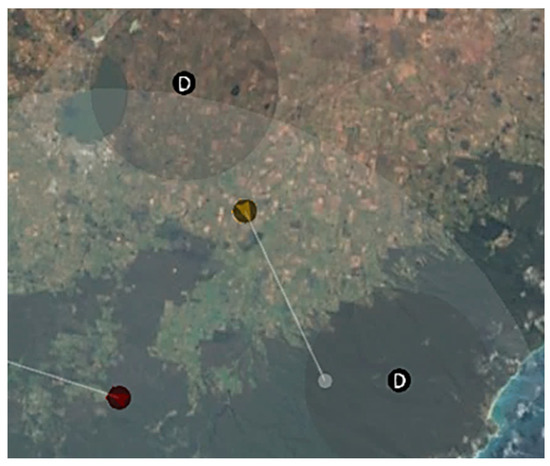
Figure 8.
Differential global positioning system (DGPS) stations within the area of responsibility (AOR).
Navigation performance is therefore maintained by having UAV loiter within the communication range of these stations while broadcasting DGPS corrections to other aircraft operating within the validity range of the station.
2.2.2. Communication
The remote pilot is required to monitor the communication link strength to ensure that excessive degradation does not occur during the mission. By default, a communication link is established directly between the UAV and the base, but this direct signal strength decreases with distance from the base. If the direct signal strength is weak, the communication link should instead be routed through other UAV platforms acting as communication relays. As shown in Figure 9, the COMM tab allows the remote pilot to view the estimated link strength of different relays. Additionally, when the COMM tab is selected, communication links are depicted on the tactical map as dashed lines, with blue dashed lines representing the communication links from upstream nodes (i.e., the UAVs which are relaying their communications through the selected platform) and the green dashed lines representing the communication links to downstream nodes (i.e., the platforms that are relaying the communications between the selected platform and the base).
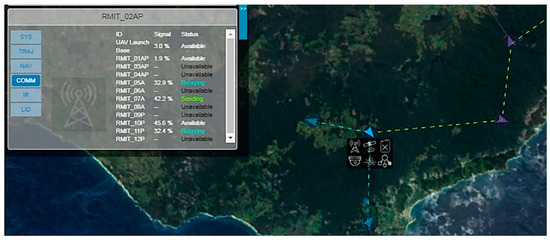
Figure 9.
Management of communication links via the COMM tab.
2.2.3. Fuel/Battery
In addition to monitoring the navigation and communication systems, the remote pilot also needs to monitor the on-board fuel/battery to ensure that the UAV has sufficient fuel/power to return to base. Fuel/power is consumed while the platform is airborne and is additionally used to power the different sensors when they are activated.
2.2.4. Sensors
Remote pilots are required to utilize on-board sensors to search the area of responsibility (AOR). In the scenario, UAV can be equipped with a combination of active sensors, passive sensors, or both active and passive sensors. UAV which are equipped with a Lidar (i.e., an active sensor) have the letter “A” appended to their callsign. UAV can use the Lidar to map the CO2 concentration around the Lidar stations within the AOR, denoted by the  symbol on the map, as shown in Figure 10. When tasked with tracking a Lidar station, the UAV circles around an assigned station while firing its Lidar towards the station at regular intervals.
symbol on the map, as shown in Figure 10. When tasked with tracking a Lidar station, the UAV circles around an assigned station while firing its Lidar towards the station at regular intervals.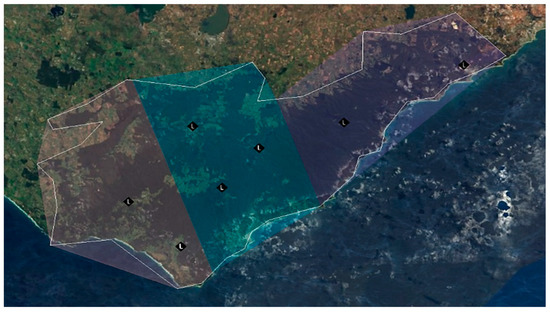
Figure 10.
Lidar Stations within the AOR.
If a fire is present within the tracking radius, the Lidar will pick up high concentrations of CO2 as shown in Figure 11. However, as seen in the figure, the sensor has poor range resolution and will not be able to discriminate the exact position of the fire. Additionally, as the Lidar needs to be on-target or within range of the station in order to take CO2 measurements, tracking results can sometimes appear spotty/incomplete.
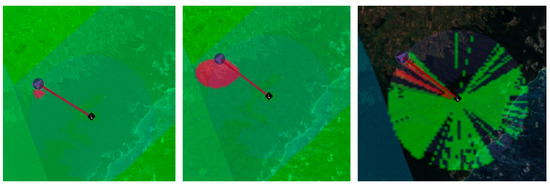
Figure 11.
Position of actual fire (left), CO2 cloud (middle), and Lidar tracking results (right).
UAV which are equipped with an IR or visual camera (i.e., a passive sensor) will have the letter “P” appended to their callsign. Unlike the Lidar, which requires a ground receiver, UAV can use the passive sensor to directly determine the presence of fires in the AOR. The sensor footprint is shown when the IR or VIS tab is selected and also upon mouse-over of the UAV icon on the map (Figure 12).
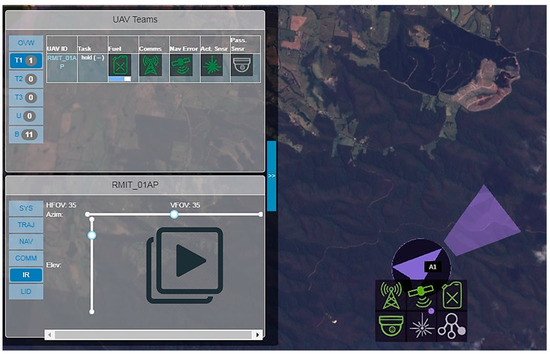
Figure 12.
Sensor tab and sensor footprint.
The passive sensor is also automatically activated when the UAV is assigned a Line Search task. Figure 13 shows a single UAV performing a Line Search within its assigned area containing two fires. The two fires are picked up by the UAV passive sensor.
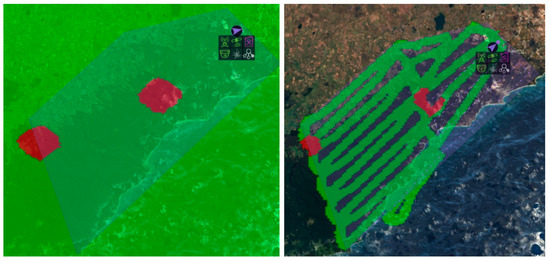
Figure 13.
Location of actual fire (left) and results of UAV Line Search (right).
2.3. Automation Elements
Two classes of automation support are available in the scenario—team-level automation and UAV-level automation. Team-level automation is used to optimize the mission by managing resource and task allocation within teams, while UAV-level automation is used for managing systems (i.e., service avionics) on-board individual UAV platforms. Two team-level support functions are available, namely resource allocation and path planning. Resource allocation is used to automate the allocation of UAVs to different teams based on their relative proximity, fuel/battery level, and the sensor composition of each UAV. Path planning is used to automate the task allocation (i.e., as defined in the UAV Tasking section) of UAVs in the specified team. The three available automation levels (manual, prompt, and automated) for each automation function are described in Table 5.
Table 5.
Automation levels for team-level automation support.
UAV-level automation support comprises functions that automate the management of the fuel/battery, communications, and navigation systems. The UAV-level automation performs health checks on the associated systems, also performing recovery actions if the system health falls below given threshold levels. Like the team-level automation, each function has three discrete levels, described in Table 6.
Table 6.
Automation levels for fuel/comm/nav management.
2.4. Adaptation Engine
The adaptation engine is illustrated in Figure 14 and comprises an automation level (AL) inference module and a state chart. The AL inference module is a fuzzy inference system (FIS) that produces as output the expected AL based on the user’s cognitive states and system performance, while the state chart translates the output of the AL inference module to actual AL transitions in the automation functions.
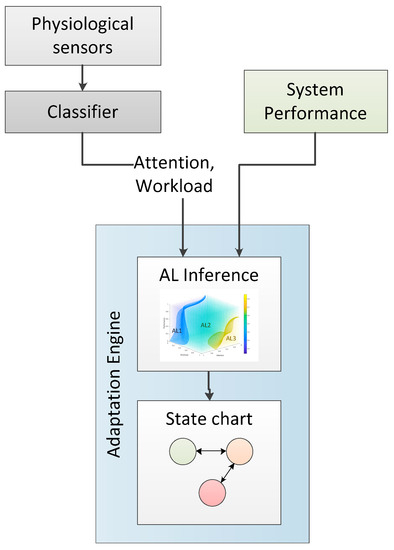
Figure 14.
Adaptation engine process.
The AL inference module is based on a FIS using a set of rules similar to those described in Table 7, taking as input the classified workload, attention, and system performance, and providing the AL as output. The ruleset presented in Table 7 was derived from expert knowledge of how a system’s automation level could vary according to the user’s workload, attention and task performance.
Table 7.
Fuzzy inference system (FIS) rules for inferring the automation level based on a combination of the user’s workload, attention, and the system performance.
The Gaussian membership function, , is used when defining the nodes (i.e., low, med, high) of each input to the interference module:
where x is the input value, and c and a are respectively the center and width of each input node. When the “not” operator is present in the antecedent, the complement of the node membership function, , is used, given by:
The output of the resulting FIS is shown in Figure 15. The raw output of the FIS, represented by the points within the three-dimensional cube, is a continuous variable varying between 0 and 1. Predefined thresholds, represented by the surfaces in the cube, allow partitioning of the output into different automation levels. The surfaces are smooth and continuous, preventing the occurrence of abrupt changes in AL.
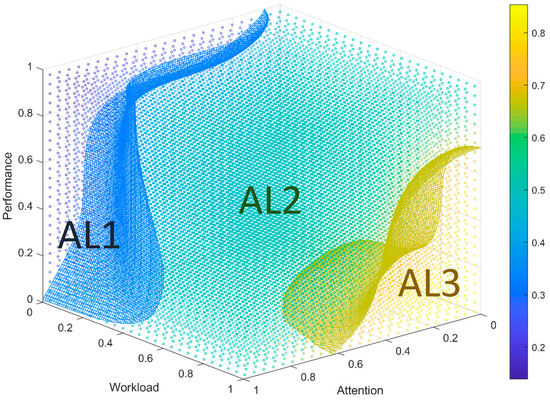
Figure 15.
FIS output.
The state chart is used to prevent sudden jumps in AL or excessive transitions within a short period of time, introducing hysteresis in the adaptation mechanism. Under low workload conditions, combined with either high attention or high performance, the system maintains the AL at AL1. With increasing workload, decreasing attention, or decreasing performance, the system increases the automation level to AL2 (prompt) before transitioning to AL3 (automated). Workload is determined by passing a combination of neurophysiological and task performance inputs into a trained adaptive neuro-fuzzy inference system (ANFIS), while attention is derived from gaze metrics, specifically based on the dwell or neglect time on a given entity. The rate of change of attention is based on the product of two factors, given as:
where is the rate of change of attention, is the attention factor, is the time factor, DT is the dwell time, and NT is the neglect time. determines the sign of such that is positive when a dwell is registered and is negative when a dwell is not registered. Additionally, also scales the magnitude of such that the rate of change is 0 when ATT is at 1 or 0. is a positive value that scales the magnitude of based on the dwell or neglect duration. These factors are given by:
A sigmoid function is used for , with the coefficients in Table 8 empirically determined such that 10 s of dwell brings ATT from 0 to approximately 0.9 and 10 s of neglect brings ATT from 1 to approximately 0.1.
Table 8.
Coefficients for determining the time factor kt.
The model was applied to determine the allocation of attention to different UAV platforms and UI components in the scenario. A desk-mounted eye tracker was used to determine the user’s gaze, which was correlated with the UAV position on the tactical map and the tabs in the TM Panel, with obtained results being similar to the graph presented in Figure 16.
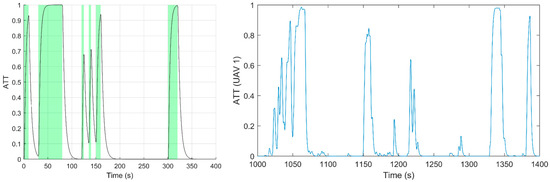
Figure 16.
Results of gaze-based attention model. Left: theoretical values; right: experimental values.
3. Multi-UAV Scenario
The concept of operations (CONOPS), experimental scenario, procedure, and participants have been previously presented and discussed [33,36,37]. In brief, participants assume the role of a remote pilot tasked with coordinating multiple UAVs in a bushfire surveillance mission. Participants are given primary and secondary mission objectives, with the primary objective focusing on maximizing the coverage of the surveillance task while the secondary objectives focus on monitoring and maintaining the on-board UAV system health. The sensor payload of each UAV comprises an active sensor (Lidar) and a passive sensor (IR). UAVs can be equipped with either one of the two sensors or both sensors, and each sensor has different range, field-of-view, and operating characteristics (e.g., the Lidar can only be used within the proximity of ground receivers scattered throughout the surveillance area). UAVs can be assigned to teams to perform coordinated search tasks over specific areas, allowing remote pilots to take advantage of team-level automated features. In planning the tasks of individual UAVs, the operator needs to account for several factors:
- The availability of sensors on the UAV platform, active (A) or passive (P). The UAV’s sensor availability is appended at the end of the its call-sign for ease of recognition (e.g., “RMIT_01AP” means that the drone is equipped with both active and passive sensors)
- The available fuel/battery on-board the UAV platform. For this mission, the UAVs have an endurance of approximately 20 min, but this endurance can be further reduced by additional factors such as the use of on-board sensors or additional communication systems. When UAVs are low on fuel/battery, they need to be sent back to base for refueling/recharging, requiring a reconfiguration of the UAV team if the specific UAV plays a central role in the team (e.g., serving as a communication node, monitoring a localized fire, etc.).
- The navigation performance. The operator is required to maintain navigation performance within specified limits. Although the effects of degraded performance on the UAV are not modelled for the purposes of this scenario, the navigation performance is included when calculating performance indices.
- The communication performance. The operator is required to maintain communication performance within specified limits. Communication performance degrades with distance from the base station. Similar to the navigation performance, the effects of degraded communication performance are not modelled in this scenario but are used in the calculation of performance indices.
It is assumed that participants allocate their main cognitive capacity to the primary task of mission planning and analyzing sensor data, while using their spare capacity for system management. As the number of UAVs in the scenario increases, the amount of monitored information also increases, along with the level of complexity associated with mission planning and task allocation. In particular, since the navigation and communication performance can be augmented by establishing relays with proximate aircraft, remote pilots would need to keep track of the relative distances between linked aircraft to maintain these relays. Due to the combinatorial nature of this task, its complexity would be expected to increase exponentially with the number of aircraft being monitored. The extent to which the secondary tasks are attended to can thus be used as an indirect indicator of the participant’s workload, since the scenario is designed to make it difficult for participants to attend to all subsystems in an overloaded situation. As such, a task index was derived from the UAV flight logs and used as an objective and continuous measure (computed at a rate of 1 Hz) of the participant’s task performance. The task index was derived by assessing the number of pending secondary tasks, weighted by the task’s relative importance. Participants were briefed on the importance of attending to both primary and secondary tasks but were not made aware of the weights used in calculating the task index. The task index was calculated as follows:
- Poor navigation performance (accuracy above 25 m): +1
- Adequate navigation performance (accuracy between 10 m and 25 m): +0.5
- Poor communication performance (comm strength below 50%): +1
- Adequate communication performance (comm strength between 50% to 70%): +0.5
- Critically low fuel/battery (fuel/battery needed to return to base less than 1.5x available on board): +1
- Low fuel/battery (fuel/battery needed to return to base between 1.5x and 2x available on board: +0.5
- Autopilot mode in hold: +1
- UAV not assigned into a team: +1
- UAV does not have any sensor active: +1
The task index was used as a basis for assessing the sensitivity of different neurophysiological features. Features which were highly correlated to the task index were deemed to be more suitable. In addition, the task index was used as the desired output when training the user’s workload model in the offline training phase.
4. Human-in-the-Loop Evaluation
Human-in-the-loop (HITL) test activities were aimed at verifying the classification layer of the CHMI2 system, particularly for the offline calibration and online adaptation phases. In the offline calibration phase, individual and/or groups of operators are meant to undertake a fairly extensive set of training exercises designed to explore the psychophysiological response of the operators. The models in the classification layer are calibrated based on the data from these training exercises and can be re-calibrated periodically (for instance every month) to capture shifts in operator response. In the online adaptation phase, the classification layer is coupled with the adaptation layer to provide seamless transitions between different HMI2 formats and functions to support enhanced human-machine performance and operational safety.
4.1. Experimental Setup
The test activities comprised two experimental runs, with the first run occurring between 31 July 2019 to 8 August 2019 involving 8 participants (7 male; 1 female), and the second run occurring between 13 December 2019 to 19 December 2019 involving 6 participants (5 male, 1 female). The participants were aerospace students at the Royal Melbourne Institute of Technology (RMIT) University and were selected based on their prior experience in aviation and aerospace engineering. Owing to a lack of familiarity with the HMI functions and the bushfire fighting scenario, participants had to undertake two rounds of familiarization training prior to the first experimental run, with each training session lasting approximately one hour. At the end of the training, participants were able to demonstrably perform the basic functions in the GCS (e.g., team assignment, tasking, sensor utilization, overlay switching). However, it was observed that participants were generally not familiar with advanced automation tools, such as automated tasking, system management, and path planning functionalities. During the familiarization training and over the course of the two experimental runs, minor refinements were made to the scenario and HMI based on participant feedback. Data of the first experimental run were used to train the models in the classification module for the offline calibration phase, while the second experimental run was aimed at verifying the system’s capability to drive dynamic changes in HMI2 formats and functions for the online adaptation phase.
The experimental procedure is illustrated in Figure 17. At the beginning of each experimental run, participants were given a refresher briefing to make sure that they were familiar with the scenario and the usage of the GCS. Following the briefing, participants were asked to wear a combination of neurophysiological sensors comprising the Bioharness strap, EEG cap, and functional near-infrared spectroscopy (FNIRS) headband. The FNIRS headband was worn in the first experimental run but was not used in the second experimental run as the OpenFace face tracker was used to record the participants’ facial features and required an unobstructed view of the participant’s face. A check was conducted to ensure that the impedances of the EEG electrodes were within acceptable range and that the EEG signal was not saturated. Subsequently, the Gazepoint 3 (GP3) eye tracker was calibrated using a 9-point calibration and the OpenFace recording started. The GP3 and Bioharness sensors were fully integrated in the lab network, allowing for real-time data streaming. However, as the EEG, FNIRS, and face-tracker were not yet fully integrated, data from these sensors could only be obtained via post-processing after the experimental run. Additionally, cardiorespiratory data were not logged for one participant as the Bioharness strap was too large to fit the participant. For further information on the neurophysiological sensors, set-up, and neurophysiological features, the reader is referred to [28].

Figure 17.
Experimental procedure.
Once the set-up was complete, rest-state data were logged for 5 min before starting the scenario, which lasted for 30 min and comprised three back-to-back phases of increasing difficulty. At the end of the mission, neurophysiological data were logged for another 5 min, while the participant was in a resting state. Subsequently, a de-briefing was carried out where participants provided feedback on the mission along with subjective ratings for their workload and situational awareness in each of the three phases using a 10-point Likert scale. The workload and situational awareness were found to be significant across the three phases [33].
4.2. Offline Calibration
In the offline calibration phase, initial datasets were collected from the first experimental run to train the classification module. Since only data from two sensors (GP3 and Bioharness) could be streamed in real time, two separate ANFIS-based workload models (full/reduced) were generated for each participant. The full model was generated by training on the full set of neurophysiological features while the reduced model was generated using features obtained only from sensors that operate with real-time availability (i.e., the GP3 and Bioharness), with the intention of being deployed in the online adaptation phase. The inputs for training each classifier included the normalized click count, along with different neurophysiological features. The full model was obtained by training on normalized values of visual entropy, blink rate, heart rate, heart rate variability (HRV) (given by the magnitude of the two principal axes of the Poincaré plot, SD1 and SD2), FNIRS oxygenation, and blood volume, while the reduced model was obtained by training on the normalized values of visual entropy, blink rate, heart rate, and SD1. The normalized task index served as desired model output. The training produced fairly accurate models, with the full model providing a slightly lower error than the reduced model. Comparing the accuracy of the two models across all six participants, the root mean squared error (RMSE) for the full model was found to be 0.047 ± 0.025, while that of the reduced model was found to be 0.055 ± 0.030. The training results were generally similar across all participants, with Figure 18 showing the results from Participant 5′s dataset. The output from the full model was observed to be generally noisier than the output from the reduced model but more accurate due to the contribution of additional neurophysiological features not included in the reduced model.
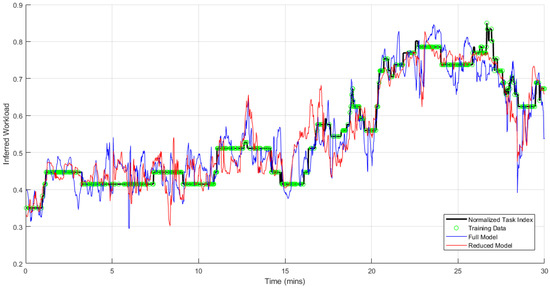
Figure 18.
ANFIS training results, with output of trained models (full and reduced).
4.3. Online Adaptation
Verifying the CHMI2 system in the online adaptation phase required evaluating the system’s capability to support real-time workload inference and HMI2 adaptation. To evaluate the real-time workload inference, the accuracy of the inferred workload was determined by comparing the classifier output against the normalized task index. The workload model’s performance is summarized in Table 9, given in terms of the correlation coefficient and normalized RMSE between the inferred workload and normalized task index.
Table 9.
Performance of real-time workload inference—correlation coefficient and normalized root mean squared error (RMSE).
The performance of the workload model was variable across all participants, with the model of Participant 5 (Figure 19) exhibiting the best performance with a correlation coefficient of 0.645 and a normalized RMSE of 0.199 against the task index.
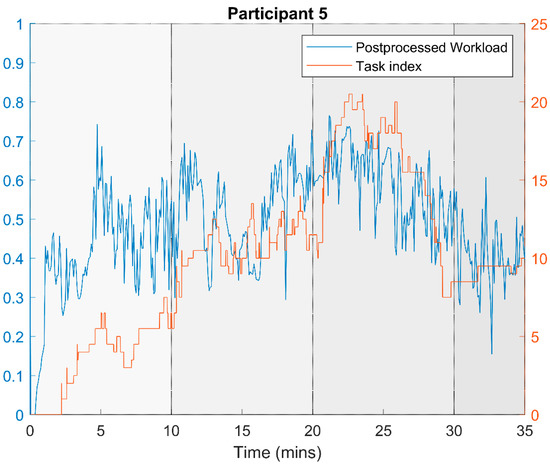
Figure 19.
Participant 5’s inferred workload (blue) and actual task index (red).
Furthermore, it was observed that the RMSE of the inferred workload differed across the different phases of the experiment, with larger RMSE typically occurring during the lower task index phases (i.e., Phase 1). In the case of Participant 3 (Figure 20), where the workload model was based solely on eye tracking observables (visual entropy and blink rate) and not using cardiorespiratory measures, the model performed poorly, particularly at low values of the task index.
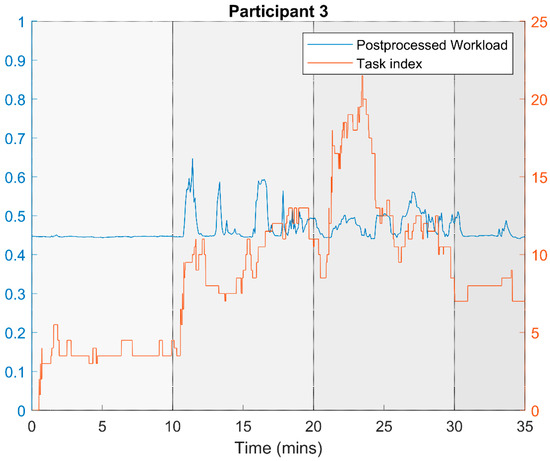
Figure 20.
Participant 3’s inferred workload (blue) and actual task index (red).
The low correlation coefficient for Participant 1 (Figure 21) can be attributed to a poorly trained model for that participant. The dataset used to train Participant 1’s model was taken from an experimental case where the participant had mistakenly sent out more UAVs than allowed, resulting in the need to send these UAVs back mid-phase and thereby leading to disruptions in the scenario. As a result, the participant provided low subjective workload ratings across the three scenario phases, resulting in an excessively low variation in the scaled task index (varying between 0.2 and 0.3 when used to train the workload model). As the workload model was trained on this limited range, it had a natural bias to make inferences about the user’s workload within that range.
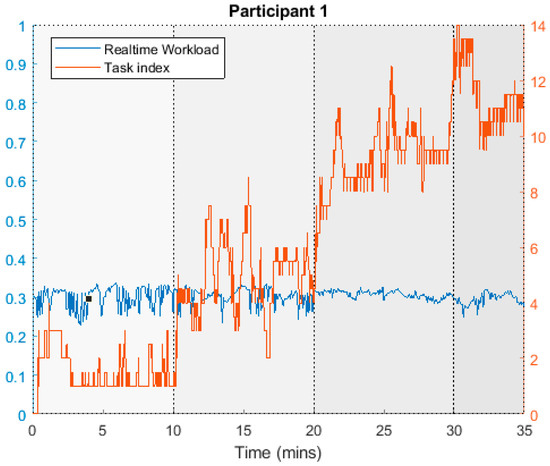
Figure 21.
Participant 1’s inferred workload (blue) and actual task index (red).
5. Discussion
The offline training and real-time inference was successfully demonstrated, notwithstanding the mixed results of the module’s performance. In particular, future work should focus on implementing a number of modifications to the module to overcome its current limitations and improve the inference accuracy:
Determining the most suitable neurophysiological features as input for the module. The reduced model was trained on four neurophysiological features (gaze entropy, blink rate, heart rate, and heart rate variability). Even though gaze entropy and blink rate were found to be the two features which were the most highly correlated with the task index, a model trained solely on these two features (i.e., Participant 3’s workload model) was shown to be less accurate than one trained on the four features. Therefore, it could be the case that additional features based on EEG, fNIR, facial features, or voice patterns could improve the accuracy of the trained model. However, it was also observed that models trained on a greater number of inputs generally produced noisier output. Therefore, a more rigorous evaluation is needed to ensure that the selected features are indeed correlated with the user’s cognitive states. Since the results of the current experimental tests have shown that the current set of neurophysiological features are poorly correlated with the task index, further pre-processing might be required to obtain a more highly-correlated set of features.
Additional training stages. While the current process features a single offline training stage followed by the online adaptation, a more accurate model could be obtained via a batch training process where the model is trained across multiple test runs, or a continuous training process where the model is trained after every use. This hypothesis could not be tested at this stage given the time constraints but should be investigated in future research.
Using a different machine learning method in the classification module. The workload model is currently trained using an ANFIS-based machine learning method. The method works by fitting the model to the desired output based on a given set of inputs. Consistent with the basic ANFIS method, the fuzzy input membership functions are tuned via back-propagation while the output membership function is modified by least-squares. The back-propagation stage is typical of most neural network-based machine learning techniques and is useful since it allows the input membership function parameters to gradually converge to a target value. However, the least-squares method of determining the output membership parameters is a “one-shot” technique which runs contrary to the philosophy of gradual convergence, as the output membership parameters are effectively overwritten at each training iteration. As such, to retain the “grey-box” approach offered by fuzzy systems while overcoming the limitations of an ANFIS-based method, a possible alternative is to consider Bayesian networks, which also utilize a similar back-propagation method to tune the network parameters. Additionally, other machine learning techniques, such as deep neural networks (DNN), would introduce the possibility of reinforcement learning over subsequent training stages, although possibly compromising model interpretability.
Making modifications to the task index. The task index was initially conceived as an objective and continuous measure for approximating the user’s workload, independent from the neurophysiological observables and based on readily obtainable mission/system measurables. It assumed that the secondary task load could serve as a proxy to the user’s workload and was based on a count of pending secondary tasks, weighted by their relative difficulty. However, during the experimental runs, it was observed that participants, usually the inexperienced ones, could not maintain an awareness of all the current pending tasks, thereby experiencing a lower subjective workload even if at a relatively higher task index. This is a common phenomenon, as humans are known to shed tasks to maintain an appropriate level of perceived workload. To prevent this, an explicit score could have displayed with points lost for failing to do these tasks. Additionally, modifications could be made to the task index by introducing additional weights based on the perceptibility of a task. However, care should be taken to ensure that these weights are independent from the neurophysiological measures.
6. Conclusions
The assessment of the human operator’s cognitive state through the real-time measurement of neurophysiological parameters holds promise to support new forms of adaptive automation, such as intelligent agents that can sense, predict, and provide adaptive decision support to the user during periods of sustained workload; or systems that can dynamically allocate tasks to teams of individuals based on their cognitive profiles. As relatively high levels of automation and autonomy are required to support multi-UAV operations, adaptive automation is an important enabler to achieve an optimal distribution of task load among agents in the human-machine team. One of the pathways towards adaptive automation is through the sensing and inference of the functional state of the user based on neuroergonomic principles, as described by the CHMI2 framework. While this line of research has been initially pursued in the ATM and conventional piloting domains, there has been limited research on similar systems for UAV or multi-UAV operations. In light of these developments, this article investigated the potential for a CHMI2 system to support multi-UAV operations. To evaluate the CHMI2 framework, a UAS simulation environment was developed, along with HMI formats and functions allowing users to assume the role of a remote pilot in an OTM bushfire detection scenario. The CHMI2 module was integrated into the simulation environment and the feasibility of the system was assessed through HITL experiments. The experimental evaluation successfully demonstrated the offline calibration and online adaptation functionalities of the CHMI2 module. The performance of the workload inference model was variable across participants, with an RMSE of 0.2 to 0.6 for the inferred workload, which could be attributed to the reduced number of features with real-time availability, as well as a single training stage in the offline calibration phase. Additionally, limitations were identified in the tuning techniques used in the ANFIS-based classification module, which could possibly be overcome with a different machine-learning method, or through additional calibration and tuning stages. Notwithstanding these limitations, the HITL evaluation activities successfully demonstrated the potential of a CHMI2 system to provide adaptive automation in complex scenarios, paving the way for trusted autonomy in future aerospace systems.
Author Contributions
Original draft presentation, Y.L. and N.P.; methodology, Y.L., A.G., R.S., T.K., and N.E.; software, formal analysis, Y.L.; review and editing, A.G., R.S., T.K., N.E., and D.J.B.; supervision, A.G. and R.S.; conceptualization, R.S., T.K., and N.E.; revision of draft manuscript, Y.L. All authors have read and agreed to the published version of the manuscript.
Funding
This research was funded by THALES Airspace Mobility Solutions (AMS) Australia, and the Northrop Grumman Corporation (USA), with different aspects of this work being separately supported under the collaborative research projects RE-03975 and RE-03671 respectively.
Conflicts of Interest
The authors declare no conflict of interest.
References
- Skorobogatov, G.; Barrado, C.; Salami, E. Multiple UAV Systems: A Survey. Unmanned Syst. 2020, 8, 149–169. [Google Scholar] [CrossRef]
- Boccalatte, M.; Brogi, F.; Catalfamo, F.; Maddaluno, S.; Martino, M.; Mellano, V.; Prin, P.R.; Solitro, F.; Torasso, P.; Torta, G. A Multi-UAS Cooperative Mission Over Non-Segregated Civil Areas. J. Intell. Robot. Syst. 2012, 70, 275–291. [Google Scholar] [CrossRef]
- Wohleber, R.W.; Matthews, G.; Lin, J.; Szalma, J.L.; Calhoun, G.L.; Funke, G.J.; Chiu, C.-Y.P.; Ruff, H.A. Vigilance and Automation Dependence in Operation of Multiple Unmanned Aerial Systems (UAS): A Simulation Study. Hum. Factors J. Hum. Factors Ergon. Soc. 2018, 61, 488–505. [Google Scholar] [CrossRef] [PubMed]
- Eaton, C.M.; Chong, E.K.P.; Maciejewski, A.A. Multiple-Scenario Unmanned Aerial System Control: A Systems Engineering Approach and Review of Existing Control Methods. Aerospace 2016, 3, 1. [Google Scholar] [CrossRef]
- Lippitt, C.; Zhang, S. The impact of small unmanned airborne platforms on passive optical remote sensing: A conceptual perspective. Int. J. Remote. Sens. 2018, 39, 4852–4868. [Google Scholar] [CrossRef]
- Miller, C.A.; Mueller, J.; Geib, C.; Lavergne, D.; Walker, P.; Hamell, J. User Interaction Approaches for Managing Multiple UAS in the National Airspace. In Proceedings of the 2019 Integrated Communications, Navigation and Surveillance Conference (ICNS), Herndon, VA, USA, 9–11 April 2019; pp. 1–16. [Google Scholar]
- Fern, L.; Shively, J. A Comparison of Varying Levels of Automation on the Supervisory Control of Multiple UASs. In Proceedings of the AUVSI’s Unmanned Systems North America, Washington, DC, USA, 10–13 August 2009. [Google Scholar]
- Matthews, G.; Panganiban, A.R.; Wells, A.; Wohleber, R.W.; Reinerman-Jones, L.E. Metacognition, Hardiness, and Grit as Resilience Factors in Unmanned Aerial Systems (UAS) Operations: A Simulation Study. Front. Psychol. 2019, 10, 640. [Google Scholar] [CrossRef] [PubMed]
- Feitshans, G.L.; Rowe, A.J.; Davis, J.E.; Holland, M.; Berger, L. Vigilant spirit control station (VSCS)—‘The face of COUNTER’. In Proceedings of the AIAA Guidance, Navigation, and Control Conference and Exhibit, Honolulu, HI, USA, 18–21 August 2008. [Google Scholar]
- Calhoun, G.L.; Ruff, H.A.; Behymer, K.J.; Mersch, E.M.; Savage-Knepshield, P.; Chen, J. Operator-Autonomy Teaming Interfaces to Support Multi-Unmanned Vehicle Missions. In Advances in Intelligent Systems and Computing; Springer: Berlin/Heidelberg, Germany, 2016; Volume 499, pp. 113–126. [Google Scholar]
- Perez, D.; Maza, I.; Caballero, F.; Scarlatti, D.; Casado, E.; Ollero, A. A Ground Control Station for a Multi-UAV Surveillance System. J. Intell. Robot. Syst. 2012, 69, 119–130. [Google Scholar] [CrossRef]
- Valenti, M.; Bethke, B.; Fiore, G.; How, J.P.; Feron, E. Indoor Multi-Vehicle Flight Testbed for Fault Detection, Isolation, and Recovery. In Proceedings of the AIAA Guidance, Navigation, and Control Conference and Exhibit, Keystone, CO, USA, 21–24 August 2006. [Google Scholar]
- Patzek, M.; Zimmer, D.; Feitshans, G.; Draper, M.; Huges, T.; Flach, J. Multi-UAV Supervisory Control Interface Technology. In Proceedings of the International Symposium on Aviation Psychology, Dayton, OH, USA, 27–30 April 2009. [Google Scholar]
- Fern, L.; Rorie, R.C.; Pack, J.; Shively, R.J.; Draper, M. An evaluation of Detect and Avoid (DAA) displays for unmanned aircraft systems: The effect of information level and display location on pilot performance. In Proceedings of the 15th Annual AIAA Aviation, Technology, Integration and Operations Conference, Dallas, TX, USA, 22–26 June 2015. [Google Scholar]
- Calhoun, G.L.; Miller, C.A.; Hughes, T.C.; Draper, M.H. UAS Sense and Avoid System Interface Design and Evaluation. In Proceedings of the Human Factors and Ergonomics Society Annual Meeting; SAGE Publications: Thousand Oaks, CA, USA, 2014; Volume 58, pp. 21–25. [Google Scholar]
- Ramchurn, S.D.; Fischer, J.E.; Ikuno, Y.; Wu, F.; Flann, J.; Waldock, A. A Study of Human-Agent Collaboration for Multi-UAV Task Allocation in Dynamic Environments. In Proceedings of the 24th International Joint Conference on Artificial Intelligence (IJCAI), Buenos Aires, Argentina, 25–31 July 2015; pp. 1184–1192. [Google Scholar]
- Berka, C.; Levendowski, D.J.; Ramsey, C.K.; Davis, G.; Lumicao, M.N.; Stanney, K.M.; Reeves, L.M.; Regli, S.H.; Tremoulet, P.D.; Stibler, K. Evaluation of an EEG workload model in an Aegis simulation environment. In Proceedings SPIE 5797, Biomonitoring for Physiological and Cognitive Performance during Military Operations; International Society for Optics and Photonics: Bellingham, WA, USA, 2005; pp. 90–99. [Google Scholar]
- Cummings, M.; Clare, A.; Hart, C. The Role of Human-Automation Consensus in Multiple Unmanned Vehicle Scheduling. Hum. Factors J. Hum. Factors Ergon. Soc. 2010, 52, 17–27. [Google Scholar] [CrossRef] [PubMed]
- De Visser, E.; Parasuraman, R. Adaptive aiding of human-robot teaming effects of imperfect automation on performance, trust, and workload. J. Cogn. Eng. Decis. Mak. 2011, 5, 209–231. [Google Scholar] [CrossRef]
- Borghini, G.; Aricò, P.; Di Flumeri, G.; Cartocci, G.; Colosimo, A.; Bonelli, S.; Golfetti, A.; Imbert, J.P.; Granger, G.; Benhacene, R.; et al. EEG-Based Cognitive Control Behaviour Assessment: An Ecological study with Professional Air Traffic Controllers. Sci. Rep. 2017, 7, 1–16. [Google Scholar] [CrossRef] [PubMed]
- Wang, Y.; Cong, W.; Dong, B.; Wu, F.; Hu, M. Statistical Analysis of Air Traffic Controllers’ Eye Movements. In Proceedings of the 11th USA/Europe Air Traffic Management Research and Development Seminar, ATM 2015, Lisbon, Portugal, 23–26 June 2015. [Google Scholar]
- Toppi, J.; Borghini, G.; Petti, M.; He, E.J.; De Giusti, V.; He, B.; Astolfi, L.; Babiloni, F. Investigating Cooperative Behavior in Ecological Settings: An EEG Hyperscanning Study. PLoS ONE 2016, 11, e0154236. [Google Scholar] [CrossRef] [PubMed]
- Harris, J.; Wiggins, M.; Morrison, B.; Morrison, N. Differentiating Cognitive Complexity and Cognitive Load in High and Low Demand Flight Simulation Tasks. In Proceedings of the Australian Computer-Human Interaction Conference, Adelaide, Australia, 25–29 November 2013; pp. 133–150. [Google Scholar]
- Harrison, J.; Izzetoglu, K.; Ayaz, H.; Willems, B.; Hah, S.; Woo, H.; Shewokis, P.A.; Bunce, S.C.; Onaral, B. Human performance assessment study in aviation using functional near infrared spectroscopy. In Proceedings of the International Conference on Augmented Cognition, Las Vegas, NV, USA, 21–26 July 2013; pp. 433–442. [Google Scholar]
- Schmid, D.; Korn, B.; Stanton, N.A. Evaluating the reduced flight deck crew concept using cognitive work analysis and social network analysis: Comparing normal and data-link outage scenarios. Cogn. Technol. Work. 2019, 22, 109–124. [Google Scholar] [CrossRef]
- Lim, Y.; Bassien-Capsa, V.; Ramasamy, S.; Liu, J.; Sabatini, R. Commercial airline single-pilot operations: System design and pathways to certification. IEEE Aerosp. Electron. Syst. Mag. 2017, 32, 4–21. [Google Scholar] [CrossRef]
- Lim, Y.; Gardi, A.; Ezer, N.; Kistan, T.; Sabatini, R. Eye-Tracking Sensors for Adaptive Aerospace Human-Machine Interfaces and Interactions. In Proceedings of the Metrology for Aerospace (MetroAeroSpace), Rome, Italy, 20–22 June 2018. [Google Scholar]
- Pongsakornsathien, N.; Lim, Y.; Gardi, A.; Hilton, S.; Planke, L.J.; Sabatini, R.; Kistan, T.; Ezer, N. Sensor Networks for Aerospace Human-Machine Systems. Sensors 2019, 19, 3465. [Google Scholar] [CrossRef] [PubMed]
- Lim, Y.; Gardi, A.; Ramasamy, S.; Vince, J.; Pongracic, H.; Kistan, T.; Sabatini, R. A Novel Simulation Environment for Cognitive Human Factors Engineering Research. In Proceedings of the 36th Digital Avionics Systems Conference, St. Petersburg, FL, USA, 17–21 September 2017. [Google Scholar]
- Lim, Y.; Ramasamy, S.; Gardi, A.; Kistan, T.; Sabatini, R. Cognitive Human-Machine Interfaces and Interactions for Unmanned Aircraft. J. Intell. Robot. Syst. 2017, 91, 755–774. [Google Scholar] [CrossRef]
- Lim, Y.; Gardi, A.; Pongsakornsathien, N.; Sabatini, R.; Ezer, N.; Kistan, T. Experimental characterisation of eye-tracking sensors for adaptive human-machine systems. Measurement 2019, 140, 151–160. [Google Scholar] [CrossRef]
- Lim, Y.; Liu, J.; Ramasamy, S.; Sabatini, R. Cognitive Remote Pilot-Aircraft Interface for UAS Operations. In Proceedings of the 12th International Conference on Intelligent Unmanned Systems, Xi’an, China, 23–25 August 2016. [Google Scholar]
- Planke, L.J.; Lim, Y.; Gardi, A.; Sabatini, R.; Kistan, T.; Ezer, N. A Cyber-Physical-Human System for One-to-Many UAS Operations: Cognitive Load Analysis. Sensors 2020, 20, 5467. [Google Scholar] [CrossRef] [PubMed]
- Charles, R.L.; Nixon, J. Measuring mental workload using neurophysiological measures: A systematic review. Appl. Ergon. 2019, 74, 221–232. [Google Scholar] [CrossRef] [PubMed]
- Sheridan, T.B. Adaptive automation, level of automation, allocation authority, supervisory control, and adaptive control: Distinctions and modes of adaptation. IEEE Trans. Syst. Man Cybern. Part. A Syst. Hum. 2011, 41, 662–667. [Google Scholar] [CrossRef]
- Lim, Y.; Ranasinghe, K.; Gardi, A.; Ezer, N.; Sabatini, R. Human-Machine Interfaces and Interactions for Multi UAS Operations. In Proceedings of the 31th Congress of the International Council of the Aeronautical Sciences (ICAS 2018), Belo Horizonte, Brazil, 9–14 September 2018. [Google Scholar]
- Lim, Y.; Samreeloy, T.; Chantaraviwat, C.; Ezer, N.; Gardi, A.; Sabatini, R. Cognitive Human-Machine Interfaces and Interactions for Multi-UAV Operations. In Proceedings of the 18th Australian International Aerospace Congress, Melbourne, Australia, 24–26 February 2019. [Google Scholar]


Publisher’s Note: MDPI stays neutral with regard to jurisdictional claims in published maps and institutional affiliations. |
© 2021 by the authors. Licensee MDPI, Basel, Switzerland. This article is an open access article distributed under the terms and conditions of the Creative Commons Attribution (CC BY) license (http://creativecommons.org/licenses/by/4.0/).