Abstract
With increasing global investment in offshore wind energy and rapid deployment of wind power technologies in deep water hazardous environments, the in-service inspection of wind turbines and their related infrastructure plays an important role in the safe and efficient operation of wind farm fleets. The use of unmanned aerial vehicle (UAV) and remotely piloted aircraft (RPA)—commonly known as “drones”—for remote inspection of wind energy infrastructure has received a great deal of attention in recent years. Drones have significant potential to reduce not only the number of times that personnel will need to travel to and climb up the wind turbines, but also the amount of heavy lifting equipment required to carry out the dangerous inspection works. Drones can also shorten the duration of downtime needed to detect defects and collect diagnostic information from the entire wind farm. Despite all these potential benefits, the drone-based inspection technology in the offshore wind industry is still at an early stage of development and its reliability has yet to be proven. Any unforeseen failure of the drone system during its mission may cause an interruption in inspection operations, and thereby, significant reduction in the electricity generated by wind turbines. In this paper, we propose a semiquantitative reliability analysis framework to identify and evaluate the criticality of mission failures—at both system and component levels—in inspection drones, with the goal of lowering the operation and maintenance (O&M) costs as well as improving personnel safety in offshore wind farms. Our framework is built based upon two well-established failure analysis methodologies, namely, fault tree analysis (FTA) and failure mode and effects analysis (FMEA). It is then tested and verified on a drone prototype, which was developed in the laboratory for taking aerial photography and video of both onshore and offshore wind turbines. The most significant failure modes and underlying root causes within the drone system are identified, and the effects of the failures on the system’s operation are analysed. Finally, some innovative solutions are proposed on how to minimize the risks associated with mission failures in inspection drones.
1. Introduction
In recent years, offshore wind energy technologies have gained widespread attention and experienced a rapid development because of the many advantages they offer. The wind resources in offshore sites are more abundant, stronger, and blow more consistently than those on land. Additionally, wind turbines at sea are less noisy and more environmentally friendly than their land-based counterparts. The Global Wind Energy Council (GWEC) estimates that the total offshore wind energy capacity in the world will surge to more than 234 gigawatts (GW) by the end of 2030 [1].
Significant investments have been made in recent years to deploy large-scale wind turbines of 9 to 12 megawatts (MW) in size, in order to achieve the best economies of scale in the offshore wind sector [2]. Offshore wind farm infrastructures are inherently complex and prone to failures. A significant expenditure is required to repair/upgrade these critical infrastructures when they fail. The costs associated with operation and maintenance (O&M) account for a large portion of the total life-cycle cost in offshore wind energy projects. According to a research conducted on a 500-MW baseline offshore wind farm (consisting of 100 wind turbines of 5-MW), the O&M costs accounted for about 26% of the levelised cost of energy (LCoE) over the 25 years’ life of the project [3]. Therefore, reducing O&M time and cost has become a high priority for the offshore wind energy sector as a step on the road toward achieving lower LCoE values. A key strategy in this regard is developing new and innovative technologies that can help wind farm owners/operators improve their O&M practices for offshore wind farms located in geographically remote regions.
Performing inspections on wind turbines during the project life cycle is a key part of safe and effective operation of wind energy projects. Wind turbines must be inspected and maintained on a regular basis to ensure they are in satisfactory condition. Traditionally, the inspection of wind turbines is carried out visually by experienced technicians having adequate knowledge in identifying the defects. However, the visual inspection of some components, such as tower, rotor blades, hub, and frames, is very resource intensive and often takes a long time to execute. It may also pose serious health and safety risks to personnel who carry out the tasks, in particular when the weather conditions are severe (e.g., wind is strong, or waves are high). With respect to safety, the personnel sometimes must climb the wind turbine tower, which is up to about 80 m high from the ground, to carry out some inspection works on the nacelle’s internal components. In addition, for the inspection of rotor components (comprising of blades and hub) the personnel will have to dangle by ropes from the top of wind turbines and work for some hours at high altitudes (sometimes over 100 m) above the sea, which can be life-threatening and even fatal.
With the aim of reducing inspection duration and minimizing O&M costs, numerous robotic platforms are being deployed in the offshore wind industry to help technicians conduct inspections remotely and collect diagnostic information from the entire wind farm in real-time. Drones are a category of flying vehicles, known as unmanned aerial vehicle (UAV) or remotely piloted aircraft (RPA), which are able to operate in a highly automated manner. According to Sundqvist [4], the term “UAV” was first used more than one hundred years ago, whereas the term “drone” became popular after the 1930s primarily in military reconnaissance missions. In the 1970s, drones became lighter, more advanced, and more automated. Nowadays, they can fly long missions at high altitudes (up to 400 ft above ground level) and follow a predetermined path to get close to an object and take pictures and videos of it without any human intervention. Drones are currently used in a wide range of applications, including fisheries monitoring, maritime patrol, coastline monitoring, drug traffic monitoring, high-accuracy terrain mapping, crop and harvest monitoring, road traffic monitoring and control, law enforcement, forest fire detection, high voltage power line monitoring, etc. (for further see [5]). Santos et al. [6] described how the maintenance of power lines could be performed with the help of drones. Jordan et al. [7] also explained how to use drones for the inspection of sewers, railways, etc.
Drones are becoming increasingly popular technologies in the offshore wind energy sector for remote inspection of wind turbines as well as transportation of spare parts to offshore sites. Høglund [8] described how drones can help wind farm operators gather information from their wind turbine fleets. Frederiksen and Knudsen [9] discussed about the opportunities and barriers to deploying a drone-based inspection technology in offshore wind farms. Stout and Thompson [10] presented a five-stage process for visual inspection using drones in offshore wind farms. These stages include creation of defect standard, collection of data, image processing, development of criticality matrix, and visualisation of outputs. For the inspection of offshore wind turbines, the drones are often transported in a vessel (e.g., a boat or a helicopter) to the offshore wind farm and then they are flied to the top of wind turbines via a remote control. Drones have the capability to hover in one place and take high-quality images of wind turbine components from different positions and angles (see Figure 1). These images can then be analysed by a computer to identify early signs of defects in or damage to wind turbines and identify appropriate maintenance actions to prevent failure modes from occurring. Some high-resolution cameras may be required for this purpose. A wide variety of sensors including visual and thermal, infrared, near infrared (NIR), hyperspectral, etc., might also be fitted on drones to capture different types of data. Galleguillos et al. [11] demonstrated how defects in wind turbine composite blades can be detected using a drone equipped with an infrared thermographic camera. Shivaram [12] demonstrated how to use images taken by a quadcopter drone to accurately detect any damage, cracks, or structural deformation in wind turbine blades. Zhang et al. [13] discussed how to use a photogrammetric software to detect wind turbine blade defects from the aerial photographs taken by a drone.
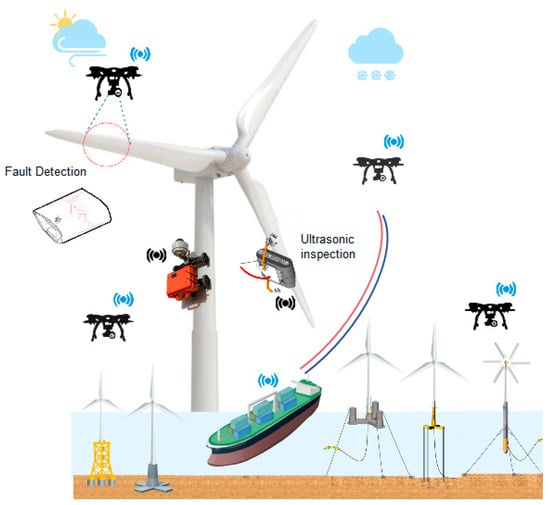
Figure 1.
Robotic platforms for the inspection of offshore wind farms.
The use of drones has significant potential to increase efficiency, reduce O&M costs, improve operational safety as well as minimize production downtimes in the wind energy sector. However, despite all these potential benefits, the drone-based inspection technology for offshore wind turbines is still at an early stage of development and further studies are necessary to identify key technological gaps, opportunities, and future requirements of the technology in terms of hardware, software, and data [14,15]. Reliability, which is defined as the probability of a system functioning without failure for a given period of time in a designed environment, is a key performance indicator for drone systems. Ensuring the reliability of drones when they are in mission mode is a challenging issue [16,17,18]. Any unforeseen failure of a drone system during its flight may cause an interruption in inspection operations, and thereby, significant reduction in the electricity generated by wind turbines. The failure rate of drones is reported at about 1 in 1000 flight hours, which is about 100 times greater than that of commercial aviation [19,20]. To identify, analyse, and mitigate the risks as well as lower the maintenance costs associated with failure of drones in offshore wind farms, it is necessary to develop methodologies that are capable of determining the drone’s reliability at both system and component levels. In an effort to address this research gap, our paper presents a semiquantitative analysis framework—based on two well-established reliability methodologies, namely fault tree analysis (FTA) and failure mode and effects analysis (FMEA)—to determine the criticality of mission failures occurring in a drone-based inspection technology. A drone prototype is designed in the laboratory for taking aerial photography and video of both onshore and offshore wind turbines. Our drone consists of four key subsystems of communication, sensor, propulsion, and frame, as well as several components such as flight controller, transmitter and receiver, motors, electronic speed control (ESC), propellers, battery, camera, etc. By means of an FTA approach, the failure modes of each subsystem and component as well as the underlying causes of each failure mode are identified and their resulting effects on the system’s operation are analysed. To assess the occurrence, severity, and detectability of mission failures, the generic 1 to 10 ratings scale used in the traditional FMEA technique is justified by consulting with drone design and manufacturing companies as well as offshore inspection service providers. Finally, the components are ranked by their risk priority and some innovative solutions are proposed on how to minimize the risks associated with mission failures in the drone system. To the best of the authors’ knowledge, this is the first study implementing the FTA and FMEA methodologies on an unmanned aerial drone designed to collect inspection data from offshore wind farms.
The remainder of this article is organized as follows. Section 2 provides an overview of inspection works being conducted in offshore wind farms and reviews the state-of-the-art of drone technologies and their working procedures. Section 3 explains the reliability analysis framework in a step-by-step manner. The proposed framework is tested and verified on a drone prototype, which was developed in the laboratory for the inspection of wind turbines, and the results of the analysis are presented in Section 4. Finally, the paper is concluded with possible future direction in Section 5.
2. Research Background
2.1. Review of Inspection Activities in Offshore Wind Farms
This section provides an overview of the inspection works being performed and the inspection methods being adopted in the offshore wind industry. Currently, the inspection tasks in offshore wind farms are carried out at times when the weather condition is good and the sea state is calm. These tasks have been traditionally performed in two ways, either using “rope-access” or a “ground-camera”. Rope-access inspection involves two or more personnel climbing to the top of a wind turbine and abseiling down each blade using ropes or elevated platforms to identify and capture the defects. The problem with this method is the risk of falling into the sea. In the ground-based inspection, a camera stands on a boat about 70–80 m away from the wind turbine to take pictures of the components. Then, the pictures are stitched together to create one complete image that technicians can zoom in on all the way down to obtain defect information.
The method and frequency of inspections can significantly affect the likelihood of unexpected failures as well as the costs associated with repair operations in offshore wind farms. The traditional methods of inspection in offshore wind farms are visual and the data being collected are not consistent in quality. However, recent inspection methods include nondestructive testing (NDT) techniques (e.g., ultrasonic and thermography), which provide detailed information about the defects, such as the location of each zone of damage, its thickness and size, etc. The most common NDT methods with their advantages and disadvantages for the inspection of offshore wind turbines are presented in Table 1.

Table 1.
The most common nondestructive testing (NDT) methods for the inspection of offshore wind turbines [21].
The frequency of inspections in offshore wind farms depends on numerous factors, such as type of the system or component, potential failure modes and their likelihood of occurrence, impact of failures on the system functionality, availability of service vessels, accessibility to the offshore site, weather conditions, etc. The industry practice shows that inspections in the offshore wind industry are often conducted with two time-intervals, either once in a year (usually during July) or twice in a year (usually during May and October) [22]. Several industry codes and standards such as DNV-OS-J101 [23] have also been developed to determine the inspection intervals based on some percentage of remaining useful life (RUL) or severity of damage.
As of 2018, the market shares for rope-access and ground-based camera inspections are 83% and 10%, respectively [24]. The market for drone-based inspection is projected to grow in the offshore wind energy sector in the coming years as the drone technology is becoming more affordable, faster, and easier to use. The drone-based inspection operations in offshore wind farms involve at least two personnel, one to control the drone and another to control the boat. The drones can capture high-quality images and videos from aerial views, which can then be processed in command centres to identify where the defects on wind turbines are and what type of maintenance action should be performed to avoid failure occurrence. Drones can detect different types of damage, such as fatigue cracks, surface corrosion, galvanic corrosion, pitting, stress corrosion cracking, and erosion. A list of possible damage mechanisms in offshore wind turbines that can be detected by drones is presented in Table 2.
Table 2.
Damage mechanisms of offshore wind turbine that can be detected by drones.
2.2. Drone Technology
In this section, the commercial drone technologies and their working procedures are studied. The unmanned aerial drones can broadly be categorised into three kinds of multirotor, fixed-wing, and single-rotor helicopters. A multirotor or multicopter is a type of drone that consists of either three rotors (known as tricopter), four rotors (quadracopter), six rotors (hexacopter), or eight rotors (octocopter). The quadcopters are the most popular and widely used multirotor drones because they provide the best balance between lift, control, manoeuvrability, and cost [25]. Multirotor drones are the cheapest type of drones in the market; however, they require a lot of energy to operate and their endurance and speed are limited. With the current battery technology, multirotor drones are capable of flying for only around 20 to 30 min at a time while carrying a lightweight camera payload.
A fixed-wing drone is a type of drone designed with one rigid wing like an aeroplane to provide the lift rather than vertical lift rotors. Fixed-wing drones only need energy to move forward but not to hold themselves up in the air; so, they are much more efficient than multirotor drones [26]. They are also able to cover long distances and map large areas. Nevertheless, their main drawbacks are high cost and inability to hover in one spot. Single-rotor drones have only one rotor that holds them up and a tail rotor, which controls their heading. They can hover with a heavy payload (e.g., an aerial LIDAR laser scanner) or have a mixture of hovering with long endurance or fast forward flight. However, single-rotor drones are complex devices, and their spinning blades might be dangerous. In terms of difficulty to use, single-rotor drones lie somewhere between multirotors and fixed-wing drones. Examples of these three types of drones are shown in Figure 2.
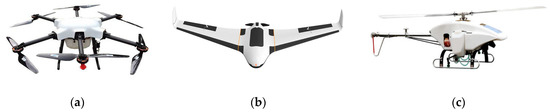
Figure 2.
Multirotor (a), fixed-wing (b), and single-rotor (c) drones.
Table 3 presents a list of advantages and disadvantages of multirotor, fixed-wing, and single-rotor drones.
Table 3.
Advantages and disadvantages of multirotor, fixed-wing, and single-rotor drones.
Even though the three types of multirotor, fixed-wing, and single-rotor drones have different designs, their working principles are basically similar. In Figure 3, the schematic working principle of unmanned aerial drones is presented. The flight control system works as the brain of a drone. The flight control instructions are sent to the drone through a laptop and a remote controller, which constitute the ground control station (GCS) [27].
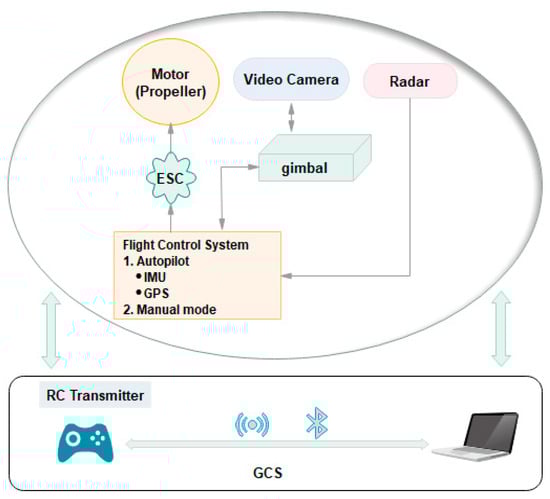
Figure 3.
The schematic working principle of unmanned aerial drones.
The GCS is a high-level command centre, which acts as an interface between the operator and the drone. The data between laptop and remote control are synchronised via wireless connection technology such as Bluetooth and Wifi. The drone’s flight path is pre-programmed on a computer or the drone is controlled using the remote controller in real-time. The instructions are transmitted by a radio control (RC) transmitter. The gimbal can support the camera, and the compensation algorithm in it can compensate the vibration of the drone when taking pictures or recording videos. When the gimbal receives the instructions, the motor inside it can respond quickly to the set angle from the drone. The gimbal can be controlled either on the same controller as the drone or by another controller. In such case, two people can work together to control both of them or only one person controls it with the help of the autopilot system. Sometimes, the images captured by drones need to be transmitted in real time for processing. The drone returns to the set point in the autopilot mode when the mission is accomplished or something unpredictable such as losing the link with the GCS happens. Throughout the mission, drones can use radar or sonar to avoid collisions with the surrounding environment.
3. Reliability Analysis Framework
In this section, a reliability analysis and improvement framework based on two methodologies of FTA and FMEA is proposed to determine the criticality of mission failures in a drone-based inspection technology for offshore wind farms. The process for applying the framework is presented in a step-by-step manner as follows:
3.1. Define the Drone-Based Inspection Technology and Its Surrounding Environment
In this step, we define the drone-based inspection technology, its primary and secondary functions, the external environment that the system is supposed to interact with, the system’s capability to sense its surrounding environment, the system’s interfaces with the asset being inspected, system’s positioning and navigation capability, etc.
3.2. Define the Reliability Goal, System Boundary, and Operating Conditions
In this step, the reliability goals for the design and operation of the drone system are established to act as a reference for further verification and validation (V&V). More so, the scope and boundaries of the system are defined and the operating conditions within which the system is intended to operate (such as wind speed and direction, temperature, rainfall, humidity, and pressure) will be identified.
3.3. Collect the System Design and Functional Information
In this step, the detailed design and functional specifications of the drone system (including CAD drawings, material specifications, test data, fault and incident logs, etc.) are collected from different parties involved in the project including: designers, original equipment manufacturers (OEMs), test engineers, operators, etc.
3.4. Break the System into Its Sub-Systems and Components
In this step, the architecture of the drone system—in terms of hardware (mechanical and electrical), sensors and software—is described. The system’s constituting elements are identified and a complete list of components and parts for each subsystem is prepared. Then, the relations between subsystems, components, and parts are defined using a dependence diagram (DD) or a reliability block diagram (RBD). RBD is a diagram representing how the components/subsystems of a system are reliability-wise related (connected).
3.5. Identify Failure Modes of the System/Components
In this step, the mission failure modes associated with the drone system and its components are determined. Some typical failure modes of a drone system include: “software is faulty at mission start”, “drone is damaged during its mission”, “drone has unexpected and unwanted behaviour during the mission”, “drone is dropped while being carried and transported in a vessel to offshore site”, “drone falls during transfer to shore”, etc.
3.6. Identify the Root Causes of Each Failure Mode
Every failure mode has one or more root causes. Some examples of root causes underlying a mission failure in a drone system include: “wrong mission plan”, “faulty set up of the drone”, “internal and external damages”, “bad electrical conduction”, “poor maintenance”, “human error”, “bad weather conditions”, etc. To determine root causes associated with failure modes, the fault tree analysis (FTA) method is used. FTA is a top-down, deductive failure analysis method in which an undesired state of a system is analysed using Boolean logic to combine a series of lower-level events. FTA is usually represented by a logic diagram beginning with an undesired top event (which, in this case, is the inability of the drone to accomplish the mission) and then working backward through intermediate events until all possible root causes at the bottom are determined. Pathways are used to interconnect events that contribute to the top event and/or intermediate events [28]. These pathways use standard logic symbols, such as AND, OR, and others. Table 4 defines the logic symbols commonly used in the FTA method.
Table 4.
The gate symbols used in fault tree analysis (FTA).
3.7. Determine the Rating Scale for the Occurrence of a Failure (O)
Failure rate (λ) is the frequency with which a component fails, or a root cause leads to a failure. Assuming that failure times of the components follow an exponential distribution, the reliability and mean time between failures (MTBF) of the system are obtained by Equations (1) and (2), respectively:
R(t) = e−λt,
MTBF = 1/λ.
Based on the estimated failure rate, an occurrence rating between 1 and 10 is assigned to each failure mode [29]. In this study, the ratings for the occurrence of a failure (O) follow the scale given in BS EN IEC 60,812 [30] and are shown in Table 5. In this scale, 1 indicates “unlikely” failure and 10 corresponds to “almost certain” failure.
Table 5.
Occurrence ratings (O) for a mission failure in an inspection drone system.
3.8. Evaluate How Each Failure Mode Affects the Performance of the Drone System, and/or the Asset Being Inspected and/or Health and Safety of Personnel
Each of the possible failure modes would have an impact on the performance of the drone system, as well as perhaps on the wind turbine components being inspected and/or the health and safety of the personnel undertaking inspections. The impacts of a failure on the drone system may include: “loss of system”, “severe damage to the system”, “minor damage to the system”, “mission abort”, etc. The impacts of a drone failure on the asset may include: “loss of wind turbine”, “severe damage to the wind turbine”, “loss of electricity production”, etc. The impacts of a failure on human operators include: “loss of life”, “severe injury”, “minor damage to health”, etc.
3.9. Determine the Rating Scale for the Severity of a Failure (S)
Based on the impacts of a failure on the drone system and/or the wind turbine asset and/or the health and safety of personnel, a severity rating based on a 10-point scale is assigned to each failure mode [31]. In this study, the ratings for the severity of a failure (S) follow the scale given in BS EN IEC 60,812 [30]. As shown in Table 6, the severity ratings vary from 1 to 10, where 1 represents “no effect” and 10 corresponds to “loss of life”.
Table 6.
Severity ratings (S) for a mission failure in an inspection drone system.
3.10. Identify the Current Control Measures to Detect or Prevent a Given Cause of Failure, and Determine the Detectability Rating (D)
In this step, the current controls that may detect a failure mode or effect of a failure are identified and then a detectability rating from 1 to 10 is assigned. The detectability rating represents how likely a failure or the effect of a failure can be detected. If there is no current control, the likelihood of detection will be very low and therefore the item will receive a high ranking such as 9 or 10. In this study, the ratings for detectability of a failure (D) follow the scale given in BS EN IEC 60,812 [30]. This scale is presented in Table 7.
Table 7.
Rating scales for the detection of a failure (D).
3.11. Calculate the Risk-Priority-Number (RPN)
RPN is calculated by multiplying the occurrence ranking times the severity ranking times the detectability ranking for each failure mode [31], i.e.,
RPN = O × S × D.
Since the scales used for O, S, and D range from 1 to 10, the RPN values will be between 1 and 1000. The total RPN of each component is calculated by adding the RPNs of all individuated failure modes.
3.12. Prioritize the Failure Modes for Action
The failure modes are prioritized in descending order according to their RPN values. Failure modes with large RPN values are given a higher priority for risk mitigation efforts in comparison to those having low RPN values. A Pareto analysis can be used to visualize the differences between the rankings for the failures and effects. The Pareto analysis means that 20 percent of the potential failures and effects account for 80 percent of the total RPN [31].
3.13. Develop Corrective or Preventive Actions to Improve the System Reliability
In this step, corrective or preventive actions are proposed to eliminate or reduce the high-risk failure modes. Often, the easiest approach for improving the reliability is to increase the detectability of failures, thus, lowering the detection rating (D). Reducing the severity rating (S) is also important, especially in situations where failures may lead to loss of asset or injuries to personnel. However, the richest opportunity for improvement lies in reducing the likelihood of failure (O). In Table 8, a list of suggestions on how to prevent occurrence, reduce severity, and improve detectability of mission failures in the drone system are given.
Table 8.
Strategies to reduce the risk of mission failures in a drone system.
3.14. Prepare FMEA Report by Summarizing the Analysis in a Tabular Form
In this step, the FMEA results are summarized in a tabular form as shown in Table 9. The following columns are included in the FMEA worksheet to record data regarding the system:
Table 9.
The failure mode and effects analysis (FMEA) worksheet applied to inspection drone systems [31].
- -
- Component (column 1);
- -
- Potential failure mode (column 2);
- -
- Potential effects of failure mode (column 3);
- -
- Possible root causes (column 4);
- -
- Present control mechanisms (method of detection) (column 5);
- -
- Severity, occurrence, and detection ratings (columns 6–8);
- -
- Risk Priority Number (RPN) (column 9);
- -
- Recommend actions (column 10)
- -
- Action taken (column 11);
- -
- Revised severity, occurrence, and detection ratings (columns 12–14);
- -
- Revised RPN (column 15).
4. Case Study
In this section, the proposed methodologies are tested and verified on a drone prototype, which was developed in the laboratory. To develop our drone prototype, several performance and operational criteria were considered. An important parameter in this regard was the hovering ability because the drones must be able to hover in one position when taking pictures from the wind turbine surface. The precision of the positioning system was another important consideration. The other criteria we considered were the ease of integration and compatibility with thermal camera, system’s reliability, operating temperature, thermal properties, vision parameters, battery life, wind resistance, hovering accuracy, payload, and the price [32,33,34]. Table 10 presents the list of criteria and their requirements that we considered when developing the drone prototype for inspecting offshore wind turbines.
Table 10.
The criteria and the requirements for an offshore wind turbine inspection drone.
Our drone prototype consists of four subsystems and several components and parts enabling it to move forward, rotate the camera, and take pictures of an object. These four subsystems with their constituting components and parts are defined below and shown in Figure 4.
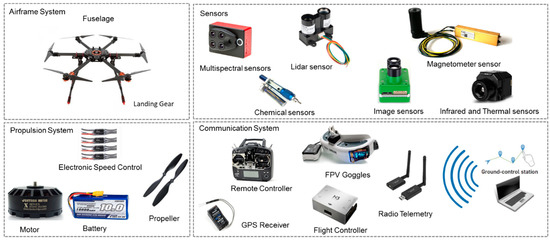
Figure 4.
Subsystems and components of our drone prototype for inspecting wind turbines.
- (i)
- airframe system—fuselage, wings, landing gear, etc.
- (ii)
- propulsion system—motor, battery, electronic speed control (ESC), propeller, etc.
- (iii)
- sensors—LIDAR, infrared and thermal cameras, multispectral sensors, magnetometer sensors, image sensors, etc.
- (iv)
- communication system—remote controller, flight controller, ground control station (GCS), first person view (FPV) goggles, radio control (RC) transmitter/receiver, etc.
A fault tree diagram is drawn using PTC Windchill Risk and Reliability (formerly known as Relex) to identify contributing factors to failure of the drone system. As shown in Figure 5, the diagram contains four input events (including communication subsystem failure, sensor subsystem failure, propulsion subsystem failure, and frame subsystem failure), which are connected with an OR gate to the top event (drone mission failure).
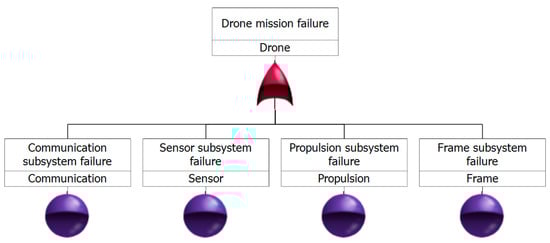
Figure 5.
A fault-tree diagram of a drone prototype system.
Each of the subsystems itself consists of a series of components and parts interacting with each other. Our analysis focused on those components experiencing more frequent failures and higher maintenance costs. These components included: flight controller, RC transmitter/receiver, antenna, FPV goggles, radio telemetry, motors, ESC, propellers, charger, battery, frame, camera, gimbal, and GPS. The main functions of these components are described in Table 11.
Table 11.
The function(s) of the drone’s components.
The specifications of the drone components are presented below in details:
- -
- Flight controllerWhen choosing a microprocessor system for our drone prototype, the following criteria were considered:
- Large computing power;
- The possibility of implementing the system without purchasing any additional I/O modules and support for common data transfer interfaces;
- Programming using the graphic language LabVIEW;
- Support for multiple flight modes;
- Built-in gyroscope and accelerometer.
Based on consultation with drone professionals, DJI NAZA N3 flight controller was chosen as it can be powered by a wide range of voltages, from 3S to 12S batteries. The weight of the entire kit is only 132 g, and it has a high hovering accuracy: vertical: ±0.5 m and horizontal: ±1.5 m. In addition to radio-controlled remote piloting, the flight controller allows automatic control of a pre-established route and also has the ability to transmit telemetry data from a board to a ground station (telephone, tablet, laptop, DIY) (for more see [37]).
- -
- Transmitter and receiverWhen choosing a control panel for our drone prototype, the following criteria were considered:
- Data transmission distance;
- The possibility of feedback;
- Support for existing data transfer protocols;
- Support for “failsafe” mode.
Futaba 10JH perfectly fitted our purpose for an offshore wind farm inspection drone. It is a 2-stick, 10 channel, T-FHSS Air-2.4 GHz system with six programmable mixes, telemetry, and assignable switch/lever/functions. It is also fully programmable and has a Futaba Advanced Spread Spectrum Technology (FASST) protocol, which allows the drone to fly even in noisy radio conditions. It has one variable knob, five 2-position switches, two 3-position switches, one momentary switch, and two digital levers, as well as built-in S.Bus programming link for S.Bus servos. The equipment has a “failsafe” mode, which allows sending a command to the flight controller that the connection with the transmitter has disappeared, and, therefore, it is necessary for the drone to return to its take-off point. The drone will receive the last command transmitted before the loss of communication. This mode is called “hold”.
The specifications of the transmitter and receiver are given in Table 12 and Table 13, respectively (for more see [38]).
Table 12.
Transmitter’s specifications.
Table 13.
Receiver’s specifications.
Figure 6 represents a fault tree diagram drawn for the drone’s communication subsystem. As can be seen, the top event (communication subsystem failure) contains three input events, namely, GCS failure, receiver failure, and controller failure, which are related with an OR gate to the top event. The receiver failure event itself contains two input events: controller antenna failure and payload antenna failure.
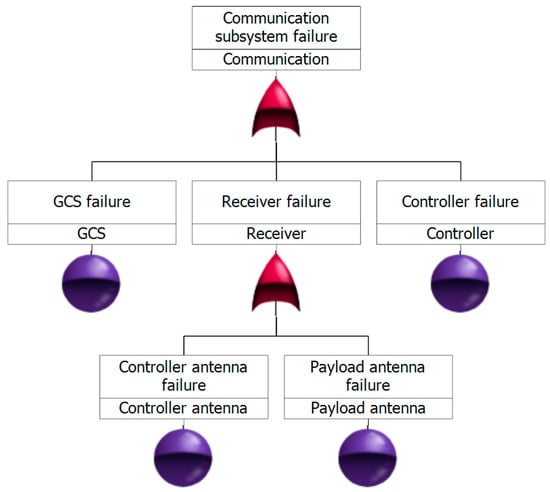
Figure 6.
A fault-tree diagram of the drone’s communication subsystem.
- -
- MotorsWhen choosing a motor for our drone prototype, the following criteria were considered:
- High resource;
- High thrust-to-weight ratio (TWR);
- Work on a direct current.
Based on consultation with drone professionals, the Foxtech Brushless Motor X5010 KV288 was chosen. It is CNC processed, well-balanced, and highly efficient. Maximum thrust of the motor can reach 3.5 kg, so it can be used in drones for aerial photography and videography. The specifications of the motor are given in Table 14.
Table 14.
Motor’s specifications [39].
- -
- Electronic speed controller (ESC)When choosing an ESC for our drone prototype, the following criteria were considered:
- Low cost;
- High reliability;
- Input voltage within 11.1–22.2 V;
- Weight of speed regulators;
- The size of the speed controllers.
Platinum PRO V4 40A was chosen as it has good protection against overheating. All components are located on both sides in such a way that they directly come in contact with the aluminium case and are cooled. A 32-bit processor allows operators to fine-tune the smoothness of the gas. In addition, this speed controller has a battery elimination circuit (BEC) that is built in and adjustable from 5 V to 8 V (with 0.1 V increments). The metal–oxide–semiconductor field-effect transistor (MOSFET) of this device are made using the latest technologies and high-quality materials. ESC has protection against sparks when connecting the device to the power supply, which allows extending the service life of connectors. The specifications of the Platinum PRO V4 40A are given in Table 15.
Table 15.
ESC’s specifications [40].
- -
- PropellersWhen selecting the drone’s propellers, the following criteria were considered:
- High strength;
- Maximum balancing;
- Size of 18 inches.
The 1855MKII full carbon fibre propeller was chosen for our drone prototype system. The specifications of this propeller are given in Table 16.
Table 16.
Propeller’s specifications [41].
- -
- ChargerWhen choosing a charger for our drone prototype system, the following criteria were considered:
- High power;
- Availability from two to four charging channels;
- Store charging support;
- Support 6S LiPo.
The Turnigy Reaktor QuadKore 1200 W 80 A (4 × 300 W 20 A) balance charger was chosen. A feature of this charger is the ability to process up to four batteries simultaneously. The advantage is that the charger can deliver high output power (1200 W) in a compact package thanks to its innovative synchronous buck-boost converter technology. It can provide up to 20 A on any of four charging channels. The Reaktor QuadKore also features storage charging, cyclic charging/discharging, 10 charge parameter memory and a high power balance function, which allow to prolong the life of the battery and keep it in top condition. The specifications of the charger are given in Table 17.
Table 17.
Charger’s specifications [42].
- -
- BatteryThe criteria considered when selecting a battery for our drone prototype include:
- Low weight;
- Large capacity;
- The output voltage is 22.2 V;
- Time-tested brand.
Based on consultation with drone professionals, the Turnigy High Capacity 10,000 mAh 6S 12C Lipo Pack w/XT90 was chosen. It is a high capacity LiPo battery, which is commonly used in multirotor applications. It has higher density compared to other batteries on the market; therefore, it allows to get more capacity with the same battery dimensions and lower weight. It provides approximately 20 percent longer flight time compared to standard LiPo batteries. The specifications of the battery are given in Table 18.
Table 18.
Battery’s specifications [43].
Figure 7 represents a fault tree diagram drawn for the drone’s propulsion subsystem. As can be seen, the top event (propulsion subsystem failure) contains four input events, namely, propeller failure, ESC failure, motor failure, and battery failure, which are related with an OR gate to the top event.
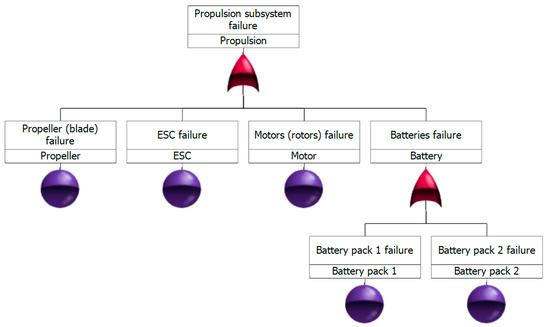
Figure 7.
A fault-tree diagram of the drone’s propulsion subsystem.
- -
- CameraWhen choosing the drone’s camera, the following criteria were considered:
- Weight;
- Price;
- Resolution;
- Thermal imaging capability;
- Stabilization mechanism.
After consulting with inspection service providers about the types of NDT tasks being performed on wind turbines, we chose the DJI’s ZENMUSE Z30 thermal camera for our drone prototype system. It is the most powerful integrated aerial zoom camera available on the market with 30× optical and 6× digital zoom. The specifications of the camera are given in Table 19.
Table 19.
Camera’s specifications [44].
Figure 8 represents a fault tree diagram drawn for the drone’s sensor subsystem. As can be seen, the top event (sensor subsystem failure) contains four input events, namely, camera failure, gimbal failure, acquisition sensor failure, and autopilot failure, which are related to an OR gate to the top event.
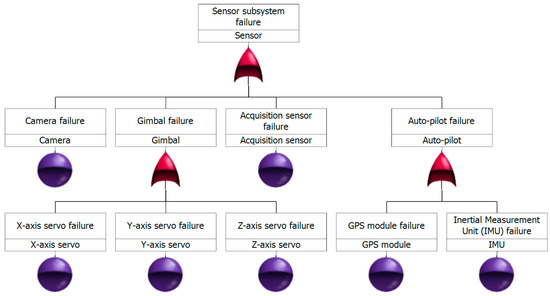
Figure 8.
Fault-tree diagram of the drone’s sensor subsystem.
- -
- FrameWhen choosing the drone’s frame, the following criteria were considered:
- High strength;
- High load capacity;
- A light weight;
- Folding design for compact transportation;
- Wheelbase 800–1000 mm.
We have chosen the frame of Tarot T960 folding hexacopter for our drone prototype system. This frame is made of toray carbon fiber 3K woven of pure, high temperature, and pressure prefabricated full CNC precision machining. The light folding system makes the transport of the drone easy and convenient. Screw technology has excellent resistance to lateral vibration. Fully carbon nanotubes have excellent damping. The frame is able to hold up to 15 kg. The specifications of the Tarot T960 CF folding hexacopter frame are given in Table 20.
Table 20.
Frame’s specifications for Tarot T960 CF folding hexacopter [45].
Figure 9 represents a fault tree diagram drawn for the drone’s frame subsystem. As can be seen, the top event (frame subsystem failure) contains three input events, namely, arm break, landing gear failure, and main chassis break, which are related with an OR gate to the top event.
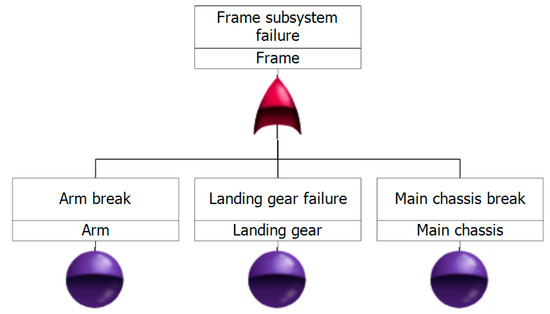
Figure 9.
Fault-tree diagram of the drone’s frame subsystem.
After identifying the failure modes and their underlying causes, a Delphi technique was used to elicit the experts’ opinions on the ratings of three risk factors, namely, the occurrence of a failure (O), severity of a failure (S), and detectability of a failure (D) in the drone prototype. As a result, an FMEA assessment team was set up to undertake a full evaluation of risks associated with mission failures occurring in the drone prototype. The assessment team included an academic researcher who has published several articles on engineering failure analysis, two designers from a drone design company, three technicians from a drone manufacturing company, and two maintenance engineers from an offshore wind maintenance service provider. All the experts were surveyed through a closed ended questionnaire in multiple rounds until a consensus is reached about the ratings of risk factors. In the first round, the experts were asked to provide their initial assessments of O, S, and D ratings for each failure mode. In the next round, everyone was given an opportunity to revise their assessments based on the anonymous and aggregated responses to the first round. This process continues until the FMEA ratings and thereby RPN values for each failure mode converge.
Table 21 presents the results of the FMEA analysis conducted on the drone prototype in a worksheet format. As can be seen, the RPN values for the drone system components vary from 36 (in manual controller) to 312 (in battery). The total RPN value for the system is reported as 2402, which was calculated by summing up the RPN values for all failure modes of the drone components. The results show that eight components of battery, motor (rotor), propeller (blades), GPS antenna, camera, arm, controller antenna, and Inertial measurement unit (IMU) account for over 70 percent of the total RPN value, and, thus, these are considered to be the highest risk elements in the drone prototype system.
Table 21.
FMEA results for the drone prototype system in offshore wind farms.
The drone components are ranked in descending order of criticality by their risk priority and the results are shown in Figure 10. The most critical component of the drone is found to be the battery; therefore, it is suggested to replace the battery after each inspection mission. Moreover, adding a backup battery can significantly enhance the performance of the drone system during mission execution. Motor is identified as the second most critical component of the drone system. To mitigate the risk of motor failure, it is suggested to replace the motor every 100 h of operation, so as to solve the problem of wear and fatigue. Another solution might be using a hexacopter, which can fly with even two damaged motors.
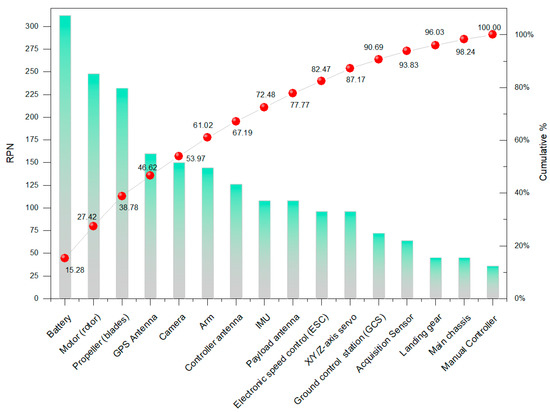
Figure 10.
Risk-priority-number (RPN) values for the drone system components.
For GPS antenna and IMU, the component redundancy is suggested as a means of increasing reliability and maintainability of the drone system. Redundancy ensures that if one component fails, there is at least one other component that can still deliver the needed performance. However, it should also be noted that the hardware redundancy is drones is often subject to numerous technical and legal constraints and uncertainties. The major problems encountered with redundancy in drones are the additional maintenance cost as well as space, weight, and power [46]. In order to determine what level of redundancy will be most efficient for an inspection drone deployed in the offshore wind sector, some trade-offs must be applied.
To avoid the recurrence of failures in other components of the drone, it is recommended to plan and carry out PM actions in a cost-effective and timely manner.
5. Conclusions and Future Works
With increasing the installed capacity of offshore wind power in the world, a significant research and development effort is carried out to reduce the levelised cost of energy (LCoE) so as to make offshore wind more competitive and attractive to investors. The operation and maintenance (O&M) accounts for a large portion of the total life-cycle cost and is the longest phase of development in offshore wind energy projects. Thus, reducing O&M time and cost has been of the highest priority to operators, manufacturers, and insurance companies in the offshore wind sector. According to some recent studies, the high O&M expenditure in offshore wind farms is mainly due to restricted accessibility to wind turbines infrastructure for inspection and maintenance. To overcome the accessibility barriers, the use of remotely controlled technologies such as unmanned aerial vehicle (UAV)—commonly known as drones—has received a great deal of attention in the offshore wind industry in recent years.
The drone-based inspection has several advantages over the traditional methods of rope-access inspection and ground-based camera inspection. The use of drones leads to reduced number of personnel having to travel to and climb up the wind installations by means of crew transfer vessels (CTV) or helicopters—and all the emissions linked to that. Another advantage is that drones can reduce the need for heavy lifting equipment to carry out inspection tasks. The inspection drones are often equipped with a powerful digital camera capable of capturing high-resolution aerial images from the tower, nacelle, rotor blades, and bolt jointing. These images can be analysed via machine learning techniques to detect early signs of degradation and identify appropriate maintenance actions to prevent failure modes from occurring. Therefore, the drones can shorten the time required in the field to detect faults and collect diagnostic information from all wind turbines.
Despite all the potential benefits, the drone technology for the inspection of offshore wind infrastructure is still in infancy stage and there is some way to go before the technology can be fully regulated and widely used. Reliability, availability, and maintainability (RAM) is considered as an important factor in the certification and deployment of inspection drone systems. However, after reviewing the literature, no RAM study was found that attempted to quantify the risks associated with the failure of inspection drones in offshore wind farms. The failure of any single element, component, or subsystem of a drone system during its mission may lead to catastrophic or hazardous conditions such as loss of wind turbine, loss of electricity production, serious injuries, and even loss of life. Therefore, it is necessary to develop methodologies that are capable of assessing the drone’s RAM—at both system and component levels—in uncertain, rapidly changing, and potentially adversarial environments.
This paper presented a combined fault-tree analysis (FTA) and failure mode and effects analysis (FMEA) model to identify, analyse, and evaluate the most critical failure modes and mechanisms in a drone prototype, which was developed in the laboratory to take aerial photography and video of onshore and offshore wind turbines. Both FTA and FMEA techniques have been commonly adopted and expanded into many engineering disciplines since the 1960s. However, to the best of our knowledge, this study was the first attempt to apply these methodologies to an unmanned aerial drone designed to collect inspection data from offshore wind farms. Four key subsystems of a drone system, namely communication, sensor, propulsion, and frame were included in our analysis. These subsystems were further broken down into their constituent components and parts such as flight controller, transmitter and receiver, motors, electronic speed control (ESC), propellers, battery, camera, etc. Next, the failure modes and mechanisms associated with each drone component were identified from an extensive literature review followed by an expert’s panel assessment. Then, all root causes contributing to failure of the drone’s mission were determined and illustrated using an FTA approach. After that, three reliability factors of the occurrence of a failure (O), severity of the impact (S), and detectability (D) were given a rating of 1 to 10 by experts. Finally, the risk-priority-number (RPN) was calculated by multiplying these three factors and the failure modes were prioritized in descending order based on their RPN values.
The RAM assessment of unmanned aerial drones is an important area requiring further studies. In the following, we present some of the possible extensions to this work:
- (a)
- The availability of failure data for drones is often restricted because many operators keep such data confidential. Therefore, the FMEA assessments may be subject to inherent or epistemic uncertainty. To cope with such uncertainty, fuzzy set theory can be considered.
- (b)
- The relative importance among the three assessment criteria, i.e., O, S, and D was not taken into consideration. To gain a true understanding of the risk priorities, the relative importance of these must also be taken into consideration.
- (c)
- The proposed methodology in this paper, i.e., risk prioritization using the FTA and FMEA analysis, can be applied to other autonomous inspection systems such as remotely operated vehicles (ROVs) and autonomous underwater vehicles (AUVs).
We have worked on some of these extensions and the finding will be reported elsewhere.
Author Contributions
Conceptualization, M.S., Z.Z., L.M. and F.D.; methodology, M.S., Z.Z., L.M. and F.D.; software, Z.Z., L.M. and J.K.; validation, M.S., Z.Z., L.M. and F.D.; formal analysis, Z.Z., L.M. and J.K.; investigation, Z.Z., L.M. and J.K.; resources, M.S. and F.D.; data curation, Z.Z., L.M. and J.K.; writing—original draft preparation, M.S., Z.Z., L.M. and F.D.; writing—review and editing, M.S.; F.D. and D.F.; visualization, M.S., Z.Z., L.M. and F.D.; supervision, M.S. and F.D.; project administration, Z.Z., L.M., J.K.; funding acquisition, M.S. All authors have read and agreed to the published version of the manuscript.
Funding
The first author would like to acknowledge the funding support provided by the InnovateUK Industrial Strategy Challenge Fund 2020 through Kent Innovation & Enterprise.
Institutional Review Board Statement
Not applicable.
Informed Consent Statement
Not applicable.
Conflicts of Interest
The authors declare no conflict of interest.
References
- Global Wind Energy Council (GWEC). Global Offshore Wind Report 2020. Available online: https://gwec.net/global-offshore-wind-report-2020/ (accessed on 15 January 2021).
- The Crown Estate. Guide to an Offshore Wind Farm. Prepared by BVG Associates for The Crown Estate and the Offshore Renewable Energy Catapult. April 2019. Available online: https://www.thecrownestate.co.uk/media/2861/guide-to-offshore-wind-farm-2019.pdf (accessed on 15 January 2021).
- Shafiee, M.; Brennan, F.; Espinosa, I.A. A parametric whole life cost model for offshore wind farms. Int. J. Life Cycle Assess. 2016, 21, 961–975. [Google Scholar] [CrossRef]
- Sundqvist, L. Cellular Controlled Drone Experiment: Evaluation of Network Requirements. Master’s Thesis, School of Electrical Engineering, Aalto University, Aalto, Finland, 2015. Available online: https://core.ac.uk/download/pdf/80718005.pdf (accessed on 15 January 2021).
- Creutzburg, R. European activities in civil applications of drones: An overview of remotely piloted aircraft systems (RPAS). In Proceedings of the SPIE Proceedings Vol. 9497: Mobile Multimedia/Image Processing, Security, and Applications, Baltimore, MD, USA, 21 May 2015. [Google Scholar]
- Santos, T.; Moreira, M.; Almeida, J.; Dias, A.; Martins, A.; Dinis, J.; Formiga, J.; Silva, E. PLineD: Vision-based power lines detection for unmanned aerial vehicles. In Proceedings of the IEEE International Conference on Autonomous Robot Systems and Competitions, Coimbra, Portugal, 26–28 April 2017. [Google Scholar]
- Jordan, S.; Moore, J.; Hovet, S.; Box, J.; Perry, J.; Kirsche, K.; Lewis, D.; Tse, Z.T.H. State-of-the-art technologies for UAV inspections. IET Radar Sonar Navig. 2018, 12, 151–164. [Google Scholar] [CrossRef]
- Høglund, S. Autonomous Inspection of Wind Turbines and Buildings Using an UAV. Master’s Thesis, Department of Engineering Cybernetics, Norwegian University of Science and Technology (NTNU), Trondheim, Norway, 2014. Available online: https://ntnuopen.ntnu.no/ntnu-xmlui/handle/11250/261286 (accessed on 31 January 2021).
- Frederiksen, M.H.; Knudsen, M.P. Drones for Offshore and Maritime Missions: Opportunities and Barriers; University of Southern Denmark: Odense, Denmark, 2018; Available online: https://eicluster.dk/sites/default/files/publications/drones_for_offshore_and_maritime_missions_sdu_spring_2018.pdf (accessed on 15 January 2021).
- Stout, C.; Thompson, D. UAV Approaches to Wind Turbine Inspection: Reducing Reliance on Rope-Access. Offshore Renewable Energy Catapult. March 2019. Available online: https://s3-eu-west-1.amazonaws.com/media.newore.catapult/app/uploads/2019/03/28161605/Cyberhawks-Approach-to-UAV-Inspection-Craig-Stout-ORE-Catapult.pdf (accessed on 15 January 2021).
- Galleguillos, C.; Zorrilla, A.; Jimenez, A.; Diaz, L.; Montiano, Á.L.; Barroso, M.; Viguria, A.; Lasagni, F. Thermographic non-destructive inspection of wind turbine blades using unmanned aerial systems. Plast. Rubber Compos. 2015, 44, 98–103. [Google Scholar] [CrossRef]
- Shivaram, S. Structural Health Monitoring of Wind Turbine Blades Using Unmanned Air Vehicles. Master’s Thesis, Trinity College Dublin, Dublin, Ireland, 2015. Available online: https://www.scss.tcd.ie/publications/theses/diss/2015/TCD-SCSS-DISSERTATION-2015-054.pdf (accessed on 30 January 2021).
- Zhang, D.; Burnham, K.; McDonald, L.; MacLeod, C.; Dobie, G.; Summan, R.; Pierce, G. Remote inspection of wind turbine blades using UAV with photogrammetry payload. In Proceedings of the 56th Annual British Conference of Non-Destructive Testing, Telford, UK, 5–7 September 2017. [Google Scholar]
- Zhao, X.; Osborne, M.; Lantair, J.; Robu, V.; Flynn, D.; Huang, X.; Fisher, M.; Papacchini, F.; Ferrando, A. Towards integrating formal verification of autonomous robots with battery prognostics and health management. In Proceedings of the International Conference on Software Engineering and Formal Methods, Oslo, Norway, 18–20 September 2019. [Google Scholar]
- Barnes, M.; Brown, K.; Carmona, J.; Cevasco, D.; Collu, M.; Crabtree, C.; Crowther, W.; Djurovic, S.; Flynn, D.; Green, P.R.; et al. Technology Drivers in Windfarm Asset Management. Home Offshore. 2018. Available online: https://doi.org/10.17861/20180718 (accessed on 15 January 2021).
- Robu, V.; Flynn, D.; Lane, D.M. Train robots to self-certify their safe operation. Nature 2018, 553, 281. [Google Scholar] [CrossRef] [PubMed]
- Fisher, M.; Collins, E.C.; Dennis, L.A.; Luckcuck, M.; Webster, M.; Jump, M.; Page, V.; Patchett, C.; Dinmohammadi, F.; Flynn, D.; et al. Verifiable self-certifying autonomous systems. In Proceedings of the IEEE International Symposium on Software Reliability Engineering Workshops, Memphis, TN, USA, 15–18 October 2018; pp. 341–348. [Google Scholar]
- Zhao, X.; Robu, V.; Flynn, D.; Dinmohammadi, F.; Fisher, M.; Webster, M. Probabilistic model checking of robots deployed in extreme environments. In Proceedings of the 33rd AAAI Conference on Artificial Intelligence, Honolulu, HI, USA, 27 January–1 February 2019; pp. 8066–8074. [Google Scholar]
- Petritoli, E.; Leccese, F.; Ciani, L. Reliability and maintenance analysis of unmanned aerial vehicles. Sensors 2018, 18, 3171. [Google Scholar] [CrossRef] [PubMed]
- Osborne, M.; Lantair, J.; Shafiq, Z.; Zhao, X.; Robu, V.; Flynn, D.; Perry, J. UAS operators safety and reliability survey: Emerging technologies towards the certification of autonomous UAS. In Proceedings of the 4th International Conference on System Reliability and Safety, Rome, Italy, 20–22 November 2019; pp. 203–212. [Google Scholar]
- Bouzid, O.M. In-Situ Health Monitoring for Wind Turbine Blade Using Acoustic Wireless Sensor Networks at Low Sampling Rates. Ph.D. Thesis, Newcastle University, Newcastle, UK, 2013. [Google Scholar]
- Karyotakis, A. On the Optimisation of Operation and Maintenance Strategies for Offshore Wind Farms. Ph.D. Thesis, Department of Mechanical Engineering, University College London, London, UK, 2011. [Google Scholar]
- DNV-OS-J101. Design of Offshore Wind Turbine Structures. 2014. Available online: https://rules.dnvgl.com/docs/pdf/DNV/codes/docs/2014-05/Os-J101.pdf (accessed on 15 January 2021).
- Jamieson, P. Innovation in Wind Turbine Design, 2nd ed.; John Wiley & Sons: Hoboken, NJ, USA, 2018. [Google Scholar]
- COPTRZ. Fixed Wing vs Multirotor Drones for Surveying. 2018. Available online: https://www.coptrz.com/fixed-wing-vs-multirotor-drones-for-surveying/ (accessed on 15 January 2021).
- Chapman, A. Types of Drones: Multi-Rotor vs Fixed-Wing vs Single Rotor vs Hybrid VTOL. Australian DRONE Magazine. Available online: https://www.auav.com.au/articles/drone-types/ (accessed on 15 January 2021).
- Stokkeland, M. A Computer Vision Approach for Autonomous Wind Turbine Inspection Using a Multicopter. Master’s Thesis, Department of Engineering Cybernetics, Norwegian University of Science and Technology, Trondheim, Norway, 2014. [Google Scholar]
- Adedipe, T.; Shafiee, M.; Zio, E. Bayesian network modelling for the wind energy industry: An overview. Reliab. Eng. Syst. Saf. 2020, 202, 107053. [Google Scholar] [CrossRef]
- Dinmohammadi, F.; Shafiee, M. A fuzzy-FMEA risk assessment approach for offshore wind turbines. Int. J. Progn. Health Manag. 2013, 4, 59–68. [Google Scholar]
- BS EN IEC 60812. Failure Modes and Effects Analysis (FMEA and FMECA); The British Standards Institution: London, UK, 2018; Available online: https://shop.bsigroup.com/ProductDetail?pid=000000000030310523 (accessed on 15 January 2021).
- Shafiee, M.; Dinmohammadi, F. An FMEA-Based Risk Assessment Approach for Wind Turbine Systems: A Comparative Study of Onshore and Offshore. Energies 2014, 7, 619–642. [Google Scholar] [CrossRef]
- FLIR Systems, Inc. FLIR T650sc High Resolution Handheld Infrared Camera|FLIR Systems. 2018. Available online: https://www.flir.co.uk/products/t650sc (accessed on 15 January 2021).
- FLIR Systems, Inc. What is the Difference between P600 Series (P620, P640 & P660) Cameras?|FLIR Systems. Available online: https://www.flir.co.uk/support-center/Instruments/what-is-the-difference-between-p600-series-p620-p640--p660-cameras/ (accessed on 15 January 2021).
- FLIR Systems, Inc. FLIR T1020 HD Thermal Camera with Viewfinder|FLIR Systems. 2018. Available online: https://www.flir.co.uk/products/t1020/ (accessed on 15 January 2021).
- Špinka, O.; Holub, O.; Hanzálek, Z. Low-cost reconfigurable control system for small UAVs. IEEE Trans. Ind. Electron. 2011, 58, 880–889. [Google Scholar] [CrossRef]
- Logan, M.J.; Glaab, L.J. Failure mode effects analysis and flight testing for small unmanned aerial systems. In Proceedings of the 17th AIAA Aviation Technology, Integration, and Operations Conference, Denver, CO, USA, 5–9 June 2017. [Google Scholar]
- RC Wing. DJI N3 Flight Controller. 2019. Available online: https://www.rc-wing.com/dji-n3-flight-controller.html (accessed on 15 January 2021).
- Tower Hobbies. Futaba 10JH 10-Channel Heli T-FHSS System. 2019. Available online: https://www.towerhobbies.com/cgi-bin/wti0001p?I=FUTK9201 (accessed on 15 January 2021).
- Foxtech Hobby. Foxtech Brushless Motor X5010 KV288. 2019. Available online: https://www.foxtechfpv.com/foxtech-brushless-motor-x5010-kv288-p-2015.html (accessed on 15 January 2021).
- Hobby wing. Platinum PRO V4 40A. 2019. Available online: https://www.hobbywingdirect.com/products/platinum-pro-v4-40a?variant=37395262481 (accessed on 15 January 2021).
- Foxtech Hobby. 1855 MKII Carbon Fiber Propeller CW&CCW. 2019. Available online: https://www.foxtechfpv.com/1855-mkii-carbon-fiber-propeller-cw-ccw.html (accessed on 15 January 2021).
- Hobby King. Turnigy Reaktor QuadKore 4 x 300W 20A. 2019. Available online: https://hobbyking.com/en_us/turbo-charger-1200w-4-300w-synchronous-balance-charger-discharger-version-2.html?___store=en_us (accessed on 15 January 2021).
- Hobby King. Turnigy High Capacity 10000mAh 6S 12C Lipo Pack w/XT90. 2019. Available online: https://hobbyking.com/en_us/turnigy-high-capacity-10000mah-6s-12c-multi-rotor-lipo-pack-w-xt90.html (accessed on 15 January 2021).
- DJI. ZENMUSE Z30. 2019. Available online: https://www.dji.com/uk/zenmuse-z30 (accessed on 15 January 2021).
- Foxtech Hobby. Tarot T960 CF Folding Hexacopter (TL960A). 2019. Available online: https://www.foxtechfpv.com/tarot-t960-cf-folding-hexacopter-p-1082.html (accessed on 15 January 2021).
- De Oliveira Martins Franco, B.J.; Sandoval Góes, L.C. Failure analysis methods in unmanned aerial vehicle (UAV) applications. In Proceedings of the 19th International Congress of Mechanical Engineering, Brasília, Brazil, 5–9 November 2007. [Google Scholar]


Publisher’s Note: MDPI stays neutral with regard to jurisdictional claims in published maps and institutional affiliations. |
© 2021 by the authors. Licensee MDPI, Basel, Switzerland. This article is an open access article distributed under the terms and conditions of the Creative Commons Attribution (CC BY) license (http://creativecommons.org/licenses/by/4.0/).