3.3.2. Echosounder Accuracy Analysis
The theoretical bathymetric accuracy and resolution achieved by the survey depends primarily on the characteristics of the echosounder, the conditions of the water body, the bed morphology, as well as the survey design [
27]. These compound factors affect the accuracy in varying ways, and if not compensated for need to be taken into account for the estimation of the accuracy of the depth measurements.
The ES120-7C transducer operates at a beam opening (beam width) of 7°. The conical geometry of the beam produces a depth-dependent floor imprint that can, thus, be approximated by a circle of radius:
Knowing the maximum depth in advance, this translates to an imprint radius of ~3.67 m (for a depth of 60 m), hence a diameter of ~7.34 m. An average depth of 40.87 m would result in a 5 m imprint diameter, which is also comparable to the expected accuracy of the GPS receiver utilized for the purpose of positioning. Combining these two observations with the fact that a significant part of the lake is deeper than ~40 m, the minimum feasible spatial resolution for a DTM model would be 10 × 10 m.
The accuracy of the depth is dependent on a number of factors. The impact of each factor is analyzed in more detail.
- i.
Bottom Slope
Variations in bottom slope can have significant effects in many hydroacoustic applications, in particular by introducing a zone of uncertainty close to the bottom known as the dead-zone [
28]. For a measurement
zm, the error in depth
dz caused by the slope of the bottom (represented as the zenith angle of the bottom surface normal vector
ζ) when no correction is applied for slopes smaller than half the beam-width (i.e., 3.5 degrees), such as those of Lake Trichonis, amounts to [
27]:
The average slope of the lake bottom, based on the pre-existing map-derived data, was calculated to be 1.3° ± 1.2° for a range of [0.03°, 11.44°], a median of 0.89° and a 3rd quartile value of 1.76°. Using the SONAR-measured depth at each point and the slope for the specific pixel, the error estimate was calculated for all points of the dataset at 0.061 ± 0.019 m for a range of [0.01 m, 0.10 m], a median value of 0.062 m and a 3rd quartile value of 0.072 m. For the purpose of the study, the worst-case error,
dzmax, was equal to ~0.104 m. To model the error for the total calculation, the 3rd quartile slope value was used (1.76°) to express the error as a function of depth:
- ii.
Sound Velocity Variations
Sound velocity variations can be categorized into measurement variations and spatiotemporal variations [
27] Because of calibration, one day prior to the actual survey, measurement variations were considered almost fully compensated for. However, spatiotemporal variations pose a significant problem in the modeling, and as a result require special attention. As Chen and Millero [
29] pointed out, lake water cannot be considered pure water, despite a multitude of limnologists considering it as such, but can only be modeled as such by accounting for dissolved salts as a total mass fraction. To facilitate calculations, a simplified lake water sound–speed equation was considered [
30]:
Equation (4) is valid for a temperature range of 10–40 °C [
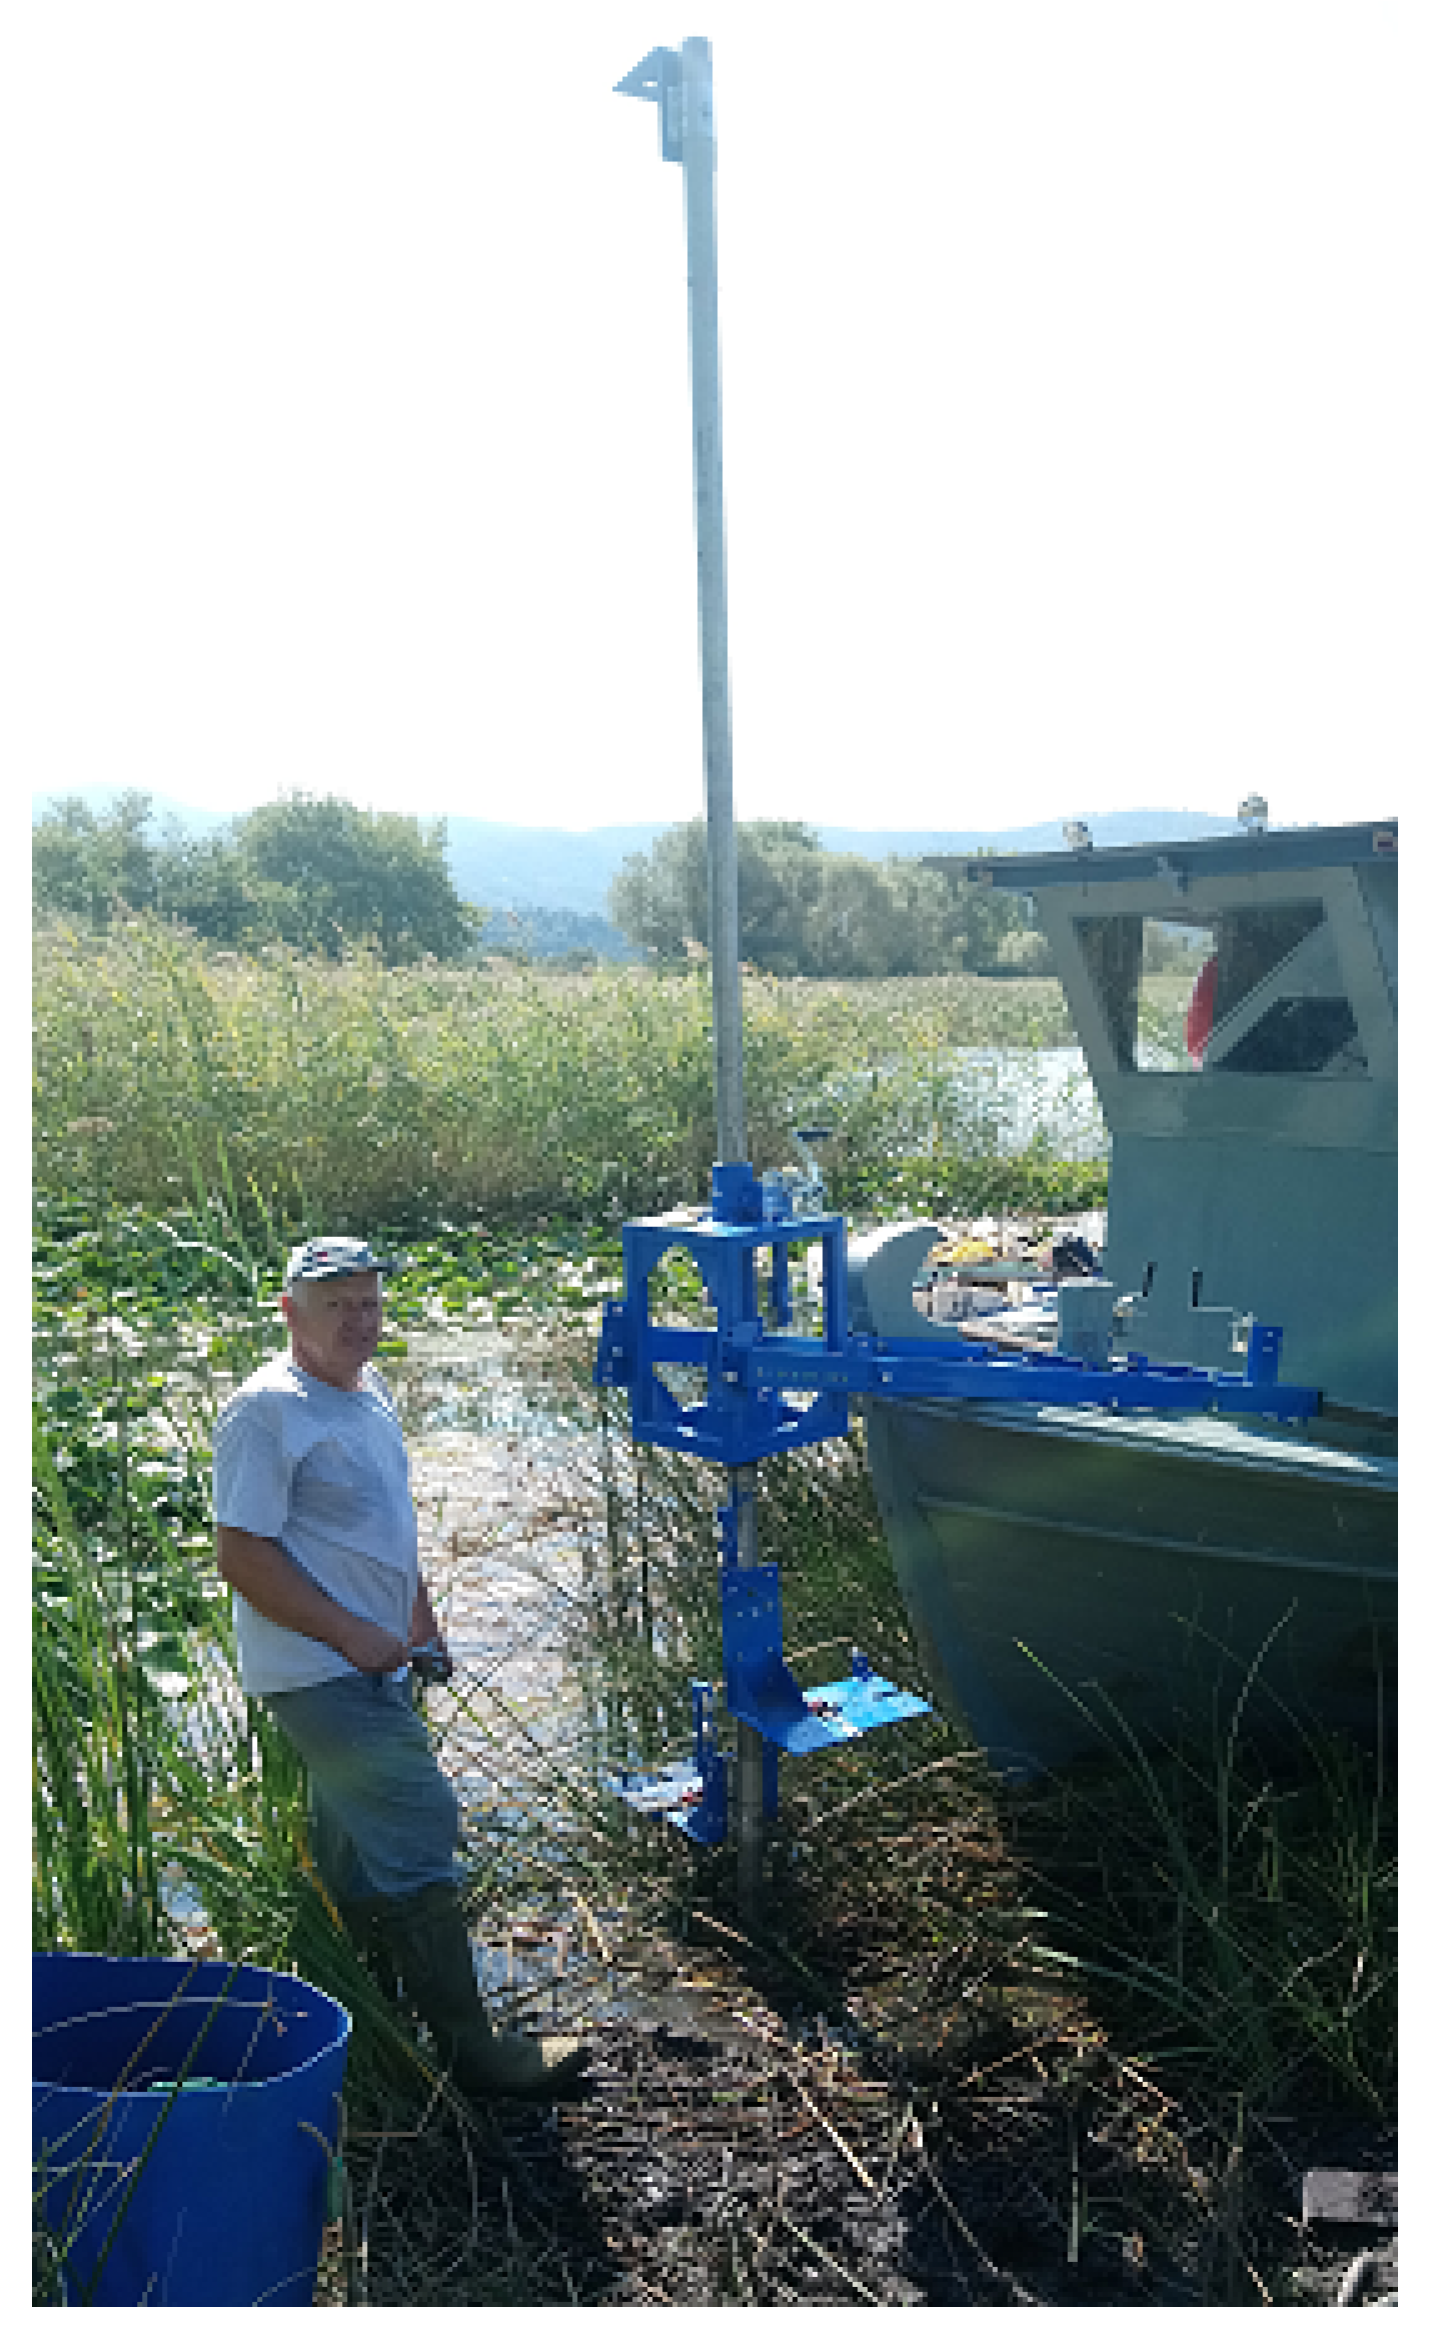
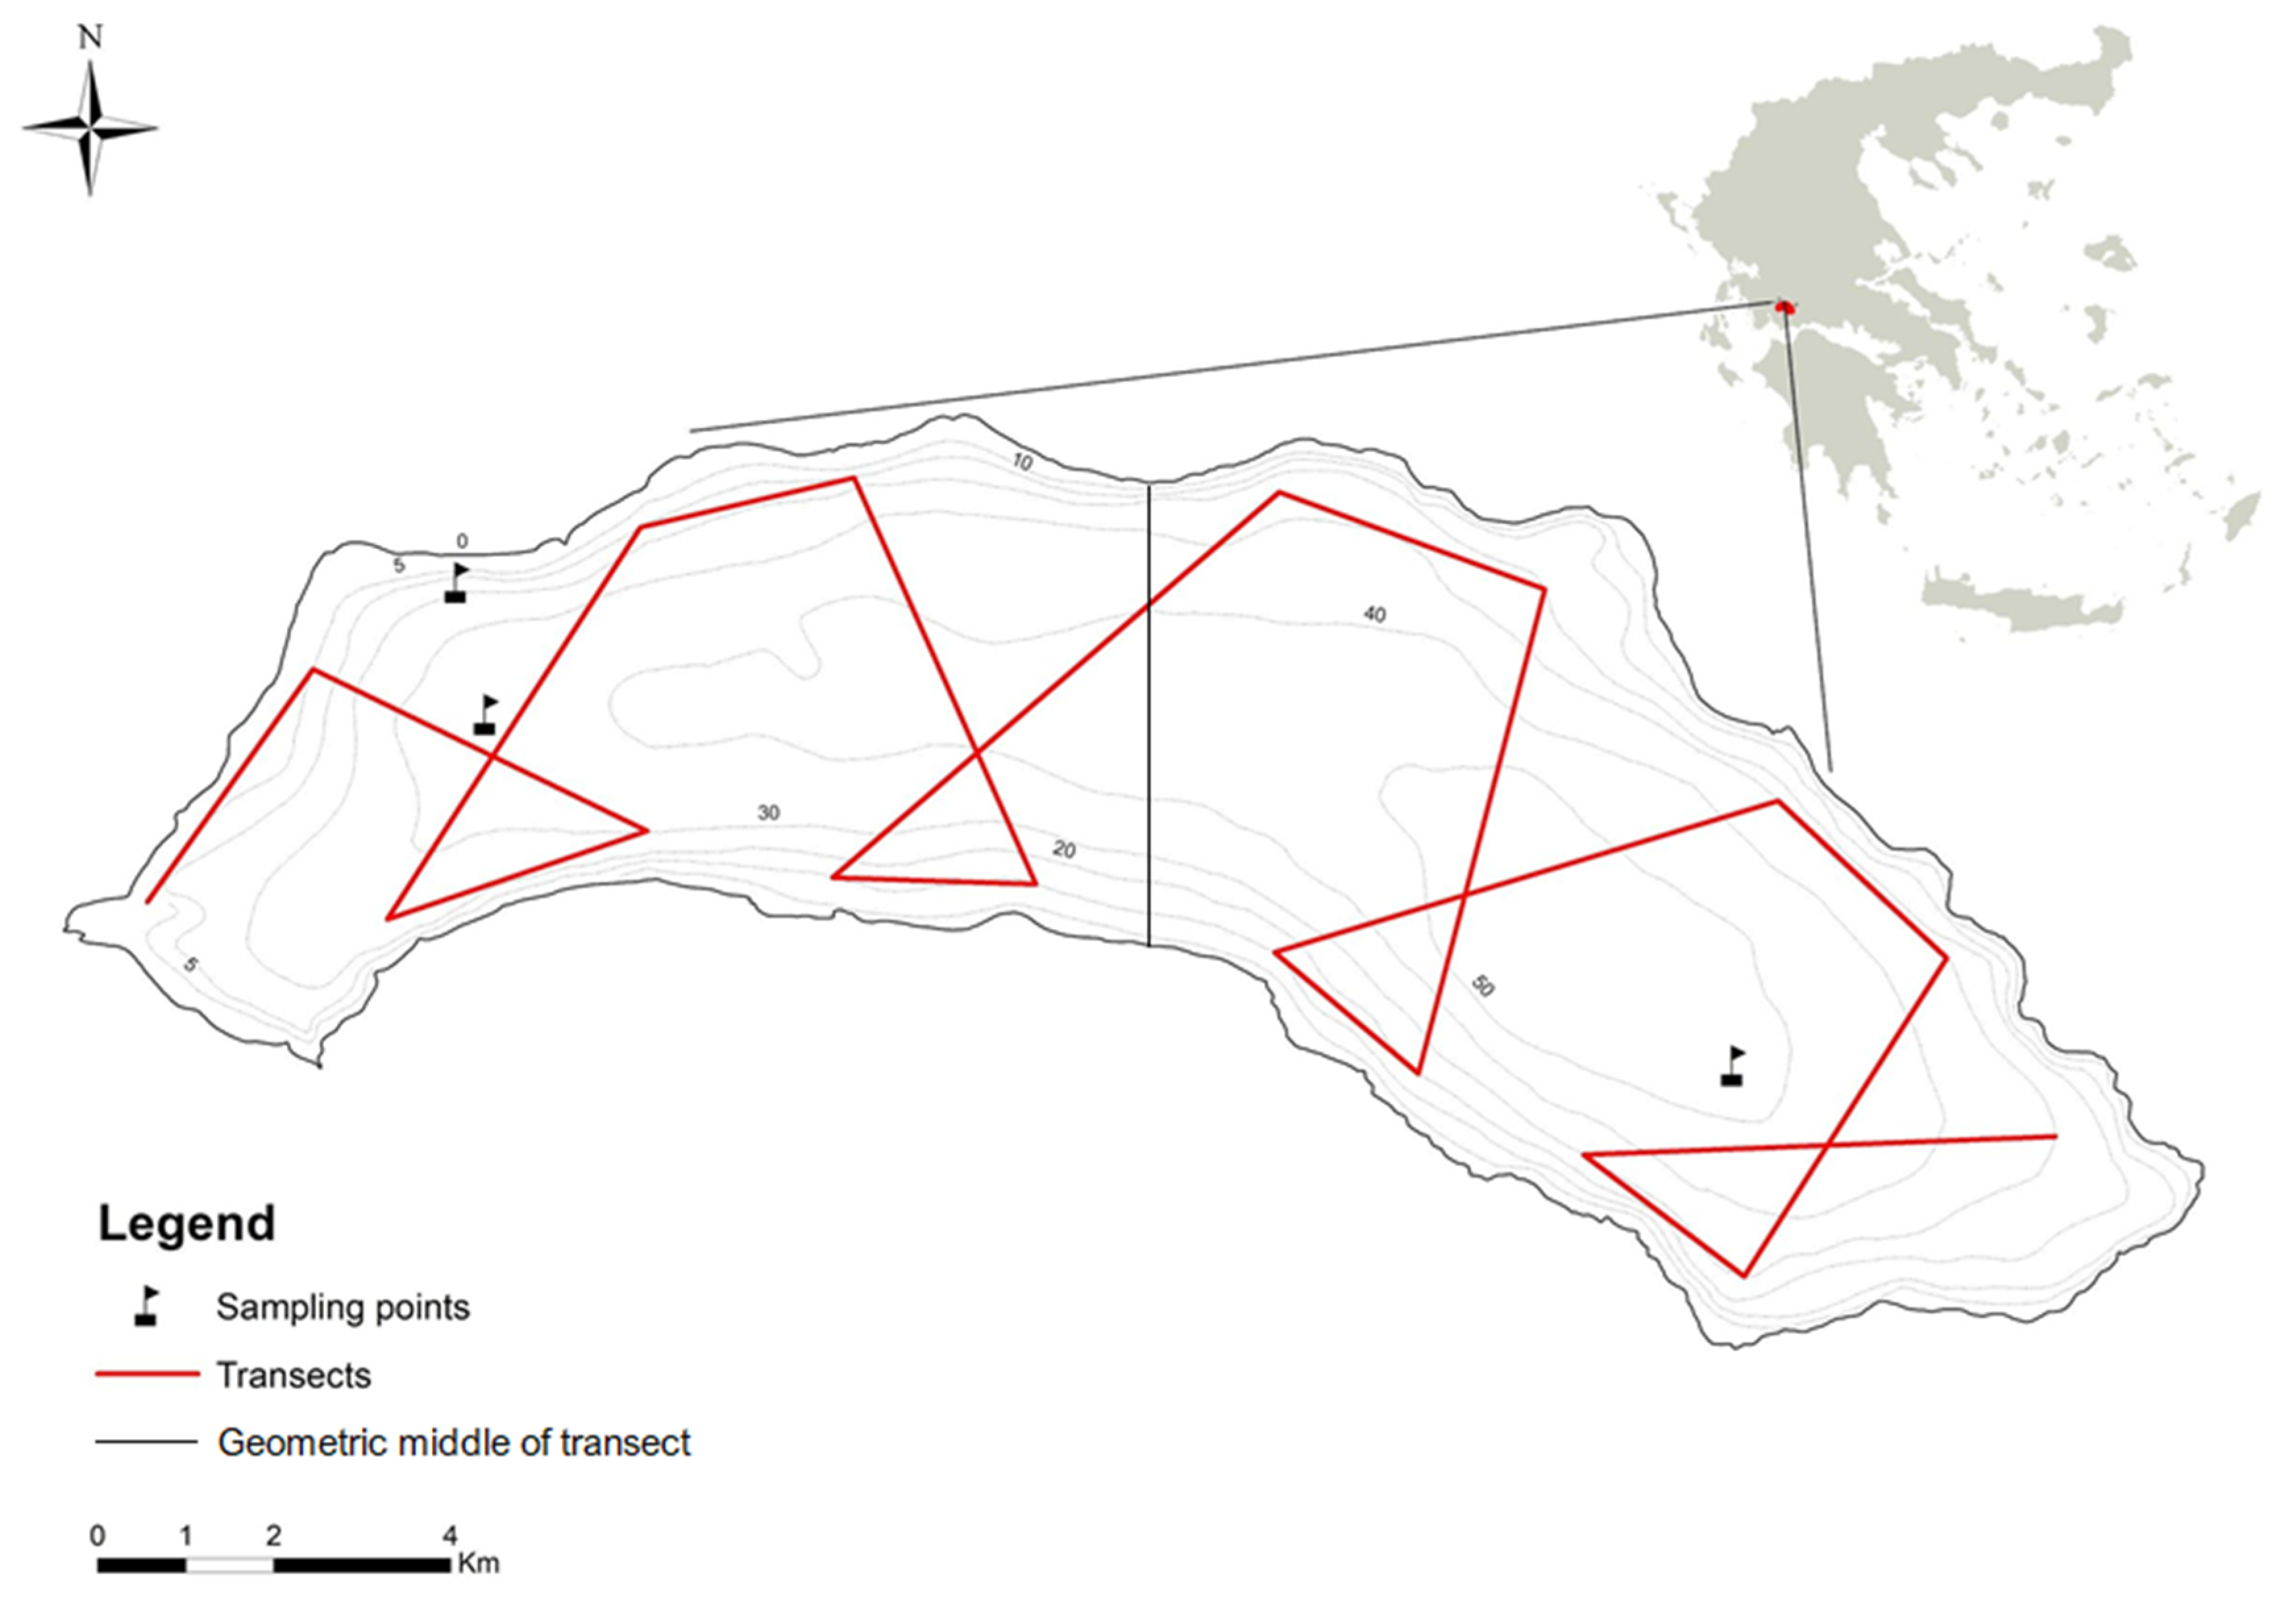
30], with a general reported maximum error of ~0.18 m/s (absolute value). Based on samplings at 3 locations (
Figure 5), the temperatures recorded ranged from ~25 °C (surface layer) down to ~11 °C (hypolimnion). The 1-m depth interval recordings allowed the calculation of an overall standard deviation of the vertical distribution, which was equal to +/− 5.26, 4.77 and 4.35 °C for each station (in order of decreasing depth). The law of covariance propagation can be used to determine the standard deviation of sound velocity based on Equation (4):
Considering the average temperature of (25 + 11)/2 = 18 °C and the worst-case standard deviation of 5.26 °C, the sound velocity standard deviation is calculated as
σc = ~17.07 m/s. The uncertainty propagation equation given in [
27] for the depth error based on sound velocity variations is:
In Equation (6),
σcm accounts for sound velocity measurement variations and is considered to be compensated for through the instrument calibration procedure, i.e., is excluded from the equation. The
σc parameter represents the spatiotemporal variations in sound velocity and corresponds to the value that was calculated above. Using this value and an average sound velocity based on the average temperature of 18 °C and Equation (4) equal to 1475.85 m/s, Equation (6) becomes:
For the worst-case depth of ~60 m, Equation (7) yields a depth error of ~0.69 m.
- iii.
Time-Dependent Variations
The pulse length is an important determinant of the range resolution of transmission-based range measurement systems. According to Johannesson and Mitson [
31], the physical length of the SONAR pulse in the water determines the vertical resolution between targets, i.e., provides the minimum separation distance between echoes. The pulse length is, therefore, also a determinant of the range accuracy, as it affects the minimum detectable height difference. This resolution can be calculated as half of the physical pulse length [
31]:
Equation (8) corresponds to the average sound velocity in water, while τ represents the pulse duration. In this study, the pulse duration was set to 0.128 ms, and using the previously calculated average sound velocity of 1475.85 m/s the nominal vertical resolution is equal to σz(t) = ~0.094 m, regardless of the actual depth.
- iv.
Water-Undulation-Related Variations
Variations due to the physical displacement of the device caused by natural undulations of the water surface also need to be accounted for [
27]. Because the measurements were performed on windless days and with a moving vessel, pitch and heave were kept to a minimum. In order to estimate the effect of roll or heel (departure from the plumbline), this was calculated using the approximate vessel body geometry and the transect geometry along the trip, following appropriate adapted calculations of banked turns [
32]. Approximating the turn radius along the trip as the local radius of curvature of the horizontal transect geometry, the minimum turn radius was determined to be ~130 m. Based on this value and using an approximate vessel body geometry and an average vessel travel velocity of 6 km/h, the worst case heel was calculated at ~0.18°, with an average value of 0.02° ± 0.03° along the transect. A worst-case divergence of
ds =
h ×
tan(0.18°) = ~0.003 ×
d (m) in the footprint is expected in the measurements. Given Equation (1), the ratio of (
ds/Rimprint-circle) =
tan(0.18°)/
tan(3.5°) = ~0.05 in the worst case, i.e., ~5% over the total footprint, which is well within the spatial resolution of the produced raster (24 × 30 m), even for the largest depth values (e.g., ~18 cm for a worst-case footprint radius of 3.67 m). Furthermore, the worst-case effect introduced by this divergence on the vertical component of the measurements would be equal to 1/
cos(0.18°) = 4.93 ppm, which is too small to produce a noticeable effect on the results.
Draft, settlement and squat all introduce a vertical displacement to the transducer, which is important to take into account with respect to the vertical accuracy of the measurements. In this study, the transducer was installed onto a bespoke supporting platform infrastructure providing suitable support for, and placed outside of, the boat. To compensate for the effects of draft, settlement and squat, the submersion level of the transducer was appropriately measured directly onto the transducer-supporting platform during the traversal, while the vessel was in full motion. Therefore, the sum of all effects was compensated for by adding the measured transducer submersion depth to all measurements.
Lake surface water level oscillation due to potential surface seiche effects was assessed using the empirically calculated maximum period of
T =
, where
L is the bank-to-bank length,
h is the average depth and
g is the force of gravity [
33,
34]. Taking length values of ~19 km for the east–west bank distance and 5 km for the north–south bank distance, an average depth of 40.87 m and a value of 9.81 m/s
2 for the gravitational acceleration, the maximum east–west seiche period was calculated to be ~31.6 minutes for the east–west waves and ~8.3 min for the north–south waves. These periods constitute fractions of the total time of transect measurements (~4–5 h each), thus introducing a homogeneous distortion over the ensonified area of the lake, with areas of elevation and areas of depression with respect to the mean level being uniformly scattered in spatial terms. Additionally, the amplitude of those waves is expected to be very small on average, to the order of a few cm for moderately-sized lakes [
34]. Therefore, it can be expected that those will be cancelled out in the statistical analyses, as the primary focus of this study is on the overall average accuracy of the studied data.
- v.
Vertical Datum Error
In order to use the SONAR-acquired bathymetric measurements for absolute-scale comparisons, it is necessary to reduce the measured depths to an externally fixed vertical-reference system (vertical datum). In general, this error is not directly related to the echosounder instrument itself, but it indirectly affects the reliability (external precision) of the measurements.
Considering a 2-sigma interval (95% confidence), thus replacing the
σ of each relevant parameter with (2
σ), the law of variance–covariance propagation was used to determine the bathymetric accuracy as a function of depth [
27]:
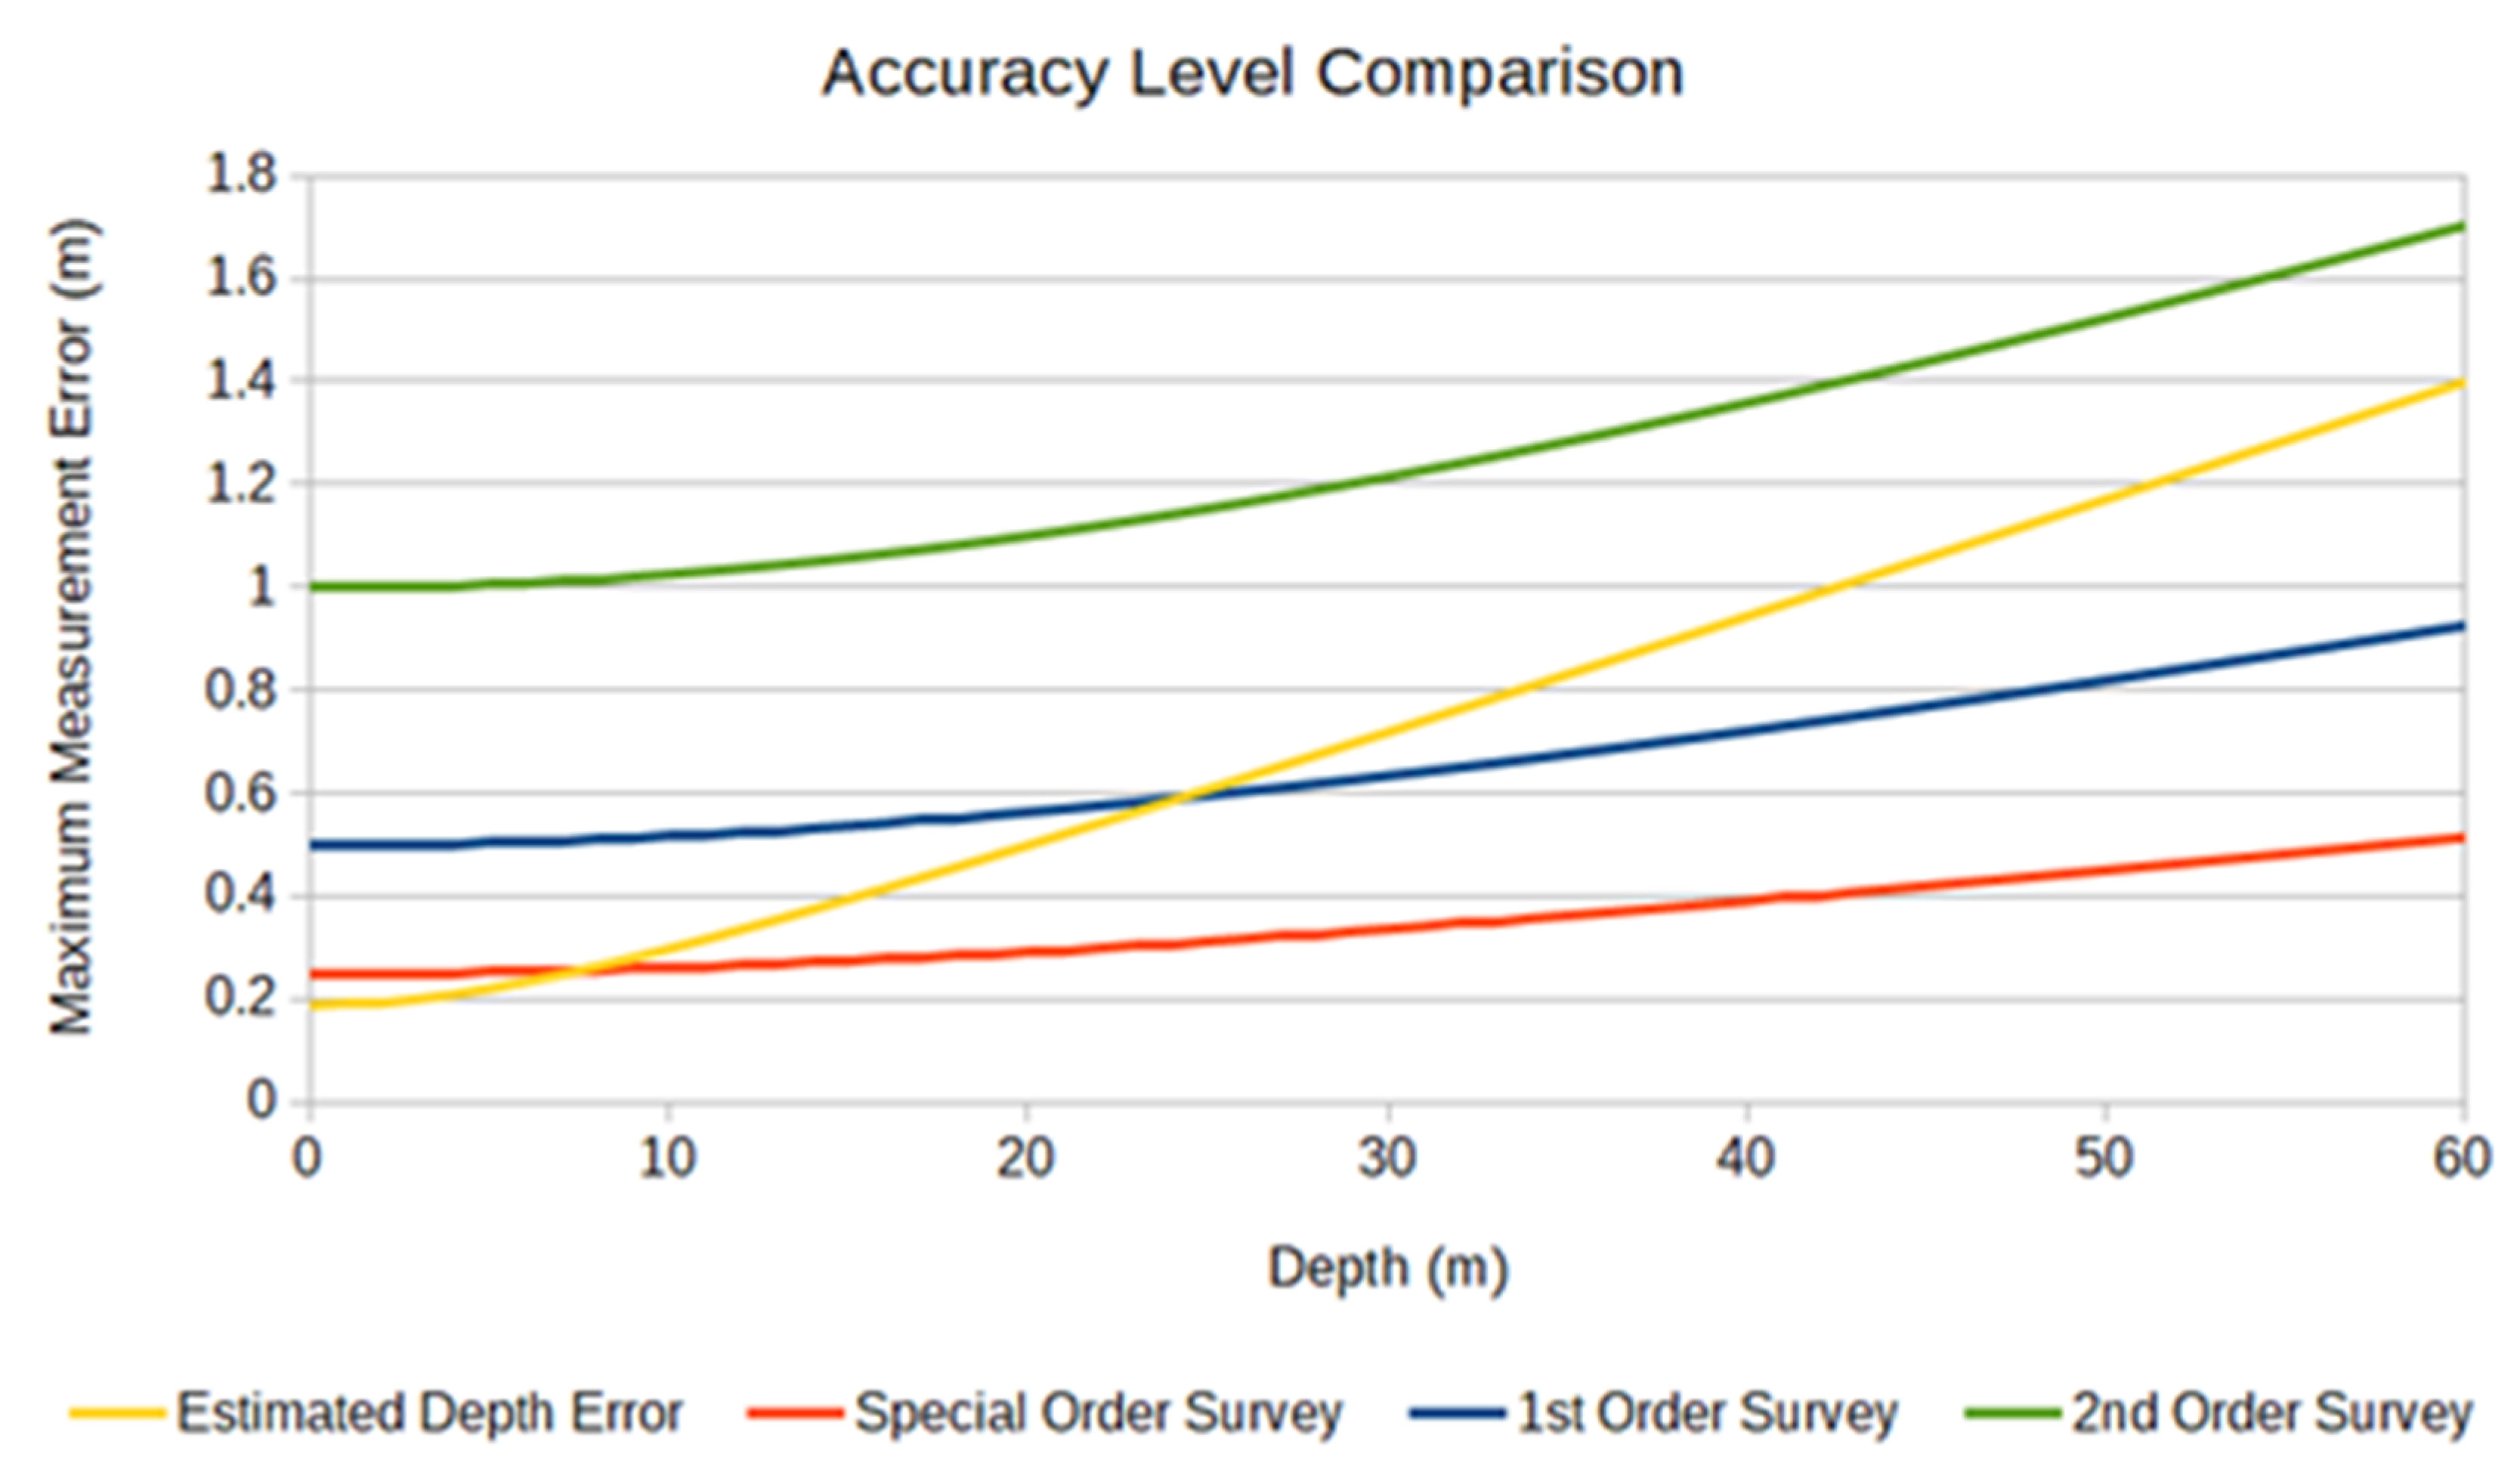
To assess the error budget, the S-44 requirements document was used [
35]. The measurement accuracy estimation based on the conditions of this work, as described by Equation (9), was plotted against the corresponding requirements for a special order survey, as well as those for a 1st order survey. The results are shown in
Figure 7. The estimated accuracy falls within the error margins of a 1st order survey (up to a depth of 24 m) and entirely within the error margins of a 2nd order survey (up to the maximum depth of 60 m). Additionally, the horizontal accuracy is entirely within the error margins of a 1st order survey (5 meters +/− 5% of depth) [
35].
3.3.3. Data Processing
The collected hydroacoustic data were processed to obtain bathymetric information in the form of dense depth measurement points taken along the sampled transects. To ensure equally distributed weight among the evaluated DTM pixels and increased vertical accuracy, data measured multiple times over the same pixels were averaged.
The echosounder-derived bathymetric values were then converted into elevation (DTM) values by taking into account a suitable value for the mean water level of the lake. Information regarding the mean lake level at the time of the measurements was retrieved via the DAHITI (Database for Hydrological Time Series of Inland Waters) at the Lake Trichonis virtual station [
36]. This information is acquired through appropriate processing of satellite altimetry data acquired from the Sentinel-3A satellite. The lake level data point from the DAHITI dataset for Lake Trichonis was characterized by a determination date difference of less than 2 days compared to the date of the echosounder measurements, with a value of 15.762 ± 0.013 m (7 October 2019). This value is in agreement with the latest regulation facilities constructed around Lake Trichonis. Specifically, the connecting canal between Lakes Trichonis and Lysimachia allows the regulation of the lake level from its old altitude of +18 m to altitudes ranging between 13.5 and 16.0 m. During the winter, large volumes of outflow are observed from Lake Trichonis while its level is significantly increased (by >1.5 m), which also results in an increased constant outflow towards Lake Lysimachia [
19].
This lake level value of 15.762, which was used to reduce the bathymetric information to absolute elevations, is a normal height, in contrast to the DTM values, which are orthometric heights. However, because of the proximity of the area to the reference surface of the mean sea level (<50 m of absolute altitude), deviations between normal and orthometric heights are minimal [
37] and well below the actual determination accuracy of the absolute altitude values themselves, both for the DTM and the echosounder measurements. Furthermore, large-scale studies (at the country and continent level) reveal a temporal variation of a few mm (generally <2 mm/year) in absolute geoid height as a long-term trend over the last few decades [
38,
39,
40], whereas in Greece, average mean sea level variations slightly higher than that are also reported, e.g., 2.3 mm/year [
41]. Therefore, the worst case total variation of ~16 cm for a timespan of 70 years is also insignificant with respect to the determination accuracy of the depth values, while the actual value is expected to be significantly smaller due to the existence, to some extent, of counter-balancing sub-periods in the last 70 years, as those are expected to cancel out a percentage of the total change magnitude. For all of the aforementioned reasons, no compensation was applied for those effects in the analyses.
The resulting dataset was subsequently used as the basis for the assessment of the DTM produced from the topographic maps, while the validation was performed at the relative and absolute levels, as well as in the form of a morphometric analysis.


 ,
, 


