Article

Evaluating Social Distancing Measures and Their Association with the Covid-19 Pandemic in South America

by
Gisliany Lillian Alves de Oliveira
1,
Luciana Lima
2,
Ivanovitch Silva
1,
Marcel da Câmara Ribeiro-Dantas
3,
Kayo Henrique Monteiro
4 and
Patricia Takako Endo
4,*
1
Instituto Metrópole Digital, Universidade Federal do Rio Grande do Norte, Natal 59078-970, Brazil
2
Programa de Pós-Graduação em Demografia, Universidade Federal do Rio Grande do Norte, Natal 59078-970, Brazil
3
Laboratoire Physico Chimie Curie, Institut Curie, Université PSL, CNRS UMR168, Sorbonne Université, 75005 Paris, France
4
Programa de Pós-Graduação em Engenharia da Computação, Universidade de Pernambuco, Recife 50720-001, Brazil
*
Author to whom correspondence should be addressed.
ISPRS Int. J. Geo-Inf. 2021, 10(3), 121; https://doi.org/10.3390/ijgi10030121
Submission received: 27 December 2020 / Revised: 22 February 2021 / Accepted: 24 February 2021 / Published: 1 March 2021
(This article belongs to the Collection Spatial Components of COVID-19 Pandemic)

Abstract

:
Social distancing is a powerful non-pharmaceutical intervention used as a way to slow the spread of the SARS-CoV-2 virus around the world since the end of 2019 in China. Taking that into account, this work aimed to identify variations on population mobility in South America during the pandemic (15 February to 27 October 2020). We used a data-driven approach to create a community mobility index from the Google Covid-19 Community Mobility and relate it to the Covid stringency index from Oxford Covid-19 Government Response Tracker (OxCGRT). Two hypotheses were established: countries which have adopted stricter social distancing measures have also a lower level of circulation (H1), and mobility is occurring randomly in space (H2). Considering a transient period, a low capacity of governments to respond to the pandemic with more stringent measures of social distancing was observed at the beginning of the crisis. In turn, considering a steady-state period, the results showed an inverse relationship between the Covid stringency index and the community mobility index for at least three countries (H1 rejected). Regarding the spatial analysis, global and local Moran indices revealed regional mobility patterns for Argentina, Brazil, and Chile (H1 rejected). In Brazil, the absence of coordinated policies between the federal government and states regarding social distancing may have played an important role for several and extensive clusters formation. On the other hand, the results for Argentina and Chile could be signals for the difficulties of governments in keeping their population under control, and for long periods, even under stricter decrees.

1. Introduction

In late 2019, Chinese authorities began reporting cases of pneumonia of unknown aetiology in the city of Wuhan, located in the Hubei province, in the central region of that country. Within a few weeks, other nations in the region reported similar cases, indicating that a new type of coronavirus was in circulation, the SARS-CoV-2. On 11 March 2020, the World Health Organisation (WHO) declared a global pandemic by Covid-19 [1]. While, in the first weeks of March 2020, China already showed a tendency to stabilise the number of cases of people infected with SARS-CoV-2 [2,3], Italy stood out as the global epicentre of the disease [3]. Faced with a critical scenario of deaths and cases confirmed by the novel coronavirus, the Italian government drastically reduced mobility through lockdown measures, which seems to have produced effects on the Covid-19 outbreak, which has shown signs of contention since April 2020 [2]. Other European countries, like Spain, Germany, France, and Sweden, were also struck by the Covid-19 pandemic [4].
A few months later, the region of the Americas became the global epicentre of the Covid-19, with the United States and Brazil being the leaders in terms of number of deaths and confirmed cases [5]. Until 31 October 2020, the American continent had more than 20 million cases of Covid-19, the largest of all regions in the world [6].
A central aspect for the success of the measures that aim to contain the spread of the virus is social distancing. According to experts, actions, such as the suspension of school activities, the practice of home office, reduction in the use of public transport, cancellation of sporting events, and other activities that involve a large number of people, and the use of digital technologies for daily communication, can make a difference in the level of cases and deaths from Covid-19 [7,8]. The less social interaction among people, the more distributed the number of new cases over time, thus preventing the health system from collapsing in a scenario of excessive demand for medical care [7,8,9]. Lockdown is the most extreme case of social distancing, in which the objective is to drastically reduce the interaction between people during the Covid-19 pandemic through rules that restrict the movement of the community, or partially within a given location [10,11].
Around the world, a variety of decrees of social distancing have been applied to reduce the spread of the SARS-CoV-2 [12,13,14] virus, achieving favourable results [12,13,15]. However, keeping population mobility under control and for long periods is a challenge for the authorities [14], which can be seen in some countries as the systematic non-compliance with social distancing, even in those more rigid cases of restrictions on mobility. In the study conducted by Reference [16], a “slow erosion” of the lockdown measures was identified, characterised by an increase in the movement of people in places of operation of activities not authorised by the decrees of economic reopening, considering a group of European and North American countries. For low and middle-income countries, maintaining the population under strict social distancing measures becomes even more difficult, due to the worse socioeconomic conditions that a large part of the population falls into. And this represents a series of implications, such as the beginning of the economic reopening in these countries despite the still increasing pace of the number of cases and deaths of Covid-19 [17].
Around September, several European countries started to show a new growth of cases and deaths by Covid-19. In order to contain a possible second wave, the authorities decided to apply again stricter social distancing measures, such as the partial closure of commerce and schools, and the imposition of restrictions on the movement of people on the streets [18].
Some studies focus on the analysis of the impact of social distancing measures on the mobility of people in different regions of the world, without, however, highlighting South America [19,20,21,22,23]. Others present analyses only for some South American capitals [24,25] or identify regional development pattern of Covid-19 without discussing the government strategies to hold down the pandemic [26]. Franch et al. [27] present a review of 63 scientific works on geospatial and spatial-statistical analysis of the geographical dimension of the Covid-19 pandemic, and, regarding the spatial analysis, none of the works found covered South America.
Regarding the analysis of the transmission levels of Covid-19, there are few studies focused on South America [28,29,30]. Due to the diverse profile of the South American region in terms of levels of pandemic advancement and the measures adopted to face the novel coronavirus, as well as concerning cultural, socioeconomic, and political aspects, the main objective of this study is to identify variations in the mobility of people in South America during the Covid-19 pandemic.
Previous studies have highlighted culture as a key element to explain behavioural variations when facing scenarios in which behaviour change is required to control contagious diseases [31,32]. Brito et al. [33] make use of the Earth observation (EO) dataset [34] to analyse the potential to support a risk assessment of Covid-19 from the spatial dimension. They highlight the environmental and social vulnerabilities of slum communities and use two slum areas in Salvador, Brazil, as a case study. Authors state that, along with auxiliary spatial information, such as drone-based local data gathering procedures, the EO dataset would be useful to identify the spatial foci for Covid-19 control measurements. In the study done by Seale et al. [35], adherence to preventive measures against the novel coronavirus in Australia, such as social distancing, was associated with factors, such as greater trust in the government and authorities and a greater perception that the recommendations made by them are efficient. In the study conducted by Huynh [31], it was found that the mobility of the population during the Covid-19 pandemic was lower in nations in which population tends to have a higher perception of risk in relation to Covid-19, considering a group of 58 countries. In Reference [36], using data for the city of Kansas, in the Midwest of the United States of America, authors found the same relationship between risk perception of the novel coronavirus and adherence to measures of social distancing. Studies for other outbreaks also point out that the greater the level of knowledge of individuals regarding the disease, the greater the perception of risks, and also the adherence to preventive measures, such as social distancing [37,38].
The present work established two hypotheses for the mobility trend of the population in ten South American countries: Countries that have adopted stricter social distancing measures have a lower level of movement of people during the pandemic (H1), and mobility is occurring randomly in space during the pandemic (H2). To evaluate these hypotheses, we used Google Community Mobility Reports dataset to construct a mobility index that summarises the Google categories into a single one [39]. In order to compare the level of population mobility with the strictness degree of social distancing measures in each country, we used the Covid stringency index from Oxford Covid-19 Government Response Tracker (OxCGRT). This relationship was also compared taking into account the magnitude of the reproduction number, R ( t ) , obtained from 4 March to 27 October 2020. We performed a spatial auto-correlation analysis considering two distinct periods (15 February to 31 May 2020 and 1 June to 27 October 2020) that differ from each other by the flexibility level of social distancing and economic activities.
The main contributions of our work are:
  • use of data-driven approach and statistical analysis to understand the people movement during the Covid-19 pandemic and the governments’ responses in terms of social distancing measures, considering different periods and contexts in South America;
  • propose the use of a measure of people movement based on Google’s geolocation data for six types of social activities, which can be compared to different geographical units, updated, and which can also be easily replicated by other researchers;
  • provide objectivity to the classification of countries in South America as to the strictness level of their measures of social distancing through the use of the Covid stringency index from Oxford Covid-19 Government Response Tracker (OxCGRT), that also represents a comparable measure, with broad and free access, in addition to having daily and routinely updated information;
  • using mathematical modelling, we calculate the level of transmission from Covid-19 ( R ( t ) ) for countries of South America, identifying two distinct patterns of transmissibility: a transient and a steady-state period;
  • relate the people movement, the strictness degree of social distancing measures and transmission levels of Covid-19 to identify patterns among the countries analysed in South America; and
  • undertake a spatial analysis of mobility patterns in three specific countries in South America, and for more granular analysis units (provinces and states) than has generally been used in previous works.
In addition to this introduction, the present work is subdivided into three more sections: in Materials and Methods, the data sources and analysis techniques used to achieve the proposed objectives are presented. Then, the results obtained for a group of ten countries in South America are presented, while the discussion on the main findings and points raised are described in the last section.

2. Materials and Methods

2.1. Google Community Mobility Reports Dataset

Since April 2020, Google has made available in its Google Community Mobility Reports [40] information about places visited, captured by mobile devices for 132 countries. For the visited places to be registered, the user needs to activate the Location History of his account, which by default is disabled. The information is made available as historical series in Comma-Separated Value format files (anonymous and aggregated records) for each country and has the following categories of physical spaces: (a) Retail & recreation (restaurants, cafes, shopping centres, theme parks, museums, libraries, and movie theatres); (b) Grocery & pharmacy (grocery markets, food warehouses, farmers markets, speciality food shops, drug stores, and pharmacies); (c) Parks (national parks, public beaches, marinas, dog parks, plazas, and public gardens); (d) Transit stations (public transport hubs, such as subway, bus, and train stations); and (e) Workplaces; and Residential spaces. Figure 1 illustrates the structure of the mobility database provided by Google.
The data released by Google are percentages of variation in population mobility compared to the baseline that consists of the period from 3 January to 6 February 2020 (period considered pre-pandemic in the region, where most countries had not started social distancing measures).
Note that data from Google Community Mobility Reports is collected from users who have turned on the Location History setting of their mobile phones. Therefore, by definition, the data analysed in this work concerns a specific part of the population that has a Google Account configured with Location History turned on.

2.2. South American Countries and Covid Stringency Index

For the analysis of mobility trends in the countries in South America, nations in which data was available for the period from 15 February to 27 October 2020 were selected. Based on this criterion, ten South American countries were included: Argentina, Bolivia, Brazil, Chile, Colombia, Ecuador, Paraguay, Peru, Uruguay, and Venezuela. This same group of countries and period were used in the comparative analysis between the people movement and the strictness degree of the social distancing measures adopted, according to the Covid stringency index from Oxford Covid-19 Government Response Tracker (OxCGRT) [41]. It is a summary indicator of nine dimensions related to the policies employed by countries during the pandemic to contain the circulation of people: school closing, workplace closing, cancel public events, restrictions on gathering size, close public transport, stay at home requirements, restrictions on internal movement, restrictions on international travel, and public information campaign. The indicator varies between 0 and 100, and the higher the value, the greater the strictness of the social distancing policies adopted. For this indicator, information from 1 January to 27 October 2020 was used.

2.3. Mobility Index

To summarise the mobility trends of the six Google activity categories in a single metric, a mobility index was created based on the area of a radar chart [42]. As can be seen in Figure 2, each triangle that makes up the hexagon forms an area that can be calculated by the law of sines and in which centre point is a minimum value, C [42]. The mobility index is then obtained by the ratio between the sum of the areas of the six triangles in the analysed period and the sum of the areas of the six triangles in the period from 3 January to 6 February 2020 (baseline), before the arrival of the Covid-19 pandemic in South America.
Compared to the baseline period, index values smaller than one indicate a lower level of circulation of people; equal to one indicates the same level of movement of people; and greater than one indicates higher level of circulation of people.
In order to remove the effects of weekdays, the trends were seasonally adjusted through the application of statistical techniques (Season-Trend decomposition using LOESS [43]).

2.4. Reproduction Number

The level of Covid-19 transmission represents an important dimension to be considered in the relationship between mobility and strictness of social distancing. Since epidemics due to contagious diseases are relatively recurrent, there is a stimulus for development of metrics that allow to know the potential of contagion of each one of them. The reproduction number, R, one of these metrics, represents the expected number of people that someone infected can infect [44].
R ( 0 ) , a variant of R, is used when considering that all individuals of a given population are susceptible. When one wants to calculate the R at a given time, i.e., assuming that the part of the population has acquired immunity along the epidemic occurrence, the metric is called R ( t ) [45]. If R ( t ) is greater than 1, it means that the disease is in a contagion phase; if it is less than 1, it means that the disease is under control [44]. Previous studies demonstrated that the practice and timing of implementing social distancing measures can significantly reduce the reproduction number of Covid-19 [46,47].
In this work, we estimate the daily value of R ( t ) from 1 March to 27 October 2020. There are many ways to calculate R ( t ) (such as Reference [48]), and we have adapted a model proposed by the Centre for the Mathematical Modelling of Infectious Diseases (CMMID) [44].
To model R ( t ) , the parameters used were: a Gamma distribution with an average of 4.7 days and standard deviation of 2.9 days, which is in accordance with the methodology for calculating the reproduction number of Covid-19 from previous studies [49,50]. The R ( t ) was calculated assuming a confidence interval of 95%, and, because it is a lagging indicator, the values of R ( t ) refer to the average of the last seven days.
The epidemiological information needed to calculate the R ( t ) (daily numbers of confirmed cases and deaths for each of the ten selected countries in South America) were obtained from the Centre for Systems Science and Engineering (CSSE) at Johns Hopkins University (JHU) [39]. The code used to estimate the R ( t ) is available in Reference [51].
According to the R ( t ) distribution in South America during the pandemic, we can highlight two periods: a transient period, during March, marked by high levels of Covid-19 transmission and the first government responses to the pandemic; and a steady-state period, from April, characterised by more stable levels of Covid-19 transmission and different government managements of the pandemic.
Considering these two periods, we conducted to analysis. In the first one, to analyse the strictness of social distancing measures pattern according to the transient or steady-state period, we calculate the probability density function (PDF) for Covid stringency index. Through this function, it is possible to obtain the probabilities associated with a continuous variable, which form a bell-shaped curve under the horizontal axis with area equal to 1 [52]. Distributions of the PDF Covid stringency index close to zero and uni-modal indicate low and homogeneous level of strictness of social distancing measures applied by governments. On the other hand, distributions more distant from zero and with a bi-modal shape (or more) suggest a high level of strictness and also more heterogeneous decrees.
In the second analysis, for each country and period (transient and steady-state), we compare the relationship between the community mobility index and the Covid stringency index, considering the magnitude of R ( t ) . In order to take into account the variability of mobility and strictness indices and the R ( t ) per country, we considered the sum of the mean and the standard deviation in each one.

2.5. Spatial Auto-Correlation Analysis

Based on the relation of community mobility index, Covid stringency index, and R ( t ) , we selected three nations to carry out the spatial auto-correlation analyses: Argentina and Brazil, which presented a high-low and middle-low pattern in transient and steady-state periods, respectively, in terms of strictness of social distancing and people mobility; and Chile, which presented a low-low pattern during the transient period.
Regarding the sociodemographic characteristics of the countries selected to evaluate if there is spatial dependence in population mobility or if mobility is occurring randomly in space, Brazil stands out in relation to Argentina (44 million) and Chile (18 million) in terms of territorial extension and population size: 210 million inhabitants in 2019. In terms of income inequality (measured by the Gini Index), Chile (44.4) and Argentina (41.4) shared practically the same high level of inequality in 2018, while Brazil presented a higher level of inequality (53.9), pointing to a most economically unequal society. With regard to life expectancy at birth, which can be interpreted as a measure of quality of life, Argentina, Brazil, and Chile had similar levels. The highest value was presented by Chile (80 years), followed by Argentina (76.5 years) and Brazil (75.7 years), given estimated values for 2018, for all cases [53].
For Argentina, Brazil, and Chile, mobility information was also disaggregated for smaller units of analysis; in this case, provinces and states (of the total of 132 countries in the Google dataset, these characteristics were present in only 39% of them). This was a necessary condition for the identification of mobility clusters within the selected countries.
To use information of provinces, departments, and states, it was necessary to handle the missing information from the mobility records. In the case of Argentina, Workplaces and Residential categories did not present missing values, while, for the Transit stations category, there was 6.1% of missing data. For the other categories, the missing data was less than 1%. For Chile, different percentages of missing data were found in all categories: Workplaces (0.93%), Retail & recreation (0.83%), Grocery & pharmacy (1.25%), Residential (4.57%), and Transit stations (1.78%). For Brazil, missing data were also found in all categories, and the Parks category had the largest percentage (1.68%).
To overcome with these missing data, we opted for a single imputation method by adding the average of the values by country and by category. This choice is justified by its simplicity to generate the complete dataset [54].
Each variation in mobility within the dataset is associated with spatial sub-spaces in two different granularities: national and its political-administrative subdivisions (provinces or states). Thus, the analysis of spatial auto-correlation was used to reveal whether there is any association between these variations of nearby mobility in spaces, whether they form clusters or if they occur at random. We considered two periods that differ from each other by the beginning of the gradual reopening of the economy and the social activities: 15 February to 31 May 2020, and 1 June to 27 October 2020.
Spatial auto-correlation can be understood as a correlational assessment of the values of the same variable at different points in space, in order to verify how the magnitudes of this variable influence and are influenced by nearby locations [55]. When the spatial auto-correlation is positive, spatial similarity occurs, i.e., close points in space are similar in their values, forming clusters. When the spatial auto-correlation is negative, this relationship between proximity and values of a variable is reversed, and spatial heterogeneity can be observed [56]. There is also the case of spatial randomness, characterised by the absence of any significant relationship between the location of the variable and its values [55].
To estimate the spatial auto-correlation, one of the most common statistical techniques is the Moran’s Test, which presents a global index to assess the entire region under analysis and local indices for the different subdivisions within the same region [55,56,57]. Both indices take into account the influence of the neighbourhood, represented by a spatial weights matrix W, where each element w i j measures the proximity between i and j by some spatial contiguity criteria [56,58]. The most used neighbourhood specifications are the Rook’s case contiguity, in which it is defined that neighbouring areas share only edges, and the Queen’s case contiguity, in which neighbouring places share edges and vertices, the one used in the present study [59]. These neighbourhood criteria are illustrated in Figure 3.
According to Reference [55], the global Moran’s index I for a variable x can be formally described by (1).
I = n S 0 i j w i j ( x i μ ) ( x j μ ) ( x i μ ) 2 ,
where n is the number of areas, S 0 is the sum of all elements of the spatial weights matrix W, and μ is the average of all observations from x. The Moran index, I, varies between −1 and 1, with I > 0 , indicating positive spatial auto-correlation and I < 0 pointing to a negative spatial auto-correlation. There is a validation of the index through a pseudo-significance test in which null hypothesis is spatial independence ( I = 0 ) [55].
A visual interpretation of the Moran’s index is the slope of the regression line of the so-called Moran Scatterplot [55], as illustrated in Figure 4. This diagram consists of a two-dimensional plot, in which a normalised variable z is arranged on the x-axis to be compared with the average of the same variable at neighbouring locations W z (in which W is row-standardised, i.e., each element w i j is divided by its row sum), arranged on the y axis [61]. Therefore, the points in the quadrants Q 1 and Q 2 represent areas surrounded by neighbours with similar values (positive auto-correlation), while the points in the quadrants Q 3 and Q 4 illustrate areas surrounded by neighbours with dissimilar values (negative auto-correlation) [62].
The visualisation of this data through maps is convenient and useful. In this case, the spatial subdivisions are coloured according to the quadrant to which each point belongs in the Moran diagram [64]. Since Moran Scatterplot does not provide information on the significance of each observation within its quadrants, it is necessary to investigate this statistic using Local Indicators of Spacial Association (LISA) [62]. The local Moran’s index is part of the LISA class and provides details of local patterns and trends [64], being defined for each area i from the values of the variable z i according to (2).
I i = z i j w i j z j ,
where the elements w i j of the spatial weights matrix are row-standardised, and the sum in j encompasses only neighbouring values j J i of the area i [62]. The local Moran’s index also presents a statistical test for its validation analogous to that of the global index [55], becoming feasible that maps visualisation only highlights the spatial subdivisions with significant spatial auto-correlation. In the literature, these maps are known as LISA cluster maps and are usually accompanied by other similar maps that highlight significance level of each subdivision, called LISA (significance) maps [62,65].

3. Social Distancing, Easing Covid-19 Restrictions and Community Mobility in South America

As shown in Figure 5, in 2020 Peru was the first country in South America to adopt the lockdown (15 March), followed by Ecuador and Venezuela (17 March), Argentina and Paraguay (20 March), Bolivia (22 March), and Colombia (24 March). Less restrictive social distancing measures were in place in Brazil, Uruguay, Chile, and Guyana, although, in the specific case of Chile, measures to close some areas of its territory were adopted [66].
Regarding the number of social distancing measures applied to contain the movements across and within countries, Chile (36 measures), Paraguay (19 measures), and Bolivia (15 measures) stood out. Among these countries, only Chile did not adopt the lockdown (Figure 5). On the other hand, Peru (5 measures), Argentina (7 measures), and Ecuador (8 measures) presented less restrictions or prohibition on the entry of foreign travellers, border closures and controls, and restriction or closure of public places and mass gatherings.
Figure 5 also shows that from May, countries started to ease the lockdown. On 3 May, the Ministry of Labour of Ecuador established rules for the reactivation of labour journey of the private sector. Ecuador was the precursor to decree the lockdown and also the economic reopening in South America. Colombia (25 August) and Bolivia (1 September) were the last to decree the lockdown and also the last to ease the social distancing measures.
Considering the incidence rate of Covid-19 (new cases per 1 million inhabitants) on 10 October (see Figure 5), there is a mix of new confirmed cases of the disease among the countries analysed, regardless the type of social distancing measure adopted during the pandemic [66]. Although this variability may be related to the testing capacity of each country and to the different behaviours of the pandemic, it is also related to the population’s relaxation regarding measures of social distancing, especially after the economic reopening and other social activities. An important example is Argentina that instituted one of the longest lockdown decrees among the countries analysed; however, in October, it reached approximately 1 million of confirmed cases of Covid-19, following its neighbour Brazil, the first country in the region to reach this mark four months earlier, in June. As shown in Figure 5, Argentina had the highest incidence rate of Covid-19 among the countries analysed on 31 October (308.8 new cases per million inhabitants), followed by Colombia (197.1 new cases per million inhabitants), which also reached one million infected with the new coronavirus in the same week as Argentina. In both countries, the trend of stability in the number of new cases of Covid-19 started to increase in July, approximately, which may have been stimulated by the expansion of the measures of economic reopening and social activities verified since that period [67,68].

4. Strictness of Social Distancing Measures and Population Mobility in South America: Is There a Pattern?

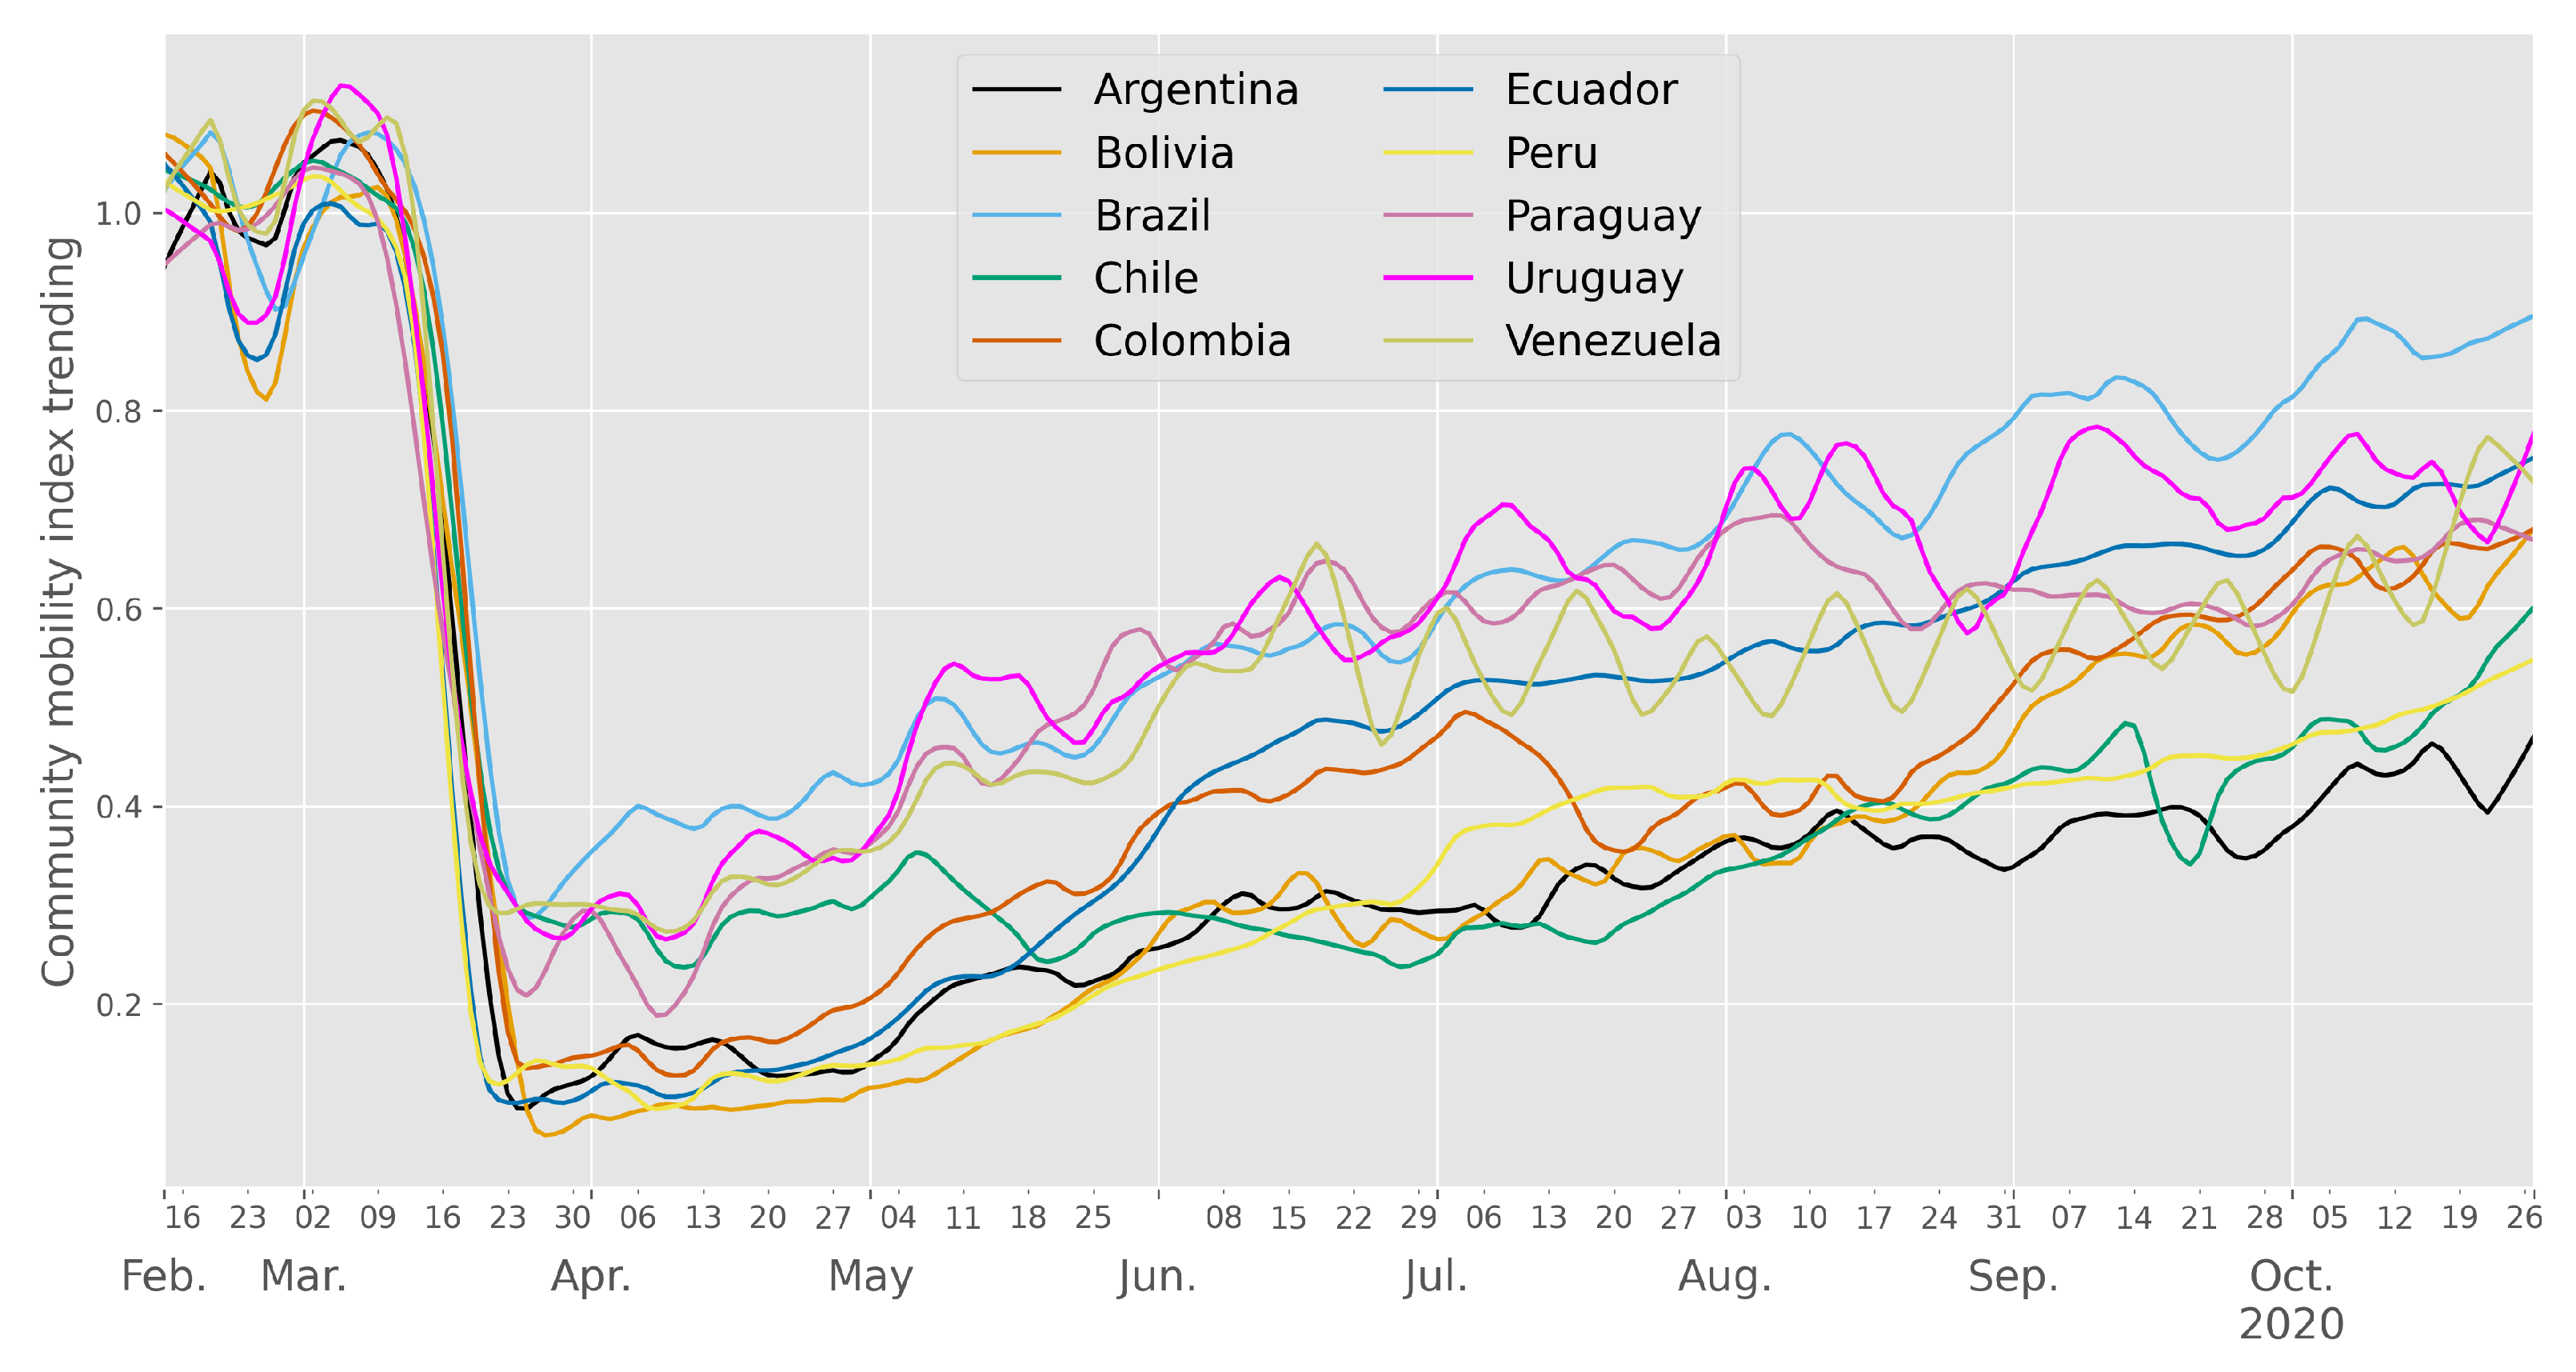
Figure 6 illustrates the trajectory followed by the proposed community mobility index between 15 February and 27 October 2020 for the group of ten South American countries. There is a sharp drop in the population mobility captured by Google on the dates coinciding with the carnival celebrations (in the second half of February). The downward trend in mobility started approximately from the second week of March when most of the countries announced the first measures of social distancing.
There is a decline in mobility for nations, like Paraguay, the first country in South America to enact social distancing (9 March), and Uruguay, in which initial measures were enacted on 13 March. The case of Venezuela also draws attention: On 12 March, that country applied its first measures related to the restriction of population mobility; however, the mobility levels remained one of the highest for a few more days, until reaching a pace of decline with the lockdown decree on 17 March, four days after that country confirmed its first case of Covid-19 [69].
From 23 March, approximately, the formation of two groups can be seen for most of the period: the first, with less circulation, included nations that declared lockdown at the beginning of the pandemic; the second, with greater circulation, included countries that adopted two types of social distancing.

4.1. Countries with Lower Levels of Population Mobility

According to the analysed index, Bolivia was the country with the lowest level of population mobility until the beginning of June, when the people circulation reached a sustained growth rate, according to the trend presented by the indicator. For Colombia, the trend described was an increase in mobility until the beginning of July. From this point, the curve of the community mobility index showed an important inflection, with a tendency to reduce the people circulation for approximately 15 days. At that time, the pace of contagion by Covid-19 was growing, which led the Colombian government to extend the lockdown and to allow the gradual reopening of the economy to continue only in those areas with no or few cases of Covid-19 [70]. However, after the second half of July, the mobility of the Colombian population increased again, and, at the end of the analysed period, it was one of the highest in the region, as well as the number of cases of the new coronavirus in that country.
In the case of Argentina, which decreed lockdown on 20 March 2020, it was among the countries with the lowest levels of circulation in the region. However, it is noteworthy that, despite the greater control of the movement of people, Covid-19 has advanced rapidly in that country, as previously discussed. The low capacity to carry out tests and tracking of contacts may be a possible explanation for this apparent paradox. On 6 November, Argentina was one of the South American countries that performed less Covid-19 tests (70.1 tests per 1000 inhabitants), while, in Chile, the South American country that tested the most, this value was almost the triple (234.8 tests per 1000 inhabitants).
In Chile, the trend of the community mobility index, which was close to that of the countries that did not decreed a lockdown in the entire territory, was reversed in the first weeks of May. On that occasion, in the metropolitan region of Santiago (the administrative capital of Chile), the lockdown was decreed due to the increase in the number of Covid-19 cases [71]. The level of people movement in Chile during the pandemic was one of the lowest in the region, although, at the end of October, the trend of the community mobility index was upward.
The trend described by the population mobility index in Peru, the first country to declare the lockdown in South America, was one of the lowest and most stable. It is important to highlight that the national lockdown decree was one of the most severe in the region, including curfew at certain night times. These measures were successively renewed throughout the pandemic, and, until 6 November, the number of confirmed cases of Covid-19 approached the mark of 1 million, and the number of deaths, 35 thousand records [72].
In Ecuador, the epidemic advanced strongly since the confirmation of the first case, at the end of February [73]. Measures were taken to contain the people circulation in the first weeks of March, especially in the capital Quito [74]. Ecuador, which has a population of around 17 million inhabitants [75], accounted for more than 3000 deaths by Covid-19 on 6 June [5]. The trend of the community mobility index has been growing over time, especially since June, when Ecuador started to present people circulation levels close to those of countries that did not institute national lockdown measures.

4.2. Countries with Higher Levels of Population Mobility

Considering the countries that presented the highest level of population mobility in the period analysed, Brazil is peculiar. From the second half of March, Brazil presented as the regional leader in mobility during practically the entire period analysed, although, in specific periods, countries, such as Uruguay, Paraguay, and Venezuela, took turns leading him in the level of movement of people during the pandemic. For example, for two consecutive months (middle August to late October 2020), no country managed to reach Brazil considering the trend described by the community mobility index. Despite its continental dimensions, its large population, and the profound social inequalities that mark Brazil, the absence of a national coordination plan that would guide states and municipalities regarding social distancing may have been decisive for the circulation of people to be high during the pandemic [76]. Furthermore, the presidential speeches that conflict with the guidelines of the world health authorities and health authorities of their own government, that contributed to the change of command of the Ministry of Health on two occasions, may have contributed to a great internal variability in the level of adherence to non-pharmacological interventions to cope with Covid-19 [77]. Brazil entered the month of November with more than 5 million confirmed cases, the third largest in the world, second only to the United States and India. Although the contagious rhythm of Covid-19 in Brazil has shown signs of decrease, the country has remained for long months in an uncomfortable plateau of the distribution of the number of deaths over time, which, until 7 November, surpassed the mark of 160 thousand deaths [6]. In turn, Uruguay has presented a more favourable scenario than its neighbours. In the first week of November, it had accounted for about 3000 confirmed cases and 61 deaths from Covid-19 [78]. On 3 November, Uruguay was one of the exceptions in South America as it did not present community transmission of the new coronavirus, with the confirmed cases limited to certain geographical areas [79]. Without instituting a national lockdown, Uruguay had one of the highest levels of circulation of people, according to the trend shown by the community mobility index. The rapid, and strongly based on scientific criteria, governmental response to the pandemic, since the first case was confirmed on 13 March, may have allowed Uruguay to better manage the health crisis when compared to other countries for most of the period, despite this high level movement of people. For example, in Uruguay, the preparation of the health system for the care of patients and the testing and contact tracking system, which represents one of the most efficient in South America, stood out [80].
Paraguay, which adopted lockdown measures on 20 March 2020, the community mobility index trend fluctuated until the first half of April but subsequently reached a consistent pace of growth and at levels closer to the typical mobility of countries that did not adopt a national lockdown. The reversal of this trend occurred only in August, with a decrease in mobility levels, but with an indication of a resumption of growth at the end of the analysed period. Until the first week of November, the number of confirmed cases of Covid-19 in Paraguay was just over 65 thousand, and the number of deaths reached around 1500, with both epidemiological indicators concentrated in the second half of 2020 [81].
Venezuela was one of the first countries to institute the lockdown and also to end it in late May. The serious humanitarian crisis installed in the country a few years ago impacted the health system’s capacity to respond to Covid-19, intensifying the circulation of Venezuelans on the borders with neighbours Brazil and Colombia, despite the existing prohibitions. In the border regions with these countries, the incidence rates of Covid-19 were the highest in Venezuela [82]. According to the World Health Organisation, until 7 November, Venezuela had 819 deaths from Covid-19, and the number of confirmed cases was close to 94,000 [83]. Observing the trend of the community mobility index for that country, there was an increase in circulation until the first half of June, when, from then on, there was stabilisation around a lower level, although, at the end of October, the trend described was of increase in the mobility of people.
The next section presents the pattern described by Covid stringency index for each country along the pandemic and the probability density function (PDF) for this index considering a transient and a steady-state period. It also presents the daily evolution of the values of R ( t ) and moving average seven days to confirmed cases of the novel coronavirus for three countries selected for spatial analysis (Argentina, Brazil, and Chile). And, for each period (transient and steady-state), we show the relationship between community mobility index and Covid stringency index, considering levels of Covid-19 transmissibility.

5. Mobility Pattern, Epidemiological Indicator and Public Policies to Contain the Pandemic in South America

5.1. The Scenario of the Covid-19 Crisis in Two Acts: Transient and Steady-State Periods

According to Figure 7, one can see that, although measures related to social distancing in the region start to appear in an isolated way in February, they only increase significantly in March. Although, for some countries, the score in the Covid stringency index grew gradually, as in the case of Uruguay, in others, the process of tightening up these measures was faster. For example, Argentina became the country with the strictest distancing policies in South America in the second half of March. However, it is the curve of the Covid stringency index in time for Uruguay that stands out. This country, which, as previously presented, did not adopt national lockdown measures, presented a slower and more ephemeral increase in the rigidity of its measures in relation to the others. In Uruguay, the Covid stringency index score started to drop in the first half of April, as can also be seen for Colombia. However, while, for that country, there was a recovery of stiffness around May, for Uruguay, the behaviour of the curve was monotonic until the beginning of June. From that point on, successive declines in the value of the Covid stringency index can be observed, which increased again only from the week of September and remained stable throughout the month of October. When looking at the PDF of Covid stringency index, there are notable differences in distributions for countries considering transient and steady-state periods. During the transient period corresponding to the month of March, when governments showed their first reactions to the arrival of the pandemic, and with it, high levels of transmission from Covid-19, there is a concentration of curves around zero, signalling for measures of low rigidity and marked homogeneity between countries. Once again, the Uruguay curve stood out, more centred around zero than the others, which is compatible with the trend previously presented by it. With regard to the steady-state period, which covers the period from April to the end of October, and which is characterised by stable values of R ( t ) and in response to different government actions in the course of the pandemic, it is observed a general behaviour of multi-modal curves and centred on values far from zero. For example, Uruguay presented tri-modal curves that were flatter than those of other countries. This pattern illustrates the more gradual pace of stiffening of its measures of social distancing and the low Covid stringency index scores achieved. In the case of Argentina, the shape of curves had low dispersion and were centred around high values, which in turn illustrates the rapid rise in the scale of the previously mentioned social rigidity index.
Figure 8 presents the relationship between community mobility index (CMI) and Covid stringency index (CSI) for the ten countries in South America during the transient period. The magnitude of R ( t ) is expressed in the size of the symbols for each country represented in the graph. Based on the relationship between stiffness and people mobility, countries can be classified into three clusters: Cluster 1 composed of Uruguay and Chile (very low CSI–very high CMI); Cluster 2 composed of Brazil, Colombia, and Venezuela (low CSI–very high CMI); and Cluster 3 formed by Argentina and Bolivia (middle CSI–very high CMI), Paraguay, Ecuador, and Peru (middle CSI–high CMI).
During the month-long transient period, the degree of rigidity of social distancing measures ranged from “very low” to “middle”, while the level of people mobility ranged from “very high” to “high”. In Cluster 1, Uruguay and Chile were, in relation to the others, in the lowest level of rigidity of the Covid stringency index, and also, in the highest level of circulation of the community mobility index. Similarly, in Cluster 2, Brazil, Colombia, and Venezuela presented a low level of rigidity in their measures and a very high level of people mobility. On the other hand, in Cluster 3, countries seem to have responded with more rigidity in their decrees to the crisis that was taking place (Covid stringency index classified as middle) than their South American counterparts; however, this stiffness in the rigidity seems not to have been sufficient in that period to produce greater control over people mobility, that was classified as very high or high.
Figure 9 refers to the steady-state period, which formed the following clusters: Cluster 1 that includes only Uruguay (middle CSI–high CMI); Cluster 2 that includes only Brazil (high CSI–high CMI); and Cluster 3 that includes Paraguay, Ecuador, Venezuela, Colombia, and Bolivia (very high CSI–middle CMI), and Chile, Argentina, and Peru (very high CSI–low CMI). In this period that includes six months of exposure, the application of stricter measures of social distancing has not always resulted in a reduction in the mobility of the population. In the case of Uruguay, the average rigidity of the CSI was related to a high level of mobility, and in the case of Brazil, although it reached a high level in the steady-state period in the CSI index, the level of mobility of its population was also high, suggesting a low response from its population to the tightening of its measures. In Cluster 3, which included countries that adopted and did not adopt national lockdown measures, Chile, Argentina, and Peru presented combinations of Covid stringency index (CSI) and community mobility index (CMI) compatible with what establishes H1: very high rigidity of its decrees of social distancing and medium or low population mobility.
In summary, the results found for the transient and steady-state period for the most part pointed to the rejection of H1, since, in most of the clusters that were formed, the expected inverse relationship between the level of rigidity of the social distancing measures and mobility of the population was not verified, and, especially in the steady-state period, which presents a period of greater consolidation of government measures aimed at containing mobility, on the one hand, but also a longer time of exposure of people to circulation. Despite the rigidity of the measures adopted, for some countries, the task of containing the movement of people seems to have been more difficult than for others.
Countries were selected for the spatial analysis to test the H2 based on the clusters that were formed in the previous analysis. This spatial analysis seeks to measure spatial dependence in population mobility or if mobility occurred randomly in space. In this way, Chile was selected, which, in the transient period, composed Cluster 1; Brazil, that, in the transient and steady-state period, was part of Cluster 2; and Argentina, which composed Cluster 3 in both periods analysed. Uruguay presented important characteristics in the formation of clusters; however, it was decided not to include this country in the spatial analysis due to its high rate of missing values for Google’s categories of activities.
Figure 10 shows the evolution of the reproduction number R ( t ) and moving average 7 days confirmed cases of Covid-19 for Argentina, Brazil, and Chile. High values of R ( t ) are observed for the three countries at the beginning of the pandemic (transient period), but it has declined consistently since April (steady-state period). These changes in the reproduction number levels point out to good results achieved by the measures of social distancing implemented by these countries, although the starting points and rigidity of the adopted measures were different among them. The quality of information on confirmed cases and deaths by Covid-19 and others that affect the construction of the R ( t ) index must also be taken into account. As shown in Figure 10, there is a large daily fluctuation in the number of confirmed cases for the three countries, which may be an indication of information under-reporting. Low population testing for Covid-19 issues may mean that the values of R ( t ) are higher than the one presented here.
Regarding the growth of the number of cases during the pandemic, different rhythms have been observed. While Brazil experienced a rapid escalation of Covid-19 cases, following a very oscillating trend that began to show signs of decline as of August, but which ends the period under analysis at a pace of growth, Chile showed a slower trend of rise in its curve of the moving average of the number of cases, which cooled down in June, and, from then on, it stabilises at a low level. In turn, Argentina shows a sustained growth trend for this epidemiological indicator, especially considering from May on.

5.2. Lessons Learned. Implications of the Scenario for Public Policies Concerned to Covid-19

According to the analysis presented, during the eight months of the pandemic, different patterns were revealed in the region, not only in terms of mobility but also related to the rigidity of social distancing measures and Covid-19 contamination, considering two distinct phases of the pandemic: the transient and steady-state period.
Considering only the evolution of the community mobility index, with the implementation of the first measures of social distancing, a significant drop in the level of people movement was observed for all the countries analysed. However, in none of them was this level sustained for a long time, and, in many cases, the resumption of the level of mobility occurred before local governments directed the return of non-essential activities under health and hygiene protocols.
Historically, South America has had adverse socioeconomic characteristics and is highlighted by deep social inequalities between and within countries. And this diverse social framework must be taken into account to assess adherence to social distancing and the evolution of epidemiological indicators during the course of the pandemic.
Table 1 presents the proportion of informal employment related to total employment in 2019, and the Gini Index as a measure of social inequality. It is clear that there is also a mix within the region: informality in the labour market reached 84.9% in Bolivia, while, in Uruguay, it was no more than 24%. Regarding the Gini Index, Brazil (53.9) and Colombia (50.4) are the most unequal, and Uruguay (39.7) and Argentina (41.4) are the least.
These numbers show that there is no linear relationship between informal employment and inequality, and also, between each of these dimensions with the level of mobility during Covid-19 pandemic. Uruguay, which had a lower proportion of informal employment, was the one with the highest levels of movement, as shown by the community mobility index. Brazil, which had a proportion of informal workers of 47.9%, almost double that presented by Bolivia (84.9%), experienced movement at levels higher than the Bolivian population.
These aspects suggest that the high movement of people during the health crisis in the region does not depend only on the proportion of people in the informal economy and in which remote work is not an option but also on a set of characteristics that go through the degree of rigidity of social distancing measures, existence of assistance policies for supporting informal work, and also political and behavioral aspects.
For example, in Bolivia, the lockdowns were combined with income supports directed to informal workers, considered successful in the context of the pandemic, although problems, such as crowds formed at the benefit distribution locales, have been reported, increasing the risk of contamination. Faced with a large population of informal workers and employees mainly in the agricultural sector, the national government expanded benefits for existing cash transfer programs in order to protect these workers and contain Covid-19 which was rapidly spreading among the poorest population, achieving good social and public health outcomes [84].
Brazil has also adopted a set of public policies to protect workers severely affected by the health crisis, such as the introduction of an emergency aid payment for informal workers, individual entrepreneurs, unemployed people, and others. However, operational failures in the implementation of theses social policies, such as difficulty of registration, are pointed out as barriers to the success of these measures [85], as well as the formation of crowds at bank branches to withdraw the benefit, increasing the risks contagion. The difficulties imposed on beneficiaries may have contributed to the outstanding movement of people in Brazil [86], even in the face of an epidemiological scenario characterised by high incidence and deaths by Covid-19, in addition to other factors previously mentioned, such as the absence of a national coordination of social distancing and economic reopening measures. Simultaneously to an increase in the number of cases and deaths from the novel coronavirus and a slow process of acquiring vaccines to immunise its large population, Brazil also started 2021 under the threat of the end of the emergency aid, or in the best of cases, reductions on the amount provided by the government. If any situation occurs, Brazil, the most unequal country not only in South America but in the world, can further deepen the gap between the richest and the poorest.
In Argentina, a country that presented one of the most rigid and long-lasting lockdown measures among the countries analysed, the trends of the community mobility index reached one of the lowest levels in the region over the analysed period. In terms of social security in pandemic times, the country that presents a lower level of inequality compared to that presented by the majority of its peers, but a proportion of informal workers that reaches almost half of the total of workers, has also implemented specific social public policies. The Argentina “Emergency Family Income” pays US$155 to 3.6 million families, and a set of other actions, such as the increase of income transfers targeted at the elderly, in addition to employment and salary protection policies [87]. The set of these measures combined to a more rigid and coordinated action to control the circulation of people may have been the key factors for Argentina’s good performance compared to other countries in the region. However, as previously discussed, failures of health care, such as the low number of tests and contact tracking, may have contributed to the fact that, by the end of 2020, the number of cases and deaths from the disease showed a growth trend in that country. The experience in Argentina may be an example that, alongside social protected measures and social distancing, surveillance to control the spread of the novel coronavirus plays an important role in the context of the pandemic.
The next subsection presents descriptive spatial analyses for three selected countries and their territorial divisions in provinces and states of Argentina, Brazil, and Chile.

6. Spatial Analysis of the Inner Mobility Tendencies

6.1. Exploratory Analysis of Spatial Data

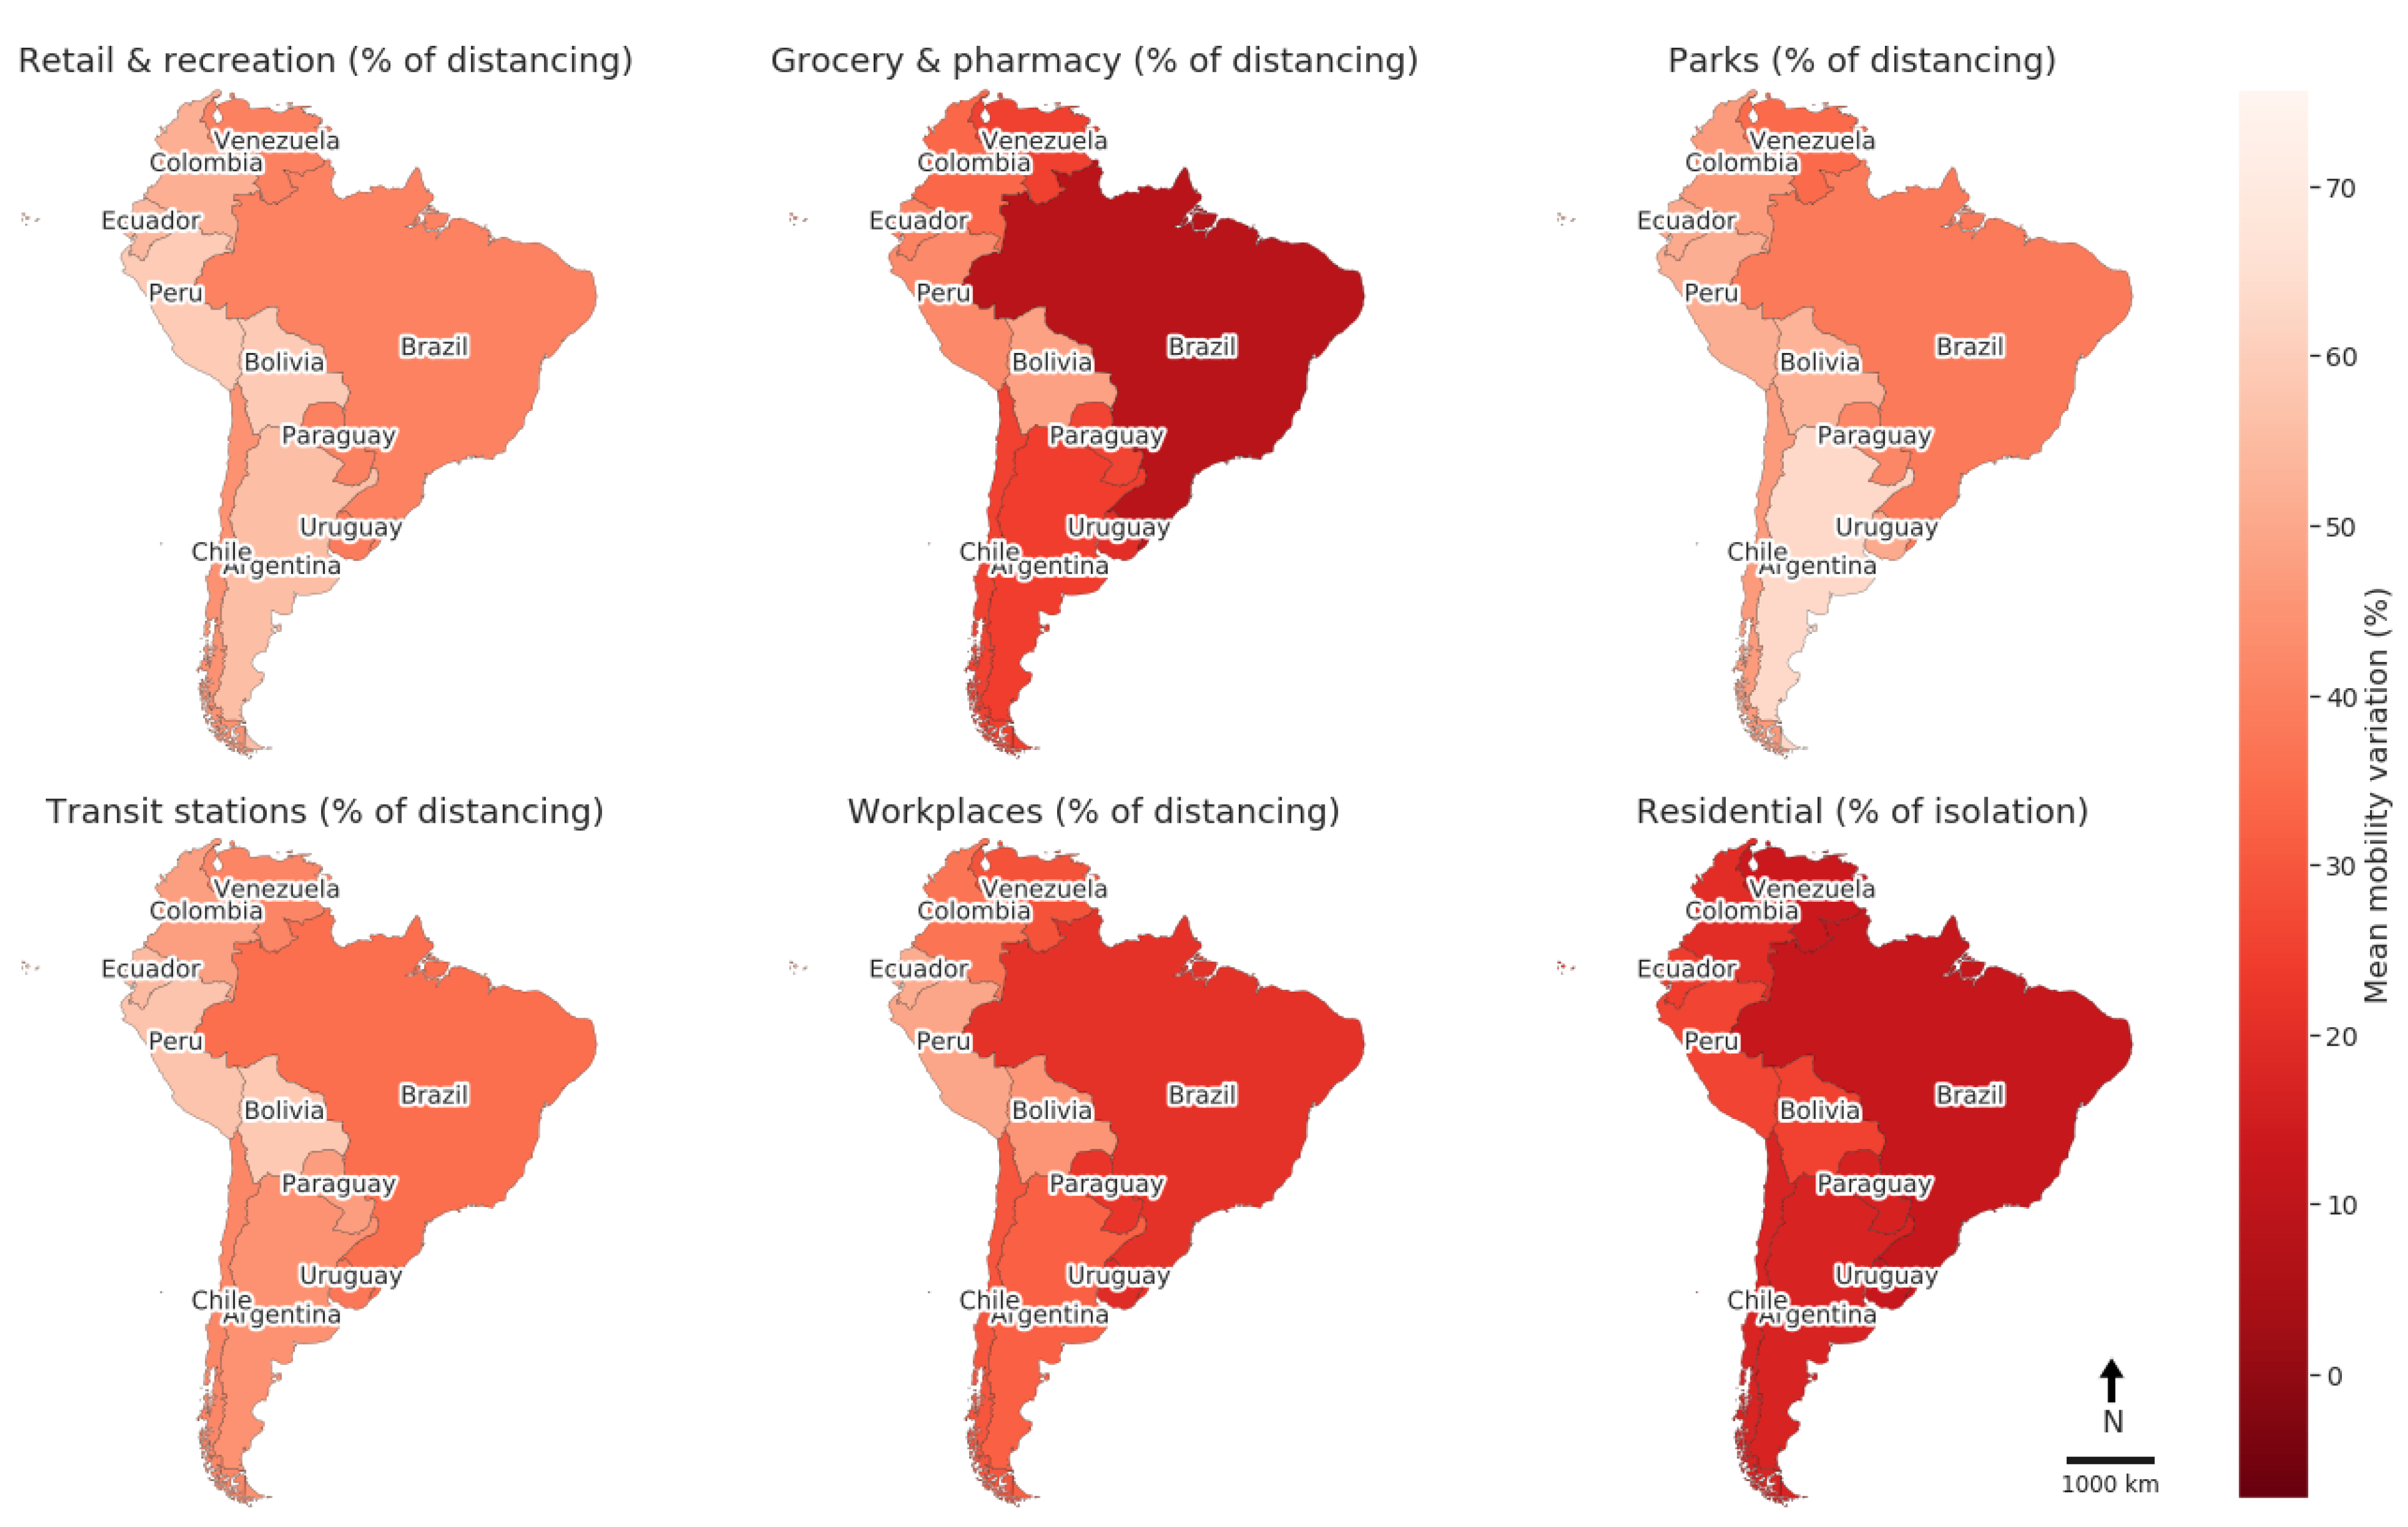
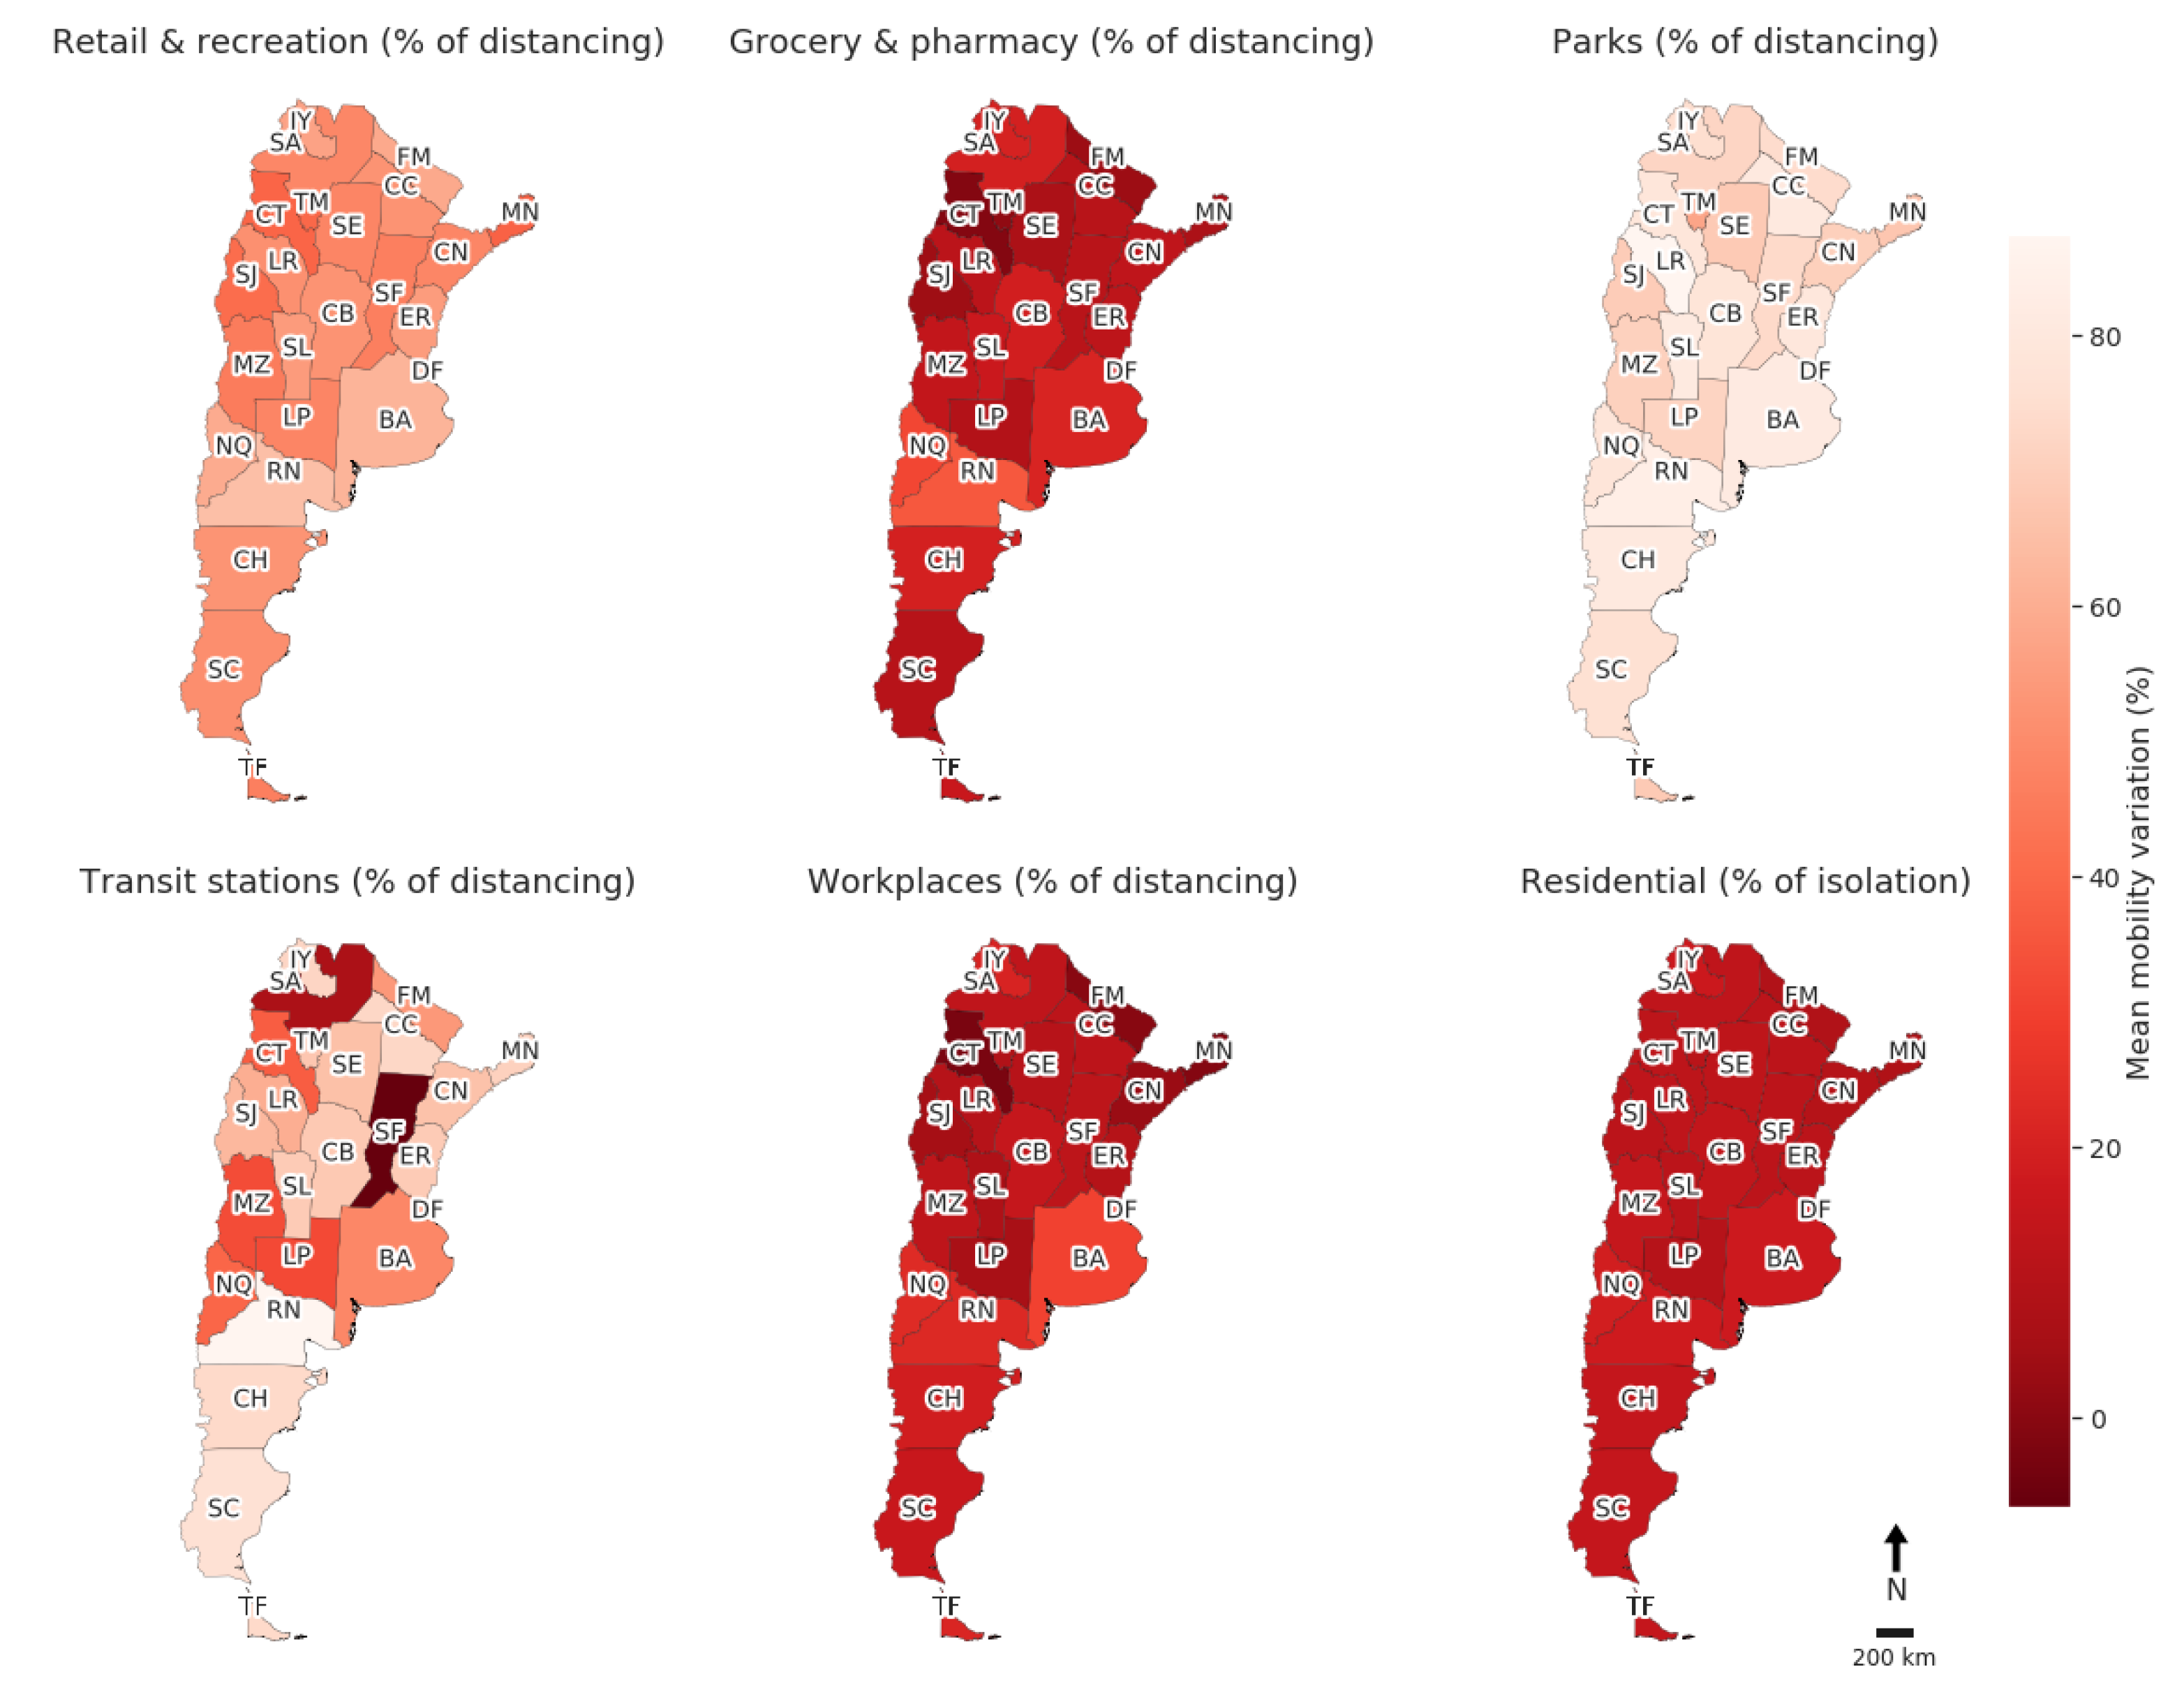
Figure 11 presents the average variation of mobility in the period from 15 February to 31 May 2020 and Figure 12 from 1 June to 27 October 2020, both for South America. In general, for all countries and periods, there was a smaller variation of mobility to Grocery & pharmacy, Workplaces, and Residential. In the second period (Figure 12), it is possible to notice the increase in circulation in Grocery & pharmacy in Brazil and the reduction of mobility in places, like “Parks” in Argentina, compared to other countries.
Looking at the average variation of internal mobility of Argentina, Chile, and Brazil, important trends are shown. In Argentina, comparing Figure 13 and Figure 14, one can see that the significant reduction in the circulation of people in the Parks category in the second period occurred homogeneously among the provinces. On the other hand, noteworthy is the generalised breach of social distancing between administrative units considering the categories Grocery & pharmacy, Workplaces, and Residential. For the Transit station category, the increase in the circulation of people from one period to the next was more localised, as in the province of Santa Fe and Salta.
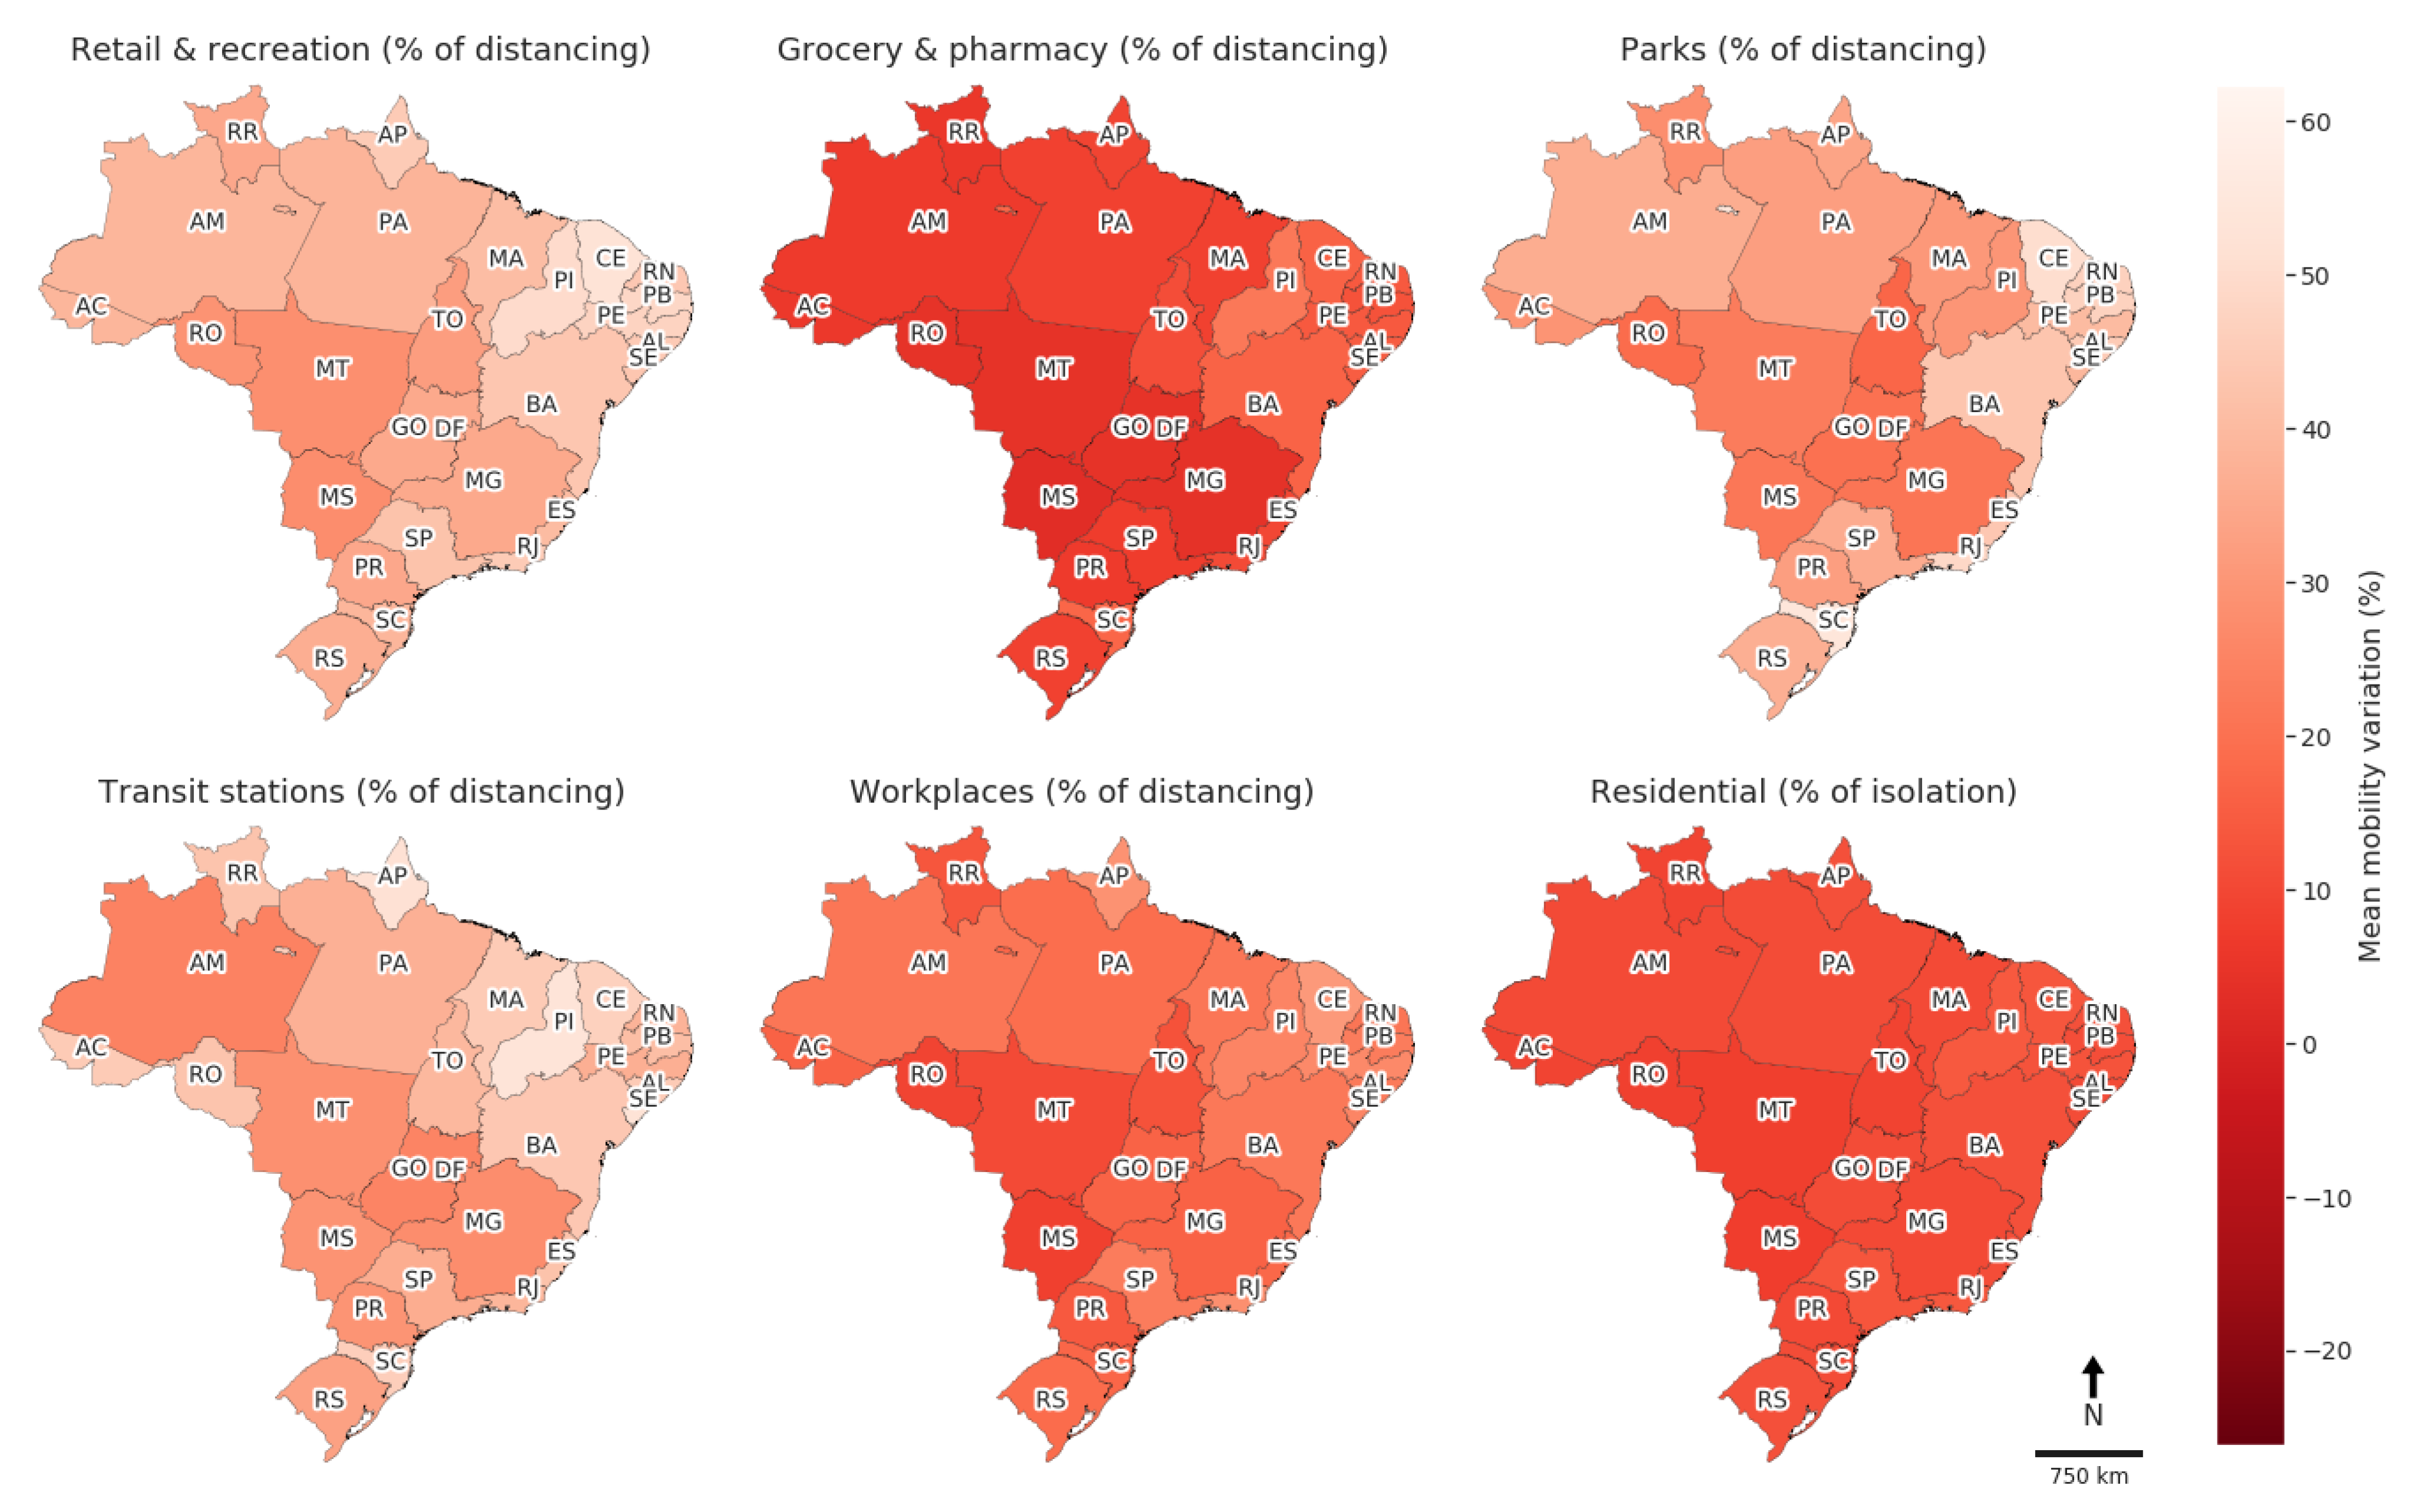
In Brazil, Figure 15 and Figure 16 show a substantial increase in mobility over time for virtually all regions, considering the Grocery & pharmacy category. There were no major variations between the states in terms of isolation in places of residence from the first to the second period. However, for categories, such as Parks and Transit station, there has been an increase in mobility over time, especially for states in the North Region of the country.
In Chile (Figure 17 and Figure 18), although, especially for the Residential category, there was little variation from one period to the next, in the others, the trend was towards greater adherence to social distancing in the period from one period to another and jointly between the provinces.

6.1.1. Global Moran Index

According to the Table 2, for Brazil, Moran Global Indices statistically significant at the 95% level of reliability (highlighted in gray) predominated for a greater number of categories of Google activities, and especially in the first period (15 February to 31 May 2020). In the second period, which is marked by a greater reopening of commerce sectors and some social activities in Brazil, the categories Transit stations and Residential did not reach statistical significance, indicating that, in these cases, in time, mobility started to occur at random. In both categories and periods, the spatial auto-correlation was positive, i.e., a location has neighbours with similar values.
In the case of Argentina, Workplaces and Residential categories reached statistical significance in the two periods analysed, while, for the Retail & recreation category, this occurred only in the period from 1 June to 27 October 2020. As in the case of Brazil, for these categories, spatial auto-correlation was positive. As previously presented, Argentina showed an increase in the number of Covid-19 cases in the second half of the year, which, combined with some flexibility in its lockdown, may explain the return of spatial dependence on mobility and for only this category. However, it is important to highlight that the predominance of categories without statistical significance, and that point to the randomness of the population’s mobility for most of Google’s activities, may be a consequence of the high level of rigidity of the Argentine lockdown, as shown by previous analyses.
Finally, for Chile, only one category achieved statistical significance, and in the second period: Retail & recreation, which presented a positive and weak spatial auto-correlation. These results are consistent with what was demonstrated by previous analyses that pointed to this country that did not adopt national lockdown measures, increased the rigidity of its measures over time, as well as the control over the mobility of its population.

6.1.2. Local Moran Index: Clusters Formation in Argentina, Brazil, and Chile during the Pandemic

Having performed the analysis of the global spatial auto-correlation indicator, this sub-section presents the local Moran index that points out to the formation of clusters between administrative units of Argentina, Brazil, and Chile. High-high clusters mean agglomerations of provinces with high variation in mobility in relation to the baseline period. Conversely, a low-low cluster mean agglomerations of provinces with low variation in mobility. Places with low variation of mobility surrounded by neighbours with high variation form low-high outliers, and otherwise, i.e., high variation surrounded by neighbours with low variation, high-low outliers.
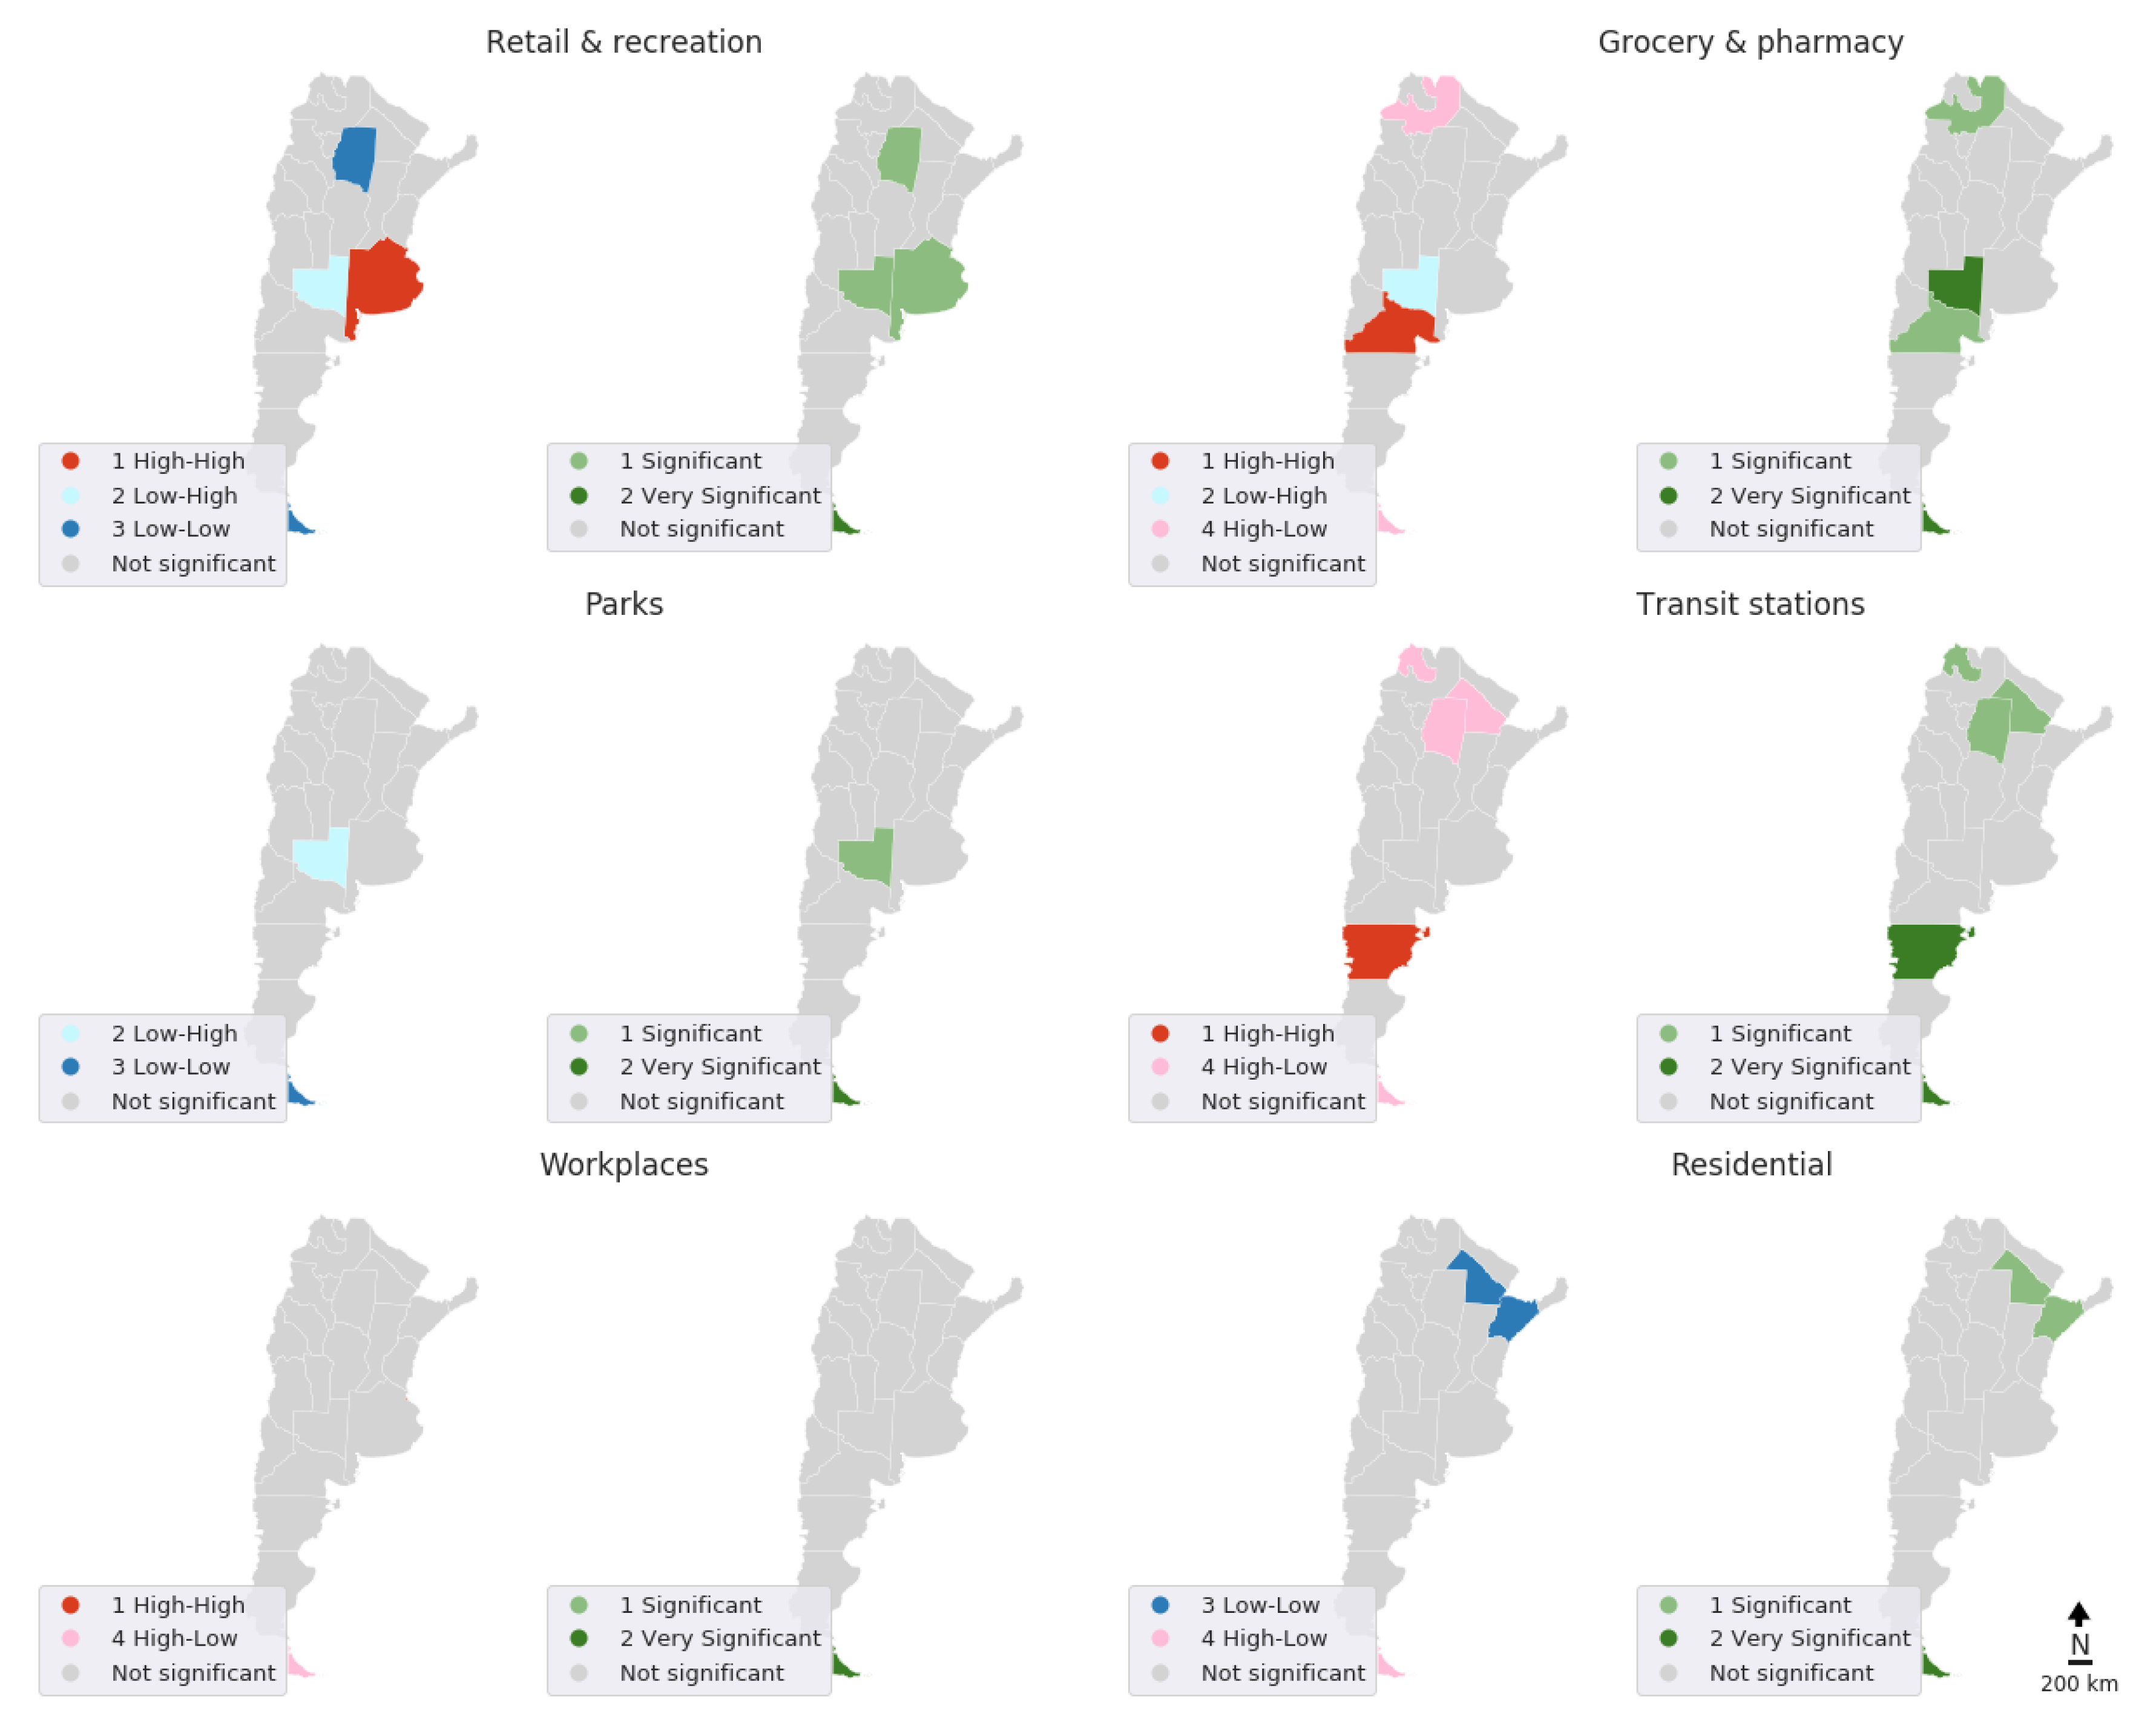
As illustrated in Figure 19 and Figure 20, from one period to another, for the Workplaces category, high-high clusters (province of Buenos Aires) and low-low (province of Salta) clusters disappear, leaving only the high-low outlier located in the province of Tierra del Fuego, Antarctica, and Islas del Atlántico Sur, which represents the least populous region of the country, located in the extreme south of Argentina.
For the Residential category, of the six clusters formed in the period from 15 February to 31 May 2020, only the high-low outlier (province of Tierra del Fuego, Antarctica, and Islas del Atlántico Sur) and the low-low cluster (province of Chaco) remained in the following period, with another low-low cluster (Corrientes province, neighbouring Chaco province). In the Retail & recreation category, four clusters were formed in the second period: low-low cluster (Santiago del Estero province and the province of Tierra del Fuego, Antarctica and Islas del Atlántico Sur), high-high cluster (province of Buenos Aires), and low-high outlier (province of La Pampa).
In the case of Brazil, Figure 21 and Figure 22 show the formation of clusters in the two periods considered. As previously presented, while, for Argentina and Chile, the absence of spatial dependence on population mobility predominated among Google categories, in Brazil, this was the exception and independent of the analysed period. Brazil presents the formation of clusters involving a more significant number of territorial divisions than that observed for the other two countries. Low-low clusters (low variation of mobility to the baseline) predominated and most of the time involved states in the Midwest Region, North Region, and the state of São Paulo, located in the Southeast Region of the country. In Brazil’s case, it is also noteworthy that the high-high clusters involve mostly states in the Northeast Region and at least one state of South Region of the country. In the second period, which corresponds to a strong economic reopening in the states of the Northeast Region, for example, the clusters in the Grocery & pharmacy, Residential, and Parks categories disappear, having remained only for the Retail & recreation and Workplaces category, which still operated under greater restrictions imposed on the movement of people.
For Chile, which has smaller territorial dimensions than Argentina and Brazil, Figure 23 and Figure 24 show the formation of rare and small clusters.
In the period from 1 June to 27 October 2020, the province of Maule formed a low-low cluster for the Retail & recreation category, with this Chilean administrative unit being one of the least populous in the country. In addition, in the second period analysed, this province formed a low-low cluster for the Parks category, as well as the province of Arica and Parinacota (low-high outlier) and Ñuble (low-low cluster) in the case of the Grocery & pharmacy category. The province of Ñuble, in turn, formed a high-low cluster in the Transit stations category from 1 June to 27 October 2020.
Together, the results obtained from Global and Local Moran Index for the three countries rejected H2 that population mobility occurs randomly in space. And in a more particular way for Brazil, in which results regarding the Global Moran Index for almost all Google categories indicated that the population mobility in both periods considered followed a spatial pattern; that is, it did not occur randomly. The formation of clusters indicates that the mobility of the population does not occur as uniformly as one might expect in cases where government measures determine social distancing as a rule and regulate the functioning of certain social activities. Whether there are administrative units that adhere to or break social distancing more or less than their neighbours, either these rules are not being observed by everyone or there is no coordination between national and local guidelines. For Argentina and Chile, two countries with low circulation of people and greater rigidity in their measures of social distancing, the formation of clusters was less frequent than in the Brazilian case. However, it is interesting to note that, even in these cases, clusters were formed, indicating the difficulties of governments in keeping their population under control and for long periods, regardless of the degree of rigidity of their measures and the size of their population and territory.

7. Discussion

In a context in which pharmaceutical solutions are not available to retain the advancement of the novel coronavirus worldwide, social distancing occupies a central position as mitigation actions against the Covid-19. Using geolocation data from cell phones from Google’s Community Mobility Reports, it was possible to identify variations in the circulation of people in South America’s selected countries, and, using the Covid stringency index from Oxford Covid-19 Government Response Tracker (OxCGRT) to measure the level of rigidity of measures of social distancing, it is possible to identify also important differences between the countries analysed.
In this work, we considered eight months (from 15 February to 27 October 2020) to analyse the trend of population mobility in South America, which, shortly after the World Health Organisation declared the Covid-19 pandemic, already had a considerable number of cases and deaths from the new coronavirus worldwide. Considering a transient period, in which the leaders astonished by the confirmation of the first cases and the increasing levels of transmission took their first steps towards social distancing, and a steady-state period in which the contagion rhythm of Covid-19 started to oscillate less and the mobility containment decrees had been in operation for a few months, analyses were carried out to test the H1: taking into account the magnitude of R ( t ) , the greater the rigidity of the decrees of social distancing, the lower the level of movement of people? The clusters that formed in the transient and steady-state period showed that the answer to this question may not be trivial, and, based on the results obtained, some conclusions can be enumerated.
The first is that, in the transient period, half of the countries were able to respond immediately with decrees aimed at containing the mobility of people classified as “average” in terms of rigidity. However, at least at that time, these efforts were unable to produce substantive effects on the population’s adherence to social distancing. The different population behaviours of different countries when facing high transmissibility levels of Covid-19 at the beginning of the pandemic is consistent with the argument that the understanding and perception of risk in relation to the disease depends on each country, too [31]. And regarding the possible mechanisms that support this behaviour variability among countries (and also internally), in Reference [88], the authors analysed 58 countries in the beginning of the Covid-19 pandemic (between 20 March and 7 April), and the interviewed said that their leaders were not doing enough to contain the spread of Covid-19. These arguments reflect the findings of the present work of low population response to measures of social distancing in the beginning of the pandemic, supporting the importance of the government performance on the recognition and participation of the population in preventive measures against the novel coronavirus.
A second conclusion based on the results found is that, in the steady-state period, the experiences of Uruguay (medium CSI and high CMI), Brazil (high CSI and high CMI), Paraguay, Ecuador, Venezuela, Colombia, and Bolivia (very high CSI and middle CMI) point to the rejection of the hypothesis that countries that have adopted stricter social distancing measures have a lower level of movement of people during the pandemic. This hypothesis was confirmed only for three of the ten countries analysed (Chile, Argentina, and Peru), which presented a very high Covid stringency index and low community mobility index. The greater adherence of the population of these countries to the measures of social distancing taken, whether adopted in contexts of national lockdown (in the case of Argentina and Peru) or not (in the case of Chile), can be based on specific sociodemographic characteristics of these countries combination with the peculiarities of the distancing decrees applied. As discussed, Argentina undertook one of the most rigid and long-lasting lockdowns in the region, as well as Peru, which came to implement rules for the movement of people based, including, on their gender [89]. In the case of Chile, which has a population of about 3.5 million people in a small territory compared to the others, these factors added to cultural and civic characteristics may have contributed to its population responding more strongly to the social distancing.
However, apart from these exceptions, and regardless of the type of social distancing adopted (lockdown or not), the control of the movement of people does not seem to have been an easy equation to be solved in the region, despite efforts to undertake more rigid measures of social distancing over time. The analysis of the PDF of the Covid stringency index during the steady-state period in particular shows patterns of multi-modal curves, which signals an attempt by governments to adjust their decrees of social distancing in the face of the evolution of Covid-19 and also to economic pressures that imposed reopening of certain commercial activities in spite of the level of contagion of the disease, as has been reported in low and middle income countries [17]. Although, in the steady-state period, the values of R ( t ) were more stable in relation to the transient period, they are oscillating around 1, indicating that the level of transmission may have decreased, but the virus continued to circulate. As demonstrated, the successful implementation and strictness of the decrees of social distancing may be related to other actions of an epidemiological nature, such as the structuring of the health system and services, such as testing and tracking contacts of infected people. Argentina, for example, despite the rigidity and durability of its lockdown, is one of the countries that least performs Covid-19 tests in the region, and this may have made the difference for the sustained increase in the number of cases and deaths as of the second semester.
The third conclusion is that, in a more rigid scenario of social distancing measures, regional mobility patterns seem to matter less or are not even formed, while, in a less rigid scenario of community mobility restricting, the political-administrative units have greater flexibility to deal with their decrees, which was reflected in the formation of large regional clusters during the pandemic. Based on the descriptive analysis of spatial auto-correlation (Global and Local Moran Index) for the two periods that differ as to the beginning of the easing of social distancing, it was found that there is a dependence on space in terms of population mobility in the period considered for the three countries (Argentina, Brazil, and Chile), rejecting our second hypothesis. Especially in Brazil, a country with the highest level of mobility and lower level of rigidity of its measures of social distancing, spatial dependence was more substantial than in Argentina and Chile, countries that presented when compared to Brazil a lower level of circulation of people and greater rigidity of their decrees to contain population mobility during the pandemic. In the case of Brazil, it is important to highlight that the asymmetry between the government guidelines and the health authorities ones in some aspects, such as the effectiveness of social distancing in containing the virus spread, may have contributed to a pattern of high internal mobility [77,90].
In the case of Argentina and Chile, the formation of cluster was less common than in the Brazilian, as well as the formation of small and rare ones. Anyway, it is important to consider that even for these two countries, randomness in the circulation of people during the pandemic was not the only pattern found, corroborating the findings from Rieger and Wang [16] about “slow erosion” when having these more rigid measures of social distancing. It should be noted that this work did not consider details regarding the measures adopted by countries to assess their effects on the community mobility; we considered only the degree of rigidity of the social distancing measures expressed in the Covid stringency index.
The results obtained have important public policy implications in the context of the pandemic, which must be observed by governments while the mass vaccination of the world population is still on going. Considering South America, a socially unequal region that gathers low and middle-income countries, it was found that the highest levels of movement are not necessarily related to the highest proportion of workers who had no other option but to break the social distance. For many, not obeying the so-called stay-in-home is a matter of survival. But whether they live in countries that were able to offer support, such as income transfer policies, efficient in granting benefits and perennials, and in conjunction with appropriate health policies, the chances of containing Covid-19’s mobility and advancing would be greater, and especially if some strict measures of social distancing were maintained, even in a context of lockdown easier imposed by economic reopening.
Summarising, we highlight the main findings of this work:
  • In the transient period when Covid-19 transmission levels are high and governments are implementing their first measures of social distancing, population adherence to these policies is low. Aspects, such as the population’s lower perception of risk and low level of trust in governments and authorities to deal with the pandemic, may be one of the aspects related to this pattern found;
  • in the steady-state period, which corresponds to a period of greater exposure to Covid-19’s social distancing measures and more stable transmission levels, the population’s response to the rigidity of social distancing measures is not always more obedience to social distancing;
  • in a more rigid scenario of measures of social distancing, few and small clusters are formed, while, in a less rigid scenario, many and extensive clusters are observed;
  • the proposition of cash transfer policies and others supports for informal workers during the pandemic are important to curb population mobility, but are more likely to prosper if they are effective in their implementation and if they are accompanied by coordinated measures of social distancing and health surveillance;
  • in the case of Brazil, the formation of extensive mobility clusters may have been a reflection of the absence of clear national guidelines and coordinated with the units of the federation and health authorities to face the pandemic; and
  • in the case of Argentina and Chile, that represent middle-income countries in South America, the formation of clusters despite the high level of rigidity of its measures of social distancing and low level of movement of people points to the socioeconomic difficulties of these nations in maintaining only essential economic activities during the pandemic.

8. Study Limitations and Final Considerations

Regarding the data and the methodology used in this work, although the information analysed has led to consistent results, it is crucial to consider that Google data have limitations. For example, the coverage of the user population who activate the location history of their mobile devices, allowing Google to capture mobility data is unknown. The information available by Google in its documentation is that locations and categories that did not reach statistically significant data were not included in the time series provided by the company [40]. Still, regarding the limitations of Google’s physical space categories, places, like home and work, are diffuse, which can lead to inaccurate results about the actual population that obeyed the social distancing, staying in their homes, or who performed work activities during the pandemic. It would be worth it to combine Google data with other sources, such as Mobility Trends Reports from Apple (https://covid19.apple.com/mobility, accessed on 28 February 2021), in order to have a more broad analysis.
Regarding the Covid stringency index, as stated in the methodological section, it does not measure or imply the appropriateness or effectiveness of government measures. Therefore, very high or very low scores do not mean that one country was better or worse than another in terms of social distancing, but one can only make inferences about the variation in the degree of rigidity of the set of measures adopted.
Regarding the methodology, it is possible that the choice for spatial analyses at provinces or state levels may not include the internal variability of countries in terms of mobility. Therefore, it is important to go deeper into data analysis (and even look for other datasets), in order to monitor social distancing in smaller units. In addition, in relation to the calculation of the Covid-19 reproduction number, it is possible that issues of under-reporting of cases and deaths may have occurred, and this must be taken into consideration when analysing trends.
As future work, we plan to analyse the relationship between the rigidity of social distancing measures and the movement of people in other regions of the world, especially in those locations that started the entry into a second wave of Covid-19 in September.

Author Contributions

Conceptualization, Gisliany Lillian Alves de Oliveira, Luciana Lima, Ivanovitch Silva, Marcel da Câmara Ribeiro-Dantas and Patricia Takako Endo; methodology, Gisliany Lillian Alves de Oliveira, Luciana Lima and Ivanovitch Silva; software, Gisliany Lillian Alves de Oliveira, Luciana Lima and Ivanovitch Silva; validation, Luciana Lima, Ivanovitch Silva and Patricia Takako Endo; formal analysis, Gisliany Lillian Alves de Oliveira, Luciana Lima, Ivanovitch Silva, Marcel da Câmara Ribeiro-Dantas and Patricia Takako Endo; investigation, Gisliany Lillian Alves de Oliveira, Luciana Lima, Ivanovitch Silva, Marcel da Câmara Ribeiro-Dantas and Patricia Takako Endo; resources, Gisliany Lillian Alves de Oliveira, Luciana Lima, Ivanovitch Silva and Marcel da Câmara Ribeiro-Dantas; data curation, Gisliany Lillian Alves de Oliveira, Luciana Lima, Ivanovitch Silva and Marcel da Câmara Ribeiro-Dantas; writing—original draft preparation, Gisliany Lillian Alves de Oliveira, Luciana Lima, Ivanovitch Silva, Marcel da Câmara Ribeiro-Dantas and Patricia Takako Endo; writing—review and editing, Gisliany Lillian Alves de Oliveira, Luciana Lima, Ivanovitch Silva, Marcel da Câmara Ribeiro-Dantas, Kayo Henrique Monteiro and Patricia Takako Endo; visualization, Gisliany Lillian Alves de Oliveira, Luciana Lima and Ivanovitch Silva; supervision, Luciana Lima, Ivanovitch Silva and Patricia Takako Endo; project administration, Luciana Lima and Ivanovitch Silva; funding acquisition, Ivanovitch Silva. All authors have read and agreed to the published version of the manuscript.

Funding

This research received no external funding.

Data Availability Statement

All data used in this work were gathered from a Google public repository named Google Community Mobility Reports, available at https://www.google.com/covid19/mobility/ (accessed on 28 February 2021).

Acknowledgments

This work was carried out with the support of the Coordination for the Improvement of Higher Education Personnel—Brazil (CAPES)—Financing Code 001.

Conflicts of Interest

The authors declare no conflict of interest.

References

  1. World Health Organization. WHO Director-General’s Opening Remarks at the Media Briefing on COVID-19. 11 March 2020. Available online: https://www.who.int/dg/speeches/detail/who-director-general-s-opening-remarks-at-the-media-briefing-on-Covid-19---11-march-2020 (accessed on 1 August 2020).
  2. De Natale, G.; Ricciardi, V.; De Luca, G.; De Natale, D.; Di Meglio, G.; Ferragamo, A.; Marchitelli, V.; Piccolo, A.; Scala, A.; Somma, R.; et al. The COVID-19 Infection in Italy: A Statistical Study of an Abnormally Severe Disease. J. Clin. Med. 2020, 9, 1564. [Google Scholar] [CrossRef]
  3. Chahrour, M.; Assi, S.; Bejjani, M.; Nasrallah, A.A.; Salhab, H.; Fares, M.; Khachfe, H.H. A Bibliometric Analysis of COVID-19 Research Activity: A Call for Increased Output. Cureus 2020, 12, e7357. [Google Scholar] [CrossRef] [Green Version]
  4. Singh, R.K.; Rani, M.; Bhagavathula, A.S.; Sah, R.; Rodriguez-Morales, A.J.; Kalita, H.; Nanda, C.; Sharma, S.; Sharma, Y.D.; Rabaan, A.A.; et al. Prediction of the COVID-19 pandemic for the top 15 affected countries: Advanced autoregressive integrated moving average (ARIMA) model. JMIR Public Health Surveill. 2020, 6, e19115. [Google Scholar] [CrossRef]
  5. World Health Organization (WHO). Coronavirus Disease (COVID-19) Situation Report-136. 2020. Available online: https://www.who.int/docs/default-source/coronaviruse/situation-reports/20200604-covid-19-sitrep-136.pdf?sfvrsn=fd36550b_2 (accessed on 6 June 2020).
  6. World Health Organization. WHO Coronavirus Disease (COVID-19) Dashboard. 2020. Available online: https://covid19.who.int/ (accessed on 27 November 2020).
  7. Lippi, G.; Henry, B.M.; Bovo, C.; Sanchis-Gomar, F. Health risks and potential remedies during prolonged lockdowns for coronavirus disease 2019 (COVID-19). Diagnosis 2020, 7, 85–90. [Google Scholar] [CrossRef]
  8. The Lancet Respiratory Medicine. COVID-19: Delay, mitigate, and communicate. Lancet Respir. Med. 2020, 8, 321. [Google Scholar] [CrossRef]
  9. Sjödin, H.; Wilder-Smith, A.; Osman, S.; Farooq, Z.; Rocklöv, J. Only strict quarantine measures can curb the coronavirus disease (COVID-19) outbreak in Italy, 2020. Eurosurveillance 2020, 25, 2000280. [Google Scholar] [CrossRef] [PubMed]
  10. Aquino, E.M.; Silveira, I.H.; Pescarini, J.M.; Aquino, R.; Souza-Filho, J.A.D. Medidas de distanciamento social no controle da pandemia de COVID-19: Potenciais impactos e desafios no Brasil. Ciência Saúde Coletiva 2020, 25, 2423–2446. [Google Scholar] [CrossRef]
  11. Srivastava, N.; Baxi, P.; Ratho, R.; Saxena, S.K. Global Trends in Epidemiology of Coronavirus Disease 2019 (COVID-19). In Coronavirus Disease 2019 (COVID-19); Springer: Berlin/Heidelberg, Germany, 2020; pp. 9–21. [Google Scholar]
  12. Wong, C.K.; Wong, J.Y.; Tang, E.H.; Au, C.H.; Lau, K.T.; Wai, A.K. Effects of national containment measures on decelerating the increase in daily new cases of COVID-19 in 54 countries and four epicenters of pandemic. J. Med. Internet Res. 2020, 22, e19904. [Google Scholar] [CrossRef]
  13. Islam, N.; Sharp, S.J.; Chowell, G.; Shabnam, S.; Kawachi, I.; Lacey, B.; Massaro, J.M.; D’Agostino, R.B.; White, M. Physical distancing interventions and incidence of coronavirus disease 2019: Natural experiment in 149 countries. BMJ 2020, 370, m2743. [Google Scholar] [CrossRef]
  14. Rawson, T.; Brewer, T.; Veltcheva, D.; Huntingford, C.; Bonsall, M.B. How and when to end the COVID-19 lockdown: An optimization approach. Front. Public Health 2020, 8, 262. [Google Scholar] [CrossRef] [PubMed]
  15. Li, Y.; Wang, L.W.; Peng, Z.H.; Shen, H.B. Basic reproduction number and predicted trends of coronavirus disease 2019 epidemic in the mainland of China. Infect. Dis. Poverty 2020, 9, 1–13. [Google Scholar] [CrossRef] [PubMed]
  16. Rieger, M.O.; Wang, M. Secret Erosion of the “Lockdown”? Patterns in Daily Activities during the SARS-Cov2 Pandemics around the World. Rev. Behav. Econ. 2020, 7, 223–235. [Google Scholar] [CrossRef]
  17. Chowdhury, R.; Luhar, S.; Khan, N.; Choudhury, S.R.; Matin, I.; Franco, O.H. Long-term strategies to control COVID-19 in low and middle-income countries: An options overview of community-based, non-pharmacological interventions. Eur. J. Epidemiol. 2020, 35, 743–748. [Google Scholar] [CrossRef] [PubMed]
  18. Looi, M.K. Covid-19: Is a second wave hitting Europe? BMJ 2020, 371, m4113. [Google Scholar] [CrossRef]
  19. Lasry, A.; Kidder, D.; Hast, M.; Poovey, J.; Sunshine, G.; Zviedrite, N.; Ahmed, F.; Ethier, K.A. Timing of community mitigation and changes in reported COVID-19 and community mobility—four US metropolitan areas, February 26–April 1, 2020. MMWR Morb. Mortal. Wkly. Rep. 2020, 69, 451–457. [Google Scholar] [CrossRef] [Green Version]
  20. Vokó, Z.; Pitter, J.G. The effect of social distance measures on COVID-19 epidemics in Europe: An interrupted time series analysis. GeroScience 2020, 42, 1075–1082. [Google Scholar] [CrossRef]
  21. Delen, D.; Eryarsoy, E.; Davazdahemami, B. No Place Like Home: Cross-National Data Analysis of the Efficacy of Social Distancing During the COVID-19 Pandemic. JMIR Public Health Surveill. 2020, 6, e19862. [Google Scholar] [CrossRef]
  22. Arashi, M.; Bekker, A.; Salehi, M.; Millard, S.; Erasmus, B.; Cronje, T.; Golpaygani, M. Spatial analysis and prediction of COVID-19 spread in South Africa after lockdown. arXiv 2020, arXiv:2005.09596. [Google Scholar]
  23. Miller, L.E.; Bhattacharyya, R.; Miller, A.L. Spatial analysis of global variability in Covid-19 burden. Risk Manag. Healthc. Policy 2020, 13, 519. [Google Scholar] [CrossRef]
  24. Cruz, C.H.D.B. Social distancing in São Paulo State: Demonstrating the reduction in cases using time series analysis of deaths due to COVID-19. Rev. Bras. Epidemiol. 2020, 23, e200056. [Google Scholar] [CrossRef]
  25. Borracci, R.A.; Giglio, N.D. Forecasting the effect of social distancing on covid-19 autumn-winter outbreak in the metropolitan area of buenos aires. Medicina 2020, 80, 7–15. [Google Scholar]
  26. Pereira, I.G.; Guerin, J.M.; Junior, A.G.S.; Distante, C.; Garcia, G.S.; Goncalves, L.M. Forecasting Covid-19 dynamics in Brazil: A data driven approach. arXiv 2020, arXiv:2005.09475. [Google Scholar]
  27. Franch-Pardo, I.; Napoletano, B.M.; Rosete-Verges, F.; Billa, L. Spatial analysis and GIS in the study of COVID-19. A review. Sci. Total Environ. 2020, 739, 140033. [Google Scholar] [CrossRef]
  28. Zhu, L.; Liu, X.; Huang, H.; Avellán-Llaguno, R.D.; Lazo, M.M.L.; Gaggero, A.; Rifo, R.S.; Patiño, L.; Valencia-Avellan, M.; Diringer, B.; et al. Meteorological impact on the COVID-19 pandemic: A study across eight severely affected regions in South America. Sci. Total Environ. 2020, 744, 140881. [Google Scholar] [CrossRef]
  29. Hilton, J.; Keeling, M.J. Estimation of country-level basic reproductive ratios for novel Coronavirus (SARS-CoV-2/COVID-19) using synthetic contact matrices. PLoS Comput. Biol. 2020, 16, e1008031. [Google Scholar] [CrossRef]
  30. Oyedotun, T.D.T.; Moonsammy, S. Spatiotemporal Variation of COVID-19 and Its Spread in South America: A Rapid Assessment. Ann. Am. Assoc. Geogr. 2020, 1–12. [Google Scholar] [CrossRef]
  31. Huynh, T.L.D. Does culture matter social distancing under the COVID-19 pandemic? Saf. Sci. 2020, 130, 104872. [Google Scholar] [CrossRef] [PubMed]
  32. Borg, M.A. Cultural determinants of infection control behaviour: Understanding drivers and implementing effective change. J. Hosp. Infect. 2014, 86, 161–168. [Google Scholar] [CrossRef]
  33. Brito, P.L.; Kuffer, M.; Koeva, M.; Pedrassoli, J.C.; Wang, J.; Costa, F.; Freitas, A.D.D. The Spatial Dimension of COVID-19: The Potential of Earth Observation Data in Support of Slum Communities with Evidence from Brazil. ISPRS Int. J. Geo-Inf. 2020, 9, 557. [Google Scholar] [CrossRef]
  34. Earth Observation Data. 2020. Available online: https://earthdata.nasa.gov/earth-observation-data (accessed on 4 December 2020).
  35. Seale, H.; Heywood, A.E.; Leask, J.; Steel, M.; Thomas, S.; Durrheim, D.N.; Bolsewicz, K.; Kaur, R. COVID-19 is rapidly changing: Examining public perceptions and behaviors in response to this evolving pandemic. PLoS ONE 2020, 15, e0235112. [Google Scholar] [CrossRef]
  36. Geana, M.V. Kansans in the Middle of the Pandemic: Risk Perception, Knowledge, Compliance with Preventive Measures, and Primary Sources of Information about COVID-19. Kans. J. Med. 2020, 13, 160. [Google Scholar] [CrossRef]
  37. Ibuka, Y.; Chapman, G.B.; Meyers, L.A.; Li, M.; Galvani, A.P. The dynamics of risk perceptions and precautionary behavior in response to 2009 (H1N1) pandemic influenza. BMC Infect. Dis. 2010, 10, 296. [Google Scholar] [CrossRef] [Green Version]
  38. Taglioni, F.; Cartoux, M.; Dellagi, K.; Dalban, C.; Fianu, A.; Carrat, F.; Favier, F. The influenza A (H1N1) pandemic in Reunion Island: Knowledge, perceived risk and precautionary behaviour. BMC Infect. Dis. 2013, 13, 34. [Google Scholar] [CrossRef]
  39. da Câmara Ribeiro-Dantas, M.; Alves, G.; Gomes, R.B.; Bezerra, L.C.; Lima, L.; Silva, I. Dataset for country profile and mobility analysis in the assessment of COVID-19 pandemic. Data Brief 2020, 31, 105698. [Google Scholar] [CrossRef]
  40. Google LLC. Google COVID-19 Community Mobility Reports. 2020. Available online: https://www.google.com/covid19/mobility/ (accessed on 1 November 2020).
  41. Hale, T.; Webster, S.; Petherick, A.; Phillips, T.; Kira, B. Oxford covid-19 government response tracker. Blavatnik Sch. Gov. 2020, 25. [Google Scholar]
  42. Lima, L.C.D.; Silva, I.; Oliveira, G.L.A. Informações de Localização de Celulares Ajudam a Medir o Isolamento Social no RN. 2020. Available online: https://demografiaufrn.net/2020/04/06/informacoes-de-localizacao-de-celulares-ajudam-a-medir-o-isolamento-social-no-rn/ (accessed on 6 June 2020).
  43. Statsmodels. 2020. Available online: https://www.statsmodels.org/devel/generated/statsmodels.tsa.seasonal.STL.html (accessed on 4 December 2020).
  44. Thompson, R.; Stockwin, J.; van Gaalen, R.D.; Polonsky, J.; Kamvar, Z.; Demarsh, P.; Dahlqwist, E.; Li, S.; Miguel, E.; Jombart, T.; et al. Improved inference of time-varying reproduction numbers during infectious disease outbreaks. Epidemics 2019, 29, 100356. [Google Scholar] [CrossRef]
  45. Adam, D. A Guide to R-The Pandemic’s Misunderstood Metric. Nature 2020, 583, 346–348. [Google Scholar] [CrossRef]
  46. Du, Z.; Wang, L.; Fox, S.J.; Cowling, B.J.; Galvani, A.P.; Meyers, L.A. Proactive social distancing mitigates COVID-19 outbreaks within a month across 58 mainland China cities. medRxiv 2020. [Google Scholar] [CrossRef]
  47. Pei, S.; Kandula, S.; Shaman, J. Differential Effects of Intervention Timing on COVID-19 Spread in the United States. Sci. Adv. 2020, 6, eabd6370. [Google Scholar] [CrossRef]
  48. Cori, A.; Ferguson, N.M.; Fraser, C.; Cauchemez, S. A new framework and software to estimate time-varying reproduction numbers during epidemics. Am. J. Epidemiol. 2013, 178, 1505–1512. [Google Scholar] [CrossRef] [Green Version]
  49. Musa, S.S.; Zhao, S.; Wang, M.H.; Habib, A.G.; Mustapha, U.T.; He, D. Estimation of exponential growth rate and basic reproduction number of the coronavirus disease 2019 (COVID-19) in Africa. Infect. Dis. Poverty 2020, 9, 1–6. [Google Scholar] [CrossRef]
  50. Leclerc, Q.J.; Nightingale, E.; Abbott, S.; Jombart, T.; CMMID COVID-19 Working Group. Analysis of temporal trends in potential COVID-19 cases reported through NHS Pathways England. medRxiv 2020. [Google Scholar] [CrossRef]
  51. Covid-19 Estimativas de R(t) por Estados do Brasil. 2020. Available online: https://github.com/flaviovdf/Covid19 (accessed on 4 December 2020).
  52. The Editors of Encyclopaedia Britannica. Probability Density Function. 2018. Available online: https://www.britannica.com/science/density-function (accessed on 20 July 2020).
  53. World Bank. World Bank Open Data: Data for Chile, Argentina, Brazil. 2020. Available online: https://data.worldbank.org/indicator/SP.POP.TOTL (accessed on 27 November 2020).
  54. Shryock, H.S.; Siegel, J.S.; Larmon, E.A. The Methods and Materials of Demography; US Bureau of the Census: Suitland, MD, USA, 1973; Volume 2. [Google Scholar]
  55. Anselin, L.; Piras, G. Approaches towards the Identification of Patterns in Violent Events, Baghdad, Iraq; Technical Report; Arizona State Univ Tempe School Of Geographical Sciences: Tempe, AZ, USA, 2009. [Google Scholar]
  56. Dubé, J.; Legros, D. Spatial Econometrics Using Microdata; John Wiley & Sons: Hoboken, NJ, USA, 2014. [Google Scholar]
  57. Chi, G.; Zhu, J. Spatial regression models for demographic analysis. Popul. Res. Policy Rev. 2008, 27, 17–42. [Google Scholar] [CrossRef]
  58. Monteiro, A.M.V.; Câmara, G.; Carvalho, M.; Druck, S. Análise Espacial de Dados Geográficos; EMBRAPA: Brasília, Brazil, 2004. [Google Scholar]
  59. Feola, G.; Butt, A. The diffusion of grassroots innovations for sustainability in Italy and G reat B ritain: An exploratory spatial data analysis. Geogr. J. 2017, 183, 16–33. [Google Scholar] [CrossRef] [Green Version]
  60. Lloyd, C. Spatial Data Analysis: An Introduction for GIS Users; Oxford University Press: Oxford, UK, 2010. [Google Scholar]
  61. Guțoiu, G. Spatial polarization in Bucharest at the 2014 Presidential Election. S. E. Eur. J. Political Sci. 2015, III, 1–18. [Google Scholar]
  62. Barreca, A.; Curto, R.; Rolando, D. Assessing Social and Territorial Vulnerability on Real Estate Submarkets. Buildings 2017, 7, 94. [Google Scholar] [CrossRef] [Green Version]
  63. Amaral, S.; Câmara, G.; Quintanilha, J. Análise Exploratória das Relações Espaciais do Desflorestamento na Amazônia Legal Brasileira; Gisbrasil: Salvador, Brazil, 2000. [Google Scholar]
  64. Griffith, D.A. Spatial autocorrelation. Int. Encycl. Hum. Geogr. 2009, 2009, 308–316. [Google Scholar]
  65. Fontes, M.J.; Ribeiro, A.; Silva, J. Accessibility and local development: Interaction between cross-border accessibility and local development in Portugal and Spain. Procedia Soc. Behav. Sci. 2014, 111, 927–936. [Google Scholar] [CrossRef] [Green Version]
  66. Economic Commission for Latin America and the Caribbean (ECLAC). COVID-2019 Observatory for Latin America and the Caribbean: Actions by Country. 2020. Available online: https://eclac.maps.arcgis.com/apps/MapSeries/index.html?appid=57c96de0159641b095bd1c213c320ab9 (accessed on 3 May 2020).
  67. WHO Region: Region of the Americas—Argentina. 2020. Available online: https://www.who.int/countries/arg/ (accessed on 4 December 2020).
  68. WHO Region: Region of the Americas—Colombia. 2020. Available online: https://www.who.int/countries/col/ (accessed on 4 December 2020).
  69. Paniz-Mondolfi, A.E.; Sordillo, E.M.; Márquez-Colmenarez, M.C.; Delgado-Noguera, L.A.; Rodriguez-Morales, A.J. The arrival of SARS-CoV-2 in Venezuela. Lancet 2020, 395, e85–e86. [Google Scholar] [CrossRef]
  70. Reuters. Colombia Extends Coronavirus Lockdown Measures until July 15. 2020. Available online: https://www.reuters.com/article/us-health-coronavirus-colombia-idUSKBN23V02I (accessed on 27 November 2020).
  71. Agência Brasil. Chile Decreta Lockdown em Santiago Após Explosão de Casos de Covid-19. 2020. Available online: https://agenciabrasil.ebc.com.br/saude/noticia/2020-05/chile-decreta-lockdown-em-santiago-apos-explosao-de-casos-de-covid-19 (accessed on 27 November 2020).
  72. Peru: WHO Coronavirus Disease (COVID-19) Dashboard | WHO Coronavirus Disease (COVID-19) Dashboard. 2020. Available online: https://covid19.who.int/region/amro/country/pe (accessed on 27 November 2020).
  73. Hallo, A.; Rojas, A.; Hallo, C. Perspective from Ecuador, the Second Country with More Confirmed Cases of Coronavirus Disease 2019 in South America: A Review. Cureus 2020, 12, e7452. [Google Scholar] [CrossRef] [Green Version]
  74. EL COMERCIO. ¿Cómo Funcionan las Restricciones de Movilidad en Quito, Frente al Covid-19? 2020. Available online: https://www.elcomercio.com/actualidad/restricciones-movilidad-excepcion-quito.html (accessed on 6 June 2020).
  75. World Bank. World Bank Open Data: Population, Total. 2020. Available online: https://data.worldbank.org/?locations=CL-AR-BR (accessed on 27 November 2020).
  76. Lancet, T. COVID-19 in Brazil: “So what?”. Lancet 2020, 395, 1461. [Google Scholar] [CrossRef]
  77. Ajzenman, N.; Cavalcanti, T.; Da Mata, D. More than Words: Leaders’ Speech and Risky Behavior during a Pandemic. 2020. Available online: https://ssrn.com/abstract=3582908 (accessed on 15 September 2020).
  78. Uruguay: WHO Coronavirus Disease (COVID-19) Dashboard | WHO Coronavirus Disease (COVID-19) Dashboard. 2020. Available online: https://covid19.who.int/region/amro/country/uy (accessed on 27 November 2020).
  79. World Health Organization. COVID-19 Weekly Epidemiological Update, 3 November 2020; Technical Documents; World Health Organization: Geneva, Switzerland, 2020. [Google Scholar]
  80. Taylor, L. Uruguay is winning against covid-19. This is how. BMJ 2020, 370, m3575. [Google Scholar] [CrossRef]
  81. Paraguay: WHO Coronavirus Disease (COVID-19) Dashboard | WHO Coronavirus Disease (COVID-19) Dashboard. 2020. Available online: https://covid19.who.int/region/amro/country/py (accessed on 27 November 2020).
  82. Paniz-Mondolfi, A.; Munoz, M.; Florez, C.; Gomez, S.; Rico, A.; Pardo, L.; Barros, E.C.; Hernandez, C.; Delgado, L.; Jaimes, J.E.; et al. SARS-CoV-2 spread across the Colombian-Venezuelan border. Infect. Genet. Evol. 2020, 86, 104616. [Google Scholar] [CrossRef] [PubMed]
  83. Venezuela (Bolivarian Republic of): WHO Coronavirus Disease (COVID-19) Dashboard | WHO Coronavirus Disease (COVID-19) Dashboard. 2020. Available online: https://covid19.who.int/region/amro/country/ve (accessed on 27 November 2020).
  84. Hummel, C.; Knaul, F.M.; Touchton, M.; Guachalla, V.X.V.; Nelson-Nuñez, J.; Boulding, C. Poverty, precarious work, and the COVID-19 pandemic: Lessons from Bolivia. Lancet Glob. Health 2021. [Google Scholar] [CrossRef]
  85. de Carvalho, C.A.; Viola, P.C.D.A.F.; Sperandio, N. How is Brazil facing the crisis of Food and Nutrition Security during the COVID-19 pandemic? Public Health Nutr. 2021, 24, 561–564. [Google Scholar] [CrossRef]
  86. Prates, I.; Barbosa, R.J. The Impact of COVID-19 in Brazil: Labour Market and Social Protection Responses. Indian J. Labour Econ. 2020, 63, 31–35. [Google Scholar] [CrossRef]
  87. UNICEF-Argentina. Survey on People’s Perceptions and Attitudes. Impact of COVID-19 Pandemic and Government Measures on Everyday Lives. 2020. Available online: https://www.unicef.org/argentina/ (accessed on 20 February 2021).
  88. Fetzer, T.; Witte, M.; Hensel, L.; Jachimowicz, J.; Haushofer, J.; Ivchenko, A.; Caria, S.; Reutskaja, E.; Roth, C.; Fiorin, S.; et al. Perceptions of an Insufficient Government Response at the Onset of the COVID-19 Pandemic are Associated with Lower Mental Well-Being. PsyArXiv. [CrossRef]
  89. Peru, Panama Limit Movement By Gender In Bid To Slow The Coronavirus. 2020. Available online: https://www.npr.org/sections/coronavirus-live-updates/2020/04/03/826604070/peru-panama-limit-movement-by-gender-in-bid-to-slow-the-coronavirus (accessed on 27 November 2020).
  90. Mariani, L.; Gagete-Miranda, J.; Retti, P. Words can hurt: How political communication can change the pace of an epidemic. Covid Econ. Vetted Real Time Pap. 2020, 12, 104–137. [Google Scholar] [CrossRef]
Figure 1. Google Community Mobility Reports database. Source of basic data: Covid-19 Community Mobility Reports, Google.
Ijgi 10 00121 g001
Figure 2. Calculation of the mobility index area on a radar chart. Source of primary data: Covid-19 Community Mobility Reports, Google.
Ijgi 10 00121 g002
Figure 3. Rook’s case contiguity and queen’s case contiguity. Source: Reference [60].
Ijgi 10 00121 g003
Figure 4. Moran Scattering Diagram. Source: Adapted from References [61,63].
Ijgi 10 00121 g004
Figure 5. Lockdown, lockdown easing, and Covid-19 incidence rate in South America.
Ijgi 10 00121 g005
Figure 6. Evolution of the community mobility index in South America, from 15 February to 27 October 2020. Source of basic data: Covid-19 Community Mobility Reports, Google.
Ijgi 10 00121 g006
Figure 7. Probability density function (PDF) of the Covid stringency index: total, transient and steady-state periods. Source of basic data: Oxford Covid-19 Government Response Tracker (OxCGRT).
Ijgi 10 00121 g007
Figure 8. Community mobility index, Covid stringency index, and R ( t ) : Transient period. Source of basic data: Covid-19 Community Mobility Reports, Oxford Covid-19 Government Response Tracker (OxCGRT), and Covid-19 Community Centre for Systems Science and Engineering (CSSE) at Johns Hopkins University (JHU).
Ijgi 10 00121 g008
Figure 9. Community mobility index, Covid stringency index, and R ( t ) : Steady-state period. Source of basic data: Covid-19 Community Mobility Reports, Oxford Covid-19 Government Response Tracker (OxCGRT), and Covid-19 Community Centre for Systems Science and Engineering (CSSE) at Johns Hopkins University (JHU).
Ijgi 10 00121 g009
Figure 10. Daily evolution of R ( t ) and moving average seven days confirmed cases of Covid-19: Brazil, Argentina, and Chile. Source of basic data: Covid-19 Community Centre for Systems Science and Engineering (CSSE) at Johns Hopkins University (JHU).
Ijgi 10 00121 g010
Figure 11. Average variation of mobility from baseline (3 January to 6 February 2020) for the selected countries of South America during the period from 15 February to 31 May 2020. Lighter colours indicate greater distancing or greater isolation in residential areas. Source of basic data: Covid-19 Community Mobility Reports, Google.
Ijgi 10 00121 g011
Figure 12. Average variation of mobility from baseline (3 January to 6 February 2020) for the selected countries of South America during the period from 1 June to 27 October 2020. Lighter colours indicate greater distancing or greater isolation in residential areas. Source of basic data: Covid-19 Community Mobility Reports, Google.
Ijgi 10 00121 g012
Figure 13. Average variation of mobility from baseline (3 January to 6 February 2020) for the provinces of Argentina during the period from 15 February to 31 May 2020. Lighter colours indicate greater distancing or greater isolation in residential areas. Source of basic data: Covid-19 Community Mobility Reports, Google.
Ijgi 10 00121 g013
Figure 14. Average variation of mobility from baseline (3 January to 6 February 2020) for the provinces of Argentina during the period from 1 June to 27 October 2020. Lighter colours indicate greater distancing or greater isolation in residential areas. Source of basic data: Covid-19 Community Mobility Reports, Google.
Ijgi 10 00121 g014
Figure 15. Average variation of mobility from baseline (3 January to 6 February 2020) for the states of Brazil during the period from 15 February to 31 May 2020. Lighter colours indicate greater distancing or greater isolation in residential areas. Source of basic data: Covid-19 Community Mobility Reports, Google.
Ijgi 10 00121 g015
Figure 16. Average variation of mobility from baseline (3 January to 6 February 2020) for the states of Brazil during the period from 1 June to 27 October 2020. Lighter colours indicate greater distancing or greater isolation in residential areas. Source of basic data: Covid-19 Community Mobility Reports, Google.
Ijgi 10 00121 g016
Figure 17. Average variation of mobility from baseline (3 January to 6 February 2020) for the regions of Chile during the period from 15 February to 31 May 2020. Lighter colours indicate greater distancing or greater isolation in residential areas. Source of basic data: Covid-19 Community Mobility Reports, Google.
Ijgi 10 00121 g017
Figure 18. Average variation of mobility from baseline (3 January to 6 February 2020) for the regions of Chile during the period from 1 June to 27 October 2020. Lighter colours indicate greater distancing or greater isolation in residential areas. Source of basic data: Covid-19 Community Mobility Reports, Google.
Ijgi 10 00121 g018
Figure 19. Cluster maps and Local Indicators of Spacial Association (LISA) significance maps for Google categories from 15 February to 31 May 2020: Argentina. Source of basic data: Covid-19 Community Mobility Reports, Google.
Ijgi 10 00121 g019
Figure 20. Cluster maps and LISA significance maps for Google categories from 1 June to 27 October 2020: Argentina. Source of basic data: Covid-19 Community Mobility Reports, Google.
Ijgi 10 00121 g020
Figure 21. Cluster maps and LISA significance maps for Google categories from 15 February to 31 May 2020: Brazil. Source of basic data: Covid-19 Community Mobility Reports, Google.
Ijgi 10 00121 g021
Figure 22. Cluster maps and LISA significance maps for Google categories from 1 June to 27 October 2020: Brazil. Source of basic data: Covid-19 Community Mobility Reports, Google.
Ijgi 10 00121 g022
Figure 23. Cluster maps and LISA significance maps for Google categories from 15 February to 31 May 2020: Chile. Source of basic data: Covid-19 Community Mobility Reports, Google.
Ijgi 10 00121 g023
Figure 24. Cluster maps and LISA significance maps for Google categories from 1 June to 27 October 2020: Chile. Covid-19 Community Mobility Reports, Google.
Ijgi 10 00121 g024
Table 1. Proportion of informal employment related to total employment (2019) and Gini Index (2018). Source: Ilostat (2019) and World Bank (2018) 1.
CountryInformal Employment (%)Gini Index
Uruguay24.039.7
Argentina49.441.4
Bolivia84.942.2
Peru68.442.8
Chile 229.244.4
Ecuador73.645.4
Paraguay68.946.2
Colombia62.150.4
Brazil47.953.9
1 Information for Venezuela is not available. 2 For this country, the Gini Index refers to the year 2017.
Table 2. Moran’s index I and p-value significance probability for Argentina, Brazil, and Chile considering both analysed periods: 15 February to 31 May 2020, and 1 June to 27 October 2020.
15 February to 31 May 20201 June to 27 October 2020
RegionPlaceMoran’s Ip-ValueMoran’s Ip-Value
ArgentinaRetail & recreation0.23900.05300.28450.0110
Grocery & pharmacy0.13290.11800.20660.0640
Parks0.20470.05400.00700.3450
Transit stations−0.06960.4260−0.17980.1790
Workplaces0.33330.00700.40410.0030
Residential0.40070.00500.34590.0090
BrazilRetail & recreation0.54140.00100.55810.0010
Grocery & pharmacy0.55010.00100.40300.0030
Parks0.35380.00700.51840.0010
Transit stations0.21320.0440−0.00850.3610
Workplaces0.29560.01300.45810.0010
Residential0.29260.01900.14120.0850
ChileRetail & recreation0.06400.32600.36200.0470
Grocery & pharmacy−0.33200.1680−0.03190.4390
Parks0.28660.08500.34940.0520
Transit stations0.06120.30200.11410.2310
Workplaces−0.27100.1750−0.18490.3350
Residential0.09070.2110−0.00500.4100
Publisher’s Note: MDPI stays neutral with regard to jurisdictional claims in published maps and institutional affiliations.