Exploring Allometric Scaling Relations between Fractal Dimensions of Metro Networks and Economic, Environmental and Social Indicators: A Case Study of 26 Cities in China
Abstract
:1. Introduction
2. Data and Method
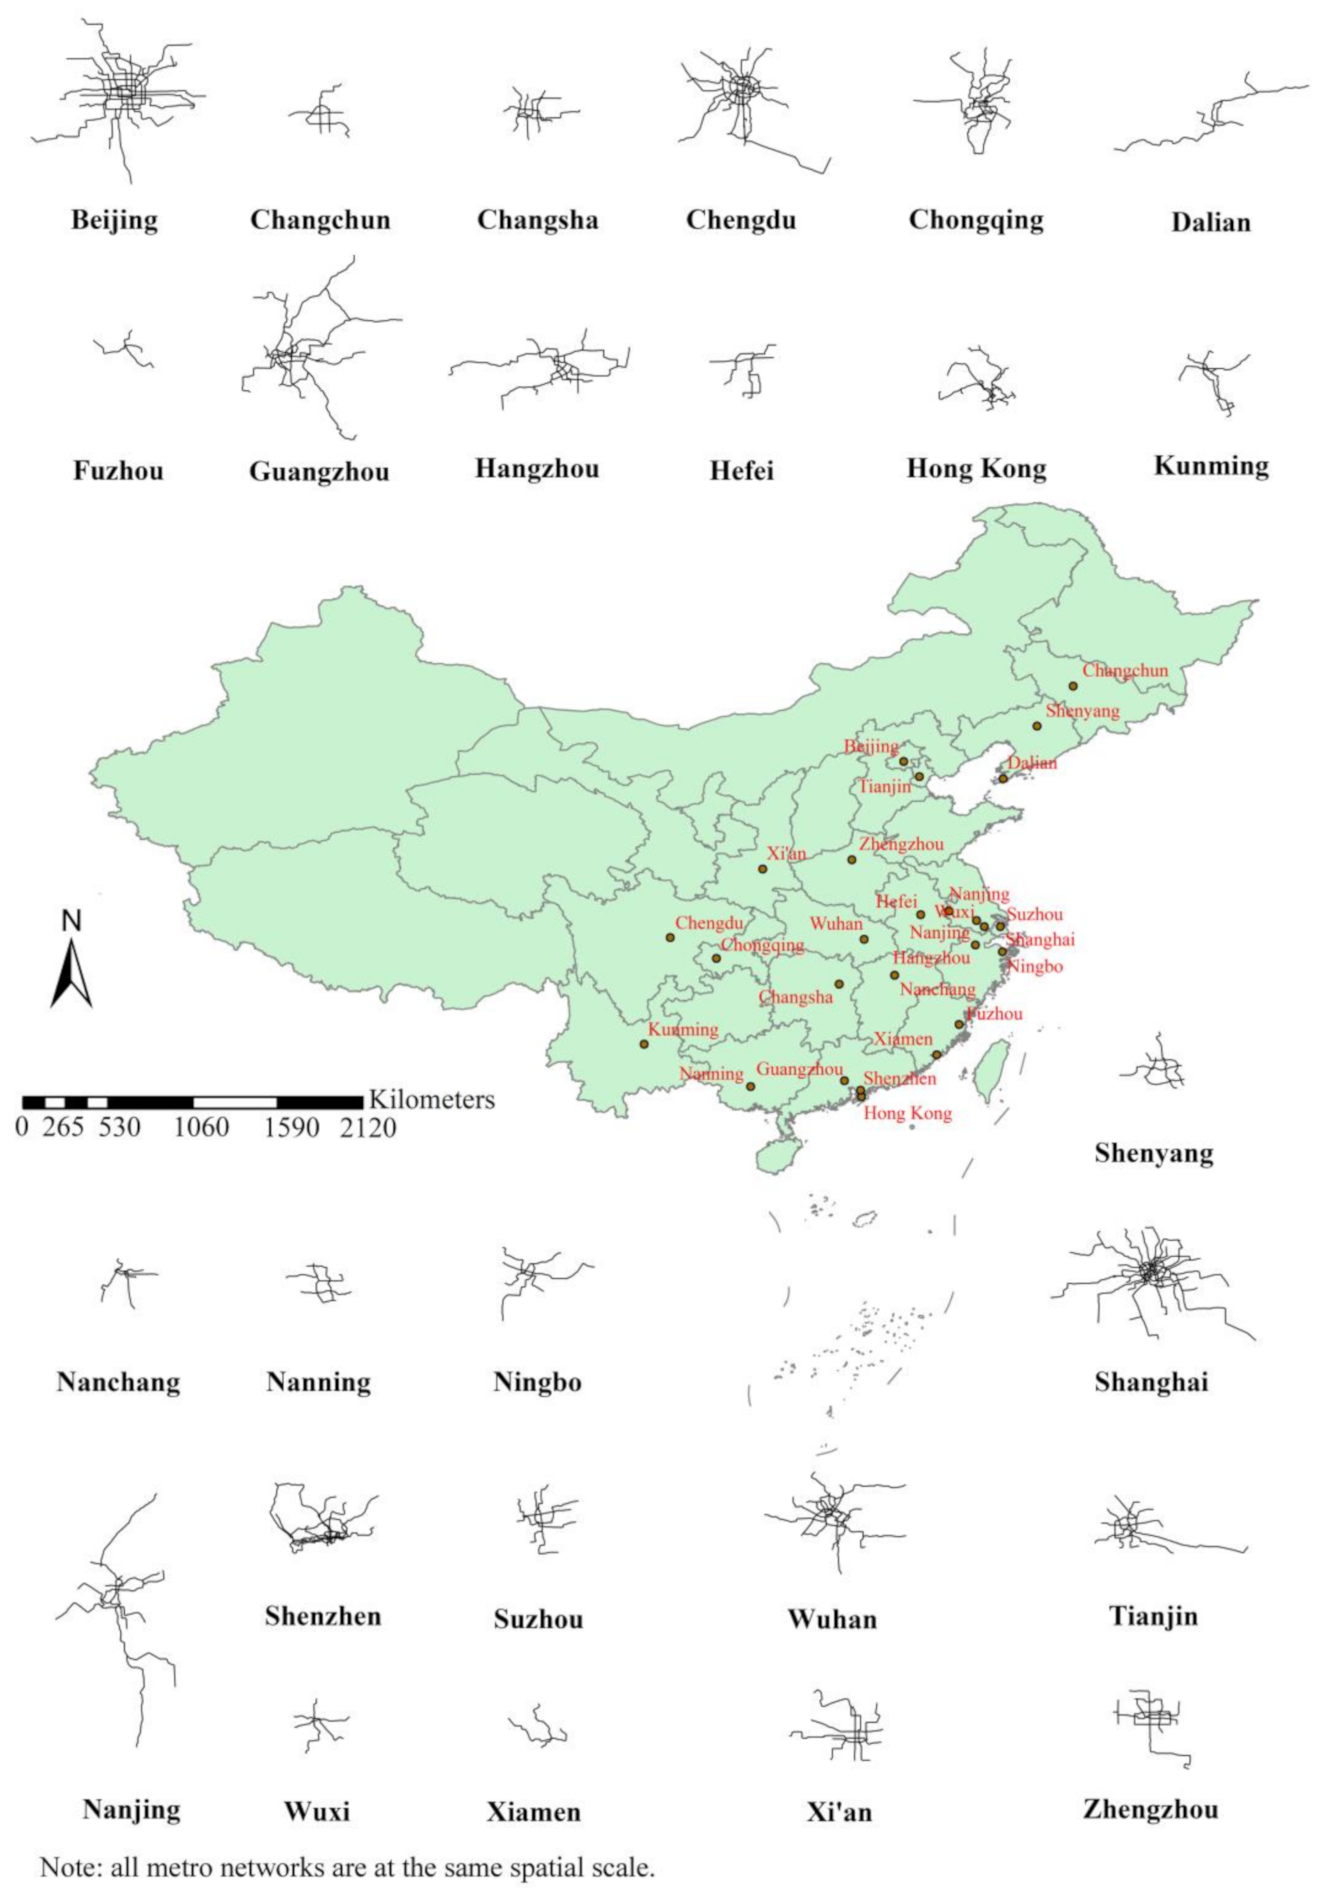
2.1. Study Area and Data Source
2.2. Fractal Theory
- The development of fractal theory
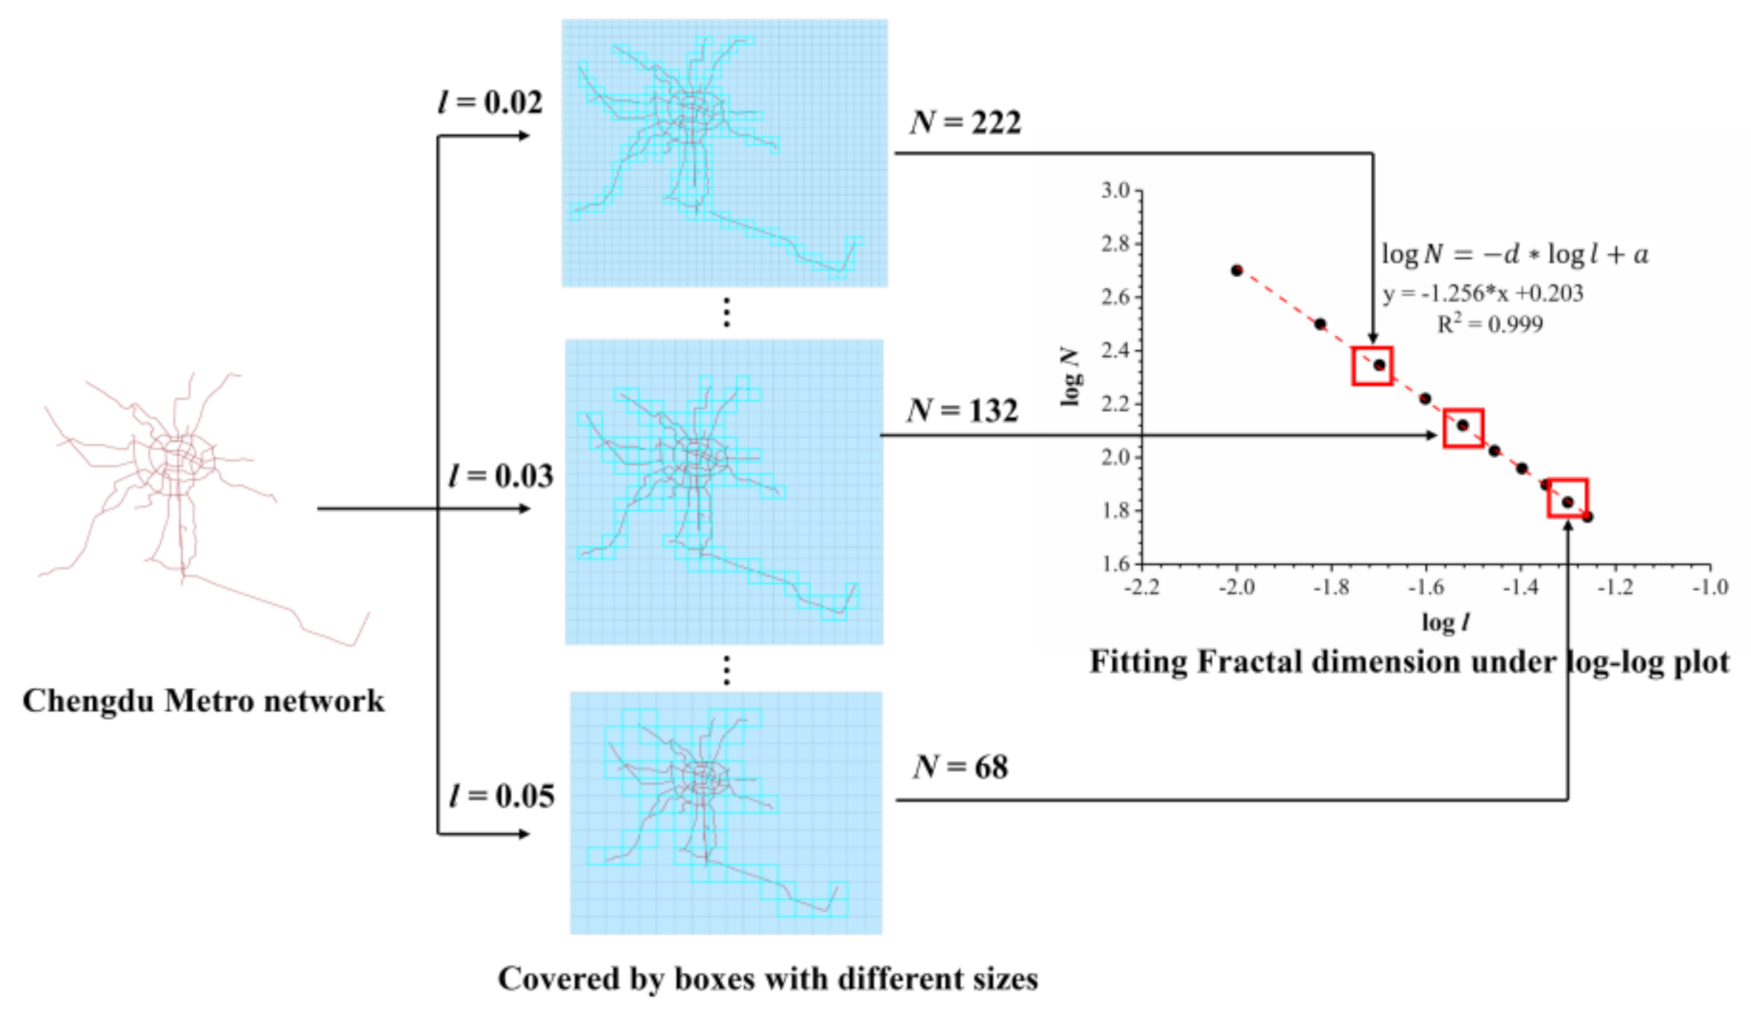
- The calculation of the fractal dimension
3. Analyzing Allometric Scaling Relations between Fractal Dimension of Metro Networks and Urban Indicators
3.1. The Model and Types of Allometric Scaling
- β > 1: positive allometric relation;
- β = 1: isometric relation;
- 0 < β < 1: negative allometric relation;
- β = 0: independence;
- β < 0: inverse allometric relation.
3.2. Experimental Results: Box-Counting Fractal Dimensions vs. Urban Quantities
- Analysis of allometric relations between fractal dimensions of metro networks and urban size
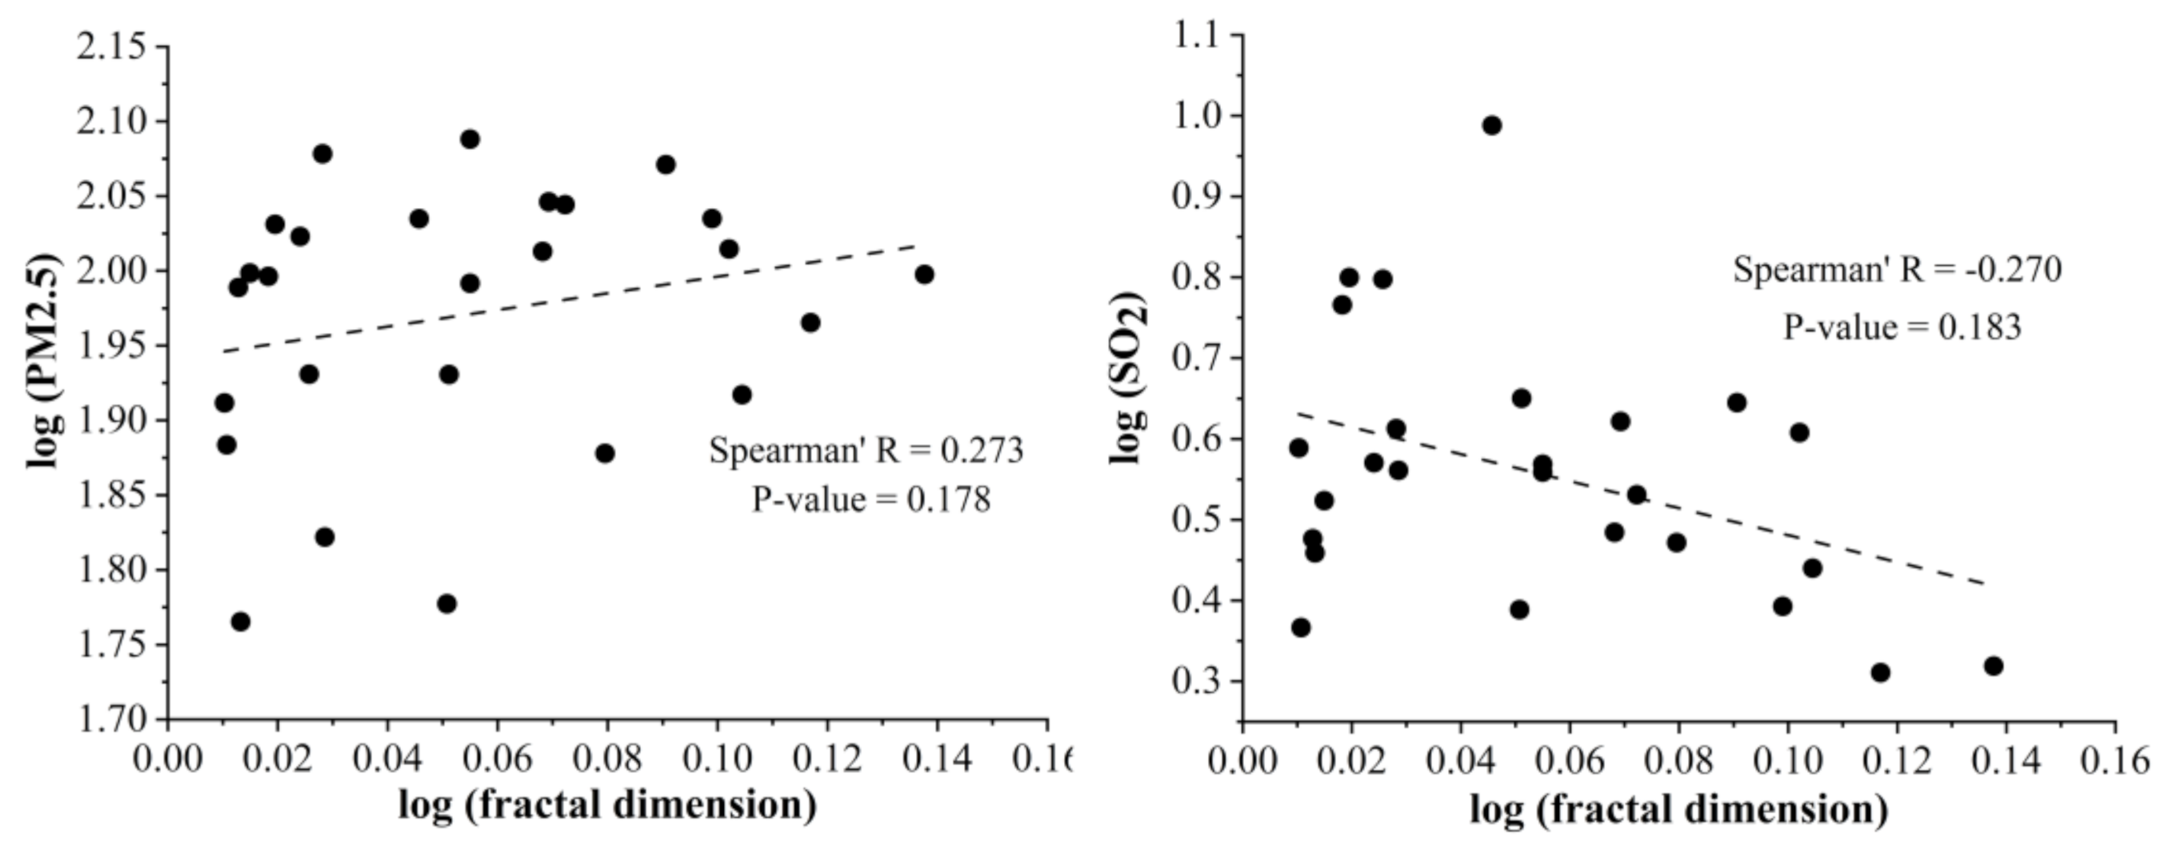
- Analysis of allometric relations between fractal dimension of metro networks and air pollution indexes
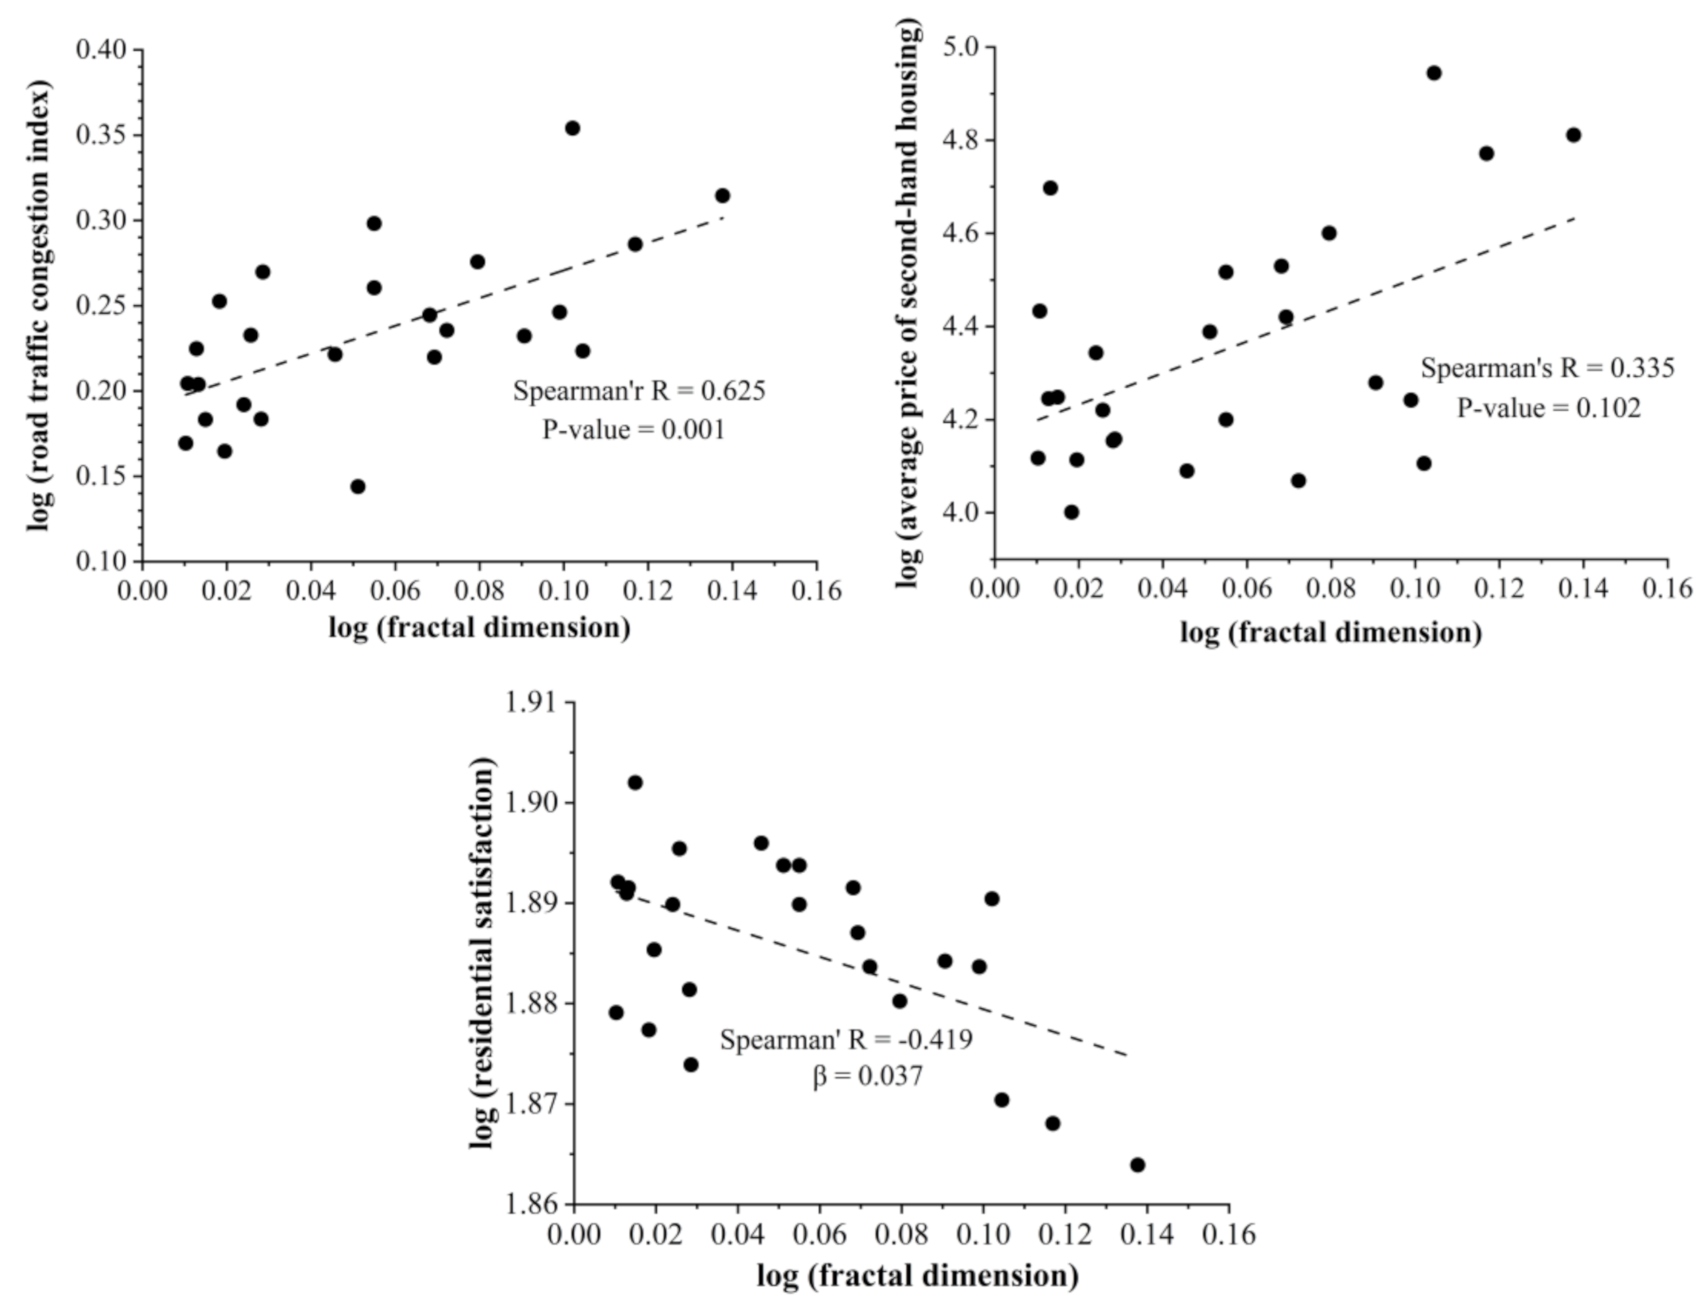
- Analysis of allometric relations between fractal dimensions of metro networks and socio-economic indicators
4. Discussion and Conclusions
4.1. Discussion
4.2. Conclusions
Author Contributions
Funding
Institutional Review Board Statement
Informed Consent Statement
Data Availability Statement
Acknowledgments
Conflicts of Interest
References
- Huxley, J. Problems of Relative Growth; Dial Press: New York, NY, USA, 1932. [Google Scholar]
- Thompson, D.W. On Growth and Form; Cambridge University Press: Cambridge, UK, 1942. [Google Scholar]
- Nordbeck, S. The Law of Allometric Growth. In Michigan Inter-University Community of Mathematical Geographers; Discussion Paper No. 7; University Microfilms: Ann Arbor, MI, USA, 1965. [Google Scholar]
- Naroll, R.S.; Von Bertalanffy, L. The principle of allometry in biology and the social sciences. Gen. Syst. Yearb. 1956, 1 Pt II, 76–89. [Google Scholar]
- Newling, B.E. Urban growth and spatial structure: Mathematical models and empirical evidence. Geogr. Rev. 1966, 213–225. [Google Scholar] [CrossRef]
- Nordbeck, S. Urban allometric growth. Geogr. Ann. Series B Hum. Geogr. 1971, 53, 54–67. [Google Scholar] [CrossRef]
- Bon, R. Allometry in the topologic structure of architectural spatial systems. Ekistics 1973, 36, 270–276. [Google Scholar]
- Woldenberg, M.J. An allometric analysis of urban land use in the United States. Ekistics 1973, 36, 282–290. [Google Scholar]
- Chen, Y.G. The rise, fall, and revival process of allometric scaling analysis in urban studies. Geogr. Res. 2013, 32, 1033–1045. [Google Scholar]
- Mandelbrot, B.B. How long is the coast of Britain? Statistical self-similarity and fractional dimension. Science 1967, 156, 636–638. [Google Scholar] [CrossRef] [PubMed] [Green Version]
- Mandelbrot, B.B. The Fractal Geometry of Nature; Freeman: New York, NY, USA, 1982. [Google Scholar]
- Bettencourt, L.M.; Lobo, J.; Helbing, D.; Kühnert, C.; West, G.B. Growth, innovation, scaling, and the pace of life in cities. Proc. Natl. Acad. Sci. USA 2007, 104, 7301–7306. [Google Scholar] [CrossRef] [PubMed] [Green Version]
- Batty, M.; Carvalho, R.; Hudson-Smith, A.; Milton, R.; Smith, D.; Steadman, P. Scaling and allometry in the building geometries of Greater London. Eur. Phys. J. B Condens. Matter Complex Syst. 2008, 63, 303–314. [Google Scholar] [CrossRef]
- Samaniego, H.; Moses, M.E. Cities as organisms: Allometric scaling of urban road networks. J. Transp. Land Use 2008, 1, 21–39. [Google Scholar] [CrossRef] [Green Version]
- Alves, L.G.; Ribeiro, H.V.; Lenzi, E.K.; Mendes, R.S. Empirical analysis on the connection between power-law distributions and allometries for urban indicators. Phys. A Stat. Mech. Its Appl. 2014, 409, 175–182. [Google Scholar] [CrossRef] [Green Version]
- Chen, Y.G. An allometric scaling relation based on logistic growth of cities. Chaos Solitons Fractals 2014, 65, 65–77. [Google Scholar] [CrossRef] [Green Version]
- Bettencourt, L.M.; Lobo, J. Urban scaling in Europe. J. R. Soc. Interface 2016, 13, 20160005. [Google Scholar] [CrossRef]
- Facchini, A.; Kennedy, C.; Stewart, I.; Mele, R. The energy metabolism of megacities. Appl. Energy 2017, 186, 86–95. [Google Scholar] [CrossRef]
- Sarkar, S.; Phibbs, P.; Simpson, R.; Wasnik, S. The scaling of income distribution in Australia: Possible relationships between urban allometry, city size, and economic inequality. Environ. Plan. B Urban Anal. City Sci. 2018, 45, 603–622. [Google Scholar] [CrossRef] [Green Version]
- Gudipudi, R.; Rybski, D.; Lüdeke, M.K.; Kropp, J.P. Urban emission scaling—Research insights and a way forward. Environ. Plan. B Urban Anal. City Sci. 2019, 46, 1678–1683. [Google Scholar] [CrossRef] [Green Version]
- Gudipudi, R.; Rybski, D.; Lüdeke, M.K.; Zhou, B.; Liu, Z.; Kropp, J.P. The efficient, the intensive, and the productive: Insights from urban Kaya scaling. Appl. Energy 2019, 236, 155–162. [Google Scholar] [CrossRef] [Green Version]
- Lan, T.; Li, Z.L.; Zhang, H. Urban Allometric Scaling Beneath Structural Fractality of Road Networks. Ann. Am. Assoc. Geogr. 2019, 109, 943–957. [Google Scholar] [CrossRef]
- Sarkar, S. Urban scaling and the geographic concentration of inequalities by city size. Environ. Plan. B Urban Anal. City Sci. 2019, 46, 1627–1644. [Google Scholar] [CrossRef]
- Akuraju, V.; Pradhan, P.; Haase, D.; Kropp, J.P.; Rybski, D. Relating SDG11 indicators and urban scaling—An exploratory study. Sustain. Cities Soc. 2020, 52, 101853. [Google Scholar] [CrossRef]
- Chen, Y.G.; Jiang, S. An analytical process of the spatio-temporal evolution of urban systems based on allometric and fractal ideas. Chaos Solitons Fractals 2009, 39, 49–64. [Google Scholar] [CrossRef]
- Alves, L.G.; Ribeiro, H.V.; Lenzi, E.K.; Mendes, R.S. Distance to the scaling law: A useful approach for unveiling relationships between crime and urban metrics. PLoS ONE 2013, 8, e69580. [Google Scholar]
- Alves, L.G.; Mendes, R.S.; Lenzi, E.K.; Ribeiro, H.V. Scale-adjusted metrics for predicting the evolution of urban indicators and quantifying the performance of cities. PLoS ONE 2015, 10, e0134862. [Google Scholar] [CrossRef] [PubMed]
- Chen, Y.G. Multi-scaling allometric analysis for urban and regional development. Phys. A Stat. Mech. Its Appl. 2017, 465, 673–689. [Google Scholar] [CrossRef] [Green Version]
- Chen, Y.G.; Feng, J. A Hierarchical Allometric Scaling Analysis of Chinese Cities: 1991–2014. Discret. Dyn. Nat. Soc. 2017, 2017, 5243287. [Google Scholar] [CrossRef]
- Li, R.; Dong, L.; Zhang, J.; Wang, X.; Wang, W.-X.; Di, Z.; Stanley, H.E. Simple spatial scaling rules behind complex cities. Nat. Commun. 2017, 8, 1841. [Google Scholar] [CrossRef] [PubMed] [Green Version]
- Paulus, F.; Pumain, D.; Vacchiani-Marcuzzo, C.; Lobo, J. An evolutionary theory for interpreting urban scaling laws. Cybergeo Rev. Eur. Géogr. Eur. J. Geogr. 2006, 343, 1–20. [Google Scholar]
- Bettencourt, L.M. The origins of scaling in cities. Science 2013, 340, 1438–1441. [Google Scholar] [CrossRef] [PubMed] [Green Version]
- Gomez-Lievano, A.; Patterson-Lomba, O.; Hausmann, R. Explaining the prevalence, scaling and variance of urban phenomena. Nat. Hum. Behav. 2016, 1, 1–57. [Google Scholar] [CrossRef] [Green Version]
- Khiali-Miab, A.; van Strien, M.J.; Axhausen, K.W.; Grêt-Regamey, A. Combining urban scaling and polycentricity to explain socio-economic status of urban regions. PLoS ONE 2019, 14, e0218022. [Google Scholar] [CrossRef] [PubMed] [Green Version]
- Long, Y.; Chen, Y.G. Multifractal scaling analyses of urban street network structure: The cases of twelve megacities in China. PLoS ONE 2021, 16, e0246925. [Google Scholar] [CrossRef]
- Ma, D.; Guo, R.; Jing, Y.; Zheng, Y.; Zhao, Z.; Yang, J. Intra-Urban Scaling Properties Examined by Automatically Extracted City Hotspots from Street Data and Nighttime Light Imagery. Remote Sens. 2021, 13, 1322. [Google Scholar] [CrossRef]
- Baidu Library. Population and GDP Data of Cities across the Country. Available online: https://wenku.baidu.com/view/0370a5ad1cd9ad51f01dc281e53a580217fc5040.html (accessed on 8 June 2021).
- The World Air Quality Project. Air Quality Historical Data Platform. Available online: https://aqicn.org/data-platform/register/ (accessed on 9 May 2021).
- China Index Academy. Survey Report on Residential Satisfaction of Chinese Urban Residents. Available online: https://industry.fang.com/ (accessed on 9 May 2021).
- Baidu Company. Baidu China Urban Transportation Report. Available online: https://jiaotong.baidu.com/cms/reports/traffic/2020annualtrafficreport/index.html (accessed on 9 May 2021).
- China Pay Data. National House Price Ranking. Available online: http://finance.eastmoney.com/a/202101021759304827.html (accessed on 12 June 2021).
- Oxford Dictionary. The Definition of Fractal. Available online: https://www.oxfordlearnersdictionaries.com/definition/english/fractal?q=fractal (accessed on 9 May 2021).
- Jiang, B.; Yin, J. Ht-index for quantifying the fractal or scaling structure of geographic features. Ann. Assoc. Am. Geogr. 2014, 104, 530–540. [Google Scholar] [CrossRef]
- Gao, P.C.; Liu, Z.; Tian, K.; Liu, G. Characterizing Traffic Conditions from the Perspective of Spatial-Temporal Heterogeneity. ISPRS Int. J. Geo Inf. 2016, 5, 34. [Google Scholar] [CrossRef] [Green Version]
- Gao, P.C.; Liu, Z.; Xie, M.; Tian, K.; Liu, G. CRG index: A more sensitive ht-index for enabling dynamic views of geographic features. Prof. Geogr. 2016, 68, 533–545. [Google Scholar] [CrossRef]
- Gao, P.C.; Liu, Z.; Liu, G.; Zhao, H.; Xie, X. Unified metrics for characterizing the fractal nature of geographic features. Ann. Am. Assoc. Geogr. 2017, 107, 1315–1331. [Google Scholar] [CrossRef]
- Klinkenberg, B. A review of methods used to determine the fractal dimension of linear features. Math. Geol. 1994, 26, 23–46. [Google Scholar] [CrossRef]
- Batty, M.; Longley, P.A. The fractal simulation of urban structure. Environ. Plan. A 1986, 18, 1143–1179. [Google Scholar] [CrossRef]
- Shelberg, M.C.; Lam, N.; Moellering, H. Measuring the Fractal Dimensions of Surfaces; Defense Mapping Agency Aerospace Center: St Louis, MO, USA, 1983. [Google Scholar]
- Power, W.L.; Tullis, T.E. Euclidean and fractal models for the description of rock surface roughness. J. Geophys. Res. Solid Earth 1991, 96, 415–424. [Google Scholar] [CrossRef]
- Burrough, P. Fractal dimensions of landscapes and other environmental data. Nature 1981, 294, 240–242. [Google Scholar] [CrossRef]
- Mandelbrot, B.B. Stochastic models for the Earth’s relief, the shape and the fractal dimension of the coastlines, and the number-area rule for islands. Proc. Natl. Acad. Sci. USA 1975, 72, 3825–3828. [Google Scholar] [CrossRef] [Green Version]
- Matsushita, M.; Ouchi, S. On the self-affinity of various curves. Phys. D Nonlinear Phenom. 1989, 38, 246–251. [Google Scholar] [CrossRef]
- Benguigui, L. A fractal analysis of the public transportation system of Paris. Environ. Plan. A 1995, 27, 1147–1161. [Google Scholar] [CrossRef]
- Lu, Y.; Tang, J. Fractal dimension of a transportation network and its relationship with urban growth: A study of the Dallas-Fort Worth area. Environ. Plan. B Plan. Des. 2004, 31, 895–911. [Google Scholar] [CrossRef] [Green Version]
- Zhang, H.; Gao, P.; Lan, T.; Liu, C. Exploring the Structural Fractality of Urban Road Networks by Different Representations. Prof. Geogr. 2021, 1–15. [Google Scholar] [CrossRef]
- Chmielewski, F.-M.; Rötzer, T. Response of tree phenology to climate change across Europe. Agric. For. Meteorol. 2001, 108, 101–112. [Google Scholar] [CrossRef]
- Renmin University of China. Research on the Plan and Policy of Total Coal Con sumption Control in Chinese Cities. Available online: https://www.china5e.com/ (accessed on 9 May 2021).


| City | GDP (Billion Yuan) | Population (Million) | PM2.5 (µg/m3) | PM10 (µg/m3) | SO2 (µg/m3) | NO2 (µg/m3) | CO (µg/m3) | O3 (µg/m3) | Road Traffic Congestion Index | Average Price of Second-Hand Housing (Yuan) | Average Residential Satisfaction Score | Average Public Information Service Score |
|---|---|---|---|---|---|---|---|---|---|---|---|---|
| Beijing | 3610.26 | 21.54 | 99.46 | 48.63 | 2.08 | 14.50 | 5.58 | 44.71 | 2.06 | 64,721 | 73.1 | 66.18 |
| Shanghai | 3870.06 | 24.28 | 92.33 | 39.01 | 2.04 | 16.30 | 5.98 | 41.10 | 1.93 | 59,072 | 73.8 | 69.27 |
| Guangzhou | 2501.91 | 15.31 | 75.48 | 35.89 | 2.96 | 16.29 | 6.20 | 39.20 | 1.89 | 39,851 | 75.9 | 63.70 |
| Shenzhen | 2767.02 | 13.44 | 82.63 | 41.85 | 2.75 | 17.16 | 5.82 | 42.64 | 1.67 | 87,957 | 74.2 | 65.26 |
| Wuhan | 1561.61 | 11.21 | 117.78 | 54.40 | 4.41 | 22.06 | 9.38 | 43.60 | 1.71 | 19,016 | 76.6 | 62.62 |
| Tianjin | 1408.37 | 15.62 | 111.20 | 53.83 | 4.18 | 16.59 | 7.53 | 51.99 | 1.66 | 26,332 | 77.1 | 63.55 |
| Nanjing | 1481.80 | 8.50 | 98.09 | 52.01 | 3.70 | 19.55 | 7.74 | 45.57 | 1.82 | 32,855 | 77.6 | 67.58 |
| Hongkong | 2410.37 | 7.47 | 59.88 | 27.87 | 2.45 | 30.28 | 5.72 | 30.21 | null | null | null | null |
| Chongqing | 2500.28 | 31.24 | 103.42 | 49.89 | 4.05 | 21.40 | 6.63 | 33.53 | 2.26 | 12,763 | 77.7 | 63.29 |
| Hangzhou | 1610.58 | 10.36 | 103.03 | 54.63 | 3.05 | 23.16 | 6.95 | 44.12 | 1.76 | 33,862 | 77.9 | 71.48 |
| Shenyang | 657.16 | 8.32 | 108.35 | 54.20 | 9.73 | 17.89 | 7.44 | 35.84 | 1.67 | 12,298 | 78.7 | 63.89 |
| Dalian | 703.04 | 6.99 | 85.29 | 42.76 | 6.27 | 12.59 | 5.34 | 43.45 | 1.71 | 16,609 | 78.6 | 66.96 |
| Chengdu | 1771.67 | 16.58 | 108.39 | 50.10 | 2.47 | 16.64 | 5.87 | 40.69 | 1.76 | 17,449 | 76.5 | 63.94 |
| Changchun | 663.80 | 8.57 | 99.17 | 59.20 | 5.83 | 17.92 | 6.64 | 39.61 | 1.79 | 10,030 | 75.4 | 66.85 |
| Suzhou | 2017.05 | 10.75 | 105.42 | 49.18 | 3.72 | 19.50 | 6.91 | 52.37 | 1.56 | 22,052 | 77.6 | null |
| Kunming | 673.38 | 6.95 | 66.36 | 30.61 | 3.64 | 8.67 | 4.97 | 35.09 | 1.86 | 14,394 | 74.8 | 65.65 |
| Xi’an | 1002.04 | 10.20 | 122.47 | 71.77 | 3.62 | 22.62 | 6.42 | 39.34 | 1.99 | 15,849 | 78.3 | 59.88 |
| Zhengzhou | 1200.30 | 10.35 | 119.76 | 69.65 | 4.10 | 18.85 | 6.77 | 47.32 | 1.53 | 14,266 | 76.1 | 61.91 |
| Changsha | 1214.25 | 8.39 | 110.73 | 43.19 | 3.39 | 11.97 | 6.60 | 37.80 | 1.72 | 11,715 | 76.5 | 62.77 |
| Ningbo | 1240.87 | 8.54 | 85.23 | 40.64 | 4.47 | 18.45 | 5.97 | 43.66 | 1.39 | 24,465 | 78.3 | 70.78 |
| Wuxi | 1237.05 | 6.59 | 99.67 | 50.01 | 3.34 | 17.56 | 7.61 | 46.62 | 1.53 | 17,707 | 79.8 | null |
| Nanchang | 574.55 | 5.60 | 107.43 | 55.62 | 6.31 | 17.02 | 6.59 | 43.85 | 1.46 | 12,987 | 76.8 | 68.09 |
| Fuzhou | 1002.00 | 7.80 | 76.48 | 41.29 | 2.32 | 11.65 | 6.86 | 54.89 | 1.60 | 27,103 | 78 | 65.64 |
| Nanning | 472.63 | 7.34 | 81.60 | 39.96 | 3.88 | 10.98 | 6.29 | 33.49 | 1.48 | 13,102 | 75.7 | 64.62 |
| Hefei | 1004.57 | 8.19 | 97.46 | 50.12 | 2.99 | 18.76 | 5.83 | 40.77 | 1.68 | 17,574 | 77.8 | 66.07 |
| Xiamen | 638.40 | 4.29 | 58.26 | 29.12 | 2.88 | 7.45 | 3.90 | 46.46 | 1.60 | 49,803 | 77.9 | 71.30 |
| No. | City | Fractal Dimension | Adj. R-Square | No. | City | Fractal Dimension | Adj. R-Square |
|---|---|---|---|---|---|---|---|
| 1 | Beijing | 1.373 | 0.999 | 14 | Changchun | 1.043 | 0.999 |
| 2 | Shanghai | 1.309 | 0.998 | 15 | Suzhou | 1.057 | 0.999 |
| 3 | Guangzhou | 1.201 | 0.998 | 16 | Kunming | 1.068 | 0.999 |
| 4 | Shenzhen | 1.272 | 0.998 | 17 | Xi’an | 1.135 | 0.998 |
| 5 | Wuhan | 1.232 | 0.999 | 18 | Zhengzhou | 1.067 | 0.999 |
| 6 | Tianjin | 1.173 | 0.999 | 19 | Changsha | 1.181 | 0.999 |
| 7 | Nanjing | 1.135 | 0.999 | 20 | Ningbo | 1.125 | 0.999 |
| 8 | Hong Kong | 1.124 | 0.999 | 21 | Wuxi | 1.035 | 0.999 |
| 9 | Chongqing | 1.265 | 0.998 | 22 | Nanchang | 1.046 | 0.999 |
| 10 | Hangzhou | 1.170 | 0.998 | 23 | Fuzhou | 1.025 | 0.999 |
| 11 | Shenyang | 1.111 | 0.999 | 24 | Nanning | 1.024 | 0.999 |
| 12 | Dalian | 1.061 | 0.999 | 25 | Hefei | 1.030 | 0.999 |
| 13 | Chengdu | 1.256 | 0.999 | 26 | Xiamen | 1.031 | 0.999 |
| Independent Variable | Dependent Variable | Spearman’s R | p-Value |
|---|---|---|---|
| Fractal dimensions of metro networks | GDP | 0.789 | 0 |
| Population | 0.806 | 0 | |
| PM2.5 concentration | 0.273 | 0.178 | |
| PM10 concentration | 0.004 | 0.985 | |
| NO2 concentration | 0.185 | 0.367 | |
| SO2 concentration | −0.270 | 0.183 | |
| CO concentration | −0.032 | 0.877 | |
| O3 concentration | −0.172 | 0.401 | |
| Road traffic congestion index | 0.625 | 0.001 | |
| Average price of second-hand housing | 0.335 | 0.102 | |
| Aeverage residential satisfaction score | −0.419 | 0.037 | |
| Aeverage public information service score | −0.215 | 0.325 |
| City | Population | Fractal Dimension | PM2.5 (µg/m3) | SO2 (µg/m3) | Road Congestion |
| Wuxi | Around 7 million | 1.035 | 99.67 | 3.34 | 1.525 |
| Kunming | 1.068 | 66.4 | 3.64 | 1.861 | |
| Dalian | 1.061 | 85.3 | 6.27 | 1.709 | |
| Nanning | 1.024 | 81.6 | 3.88 | 1.477 | |
| Hong Kong | 1.124 | 59.9 | 2.45 | null |
Publisher’s Note: MDPI stays neutral with regard to jurisdictional claims in published maps and institutional affiliations. |
© 2021 by the authors. Licensee MDPI, Basel, Switzerland. This article is an open access article distributed under the terms and conditions of the Creative Commons Attribution (CC BY) license (https://creativecommons.org/licenses/by/4.0/).
Share and Cite
Lan, T.; Peng, Q.; Wang, H.; Gong, X.; Li, J.; Shi, Z. Exploring Allometric Scaling Relations between Fractal Dimensions of Metro Networks and Economic, Environmental and Social Indicators: A Case Study of 26 Cities in China. ISPRS Int. J. Geo-Inf. 2021, 10, 429. https://doi.org/10.3390/ijgi10070429
Lan T, Peng Q, Wang H, Gong X, Li J, Shi Z. Exploring Allometric Scaling Relations between Fractal Dimensions of Metro Networks and Economic, Environmental and Social Indicators: A Case Study of 26 Cities in China. ISPRS International Journal of Geo-Information. 2021; 10(7):429. https://doi.org/10.3390/ijgi10070429
Chicago/Turabian StyleLan, Tian, Qian Peng, Haoyu Wang, Xinyu Gong, Jing Li, and Zhicheng Shi. 2021. "Exploring Allometric Scaling Relations between Fractal Dimensions of Metro Networks and Economic, Environmental and Social Indicators: A Case Study of 26 Cities in China" ISPRS International Journal of Geo-Information 10, no. 7: 429. https://doi.org/10.3390/ijgi10070429
APA StyleLan, T., Peng, Q., Wang, H., Gong, X., Li, J., & Shi, Z. (2021). Exploring Allometric Scaling Relations between Fractal Dimensions of Metro Networks and Economic, Environmental and Social Indicators: A Case Study of 26 Cities in China. ISPRS International Journal of Geo-Information, 10(7), 429. https://doi.org/10.3390/ijgi10070429


