Article

Land-Use Conflict Identification from the Perspective of Construction Space Expansion: An Evaluation Method Based on ‘Likelihood-Exposure-Consequence’

1
School of Resources and Environmental Engineering, Wuhan University of Science and Technology, Wuhan 430081, China
2
State Environmental Protection Key Laboratory of Mineral Metallurgical Resources Utilization and Pollution Control, Wuhan University of Science and Technology, Wuhan 430081, China
3
Key Laboratory of Hubei Province for Efficient Utilization of Metallurgical Mineral Resources and Block Building, Wuhan 430081, China
*
Author to whom correspondence should be addressed.
ISPRS Int. J. Geo-Inf. 2021, 10(7), 433; https://doi.org/10.3390/ijgi10070433
Submission received: 10 April 2021 / Revised: 10 June 2021 / Accepted: 11 June 2021 / Published: 24 June 2021

Abstract

:
Land-use conflict (LUC) is a major problem of land management in the context of rapid urbanization. Conflict identification plays an important role in the development and protection of land space. Considering the possibility of, exposure to, and negative impacts of LUC, we explore the probability of land-use cover change (LUCC), policy constraints, and ecosystem service value (ESV) and build a conflict identification model based on the LEC concept of risk assessment. Taking Daye City as an example, we classify the conflict intensity and delimit the key conflict areas. At the same time, a composite classification system is constructed to analyze the spatial characteristics and internal mechanism of conflict. We find that the conflict between construction and ecological space is the main conflict in Daye City (P.R. China), which is widely distributed. However, the conflict between construction and agricultural space, which is mainly distributed near the center of Daye City, cannot be ignored.

1. Introduction

Since the reform and opening up of China, the process of industrialization and urbanization has advanced rapidly, and China’s land-use structure and landscape ecological patterns have undergone dramatic changes. In the context of the increasing emphasis on ecological protection, land use is facing tremendous pressure and challenges [1]. As an important pillar of China’s economic and social development, mining cities not only provide raw material support for industrial production but are also front-line representatives of China’s urbanization and industrialization and promote the rapid development of the regional economy [2,3]. However, due to rapid development and the interference of mining activities, mining cities are facing, or about to face, more intense regional competition and land-use contradictions, such as chaotic land-use structures [4], serious ecological environmental damage [5], the disorderly expansion of cities [6], etc. These contradictions and competitions pose a serious threat to the protection and sustainable development of the urban ecological environment [7].
The concept of “conflict” originated in sociology and refers to the behavioral or psychological contradictions between two social subjects due to inconsistent goals or interests [8]. With the continuous increase in the human development of nature, land use, and ownership, development intensity will change significantly, and the contradiction between human activities and natural resources will continue to deepen [9]. Land is “the most basic resource”, and LUC can never be avoided [10]. Previous authors proposed the concept of “LUC” [11], which has attracted widespread attention from the academic community. Some scholars summarized LUC as the contradiction and opposition between land-use subjects and stakeholders in the land-use process, allocation method, allocation number, and allocation structure [12,13], as well as the contradiction between the evolution of various land-use systems and the environmental level [14,15]. Due to the frequent outbreaks of LUC, conflict research has become a research hotspot in related fields. The causes of conflict [16,17], the evolution of conflict [18], the classification of conflicts [19], conflict identification [20], and conflict management [21,22] have been systematically studied.
Academic circles presently have a wide range of research perspectives on LUC involving the conflicts between microscopic subjects, macroscopic subjects, and both microscopic and macroscopic land use. Multi-criteria analysis is often used to identify potential LUC and has produced two basic paradigms: a conceptual model and a spatial model [23]. Participatory GIS is widely used in LUC process analysis and mitigation-strategy formulation and has become an effective means to explore the evolutionary processes and mechanisms of LUC [24]. The evolution of conflict is affected by the systemic [25], social, and economic environments [26,27] and presents a certain life cycle. The issue of spatial injustice caused by conflicts has gradually received attention. The existence of social justice makes it necessary to coordinate the relationship between economic development and environmental protection to alleviate LUC [28]. As the conflict between economic development and the natural environment continues to intensify, LUC urgently needs to be more effectively managed [29,30].
The identification of LUC is the basis and prerequisite for regional conflict management and control. LUC is of great significance in guiding the optimization and adjustment of land-use structures and has attracted the attention of relevant scholars [31,32]. The landscape criterion [33], function criterion [34], and value criterion [35] are the main factors of multi-criteria analysis. These guidelines aim to identify conflicts between the objective function and value of land use, but they ignore the subjective demand for land resources and the supply capacity of land resources for social and economic development. The supply capacity of land resources determines the speed of the development of a region, and different developmental stages correspond to different land-resource demands. If only the objective land function value is considered in the land-use process, and supply capacity and developmental demand are ignored, more serious LUC may occur. Therefore, a more reasonable land-use evaluation standard needs to be established [36]. As our understanding of land resources continues to deepen, land suitability evaluation is gradually being applied to LUCC research and to analyze the impact of land use on nature, economy, and society [37]. Carr and Zwick [38] proposed using LUCIS model to characterize conflicts in terms of suitability differences between different land-use types. This model makes up for the shortcomings of the multi-criteria analysis method to a certain extent but still has shortcomings. This model mainly uses qualitative analysis but lacks quantitative explanation.
In recent years, scientific researchers have conducted considerable research on land-use suitability evaluations, and related evaluation methods and LUCIS models have been developed and improved. However, a unified and recognized evaluation method and indicator system has not yet been created [39]. Therefore, the evaluation process will be greatly affected by the subjective consciousness of the researcher, which will interfere with the evaluation results. In addition, the evaluation process mostly uses qualitative analysis, which is not conducive to the quantification of conflict identification results. Generally, land-use suitability is evaluated from three perspectives: construction suitability, agricultural suitability, and ecological suitability. When the same piece of land has two or more areas of high suitability at the same time, LUC may occur [1]. This model focuses more on the static identification of LUC and less on the consideration of the possible consequences of land-use dynamic changes. Therefore, one of the problems that the present study intends to solve is how to improve the objectivity and quantification of LUC identification while taking into account the dynamic characteristics of conflicts.
As environmental problems become more severe, relevant governmental or national protection policies will have a direct impact on changes in land-use patterns [40], thereby indirectly affecting the difficulty of exposure to LUC. Therefore, the impact of policy factors on LUC cannot be ignored. How to integrate policy factors into the LUC identification model is another problem that this article seeks to solve.
The ‘Likelihood–Exposure–Consequence’ (LEC) method is a semi-quantitative evaluation method proposed by American security experts Graham and Kinney [41]. In order to establish an analysis and control system of hazard sources, they focus on safe working environment and safe operation process, and put three factors into the risk analysis: the likelihood that some hazardous event will occur, the exposure to that particular hazardous situation and the possible consequences should the hazardous event actually occur. This method has been widely used in the field of production safety since it was introduced into China by some scholars [42]. According to the characteristics of various industries and Graham and Kinney’s points of view, the scholars determine the parameter value and evaluate the risk. They named this method “work condition risk evaluation method” or “LEC risk evaluation method”. This method evaluates the risk degree (D) of the production site from three perspectives: the likelihood of accidents (L), how often people are exposed to dangerous environments (E), and the possible consequences of accidents (C). The LEC evaluation method is a common method for investigating hidden dangers in the field of production safety. An outbreak of LUC will have an impact on the ecosystem and threaten the safety of the ecological environment. Potential LUC can be regarded as a potential safety hazard for the sustainable development of the regional ecological environment. Therefore, this article draws on the LEC concept to identify potential LUC, thereby improving the ease of quantifying LUC. Machine learning (ML) [43] is a typical big-data processing method and involves many self-improvement and optimization algorithms based on data or past experience. The training processes and results of ML are less subject to human subjective interference. At the same time, ML has natural advantages in dealing with more complex nonlinear problems. The land-use transition probability determined by ML is used to determine the possibility of LUC, thereby improving the objectivity of conflict identification. Adopting policy [44] constraints on LUCC to characterize the exposure of LUC is an organic combination of policy factors and conflict identification. The introduction of the revised land ecosystem service value [45] as a possible consequence of LUC reflects the dynamic characteristics of conflicts and also enriches the perspective of conflict identification.

2. Data Sources and Identification Model

2.1. Overview of the Study Area and Data Sources

Daye City is located in the southeast region of Hubei Province (114°31′–115°20′ E and 29°40′–30°15′ N), on the South Bank of the middle and lower reaches of the Yangtze River in the hinterland of the “metallurgical corridor” of Hubei Province. The area has a typical continental monsoon climate. Daye City is a typical mining city and a major grain producing county. In this city 65 kinds of minerals and 42 kinds of proven reserves have been discovered. Daye City features six major Chinese copper production bases, 10 major iron-ore production bases, and key building material production areas. The city has been identified as part of the second group of national agricultural green development pilot areas, with a total production functional area of 153.33 km2 for grain and an important agricultural product production protection area of 100.00 km2. At present, there are more than 100 green, organic, and geographically certified agricultural products.
The Digital Elevation Model (DEM) and the two-phase TM remote sensing image data used in this study were obtained from the Chinese Academy of Sciences Geospatial Data Cloud, with a spatial resolution of 30 m. The images were acquired on November 2005 and October 2015, and atmospheric correction and geometric correction were performed on the images using the ENVI (The Environment for Visualizing Images) software (Exelis Visual Information Solutions, White beach, NY, USA). Then, based on supervised classification, the corrected remote sensing image was processed to obtain a status map of land-use types in Daye City. Using the 3D analysis module of the ArcGIS platform (Environmental Systems Research Institute, Redlands, CA, USA.) the DEM data were processed to extract the slope, aspect, and elevation information of the study area. The social and economic statistics were obtained from the Statistical Yearbook of Daye City. The research was divided into 120 ×120 m cells as the smallest evaluation unit, and all data were uniformly corrected and registered in the ArcGIS software environment.

2.2. LEC-Based LUC Identification Model

Here, we draw lessons from the LEC concept and construct a potential LUC identification model as follows:
D = L × E × C
where D represents the intensity degree of LUC; L is the probability of land-use transition, which is used to characterize the possibility of LUC; E is the degree of restriction on LUCC, which is used to represent the degree of the exposure of LUC; and C is the loss of ecosystem service value, which is used to characterize the possible consequences of LUC.
The analysis framework of the LUC identification model based on the LEC concept is shown in Figure 1.

2.3. Model Parameter Determination

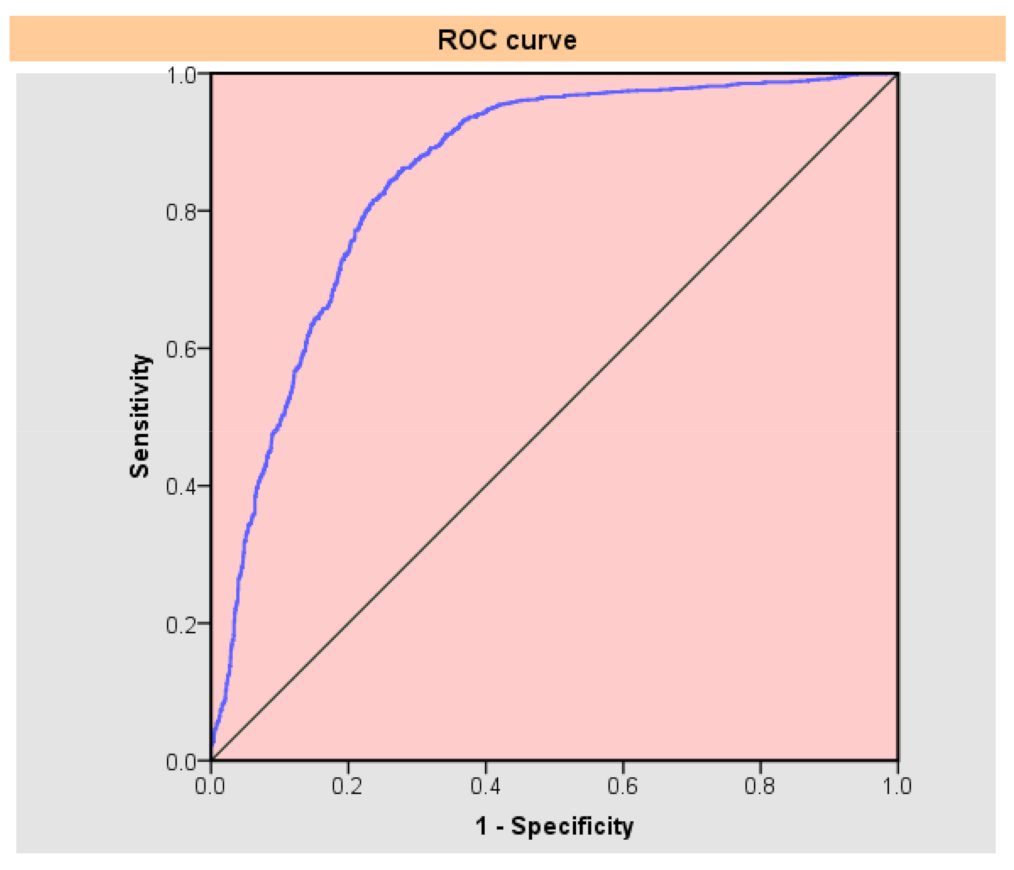
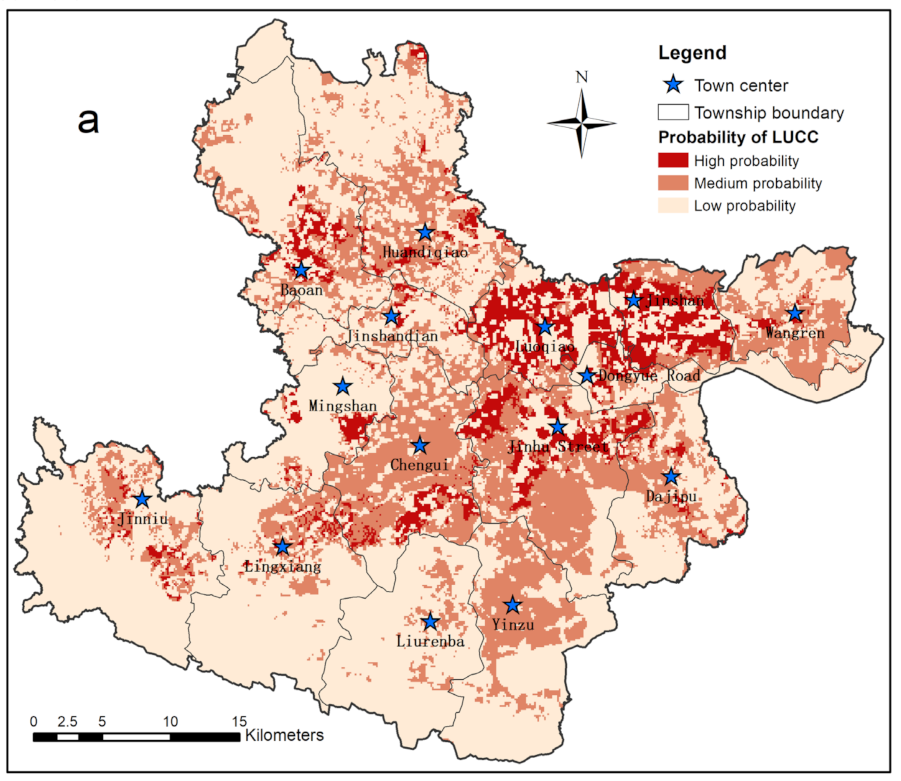
2.3.1. Probability of LUCC (Likelihood)

The artificial neural network (ANN) is a mathematical algorithm based on a biological neural system and has developed rapidly in the field of machine learning in recent years. According to the differences in the network structure, ANNs can be divided into forward networks and feedback network. The BP (Back propagation) neural network is a typical type of forward network that has strong nonlinear mapping, self-learning, and adaptive abilities. In addition, a BP neural network can effectively apply sample training results to a new model. Moreover, damage to some neurons will not seriously affect the overall situation of the network. The BP neural network has strong generalization and fault-tolerance abilities. LUCC is affected by many factors, and its internal mechanisms are complex. To ensure the objectivity of LUCC predictions and reduce the subjective influence of humans, this study uses the BP neural network algorithm alongside python programming to establish a single hidden layer network model to predict the probability of LUCC. The input neuron of the network is determined by the influencing factors of LUCC, while the output neurons represent the state of LUCC, with a value of 1 indicating change and 0 indicating non-change.
LUC in China is the product of rapid urbanization, for which the expansion of construction land is the most obvious feature. Relevant studies have shown that the LUCC in Hubei Province mainly manifests as the occupation of agricultural space by construction space and ecological space by agricultural space [46]. As a typical mining city in Hubei Province, Daye City has an even more severe impact on agricultural space and ecological space. In the process of LUCC, construction land expansion holds a dominant position, so LUCC identification mainly examines the occupation of agricultural land and ecological land by construction land expansion.
The expansion of construction land is the result of the coupling of socioeconomic and natural environmental factors. Socioeconomic factors are the driving force behind the expansion of construction land, and natural environmental factors control the direction and trends of construction land expansion. Li et al. constructed an index system based on the aspects of geography, economy, population, and policy and explored the characteristics of construction land expansion [47,48]. Cui et al. found that natural factors and socioeconomic development are the main driving factors affecting the expansion of construction land [48]. Cai et al. argued that the expansion of construction land is a continuous and complex dynamic process that is affected by terrain, location, and social economy [49]. Considering the principles of scientificity, completeness, and the availability of indicators, we establish an indicator system from both socioeconomic and natural environmental perspectives to predict the expansion of construction land in Daye City. The indicators and their treatment methods are shown in Table 1.
According to the relevant research results [50] and the actual situation of the study area, the slope, aspect, elevation, and land-use-type indicators are divided into six different grades and then assigned different values according to the differences of their impacts on LUCC. For diffusive influencing factors such as water resource security, geological disaster impacts, and industrial and mining impacts, different central values are assigned according to the characteristics of the impact source, and the value of each cell is calculated through the exponential or linear attenuation model within the maximum impact range; see Equation (2) [51] and Equation (3) [52], respectively:
f i = M × ( 1 r )
f i = M ( 1 r )
where fi is the i-th factor value of the target unit; M is the central value of the influence source; r = d ÷ D , d is the distance from the target unit to the influence source; and D is the maximum influence distance of the influence source.
The calculation of water resource security, the impact of geological disasters, and road accessibility use a linear attenuation model [51]. Here, the water resources include rivers and lakes with stable water sources, and the maximum impact distance is 3 km. The maximum impact distance of geological disasters, however, is 1 km, and road accessibility is calculated separately for township and county roads and provincial and national roads. The maximum impact distance is calculated according to the road accessibility calculation method in the “Urban Land Grading Regulations”, D = S/2L, where L is the total length of the road, and S is the road service area [53]. Calculations for the industrial and mining influence and the influence degrees of central cities and towns adopt the exponential decay model [52]. Based on the research of Liu et al. [54], mining sites were selected based industry and mining. Here, the maximum impact distance is 2.5 km. The impact of central towns is instead calculated based on towns and cities; the maximum impact distance of towns is 2.5 km, and the maximum impact distance of the city is 5 km. The population density is obtained by kernel density interpolation of points of interest (POIs) [55].

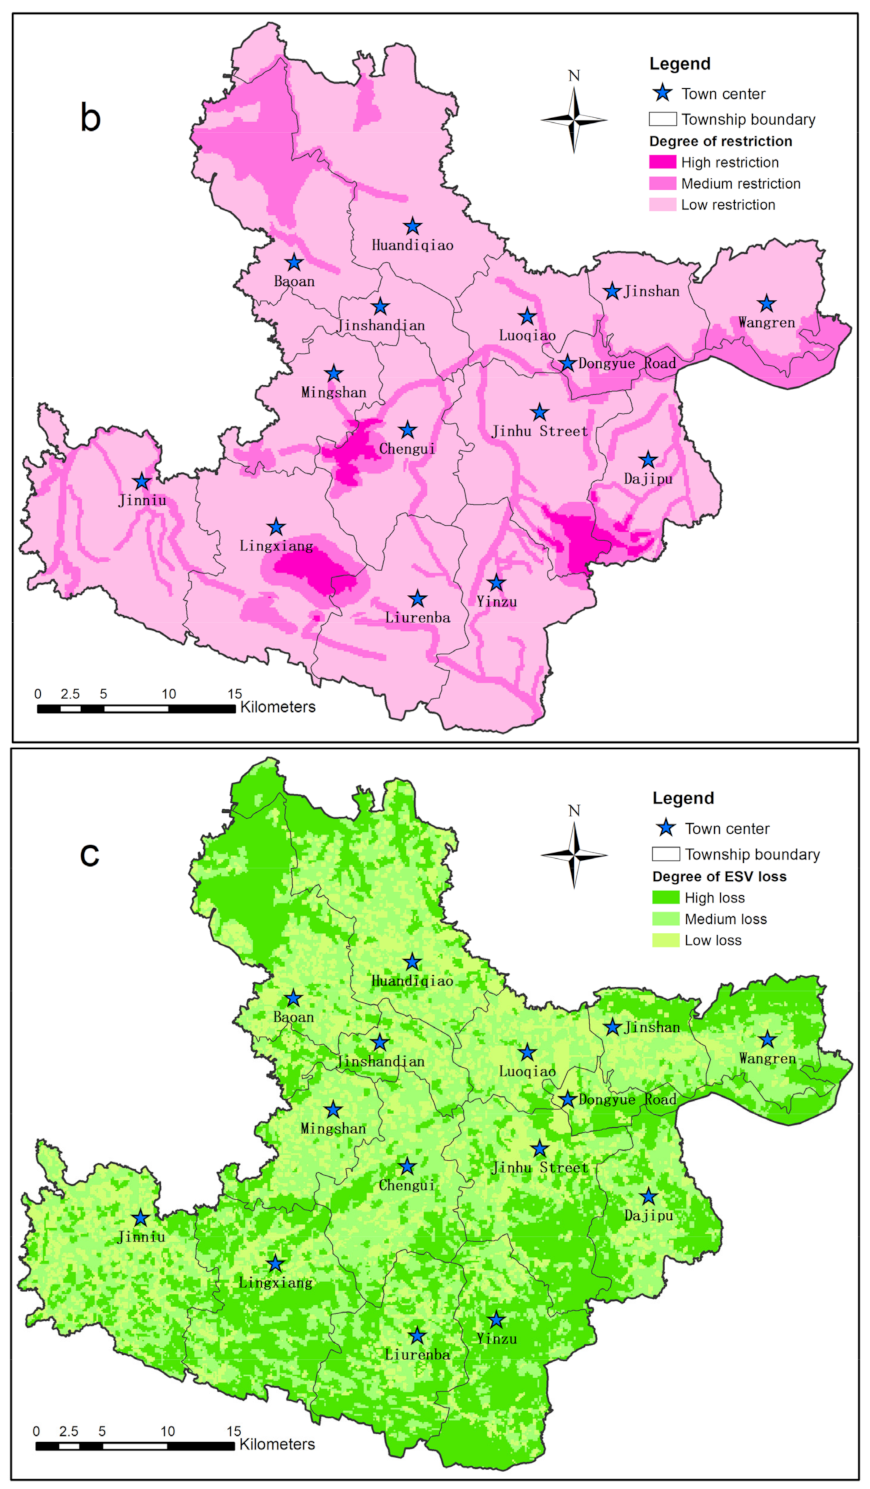
2.3.2. Restrictions on LUCC (Exposure)

In the context of rapid industrialization and urbanization, China features sprawling and disorderly construction space and compressed agricultural space, which have had a significant impact on the ecological environment. The land-use structure in the region has thus become unbalanced, scaled, and dysfunctional. Under the pressure of sustainable social and economic development and the continued deepening of market-oriented reforms, in the face of fierce conflicts among different goals of cultivated land protection, urban development, and ecological protection, determining how to balance and coordinate various land-use relationships has become one of the most important areas of administrative management. From the “red line of 1.8 billion acres of arable land” to the “red line of ecological protection”, the national policies and regulations for the protection of agricultural space and ecological space have been continuously improved and deepened, providing a policy basis for land-space planning and regional LUC control.
Cultivated land is an important part of the agricultural space. Basic farmland protection provides important policy for cultivated land protection. As Hubei Province is engaging in a new type of land improvement, the area’s basic farmland is currently allowed to be adjusted appropriately, so the present study does not consider the constraints of the basic farmland protection policies on changes to cultivated land. Referring to the “Thirteenth Five-Year Plan for Ecological Environment Protection” and “National River (Lake) Coastline Utilization and Management Planning Technical Rules” and other documents, we consider the strict implementation of relevant policies and combine the characteristics of the economic and social development of Daye City with relevant experts’ opinions. Starting from the government’s management and control of large rivers, lakes, and nature reserves, we analyze the degree of restriction on LUCC, as shown in Equation (4):
E = τ × δ × λ
where E is the degree of restriction on LUCC; τ, δ and λ respectively represent the degree of restriction of land use policies on cultivated land, nature reserves, rivers, and lakes, as shown in Table S1 (Supplementary Materials).

2.3.3. Loss of ESV (Consequence)

  • Basic ESV
The ecosystem provides human beings with economic, ecological, and social services such as fuel, food, water conservation, culture, and education, and is an important natural resource. Ecosystem service value evaluation is the basis of natural resource asset management, ecological compensation, and ecosystem development and utilization. Related studies have proposed evaluation methods such as the unit value method, revealed preference method, stated preference method, and market value method [56]. The unit value method systematically divides the ecosystem service functions and quantitatively determines the value of various ecosystem service functions per unit area. At present, the functional value method and equivalent factor method are widely used unit value techniques. By combining the Costanza assessment system with the actual situation in China, Xie et al. [57] divided the ecosystem service value into gas regulation, climate regulation, water conservation, soil formation and protection, waste treatment, biodiversity maintenance, food production, raw material production, and leisure and entertainment. The authors also formulated equivalent factor tables, which are highly recognized and widely used by domestic scholars. On this basis, the ecosystem service value in the present study is divided into the three categories of material product functions (climate regulation, gas regulation, food production, raw material production, etc.), ecological safety maintenance functions (water conservation, soil formation and protection, waste treatment, maintenance of biodiversity, etc.), and entertainment and cultural functions (leisure and entertainment), combined with the equivalent factor method, to evaluate the value of the basic ecosystem services in Daye City, as per Equation (5):
E S V = i = 1 m j = 1 n V C i j × S j
where ESV is the total value of ecosystem services in the study area; VCij is the benchmark unit price of category j ecosystem services for category i; and Sj is the area of category j ecosystems.
  • Vertical ecological process modification
Vertical ecological processes refer to biological and non-biological processes that occur within a certain landscape unit or ecosystem, are closely related to the value of ecosystem services and are directly affected by three-dimensional topographical factors. Firstly, the topography will greatly affect the light and heat conditions of the land. For ecosystems that dominate plant photosynthesis, such as cultivated land, woodland, and grassland, light and heat conditions largely determine the potential material product functions. Secondly, topography directly affects the water and soil conservation capacity of the plot, which has a significant impact on ecological safety maintenance functions. Therefore, the present study establishes topographic correction factors for material product functions and ecological safety maintenance functions from the perspectives of light and heat conditions and water and soil conservation. This study also revises the ESV of cultivated land, woodland, and grassland. The ESV of waters and construction land is less affected by terrain, and the ecosystem service value of unused land is generally not high. Ignoring the influence of terrain factors, the terrain correction factor is taken as 1.
Sunshine duration is the main indicator of total solar radiation, and soil erosion is an important indicator of water conservation and soil safety. In this paper, sunshine duration [58] is used to characterize the differences in light and heat distribution caused by three-dimensional terrain, while the amount of soil erosion [59] is used to characterize the differences in water and soil conservation caused by three-dimensional topography. On this basis, a three-dimensional terrain-based ESV correction model is constructed, as shown in Formula 6, and the calculation of each correction index is shown in Table S2 (Supplementary Materials):
E S V = i = 1 m j = 1 n ( V C i j × ω i j )
where ωij is the terrain correction factor of the benchmark unit price of the i-th type of service in the j ecosystem; and VCij and ESV are the same as above.
  • Horizontal ecological process modification
Horizontal ecological processes occur between different landscape units or ecosystems and are mainly manifested in the energy flow and material conversion in the region. Given the increasing prominence of regional ecological security issues, the importance of plots in the regional ecological process has grown considerably. The ecological security pattern is a concentrated expression of ecological processes at the regional level and is of great significance for improving the quality of the regional ecological environment and maintaining the sustainable development of the region. Therefore, this paper uses the ecological security pattern to revise the functional value of land ecological security maintenance.
The construction of the ecological security pattern is divided into two parts: ecological source identification and ecological corridor extraction. The ecological source area refers to the area that must be protected to maintain regional ecological security and sustainable development. This area represents a source of species diffusion and ecological function flow and transmission. In this paper, we adopt the direct picking method to identify ecological sources alongside Daye City lakes, wetlands, medium-sized (and larger) reservoirs, habitats of rare animals and plants, and native forests as ecological sources.
The ecological corridor refers to the linear or zonal ecological landscape connecting the ecological source, reflecting the connectivity and accessibility of the source. In this paper, land-use type, night light index, terrain slope, and NDVI are considered to determine the resistance value of the plot [53] (see Table S3 in the Supplementary Materials). Based on the minimum cumulative resistance model (MCR), the ecological corridor of Daye City was first constructed, and then the improved Kruskal algorithm was used to divide the ecological corridor into a skeleton corridor and ordinary corridor to distinguish the importance of different corridors in the ecological security pattern. After constructing the ecological security pattern, through a buffer analysis of different types of ecological land, the correction index of the ecological security pattern was determined, as shown in Table S4 (Supplementary Materials).

3. Result

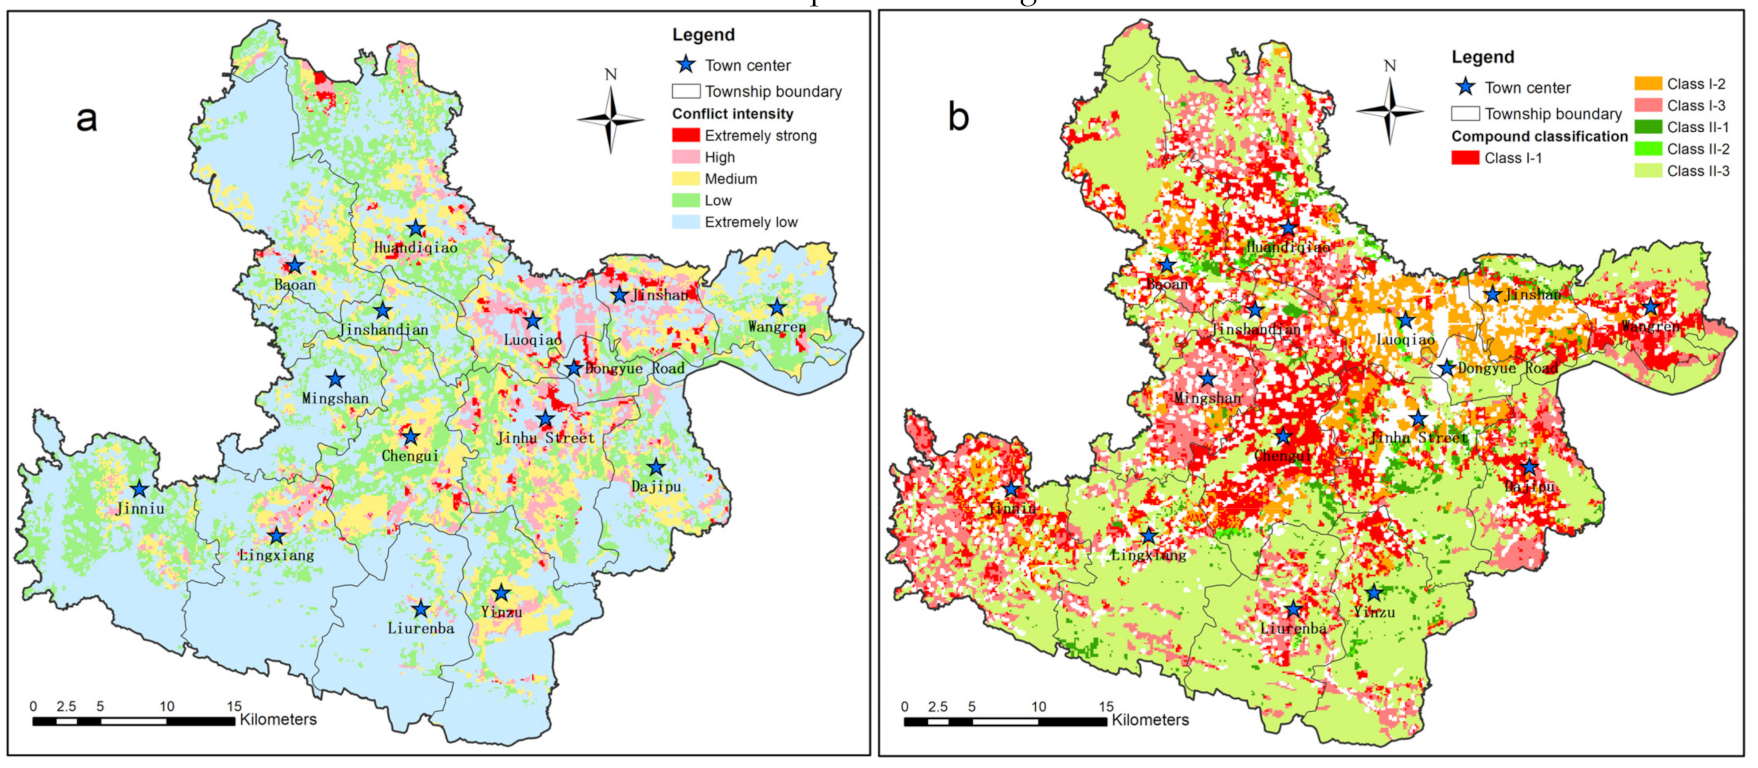
3.1. LEC Quantitative Results and Analysis
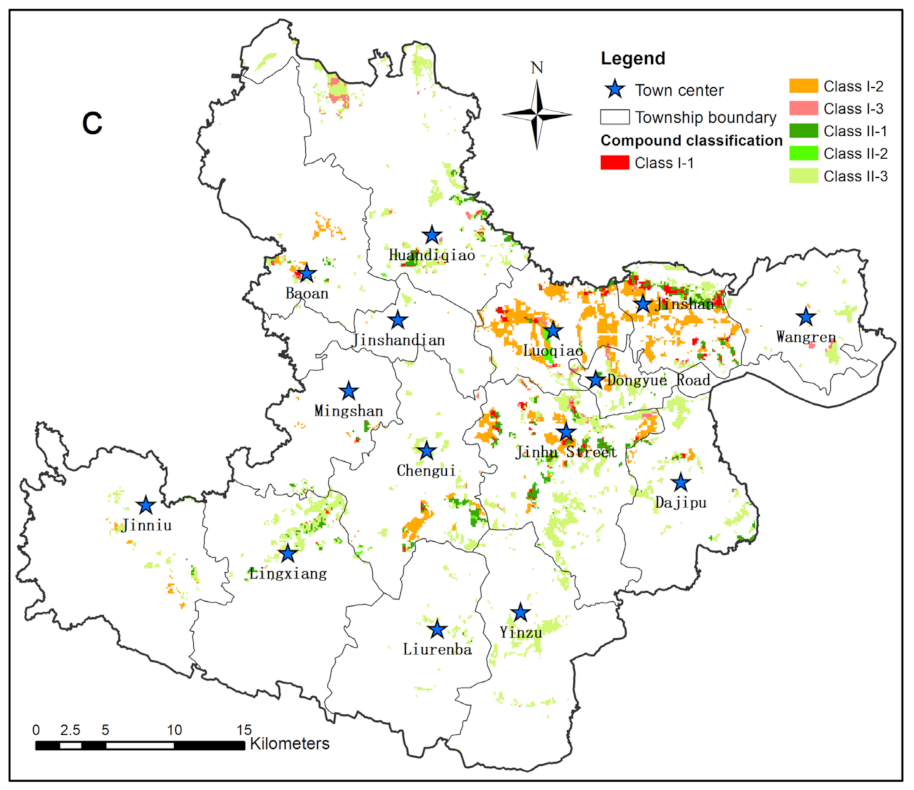
In total, 10,000 cells were extracted from the land-use data for 2005 to 2015 as the sample set, and the training-to-testing ratio was set to 7:3 in order to train and test the network model. In this model, if the network output probability is greater than 0.5, the result will be regarded as a change in the land-use mode; otherwise the land-use mode will not change. Then, the receiver operating characteristic curve (ROC) analysis method can be applied to test the accuracy of the prediction results [60]. In this study, the ROC curve was constructed according to the test results, as shown in Figure 2. The AUC value was 0.851, and the accuracy of the model was good.
Based on the determination method for the L, E, and C parameters above, this paper takes the relevant land use indicators of Daye City in 2015 as the basic data; quantifies the probability of LUCC, the constraint of policy on LUCC, and the loss of ESV; and then obtains the probability of LUC, the degree of LUC exposure, and the consequences of LUC. The results were graded by the natural breakpoint method. According to the classification results, the spatial distribution characteristics of the research results can be better analyzed.
Figure 3a shows that the blocks with high expansion probability are mainly distributed on Dongyue Road, Luoqiao Street, and Jinshan Street and scattered in other towns. The blocks with medium expansion probability are mainly distributed in Yinzu Town to the south of Daye City, Chengui Town and Jinhu Street in the middle, Huandiqiao Town in the northwest, and Wangren Town in the East. Figure 3c shows that the high-loss plots of ESV are mainly concentrated in Lingxiang Town, Liurenba Town and Yinzu Town in the south of Daye City, Jinhu Street in the middle, Wangren Town in the East, and Baoan Town in the north. Compared with the high-loss plots, the medium-loss and low-loss plots are scattered.
Table 2 shows that the plots with high expansion probability and medium expansion probability account for 10.24% and 32.65% of the total area of Daye City, respectively. The former plots mainly represent the occupation of cultivated land, while the latter mainly represent the occupations of cultivated land and forest land. The highly and moderately restricted plots of LUCC account for 2.86% and 20.83% of the total area of Daye City, respectively. The former mainly focuses on the protection of forest land, while the latter mainly focuses on the protection of cultivated land, forest land, and water area. The high loss and medium loss of ESV accounted, respectively, for 47.76% and 44.52% of the total area of Daye City. The former is mainly concentrated in the value loss of forest land and water area, while the latter is mainly concentrated in the value loss of cultivated land.

3.2. Potential LUC

By using the spatial analysis function of ArcGIS alongside the LEC identification model, the potential LUC in Daye City was obtained, and the conflict intensity was divided into five levels (very strong, high, medium, low, and very low). As shown in Figure 4a, the conflict intensity of each level accounts for 1.45%, 6.81%, 14.81%, 19.43%, and 57.51% of the total area of Daye City, respectively. Extremely strong conflicts and high conflicts are mainly concentrated in Luoqiao Street, Dongyue Road, Jinshan Street and Jinhu Street. This area is the center of economic and social development in Daye City and features convenient transportation and good natural land conditions.
Conflict classification is important to determine the main direction of LUC management and can help provide clearer guidance for land planning. In this study, we constructed a composite classification system for LUC from the perspectives of manifestation and dominant factors, as shown in Table 3. The conflict forms mainly examine the occupation of agricultural and ecological space by the expansion of construction space. The dominant factors include the possibility and the consequences of the conflict.
The LUC in Daye City was divided based on the establishment of a composite classification system, as shown in Figure 4b, in which type II-3 accounts for 51.15%. This type is mainly distributed in the southern forest area of Daye City, with a small-scale gathering state near Baoan Lake in the north of Daye City and Daye Lake in the east of Daye City, followed by type I-1, type I-3, and type I-2, accounting for 19.23%, 14.50%, and 10.53%, respectively. These three types are mainly distributed in the central and northern areas of Daye City and are scattered in other towns whose areas mainly include cultivated land and relatively convenient transportation.
The extremely strong-conflict and high-conflict zones are the key conflict areas in Daye City. Figure 5 illustrates the extraction and analysis of this area. From the perspective of the manifestations of LUC, the conflicts between construction and agricultural space and construction and ecological space accounted for 35.53% and 64.47% of the key conflicts, respectively, indicating that the conflict between construction and ecological space remains the main conflict in the key conflict areas. From the perspective of the dominant factors of LUC, the three types of conflicts, probability-loss dominance, probability dominance, and loss dominance, accounted for 15.02%, 30.59%, and 54.39% of the key conflict areas, respectively. Loss-dominated LUC accounted for a relatively large proportion, indicating that the LUC in Daye City has a significant impact on the land ESV in the entire region. From the perspective of the composite classification of LUC, the major conflict areas are mainly type II-3, type I-2, and type II-1, which account, respectively, for 52.04%, 28.50%, and 10.35% of the total area of the key conflict areas. Analysis of the areal proportion of the conflict zone shows that the LUC in Daye City has a greater impact on the ecological space and poses a certain threat to regional ecological security. Thus, the regional ecological level needs to be maintained in land- and space-planning work.
Figure 5a shows that the key conflicts between construction and agricultural space are mainly concentrated in Luoqiao Street, Jinshan Street, and Jinhu Street. This area is flat and located near the center of Daye, with good traffic locations and contiguous high-quality farmland. Consequently, LUC between construction and agricultural space is likely to erupt in this area. Compared with the LUC between construction and agriculture space, the conflict between construction and ecological space is more scattered, with LUC mainly distributed in Lingxiang Town, Huandiqiao Town, Yinzu Town, Jinhu Street, Dongyue Road Street, and Dajipu Town. This scattered conflict shows the characteristics of strip distribution along the main traffic line and divergent distribution through the town center.
Figure 5b presents the spatial distribution characteristics of the key conflicts of different dominant factors. Comparing Figure 5b with Figure 5a indicates that “probability (dominant factor)” LUC and “construction–agricultural (manifestations)” LUC have similar spatial distributions. In addition, the spatial distribution of “loss (dominant factor)” LUC is similar to that of “construction–ecological (manifestations)” LUC. Therefore, LUC is more likely to occur between construction and agricultural space than between construction and ecological space. Conversely, the outbreak of LUC between construction and ecological space will lead to more serious loss of land ecosystem service value.
A comparative analysis of Figure 5a,c shows that the spatial conflict between construction and agriculture is mainly of the I-2 type, with nearly identical spatial distribution characteristics. Compared with type I-2 spatial conflicts, type I-1 and type I-3 spatial conflicts mainly occur in the most important plots in the ecological security pattern, where the ecosystem service value is greatly affected by the three-dimensional terrain, and the spatial distribution of conflict is relatively scattered, showing no obvious aggregation characteristics. The conflict between construction and ecological space is mainly type II-3, with nearly identical spatial distribution characteristics. Compared with type II-3 spatial conflict, the proportion of type II-1 and type II-2 spatial conflict is relatively low. The main difference is that the terrain conditions and traffic locations of the plots in which type II-1 and type II-2 spatial conflicts are located are more likely to result in land-use spatial conflict.

4. Discussion

Research on LUC is a common area of study in academia. The exploration of conflict states provides the basis for understanding the organization, coordination, and distribution of regional land use, as well as achieving the main scientific goal of solving disordered land resources development, heavy ecological and environmental costs, and the continuous deterioration of land resources [9]. Daye City is a typical mining city. The long-term mining activities in Daye City aggravated the disorder and confusion of land use in the area, and the conflict in land use has had a serious impact on regional sustainable development [61]. To explore the situation of land-use conflict in this area and guide conflict management, we constructed a land-use conflict identification model in this paper based on LEC, after comprehensively considering land-use transfer, policies and regulations, and ecosystem services.
The mechanisms of land-use change are complex. In this study, we applied a novel machine learning method to the probability prediction of land-use change. Through network training and testing, we found that machine learning achieved good results in the prediction of land-use change, which indicates that this method is feasible in the field of land use. If more specific land use data can be obtained, the accuracy of prediction could be improved. In China’s land management system, the impact of policy factors on land-use conflict is very important [62]. Although this paper considered the impact factors, due to the limitations of data availability, the consideration of policy factors remains insufficient. We sought to develop our understanding of the impact of policy on land-use conflict. With the diversified development of society, the multi-functional characteristics of land resources are becoming increasingly valued. Therefore, in the process of land resource development and management, the multiple values of land must be reflected [63]. In the process of conflict identification, we used ecosystem service value to measure the negative impact of land conflict and revised the results from the perspectives of horizontal and vertical ecological processes, considering the spatial specificity and diversity of land value, which are very important factors in conflict identification.
In the process of predicting land-use transfer, by analyzing the parameters of the trained BP neural network model, the contribution rate of each index to the impact of land-use transfer was obtained, as shown in the attached table. The cumulative contribution rates of natural environmental and socioeconomic factors were 35.41% and 64.59% respectively, which indicates that human activities still play a decisive role in the transfer of land-use patterns and promote the evolution of land-use conflicts [64]. In the Daye region, the transfer probability of land use in the middle and northeast is high and shows a trend of divergence along the traffic trunk line and the city center. The plots with different transfer probability levels have certain spatial gradients and aggregation characteristics, reflecting the leading roles of social and economic factors. These results are consistent with other similar research conclusions [65]. Among the natural environmental factors, the dominant factor is terrain (slope, aspect, and elevation), which indicates that conflict is more likely to occur on flat terrain [66]. According to the actual situation, we can divide instances of extremely strong and strong conflict into the key conflict areas of Daye City, which can provide a general direction for conflict governance. This conflict compound classification system more deeply reflects the mechanisms behind the conflict and will facilitate the formulation of clearer conflict governance measures.
The multi-functional characteristics of land resources are fundamental causes of land-use conflict, and the transfer of land-use mode is an important manifestation of land-use conflict. Policy provides macro-level control of land-use transfer, while the social, economic, and ecological losses caused by the conflict determine the impact of the conflict. Investigating the possibility, constraints, and negative effects of conflicts is an important part of conflict identification and can provide scientific theories and methods for land management. However, China has a vast territory and great regional differences. Therefore, we should consider these three links with the actual situation of the region to select the appropriate quantitative indicators. In addition, there are many kinds of machine learning algorithms; however, these algorithms are not commonly used in land-use transfer prediction. The present study did not compare and analyze the predictive effects of different algorithms, which may reduce the empirical significance of this paper. Only through further theoretical analyses and empirical research on the above issues will the research results become more convincing. These analyses will be one of our next research directions.

5. Conclusions

The development of the social economy has led to increasing demands for land resources. Land use in mining cities is chaotic, and frequent LUCs have seriously hindered the ecological environment and economic development. For LUC escalation, it is feasible to identify LUC from the perspective of risk assessment, which has important practical significance. This paper explored the possibility of conflict, the degree of conflict exposure, and the loss caused by conflict. Based on the LEC concept, we constructed a conflict identification model. Starting from the manifestation and dominant factors of conflict, this model was used to create a composite classification system and analyze conflict intensity and spatial characteristics. Taking Daye City as an example, we determined that cultivated land, forest land, and water area are threatened by LUC. These three kinds of land are important parts of agricultural ands ecological space that need to be protected in future land space planning work to maintain regional land material outputs and ecological maintenance functions. Conflict intensity was observed at different levels (from high to low); the proportion of conflict area was 1.45% (very strong), 6.81% (high), 14.81% (medium), 19.43% (low), and 57.51% (very low), in which very strong conflict and high conflict need to be focused on most strongly and are mainly distributed in the north and middle of Daye City. This area belongs to the economically developed portion of Daye City, with convenient transportation and numerous industries and mines. Thus, this area should be targeted when formulating land-use conflict mitigation strategies to ensure sustainable development of the regional social economy.

Supplementary Materials

The following are available online at https://www.mdpi.com/article/10.3390/ijgi10070433/s1, Table S1: Quantification of the degree of restriction on land use transfer, Table S2: Three-dimensional terrain correction index, Table S3: Resistance surface correction factor, Table S4: Ecological security pattern revision index.

Author Contributions

Data acquisition and processing: Hao Zhou and Ruoying Tian. Conception and design: Hao Zhou and Yong Chen. Text organization and modification: Hao Zhou and Yong Chen. Visualization: Hao Zhou and Ruoying Tian. All authors have read and agreed to the published version of the manuscript.

Funding

This work was supported by National Natural Science Foundation of China [grant numbers 41971237]; Open Foundation of State Environmental Protection Key Laboratory of Mineral Metallurgical Resources Utilization and Pollution Control [grant number HB201916].

Institutional Review Board Statement

Not applicable.

Informed Consent Statement

Not applicable.

Data Availability Statement

Not applicable.

Acknowledgments

This study is helpful to solve the problem of land use conflict in mining cities, and can provide scientific guidance for regional sustainable development in land management. In the process of research, I would like to thank the Key Laboratory of efficient utilization of metallurgical mineral resources and block construction of Hubei Province and Professor Yong Chen for their financial help, and also thank Professor Yong Chen and his team for their help in data collection and processing.

Conflicts of Interest

The authors declare no conflict of interest.

References

  1. Zhu, Y.-G. Environmental impacts of rapid urbanization in China: A showcase of recent research developments. Environ. Sci. Pollut. Res. 2012, 19, 1351. [Google Scholar] [CrossRef] [PubMed]
  2. Shen, L.; Gunson, A.J. The role of artisanal and small-scale mining in China’s economy. J. Clean. Prod. 2006, 14, 427–435. [Google Scholar] [CrossRef]
  3. Liu, X.; Guo, P.; Guo, S. Assessing the eco-efficiency of a circular economy system in China’s coal mining areas: Emergy and data envelopment analysis. J. Clean. Prod. 2019, 206, 1101–1109. [Google Scholar] [CrossRef]
  4. Yuan, J.; Bian, Z.; Yan, Q.; Pan, Y. Spatio-Temporal Distributions of the Land Use Efficiency Coupling Coordination Degree in Mining Cities of Western China. Sustainability 2019, 11, 5288. [Google Scholar] [CrossRef] [Green Version]
  5. Liu, L.; Zhou, J. Analyzing Ecological Functions in Coal Mining Cities Based on RS and GIS. Pol. J. Environ. Stud. 2018, 27, 1165–1174. [Google Scholar] [CrossRef]
  6. Sikuzani, Y.U.; Boisson, S.; Kaleba, S.C.; Khonde, C.N.; Malaisse, F.; Halleux, J.-M.; Bogaert, J.; Kankumbi, F.M. Land cover dynamics around mining sites along urban-rural gradient of Lubumbashi city (DR Congo) Description of the subject. Biotechnol. Agron. Soc. Et Environ. 2020, 24, 14–27. [Google Scholar]
  7. Yu, Y.; Chen, S.-E.; Deng, K.-Z.; Wang, P.; Fan, H.-D. Subsidence Mechanism and Stability Assessment Methods for Partial Extraction Mines for Sustainable Development of Mining Cities-A Review. Sustainability 2018, 10, 113. [Google Scholar] [CrossRef] [Green Version]
  8. Fuhrmann, N.L. O primado do reconhecimento sobre a redistribuição: A origem dos conflitos sociais a partir da teoria de Axel Honneth. Sociologias 2013, 15, 170–203. [Google Scholar] [CrossRef] [Green Version]
  9. Zou, L.; Liu, Y.; Wang, J.; Yang, Y.; Wang, Y. Land use conflict identification and sustainable development scenario simulation on China’s southeast coast. J. Clean. Prod. 2019, 238. [Google Scholar] [CrossRef]
  10. Sze, M.N.M.; Sovacool, B.K. Of fast lanes, flora, and foreign workers: Managing land use conflicts in Singapore. Land Use Policy 2013, 30, 167–176. [Google Scholar] [CrossRef]
  11. Reuveny, R.; Maxwell, J.W.; Davis, J. On conflict over natural resources. Ecol. Econ. 2011, 70, 698–712. [Google Scholar] [CrossRef]
  12. Brown, G.; Raymond, C.M. Methods for identifying land use conflict potential using participatory mapping. Landsc. Urban Plan. 2014, 122, 196–208. [Google Scholar] [CrossRef]
  13. Steinhäußer, R.; Siebert, R.; Steinführer, A.; Hellmich, M. National and regional land-use conflicts in Germany from the perspective of stakeholders. Land Use Policy 2015, 49, 183–194. [Google Scholar] [CrossRef]
  14. Ioja, C.L.; Nita, M.R.; Vanau, G.O.; Onose, D.A.; Gavrilidis, A.A. Using multi-criteria analysis for the identification of spatial land-use conflicts in the Bucharest Metropolitan Area. Ecol. Indic. 2014, 42, 112–121. [Google Scholar] [CrossRef]
  15. Valle Junior, R.F.; Varandas, S.G.P.; Sanches Fernandes, L.F.; Pacheco, F.A.L. Groundwater quality in rural watersheds with environmental land use conflicts. Sci. Total Environ. 2014, 493, 812–827. [Google Scholar] [CrossRef]
  16. Dietz, K.; Engels, B. Analysing land conflicts in times of global crises. Geoforum 2020, 111, 208–217. [Google Scholar] [CrossRef]
  17. Petrescu-Mag, R.M.; Petrescu, D.C.; Azadi, H.; Petrescu-Mag, I.V. Agricultural land use conflict management—Vulnerabilities, law restrictions and negotiation frames. A wake-up call. Land Use Policy 2018, 76, 600–610. [Google Scholar] [CrossRef]
  18. Zhou, D.; Lin, Z.; Lim, S.H. Spatial characteristics and risk factor identification for land use spatial conflicts in a rapid urbanization region in China. Environ. Monit. Assess. 2019, 191. [Google Scholar] [CrossRef]
  19. von der Dunk, A.; Gret-Regamey, A.; Dalang, T.; Hersperger, A.M. Defining a typology of peri-urban land-use conflicts—A case study from Switzerland. Landsc. Urban Plan. 2011, 101, 149–156. [Google Scholar] [CrossRef]
  20. Cieślak, I. Identification of areas exposed to land use conflict with the use of multiple-criteria decision-making methods. Land Use Policy 2019, 89, 104225. [Google Scholar] [CrossRef]
  21. Adam, Y.O.; Pretzsch, J.; Darr, D. Land use conflicts in central Sudan: Perception and local coping mechanisms. Land Use Policy 2015, 42, 1–6. [Google Scholar] [CrossRef]
  22. Delgado-Matas, C.; Mola-Yudego, B.; Gritten, D.; Kiala-Kalusinga, D.; Pukkala, T. Land use evolution and management under recurrent conflict conditions: Umbundu agroforestry system in the Angolan Highlands. Land Use Policy 2015, 42, 460–470. [Google Scholar] [CrossRef]
  23. Zhou, D.; Xu, J.; Lin, Z. Conflict or coordination? Assessing land use multi-functionalization using production-living-ecology analysis. Sci. Total Environ. 2017, 577, 136–147. [Google Scholar] [CrossRef]
  24. Kim, I.; Arnhold, S. Mapping environmental land use conflict potentials and ecosystem services in agricultural watersheds. Sci. Total Environ. 2018, 630, 827–838. [Google Scholar] [CrossRef]
  25. Kuusaana, E.D.; Bukari, K.N. Land conflicts between smallholders and Fulani pastoralists in Ghana: Evidence from the Asante Akim North District (AAND). J. Rural Stud. 2015, 42, 52–62. [Google Scholar] [CrossRef]
  26. Bircol, G.A.C.; Souza, M.P.d.; Fontes, A.T.; Chiarello, A.G.; Ranieri, V.E.L. Planning by the rules: A fair chance for the environment in a land-use conflict area. Land Use Policy 2018, 76, 103–112. [Google Scholar] [CrossRef]
  27. Anderson, N.M.; Ford, R.M.; Williams, K.J.H. Contested beliefs about land-use are associated with divergent representations of a rural landscape as place. Landsc. Urban Plan. 2017, 157, 75–89. [Google Scholar] [CrossRef]
  28. Pacheco, F.A.L.; Varandas, S.G.P.; Sanches Fernandes, L.F.; Valle Junior, R.F. Soil losses in rural watersheds with environmental land use conflicts. Sci. Total Environ. 2014, 485, 110–120. [Google Scholar] [CrossRef]
  29. Karimi, A.; Hockings, M. A social-ecological approach to land-use conflict to inform regional and conservation planning and management. Landsc. Ecol. 2018, 33, 691–710. [Google Scholar] [CrossRef]
  30. Valle Junior, R.F.; Varandas, S.G.P.; Pacheco, F.A.L.; Pereira, V.R.; Santos, C.F.; Cortes, R.M.V.; Sanches Fernandes, L.F. Impacts of land use conflicts on riverine ecosystems. Land Use Policy 2015, 43, 48–62. [Google Scholar] [CrossRef] [Green Version]
  31. Lin, J.; Li, X. Conflict resolution in the zoning of eco-protected areas in fastgrowing regions based on game theory. J. Environ. Manag. 2016, 170, 177–185. [Google Scholar] [CrossRef] [PubMed]
  32. Zhang, Y.; Long, H.; Tu, S.; Ge, D.; Ma, L.; Wang, L. Spatial identification of land use functions and their tradeoffs/synergies in China: Implications for sustainable land management. Ecol. Indic. 2019, 107. [Google Scholar] [CrossRef]
  33. Kienast, F.; Huber, N.; Hergert, R.; Bolliger, J.; Moran, L.S.; Hersperger, A.M. Conflicts between decentralized renewable electricity production and landscape services—A spatially-explicit quantitative assessment for Switzerland. Renew. Sustain. Energy Rev. 2017, 67, 397–407. [Google Scholar] [CrossRef]
  34. de Groot, R. Function-analysis and valuation as a tool to assess land use conflicts in planning for sustainable, multi-functional landscapes. Landsc. Urban Plan. 2006, 75, 175–186. [Google Scholar] [CrossRef]
  35. Brown, G.; Weber, D.; de Bie, K. Assessing the value of public lands using public participation GIS (PPGIS) and social landscape metrics. Appl. Geogr. 2014, 53, 77–89. [Google Scholar] [CrossRef]
  36. Bikdeli, S. Redevelopment modeling for land suitability evaluation of the suburb brown-fields using fuzzy logic and GIS, northeastern Iran. Environ. Dev. Sustain. 2020, 22, 6213–6232. [Google Scholar] [CrossRef]
  37. Gong, J.; Liu, Y.; Chen, W. Land suitability evaluation for development using a matter-element model: A case study in Zengcheng, Guangzhou, China. Land Use Policy 2012, 29, 464–472. [Google Scholar] [CrossRef]
  38. Carr, M.H.; Zwick, P. Using GIS suitability analysis to identify potential future land use conflicts in North Central Florida. J. Conserv. Plan. 2005, 1, 89–105. [Google Scholar]
  39. El Baroudy, A.A. Mapping and evaluating land suitability using a GIS-based model. Catena 2016, 140, 96–104. [Google Scholar] [CrossRef]
  40. Lichtenberg, E.; Ding, C. Assessing farmland protection policy in China. Land Use Policy 2008, 25, 59–68. [Google Scholar] [CrossRef]
  41. Graham, K.J.; Kinney, G.F. A practical safety analysis system for hazards control. J. Saf. Res. 1980, 12, 13–20. [Google Scholar]
  42. Kuang, L.; Chen, L.; Guo, Q. Further discussion on the LEC evaluation method and its applications in the quantitative analysis of the risks. J. Saf. Environ. 2018, 18, 1902–1905. [Google Scholar] [CrossRef]
  43. Zhang, H.; Yin, S.; Chen, Y.; Shao, S.; Wu, J.; Fan, M.; Chen, F.; Gao, C. Machine learning-based source identification and spatial prediction of heavy metals in soil in a rapid urbanization area, eastern China. J. Clean. Prod. 2020, 273. [Google Scholar] [CrossRef]
  44. Du, J.; Thill, J.-C.; Peiser, R.B.; Feng, C. Urban land market and land-use changes in post-reform China: A case study of Beijing. Landsc. Urban Plan. 2014, 124, 118–128. [Google Scholar] [CrossRef]
  45. Xing, L.; Hu, M.; Wang, Y. Integrating ecosystem services value and uncertainty into regional ecological risk assessment: A case study of Hubei Province, Central China. Sci. Total Environ. 2020, 740. [Google Scholar] [CrossRef]
  46. Ye, Q.; Wei, R.; Zhang, P. A Conflict Identification Method of Urban, Agricultural and Ecological Spaces Based on the Space Conversion Matrix. Sustainability 2018, 10, 3502. [Google Scholar] [CrossRef] [Green Version]
  47. Li, Y.; Kong, X.; Zhu, Z. Multiscale analysis of the correlation patterns between the urban population and construction land in China. Sustain. Cities Soc. 2020, 61. [Google Scholar] [CrossRef]
  48. Cui, X.; Yang, S.; Zhang, G.; Liang, B.; Li, F. An Exploration of a Synthetic Construction Land Use Quality Evaluation Based on Economic-Social-Ecological Coupling Perspective: A Case Study in Major Chinese Cities. Int. J. Environ. Res. Public Health 2020, 17, 3663. [Google Scholar] [CrossRef]
  49. Cai, W.; Tu, F. Spatiotemporal characteristics and driving forces of construction land expansion in Yangtze River economic belt, China. PLoS ONE 2020, 15, e0227299. [Google Scholar] [CrossRef]
  50. He, W.; Yin, S.; Men, M.; Zhang, L. Suitability evaluation of unused land as construction land in Huailai based on landscape connectivity theory. Chin. J. Eco-Agric. 2016, 24, 969–977. [Google Scholar] [CrossRef]
  51. Wang, Q.; Zhen, L.; Bian, Z.; Qian, F.; Liu, H. Potential land use conflict identification and its application in Shenbei New District. Trans. Chin. Soc. Agric. Eng. 2012, 28, 185–192. [Google Scholar] [CrossRef]
  52. Chen, W.; Liu, X. The research on identification of potential land use conflict based on suitability evaluation: A case study on Honghe County of Yunnan Province. J. Gansu Agric. Univ. 2015, 123–130. [Google Scholar] [CrossRef]
  53. Chen, Y.; Xiao, X.; Liu, Y.; Ruan, J.; Zeng, X.; Wang, Q. Construction of Ecological Security Pattern in Mining Cities by Balancing Ecological Supply andHuman Demand:A Case Study of Daye City, Hubei Province. Metal Mine 2019, 154–160. [Google Scholar] [CrossRef]
  54. Liu, Y.; Lei, S.; Fang, R. Dynamic Changes of Cultivated Land and Division of Risk Class of Vulnerable Area—Taking Daye City as an example. Hubei Agric. Sci. 2015, 54, 1023–1058. [Google Scholar] [CrossRef]
  55. Yu, W.; Ai, T.; Shao, S. The analysis and delimitation of Central Business District using network kernel density estimation. J. Transp. Geogr. 2015, 45, 32–47. [Google Scholar] [CrossRef]
  56. Yin, N.; Wang, S.; Liu, Y. Ecosystem services valuation: Research progress and Prospects. J. Ecol. 2021, 40, 233–244. [Google Scholar] [CrossRef]
  57. Xie, G.; Lu, C.; Leng, Y.; Zhen, D.; Li, S. Ecological assets valuation of the Tibetan Plateau. J. Nat. Resour. 2003, 18, 189–196. [Google Scholar] [CrossRef]
  58. Suehrcke, H.; Bowden, R.S.; Hollands, K.G.T. Relationship between sunshine duration and solar radiation. Sol. Energy 2013, 92, 160–171. [Google Scholar] [CrossRef]
  59. Xiao, J.; Sun, Z.; Liu, Z.; Zhen, J.; Liu, Y.; Feng, L.; Yang, N.; Bai, W. Effects of rainfall erosion factor, vegetation type and coverage on soil erosion of sloping farmland. Trans. Chin. Soc. Agric. Eng. 2017, 33, 159–166. [Google Scholar] [CrossRef]
  60. Wang, Z.; Martin, R. Model-free posterior inference on the area under the receiver operating characteristic curve. J. Stat. Plan. Inference 2020, 209, 174–186. [Google Scholar] [CrossRef] [Green Version]
  61. Tai, X.; Xiao, W.; Tang, Y. A quantitative assessment of vulnerability using social-economic-natural compound ecosystem framework in coal mining cities. J. Clean. Prod. 2020, 258. [Google Scholar] [CrossRef]
  62. Huang, X.; Li, H.; Zhang, X.; Zhang, X. Land use policy as an instrument of rural resilience—The case of land withdrawal mechanism for rural homesteads in China. Ecol. Indic. 2018, 87, 47–55. [Google Scholar] [CrossRef]
  63. Gao, X.; Wang, J.; Li, C.; Shen, W.; Song, Z.; Nie, C.; Zhang, X. Land use change simulation and spatial analysis of ecosystem service value in Shijiazhuang under multi-scenarios. Environ. Sci. Pollut. Res. Int. 2021. [Google Scholar] [CrossRef]
  64. Yu, Y.; Chen, X.; Huttner, P.; Hinnenthal, M.; Brieden, A.; Sun, L.X.; Disse, M. Model based decision support system for land use changes and socio-economic assessments. J. Arid Land 2018, 10, 169–182. [Google Scholar] [CrossRef] [Green Version]
  65. Wang, X.F.; Xiao, F.Y.; Zhang, Y.; Yin, L.C.; Lesi, M.C.; Guo, B.; Zhao, Y.H. Thirty-year expansion of construction land in Xi’an: Spatial pattern and potential driving factors. Geol. J. 2018, 53, 309–321. [Google Scholar] [CrossRef]
  66. Von Der Dunk, A.; Gret-Regamey, A.; Hersperger, A.M. Land-use conflict in a swiss peri-urban landscape: Which socio-demographic and environmental variables are associated with their presence and absence? Carpathian J. Earth Environ. Sci. 2015, 10, 39–48. [Google Scholar]
Figure 1. Analysis framework of the LUC identification model.
Ijgi 10 00433 g001
Figure 2. Forecast accuracy of the BP neural network model.
Ijgi 10 00433 g002
Figure 3. (a) The prediction result of ML, which describes the probability of LUCC. (b) The degree of restriction of LUCC under relevant protection policies. (c) The possible loss of ecosystem service value caused by LUCC.
Ijgi 10 00433 g003aIjgi 10 00433 g003b
Figure 4. (a) The spatial distribution of LUC of different intensities in the study area. (b) The compound classification and spatial distribution of LUC in the study area.
Ijgi 10 00433 g004
Figure 5. (a) The manifestations of key conflicts and their spatial distribution. (b) The spatial distribution of key conflicts of different dominant factors. (c) The classification and distribution characteristics of key conflict areas.
Ijgi 10 00433 g005aIjgi 10 00433 g005b
Table 1. Forecast indicators of land-use-change probability in Daye City.
Index ClassificationIndicator Name
(Variable)
Index Classification and Assignment
654321
Natural environment (X1)Slope(X11)0~5°5~15°15~25°25~35°35~45°>45°
Aspect(X12)No aspectSouthSoutheast or southwestEast or westNortheast or northwestNorth
Elevation(X13)0–100100–200200–350350–500500–800>800
Water security degree(X14) f i = M × ( 1 r )
Geological disaster(X15) f i = M × ( 1 r )
Social economy (X2)Mining impact(X21) f i = M 1 r
Central town influence(X22) f i = M ( 1 r )
Road accessibility(X23) f i = M × ( 1 r )
Land-use type(X24)Cultivated landWoodlandGrasslandWatersConstruction landUnused land
Population density(X25) X P O I = i = 1 n 1 D 2 × d i D × K
Per capita income level(X26)Per capita income level of each township
Table 2. LEC parameter classification and area percentage (%).
Land-Use TypeLUCC Probability(L)Degree of Restraint(E)Loss of ESV(C)
HighMediumLowHighMediumLowHighMediumLow
Cultivated land8.2018.0817.1734.977.950.530.4536.746.27
Woodland1.5210.8122.9728.145.311.8533.161.760.38
Grassland0.271.085.945.821.000.460.785.910.59
Waters0.252.5410.787.036.530.0113.370.110.10
Unused land0.000.140.250.350.040.000.000.000.39
Total10.2432.6557.1176.3120.832.8647.7644.527.72
Table 3. Compound classification system for land-use spatial conflict.
Composite Classification System (Classification Code)Dominant Factor
Loss ProbabilityProbabilityLoss
ManifestationsConstruction-AgriculturalI-1I-2I-3
Construction-EcologicalII-1II-2II-3
(1) ‘Loss-Probability’ means that the conflict is dominated by the probability of LUCC and the loss caused. (2) ‘Probability’ means that the conflict is dominated by the probability of LUCC. (3) ‘Loss’ means that the conflict is dominated by the loss of ESV caused by LUCC.
Publisher’s Note: MDPI stays neutral with regard to jurisdictional claims in published maps and institutional affiliations.

