Article

Exploring Equity in Healthcare Services: Spatial Accessibility Changes during Subway Expansion

School of Transportation Engineering, Shenyang Jianzhu University, Shenyang 110168, China
*
Author to whom correspondence should be addressed.
ISPRS Int. J. Geo-Inf. 2021, 10(7), 439; https://doi.org/10.3390/ijgi10070439
Submission received: 29 April 2021 / Revised: 21 June 2021 / Accepted: 24 June 2021 / Published: 27 June 2021
(This article belongs to the Special Issue GIS in Healthcare)

Abstract

:
The unequal allocation of healthcare resources raises many fundamental problems, one of which is how to address inequity in population health. This paper focuses on disparities in public transport healthcare accessibility, with a special focus on an expanding subway system. Based on a vulnerability index, including factors that are likely to limit healthcare opportunities, a two-step floating catchment area method was used to assess the distribution of supply and demand for healthcare. Quantity, quality, and walking distance accessibility were aggregated into hexagonal grids. The Theil index was used to measure inequity and understand the influence of subways on spatial disparities in healthcare accessibility. The ongoing construction of the subway has heterogeneous impacts on healthcare accessibility for different parts of the city and exacerbates spatial inequity in many areas. In an environment where people in peri-urban areas are excluded from healthcare access because of low subway coverage, the results suggest that the potential for subways to address inaccessibility is limited. The findings highlight the requirement of efficient public transport services and are relevant to researchers, planners, and policymakers aiming to improve accessibility to healthcare, especially for populations who dwell in winter cities.

1. Introduction

Equity matters for every social group because it raises opportunities and supports the rights that should be available to every individual within a population. If equity among the population is high, the society benefits overall [1]. However, many public transport (PT) systems do not provide adequate services for citizens to easily access public resources or to meet complex travel needs. For example, in many cases, low-income subdistricts are more heavily dependent on PT [2], and a simple PT system may not provide adequate access to groups with high service requirements, such as complex journeys [3]. In high demand regions, inadequate PT may limit access to resources and opportunities, making them more susceptible to social and economic marginalization [4,5]. Equity has attracted considerable attention in relation to public resources and urban infrastructure because a mobility gap often exists between PT availability and population demand. This gap has brought to prominence two key research topics addressing the spatial equity of public resources. First, accessibility based on sociodemographic attributes (e.g., age, gender, race, income), which can highlight inequities in individuals’ access to public resources [6,7,8]; and secondly, in response to this, analysis of locations through spatial optimization of both facilities and transport networks [9,10].
Spatial equity analysis focuses on differences in the services used by different regions or social groups from the perspective of supply and demand; and is, to some extent, an extension of the concept of accessibility [11]. Therefore, quantifying spatial accessibility is an important foundation for measuring spatial equity, hence assessing social equity [12,13]. In the field of health and transportation, measuring accessibility plays an important role in comprehensively evaluating the equity of service distribution within a region [14,15]. Wee and Geurs [16] proposed that lack of access to opportunities is the most important indicator of transport-related inequity. Measures of access include both the availability of an activity (such as work, education, shopping, healthcare, or recreation) and the ease of access to the location of the activity from a given origin, usually a residential location. Accessibility is mainly influenced by two factors: the balance of supply and demand relative to origin and destination points, and the suitability for purpose of the transportation network. Urban transportation systems are gradually upgraded, and reconfigured, in response to ongoing rapid urbanization and increasingly complex distributions of urban functions, service resources, and diverse people’s demands. Estimates of accessibility depend on the factors themselves but are also substantially influenced by the choice of accessibility measure. Four measures are commonly used to evaluate place-based accessibility: gravity-based accessibility, cumulative opportunity accessibility, utility-based accessibility, and emerging measures based on real-time individual data [17]. Gravity-based measures utilize a distance/time decay function to normalize the cost of travel between the origin and destination. This approach follows the gravity model’s assumption that the interactions between activities are directly proportional to their size and inversely proportional to the cost of traveling between them [18]; however, the cost decay is uncertain for every group or individual [19]. The cumulative opportunity measure assumes that individuals will utilize the opportunities nearest to them, and more nearby opportunities translate into more choices for individuals. There is no limit to the capacity of these opportunities [20]. However, people often compete for the same opportunities and, in the case of employment, one job can only be taken by a single person. Thus, the assumption that more opportunities will translate to more choices, without considering the potential demand and hence competition for those opportunities, can be misleading [5]. Utility-based measures estimate the value of opportunities based on the assumption that users/consumers of a transport system seek to maximize the utility of their behavioral choices. This is a cross-disciplinary approach utilizing economic, social, land use, and transport data, and is still considered an emerging method that requires substantial research and development [21,22]. The final category is real-time-based accessibility measurements. Influenced by temporal geography, some scholars have researched spatiotemporal accessibility available to individuals, which is expected to accord with social reality [4,23]. They focus on the impact of the scale of public service facilities, transportation mode choices, and real demands on the equity of access to those facilities [10,24,25]. The above four measures have in common either distance/time cost or approach opportunities as indicators. However, accessibility estimation is likely to be influenced by the measurement method, which may limit the assessed access possibilities through limits to distance or accessibility opportunities. In general, commuters are usually concerned about commuting time and distance, which can be measured by gravity-based accessibility. When shopping, consumers are more interested in the variety of goods, their quality, and their prices than by distance [26,27]. In healthcare or education, users are sensitive to the quality of public services in addition to the travel options and costs [28,29,30]. Therefore, discussing accessibility from a single perspective is only a partial solution, and a customized measurement method should be developed for different behavioral activities. Therefore, in this study, we propose measuring accessibility to healthcare services from diverse perspectives, based on citizens’ concerns and interests, and the consequences for social equity.
As important public facilities, a reasonable spatial distribution of healthcare services is influential in people’s livelihood and security. Many studies have demonstrated that poor access to healthcare services contributes to lower levels of service utilization, which in turn leads to poorer health outcomes [31,32,33]. The provision of adequate and equitable healthcare access across the whole population has become a concern for governments and societies [34,35,36]. Public healthcare plays an important role in meeting the health needs of the population, and seniors especially are considered to be among the most vulnerable groups in the population [37]. Although the elderly are the main demand group for healthcare, their overall health status in China is poor. Nearly 180 million elderly people suffer from chronic diseases, and the proportion of those suffering from one or more chronic diseases is as high as 75%. The number of people aged 60 years and over in the city of Shenyang is estimated to have reached 2.019 million by the end of 2020, accounting for 26.52% of the total population. Consequently, it is vital for Shenyang to make provisions for equal access to healthcare services. Especially in winter, large numbers of people in Shenyang (a designated “winter city”) face difficulties walking outdoors, and residents rely on PT for daily travel. Based on data from Shenyang’s comprehensive traffic survey conducted in the downtown area in 2017, 32.8% of all journeys were made by PT. The rapid development of China’s subway systems has provided a new transportation alternative to citizens in winter cities and has additionally helped mitigate multiple urban health and environmental challenges such as congestion, traffic injuries, air pollution, greenhouse emissions, and noise. Owing to its cost and speed advantages, the subway has become the preferred mode of transportation for most residents, especially when individuals seek healthcare alone. While subways have been undergoing revitalization as one of the country’s primary PT modes, inequity in healthcare services has remained a major concern for health planners and policymakers.
We propose an approach for measuring healthcare accessibility from the perspective of subway expansion. We use a vulnerability index and accessibility measures to compare healthcare access equity and so the influence of subway expansion. For this purpose, vulnerability factors that are likely to limit healthcare opportunities have been proposed, including income, recent immigration, population age distribution, and physical conditions. Based on the obtained population vulnerability and healthcare data, the distribution of the supply–demand balance of facilities was visualized using a two-step floating catchment area (2SFCA) method. Furthermore, a comprehensive accessibility measure was used relating quantity, quality, and walking distance in the context of subway upgrading. Finally, the Theil index was used to measure the equity of healthcare resources. The proposed method will provide a more nuanced understanding of spatial disparities in healthcare accessibility, and the results of this empirical study will offer new insights into the ways in which variations in PT influence healthcare accessibility. Officials in the fields of public health and planning can reduce local disparities by designing targeted interventions.

2. Materials and Methods

2.1. Study Area

Shenyang is the capital of Liaoning Province and is an important city in northeastern China. Our study area (Figure 1) includes the central urban area based on the third ring road of Shenyang City (Figure 1c), and incorporates nine districts: Heping, Shenhe, Dadong, Huanggu, Tiexi, Sujiatun, Hunnan, Yuhong, and Shenbei New District, with a total land area of 12,860 km2. The Hun River runs through central Shenyang from east to west and divides the central area into two parts. According to demographic data from the Shenyang Statistics Bureau (2019), the number of permanent residents in Shenyang was 8.32 million in 2019. However, the populations’ requirements for medical care are addressed by a relatively small number of general hospitals, with only 181 in Shenyang’s central urban area. According to Shenyang’s comprehensive traffic survey, which surveyed the pathways used by residents to access social resources such as healthcare services, the majority chose to use PT [38]. The PT system is known as the Shenyang Rail Transit, and included 478 bus lines and four built subway lines at the end of 2020. Its first subway line commenced operation on 27 September 2010, making it the first in northeastern China. By April 2020, there were four lines in operation (metro lines 1, 2, 9, and 10) with 92 stations and 117.06 km of operating distance, covering the central urban area. Subway lines 3 and 4, as well as extensions to lines 1 and 2, are due to be completed by the end of 2025. By then, Shenyang’s main and sub-cities will be connected by the subway network, promoting interaction between subdistricts.

2.2. Data Sources and Preprocessing

Generally, healthcare accessibility at any given location depends on three components: the capacity of the healthcare services (e.g., the number of physicians or beds), the potential demand for healthcare services (i.e., population), and transport network performance (i.e., travel impedance from locations with demand for healthcare services). The data used in this study consisted of three categories: population-based demand, healthcare services, and PT data. Population-demand data were extracted from the Shenyang Statistical Yearbook provided by the Shenyang Bureau of Statistics in 2019 and included data related to social identities (e.g., recent immigrants), health inequalities (e.g., elderly population and mortality), and socioeconomic determinants (e.g., tax revenue). Furthermore, healthcare services data (including geographical locations, hospital rank, and the number of beds) were mainly collected from an online medical service website called 99 Hospital Library (https://yyk.99.com.cn/, accessed on 25 December 2019). The hospitals selected in this study were 181 public general hospitals with high-quality medical services, which are economical and more advanced medical equipment; these hospitals are more likely to be included in the social insurance system than private hospitals, specialized hospitals, and other medical institutions [39]. Considering the limitations of adding large-scale public hospitals for decades, public hospitals in 2019 were selected to investigate accessibility. In addition, data on PT connections between various origins and destinations were derived from the AutoNavi Open Platform (https://lbs. amap.com, accessed on 10 January 2020) by implementing Python-based web crawling technology, and were supplemented by material from the Shenyang Metro website (http://www.symtc.com/, accessed on 15 January 2020). The program used basic information on the 478 bus lines and six subway lines in the central urban city of Shenyang.

2.3. Methodology

2.3.1. Supply and Demand of Subdistricts for Healthcare Services

The vulnerability index, for healthcare facilities, of every subdistrict was calculated using weighted factors, which vary by region. As this study focused on accessibility via PT, the vulnerability index draws on characteristics that increase the likelihood of an individual’s demand for PT. Following the study by Boisjoly et al. [40] and the characteristics of the study area, we selected the following indicators as the relevant variables for the vulnerability index: (i) tax value (I), (ii) number of elderly (U), (iii) number of immigrants (M), and (iv) mortality (N). The final vulnerability index is given by Equation (1), where Z x represents the z-score of the variable X .
V = Z I + Z U + Z M + Z N
Subsequently, the 2SFCA method was used to analyze the supply and demand of healthcare services, which is essentially a summation of the service-to-demand rate at residential locations [41]. The demand–supply ratio R i is given by Equation (2) as follows:
R i = j { d j d 0 } T j = j { d j d 0 } S j k { d i d 0 } V k ,   d 0 = 1.5   km
where V is the vulnerability index at a residential location i that can reach a given service by PT, j denotes a healthcare service, S j represents the capacity of each healthcare service j (number of beds), and d i and d j are the shortest walking distance from residential location i and healthcare service j to a PT station, and d 0 denotes a walking threshold that represents the distance from each residential location or healthcare service to the nearest PT stop. The application of Equation (2) involves two steps: the first step determines T j as the service capacity of each bed, and the second step calculates the summation of the service-to-demand rate for each subdistrict ( R i ). The larger the value, the better the supply relative to the demand.

2.3.2. Accessibility of Population Residential Location to Healthcare Services

As shown in Figure 2, the OD cost matrix and spatial connection in a geographic information system (GIS) were used to evaluate spatial accessibility for citizens in Shenyang to obtain healthcare services that find the best accessibility path from origin to destination in the transport network [42,43,44]. The service radius of PT stations is 0.5–1 km, and walking speed of residents is 4.5–5 km/h [45,46,47,48]. Considering the suburb residents and acceptable distance of 0.5–1.5 km for elderly to PT station in the study area, we used 1.5 km as walking threshold to analyze accessibility using OD cost matrix. Based on the 1.5 km OD’s search radius, we evaluated accessibility from the perspectives of the quantity, quality, and walking distance. Quantity accessibility, A v , refers to the number of healthcare resources that can be accessed by PT from each residential location, which can be divided into none, low, moderate, and high accessibility at equal intervals. However, healthcare equality is a relatively comprehensive concept, which should be evaluated by the number of beds, professional physicians, nurses, and grades; according to China’s healthcare services standards, healthcare conditions such as beds or professional physicians partly represent the scale and quality of medical institutions [49,50]. Therefore, the total number of healthcare beds available to individuals represents the quality accessibility ( A w ), which can be divided into none (0), low (1–100), moderate (100–500), and high (>500) accessibility based on China’s hospital classification standards. Walking to PT stations is the main obstacle for the elderly in using PT services [51]. Hence, walking distance accessibility, A x , can be represented as the total walking distance when taking PT from the origin or destination. Considering the acceptable distance to PT stations and walking speed, walking distance accessibility can be divided into none (>3 km), low (2.5–3 km), moderate (1.5–2.5 km), and high (0–1.5 km). The A v , A w , and A x are given in Equation (3).
Finally, residential location accessibility to hexagonal cells was integrated to minimize orientation bias from edge effects and clearly identify the differences between grids [52,53]. Through experiments, ideal hexagonal diameter was determined to be 1 km, including an average of 2.2 residential locations, thereby providing sufficient accuracy to summarize the results.
A v = i f ( d i , d j ) A w = i S j f ( d i , d j ) f ( d i , d j ) = { 1   i f   d i d o , d j d o 0   e l s e d 0 = 1.5   km A x = d i + d j

2.3.3. Equity Evaluation

To better understand both inter- and intra-regional variations in accessibility, the Theil index was adopted to identify disparities in equity. This index reflects the relationship between demand among the population living in the study area and accessibility using the PT system [54,55]. In general, the degree of relative advantage or disadvantage among groups in a population can be estimated using the Theil index ( T ), which ranges from 0 to 1 (Equation (4)). The larger the T, the greater the difference between regions, suggesting more unbalanced development. According to the equity principle, ideally all citizens in the subdistricts have equal access to healthcare services. Therefore, the ideal for planners is to minimize T :
T = j m V j V t o t · A j A g ¯ · l n ( A j A g ¯ )
where m is the number of subdistricts and their districts, V j is the vulnerability index of group j, V t o t is the sum of the m vulnerability indexes, A j is the accessibility, and A g ¯ represents the average of the A j values in the study area.

3. Results

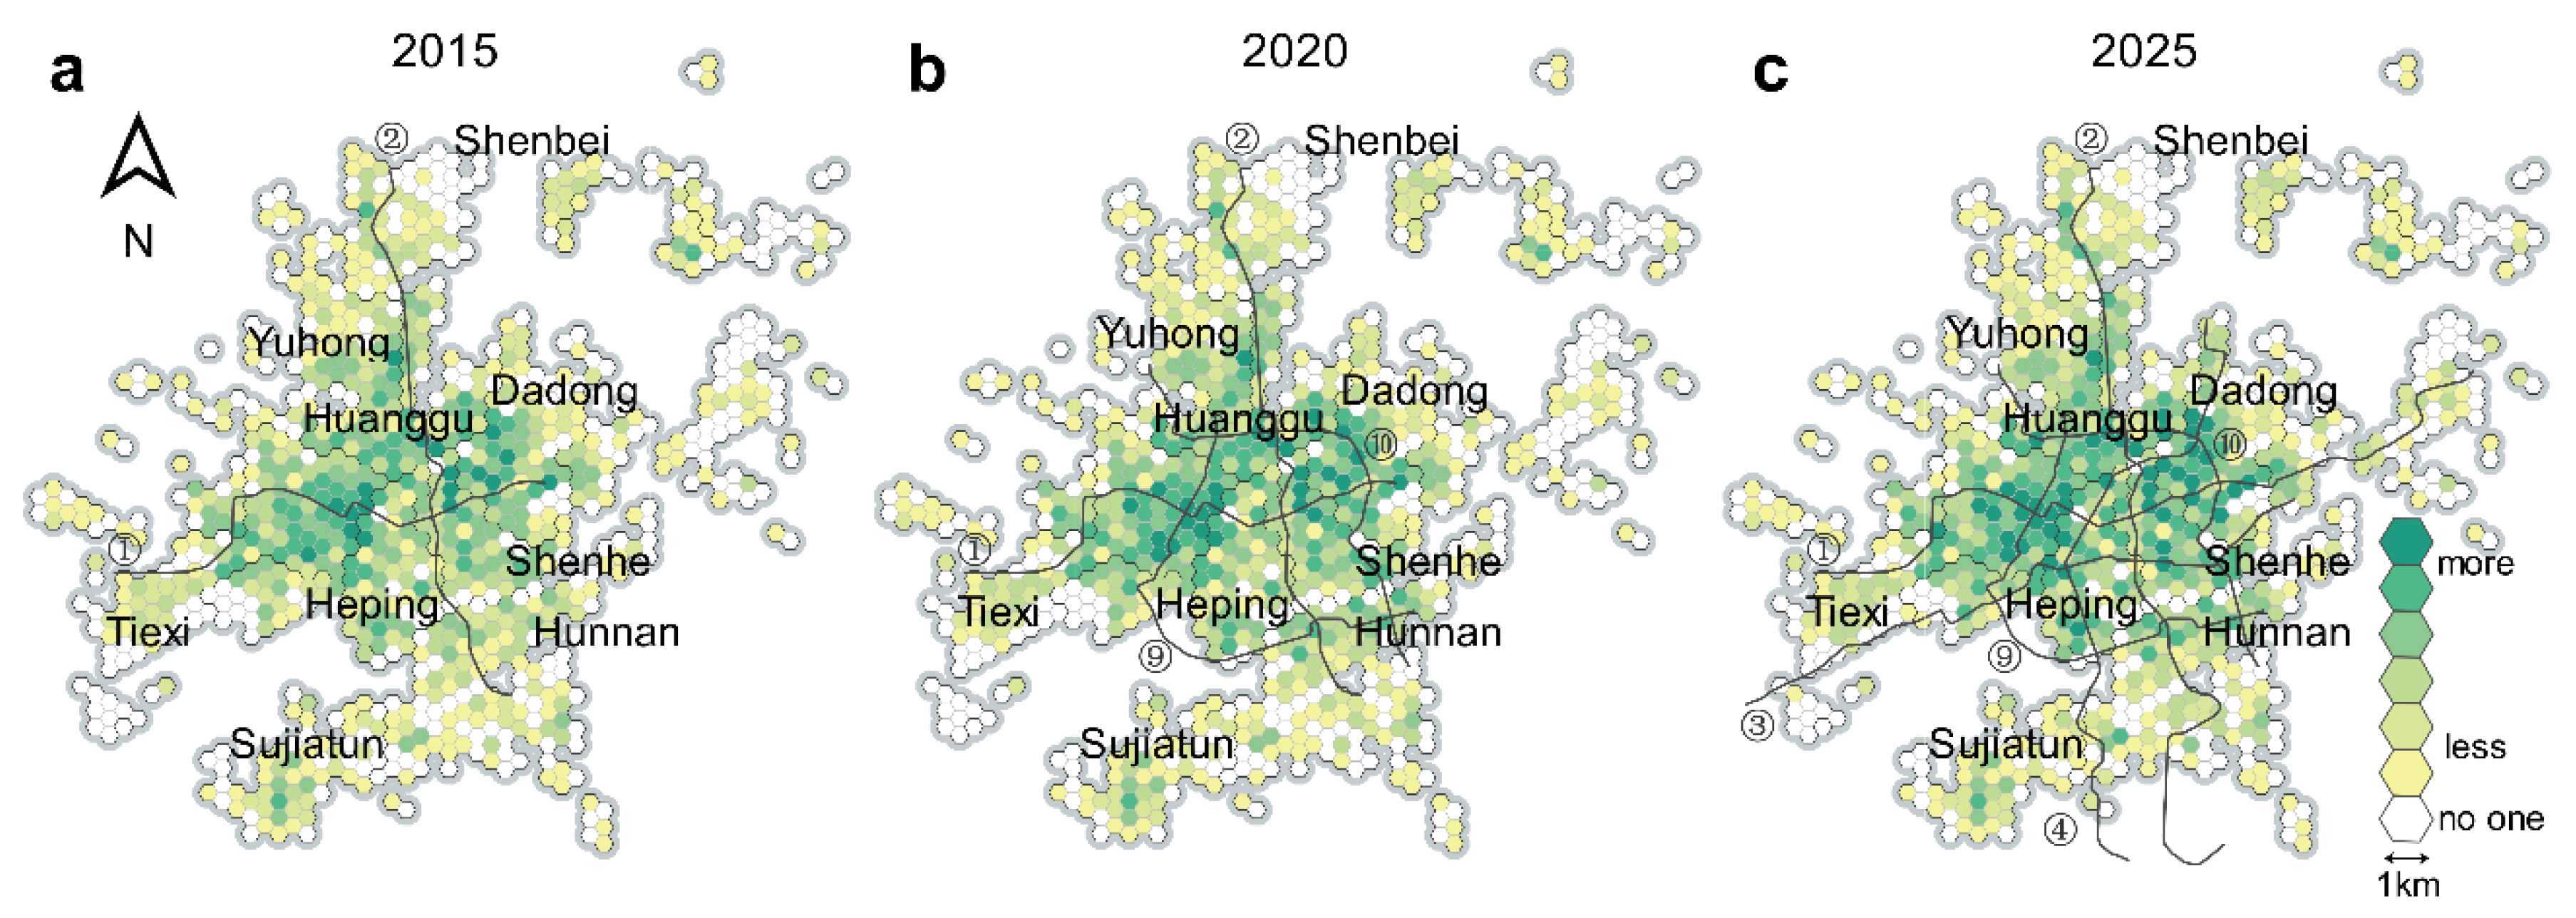
3.1. Spatial Distribution Characteristics of Healthcare Supply and Demand

This section presents the results of the subdistrict supply and demand analysis for the central urban core of Shenyang. Vulnerability indicators were variable across the nine districts (Table 1). The elderly population ranged from approximately 250 thousand in Tiexi District to approximately 76 thousand in Hunnan District. The mortality rate also varied greatly, from 10.34‰ to 6.42‰. Heping District had the highest tax value, followed by Shenhe District. Interestingly, despite having the lowest tax value and the worst economic development level, Yuhong District was the most popular migration option. The high diversity of regions inevitably led to varying needs for PT. Accordingly, this section reviews the distributions of supply and demand for healthcare services in Shenyang.
As shown in Figure 3, there were several subdistricts on the edge of the central core that have the lowest supply–demand ratio. There are very few healthcare services in these areas, posing challenges to residents. On the one hand, these districts have the lowest populations in the region, but their vulnerability index is high relative to their counterparts. On the other hand, PT stations in these regions are sparsely located; therefore, residents find it harder to access healthcare services. Of the subdistricts with high vulnerability for social services, 60.2% showed lower levels of supply and demand despite having considerable geographical advantages and good PT coverage within the central urban area. Residents in the central region had a moderate level of supply–demand ratio, while their need was moderate or low. Finally, subdistricts with a higher supply–demand ratio, including the group with the highest ratio, were mainly in the northeast of the core area, which has an intensive transport network. Accordingly, the state of supply and demand was in disequilibrium in that area, and most subdistricts likely lacked the healthcare resources to match their needs. Hence, it is important to assess whether upgrading of the subway system in this area can improve access and equity.

3.2. Accessibility across the Central Urban Area after Introducing Subways

Although the supply and demand analysis provided insights into the distribution of healthcare sources and PT, it failed to elaborate on how extending subway services affects accessibility. In this section, quantity, quality, and walking distance are calculated to assess the spatial distribution of accessibility, and to compare differences following expansion of the subway.

3.2.1. Quantity Accessibility

As shown in Figure 4, quantity accessibility radially decreased with distance from the city center. However, the highest accessibility was not found in the center, but rather near the surrounding metro transfer stations. In areas influenced by metro lines 9 and 10, quantity accessibility exhibited (Figure 4b) a dual-core distribution centered on metro interchanges (metro lines 1 and 9; metro lines 1 and 10). The construction of new subway extensions is projected to clearly expand the dual-core range (Figure 4c). Zones with moderate quantity accessibility are scattered across the heartland. With subway extension the number of metro transfer stations that surround the periphery increases more obviously in the north (Huanggu and Shenhe Districts) than in the south (Hunnan District). Zones with low accessibility are mainly located outside the metro core area and are minimally influenced by the new subway building.
Quantity accessibility changed over time in every district (Figure 5). Residential locations with high accessibility increased from 13.89% to 32.45% over the study period, and 94.96% of the area showed improved quantity accessibility caused by changes in the subway system. As the subway gradually formed a network, the Tiexi District showed the most notable increase (19.16%) in accessibility. As a result, zones of moderate quantity accessibility were evenly distributed, except in Sujiatun District, which showed a strong change over a decade. The percentage of moderate stage area decreased from 66.64% to 48.08%, and inaccessible zones within each district were reduced by 5.04%.

3.2.2. Quality Accessibility

The spatial distribution of quality accessibility (Figure 6) is similar to quantity accessibility, and the healthcare quality available to residents increases as the subway expands. The healthcare quality in residential areas around metro line 1 is the highest, followed by successive decreases outside the core. Upgrading of the subway expands the highest-quality accessibility zones to the north with metro line 3 and west with metro line 10. Notably, the southern region changes little over the study period, which indicates that the healthcare quality available to the southern population is inadequate. This outcome is likely related to the Hun River obstructing subway construction and the concentration of healthcare services in the heartland.
Quality accessibility occurs in every district following subway upgrades (Figure 7). In particular, Heping and Shenhe Districts were influenced by metro lines 3 and 4. Because of the expanded subway, 6.19% of residential locations improved from low healthcare quality accessibility. In addition, 19.62% of residential locations experienced an increase in quality accessibility from moderate to high; most of these locations are in southern Hunnan and Huanggu Districts and are influenced by metro lines 9 and 10. In the dual-core region, the high-quality range expanded; specifically, 18.47% of residential locations newly achieved high-quality access to over the study period.

3.2.3. Walking Accessibility

As expected, walking accessibility increases dramatically as a result of subway expansion, and residential locations with high walking accessibility generally occurring on both sides of the subway lines (Figure 8). Viewed holistically, the high walking accessibility coverage expanded from the surroundings of metro lines 1 and 2 to the whole enclosed area of old and new metro lines. The addition of lines 9 and 10 clearly reduce walking distances in many districts, apart from Shenbei New District. However, most districts appeared to have been minimally influenced by the construction of lines 3 and 4, although a substantial reduction in walking distance was observed in Heping District (from 2767.37 m to 806.05 m).
Overall, subway extensions increase walking accessibility (Figure 9). Most districts in the center city become highly walkable, with Dadong and Tiexi Districts showing increases owing to metro lines 9 and 10, and Heping District influenced by metro lines 3 and 4. However, much of Sujiatun District was beyond the acceptable walking range. Approximately 31.48% of residential locations showed a rise in high walkability as subway lines were extended, with 13.89% of residential locations being within the convenient walking threshold (≤1 km). Residential locations with moderate walkability only increased by 2.75%; these locations were distributed within the area enclosed by metro lines 1, 3, 9, and 10. Furthermore, 29.19% of residential locations with previously low walkability, which is far beyond the acceptable walking threshold, had improved walkability.

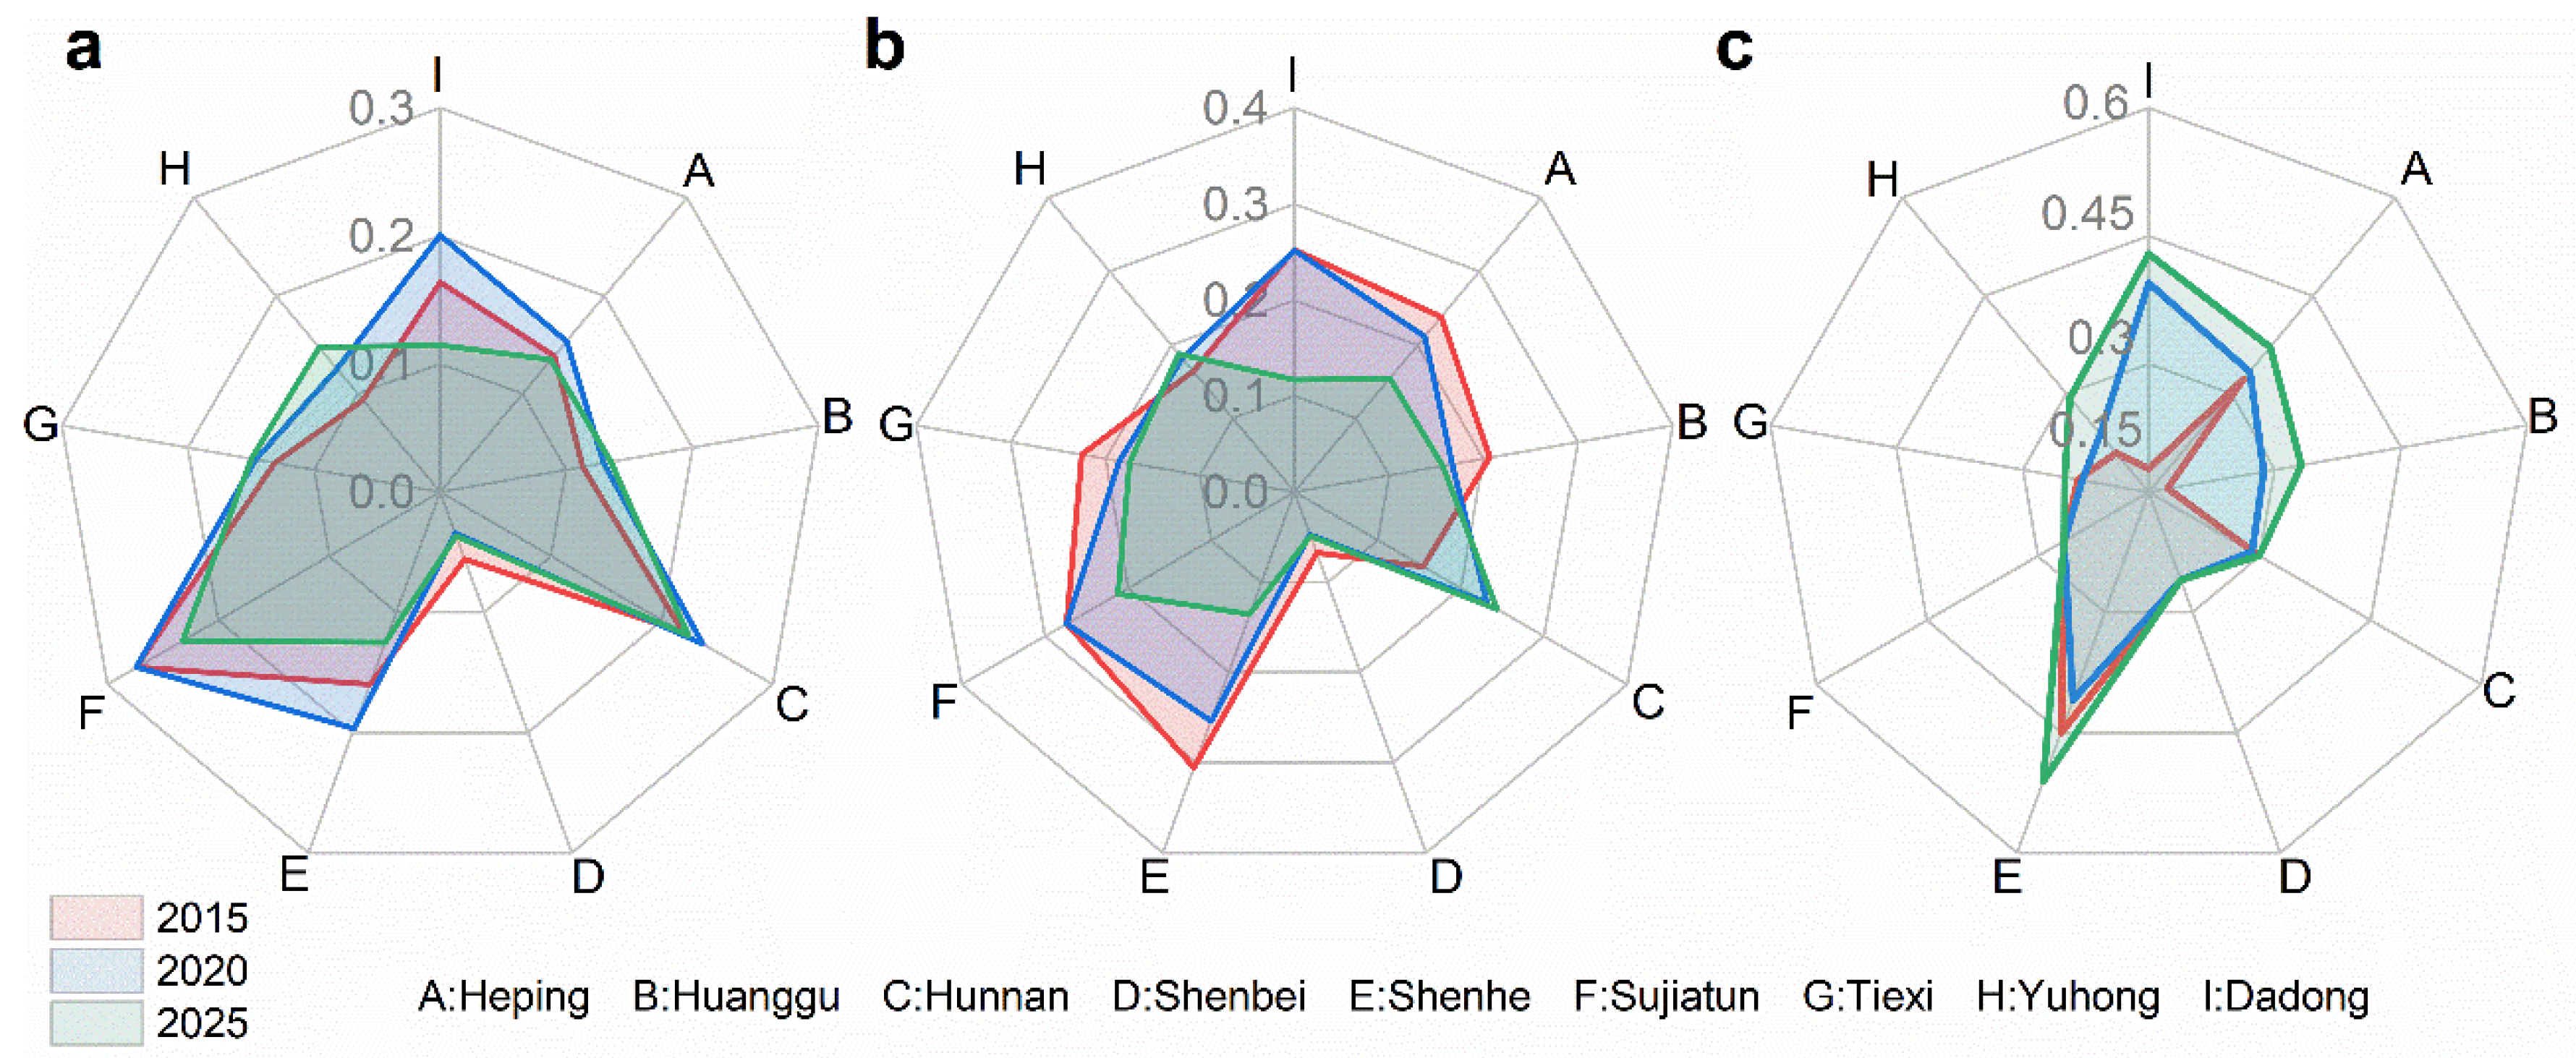
3.3. Equity Changes with Subway Line Extensions

While clear regional differences were observed in the temporal and spatial characteristics of accessibility, it is less easy to estimate equity across subdistricts or districts. The Theil index shows the degree of inequity within regions, based on the vulnerability index and accessibility.

3.3.1. Equity between Subdistricts

Although subway services have increased access to healthcare services in Shenyang, there are two ways in which inequity between regions may change. As shown in Figure 10, the impacts of subway lines 9 and 10 on equity were mixed; these lines increased the equity of quantity accessibility in 39 subdistricts, most of which were located in the extreme north or south of study area (Figure 10a). However, inequity increased for 30 subdistricts in the urban core. Further changes in equity occurred when the subway lines were further extended (Figure 10b). Equity between subdistricts clearly improved within the northeast as a result of extension of subway line 1. In contrast, inequity increased in 50 subdistricts mostly north of the Hun River. Only 12 subdistricts were not affected by building subways, mostly on the periphery.
The influences of subway lines 9 and 10 on equity of access quality were mainly concentrated within the central strip of Shenyang (Figure 10c). Specifically, subway lines 9 and 10 improved equity within 52 subdistricts, with 15 subdistricts located in the heartland having the most obvious improvements. However, 29 subdistricts near the east and west extremes of Shenyang were little influenced by the subway lines in this regard. In addition, there were 17 scattered subdistricts in which the presence of the subway exacerbated the gap in access quality suggesting that building subways is capable exaggerating social inequity (Figure 10d). There were 19 subdistricts far from the subway, where equity in access quality did not change, and only 34 subdistricts showed reduced disparity. Notably, access quality gaps widened within 45 subdistricts largely located in the northwest, which has a high population density and considerable healthcare needs.
Subway lines 9 and 10 reduced equity among subdistricts in terms of walkability. However, they had a positive impact on groups to the north of the Hun River, where the population needs are more diverse than in other areas (Figure 10e). Equity did not change, with subway lines 9 and 10, for 22 subdistricts located mainly in the suburbs and 11 subdistricts in the northwest were unaffected by subway building. There were 31 subdistricts with a large increase in walking distance equity, all of which were near building subways. The remaining 34 subdistricts, however, experienced aggravated walking disparity, with the largest gaps being in urban cores well supplied with PT (Figure 10f).

3.3.2. Equity between Districts

As shown in Figure 11a, the addition of metro lines 9 and 10 increased inequity, as measured by the Theil index, in most districts; the variation was between 0.037 and 0.015 (except for Sujiatun District, which has no subway running through it). Furthermore, the access quantity to healthcare services in 2025 is expected to be more uneven in Yuhong District than in 2015, while the Dadong and Sujiatun Districts are the opposite. The maximum intra-district variation was in Yuhong (0.053), and the district with the least intra-district variation was Shenhe (0.035), which demonstrates that the addition of the subway has a minimal impact on quantity equity. The district with the largest inequity was the Sujiatun District (0.274), followed by Hunnan District (0.219), probably because the periphery of the urban core is sparsely populated.
As shown in Figure 11b, metro lines 9 and 10 had a less effect on equity of healthcare quality (the Theil index declined in most districts). However, building subways can also increase regional inequalities. The difference between the Shenhe (0.305) and Sujiatun Districts (0.274) was greatly increased by the addition of the subway. Metro lines 3 and 4 ensured accessibility improvements while also generally narrowing the gap between vulnerability groups (maximum variation was from 0.305 to 0.135 in Shenhe District). Conversely, the addition of subway services exacerbated the inequity of healthcare quality among subdistricts in Hunnan District (the Theil index changed from 0.155 to 0.244).
Finally, the disparity in overall walking access was remarkably greater than that of the other indexes (the maximum variation was 0.252–Figure 11c). Metro lines 9 and 10 decreased walking inequity in Shenhe District (from 0.451 to 0.409) and Yuhong District (from 0.210 to 0.238). However, the Theil index in the Dadong and Huanggu Districts clearly increased after adding metro lines 9 and 10. In addition, the building subway lines are likely to increase the inequity between subdistricts, suggesting that increases in quantity and quality to healthcare is accompanied by a greater walking disparity.

4. Discussion

Improving equity in access to healthcare resources using PT can potentially improve the well-being of individuals and have implications for the equalization of social resources. This study considers subway expansion in Shenyang, China as a case study to explore the ways in which subway extensions can influence accessibility and equity in healthcare facilities. When people relied on bus lines for access to healthcare resources supply and demand values in the main urban area were generally low and had a vast range. As the underground railway was built, differences in supply and demand for healthcare services were disproportionately influenced by the subway system; these findings are similar to previous research in the same context [28,56]. However, Shenyang’s centralized urban structure, in relation to the locations of healthcare facilities, creates an imbalance for low-income citizens. These conditions are endemic to many cities in China and lead to marked spatial and social health divides that translate into resource inequity and exclusion for citizens [39,57,58]. Low accessibility in peri-urban areas is a clear example, with people in peri-urban areas being excluded from healthcare options owing to the low coverage of subway lines. Our results suggest that subway expansion, on its own, has limited potential to address problems of accessibility, and its effect is only important in regions with dense PT networks. In previous studies, the influences of PT, including subways, on accessibility were multiple. The expected positive effects of PT on service access have been observed in many metropolitan areas [59]. Although PT plays a role in areas far from healthcare services along metro lines and bus routes, in some areas it may not increase access to healthcare services as much as previously thought [60,61]. Therefore, we analyzed accessibility to healthcare facilities, as a consequence of subway extension, to investigate the system’s impact.
Sociodemographic diversity in each region has led to a focus on access to healthcare services. For example, in areas with a low population density and a long distance from healthcare services, people are concerned about both the walking distance to healthcare services as well as quality of the accessible services. With the addition of metro lines 9 and 10, walking distance and quality in Hunnan District clearly improved. In areas with inadequate healthcare services and unmet population needs, quantity accessibility (limited choices) is a key problem (Huanggu District). Tiexi and Shenhe Districts, which have large elderly populations, also have the highest density of healthcare services; however, the elderly have reduced walking capability. Therefore, the subway system must effectively improve walking access for areas with large elderly populations.
We suggest that analysis of the influence of a subway on healthcare accessibility should follow periods of subway extension, as well as focusing on various equities for sociodemographic diversity. Regions with unique locational advantages and highly developed transportation networks generally do not have excessive disparities in access quantity, quality, or walking distance, and typically have higher overall equalization [49,62]. However, costs are higher in areas that are far from urban centers and have larger rural populations, as these areas typically have low economic development levels and are far from hospitals [61,63]. These areas often face extreme inequalities. Therefore, the pursuit of equity in access quality is the primary requirement for such areas under limited conditions. However, the subway system has exacerbated the access quantity and quality inequalities in certain locations, such as Hunnan District, indicating that extension of a subway system does not necessarily improve social resource equity, including healthcare. The analysis confirms that, as with road infrastructure, a disproportionate concentration on high accessibility may lead to spatial inequity in transportation, as suggested by earlier studies. This explains how equity of opportunity can be influenced by the existence of PT [17,40]. Therefore, bridging gaps in healthcare access requires more than just a subway as a mode of transportation, and PT becomes a non-obvious option to obtain the necessary access to medical assistance.
This study focused on improving the delivery of healthcare services by PT and reducing disparities; these are two key goals for planners and policymakers. On the one hand, solutions should address spatial variations in accessibility. Specifically, policies should be introduced to increase the supply capacity of healthcare services by building additional hospitals and encouraging the hiring of more doctors and nurses in suburban areas with high demand. Moreover, planning departments should introduce new PT options in these areas, as they can lead to shorter travel times for citizens when accessing healthcare services. On the other hand, targeted suggestions based on specific needs arising from population diversity should be considered by health authorities. For example, increasing geriatric hospitals in areas with high elderly needs, or new and appropriate hospital departments, may alleviate the imbalance between supply and demand. Further, planners and policymakers should be aware of the impact of subway systems on healthcare equity. Awareness of temporal variations in healthcare accessibility, using diverse measures, during PT system development gives planners and policymakers greater insight into accessibility issues. Each location can have a profile of healthcare demand and supply, hence, specific problems that require specific solutions.
It is important to acknowledge the limitations of this study, which we hope to address in the future. First, the mode of transportation used in this study was PT. Despite Shenyang’s cold climate, citizens can also drive and walk for movement. Thus, the results may not completely reflect the real healthcare accessibility conditions. All available modes of travel should be considered. Second, healthcare services and population demand have changed in a decade, which should be taken into consideration. Finally, the situations in which healthcare services may be sought was incomplete; we only considered cases in which people seek healthcare services on their own. Although this is a high proportion of cases, emergency medical services should also be considered. Enrichment of the analysis to include other modes of transport and modes of hospitalization is the next step in future studies.

5. Conclusions

This study comprehensively examined spatial accessibility and equality in healthcare services in the central region of Shenyang, following an extension of its subway network. A vulnerability index was calculated to indicate the required conditions for sufficient access to healthcare services. Citizen accessibility and equity was further assessed in terms of quantity, quality, and walking distance. These factors were compared over a period of subway extensions. The results showed that upgrading the subway had spatially heterogeneous impacts on healthcare accessibility, especially walking accessibility. Construction of the subway also exacerbated spatial inequity in healthcare accessibility. There are multiple influences on the equity of proximity to healthcare services. The issues identified can be largely explained by a lack of healthcare services in the urban peripheries and by high disequilibrium in the PT network in the inner city. This reflects the suburbanization of poverty that many cities around the world have been experiencing.

Author Contributions

Conceptualization, Maohua Liu and Xishihui Du; methodology, Xishihui Du; software, Maohua Liu; resources, Maohua Liu; writing—original draft preparation, Siqi Luo; writing—review and editing, Xishihui Du and Siqi Luo; visualization, Siqi Luo; supervision, Maohua Liu. All authors have read and agreed to the published version of the manuscript.

Funding

This work was supported by the Social Science Planning Fund of Liaoning Province under Grant number L19CSH001.

Institutional Review Board Statement

Not applicable.

Informed Consent Statement

Not applicable.

Data Availability Statement

The data presented in this study are available on request from the corresponding author.

Acknowledgments

The authors acknowledge the contribution of all the anonymous reviewers that improved the quality of the paper.

Conflicts of Interest

The authors declare no conflict of interest.

References

  1. Rekha, R.S.; Wajid, S.; Radhakrishnan, N.; Mathew, S. Accessibility Analysis of Health care facility using Geospatial Techniques. Transp. Res. Procedia 2017, 27, 1163–1170. [Google Scholar] [CrossRef]
  2. Sanchez, T.W. Equity Analysis of Personal Transportation System Benefits. J. Urban Aff. 1998, 20, 69–86. [Google Scholar] [CrossRef]
  3. Borrell, L.N.; Talih, M. A symmetrized Theil index measure of health disparities: An example using dental caries in U.S. children and adolescents. Stat. Med. 2011, 30, 277–290. [Google Scholar] [CrossRef] [Green Version]
  4. Kain, J.F.; Meyer, J.R. Transportation and Poverty. The 100; ERIC: Online, 1970. [Google Scholar]
  5. Sun, Z.; Zacharias, J. Transport equity as relative accessibility in a megacity: Beijing. Transp. Policy 2020, 92, 8–19. [Google Scholar] [CrossRef]
  6. Mouter, N.; van Cranenburgh, S.; van Wee, B. An empirical assessment of Dutch citizens’ preferences for spatial equality in the context of a national transport investment plan. J. Transp. Geogr. 2017, 60, 217–230. [Google Scholar] [CrossRef] [Green Version]
  7. Pereira, R.H. Future accessibility impacts of transport policy scenarios: Equity and sensitivity to travel time thresholds for Bus Rapid Transit expansion in Rio de Janeiro. J. Transp. Geogr. 2019, 74, 321–332. [Google Scholar] [CrossRef] [Green Version]
  8. Rong, P.; Zheng, Z.; Kwan, M.-P.; Qin, Y. Evaluation of the spatial equity of medical facilities based on improved potential model and map service API: A case study in Zhengzhou, China. Appl. Geogr. 2020, 119, 102192. [Google Scholar] [CrossRef]
  9. Wang, C.-H.; Chen, N. A geographically weighted regression approach to investigating the spatially varied built-environment effects on community opportunity. J. Transp. Geogr. 2017, 62, 136–147. [Google Scholar] [CrossRef]
  10. Shin, K.; Lee, T. Improving the measurement of the Korean emergency medical System’s spatial accessibility. Appl. Geogr. 2018, 100, 30–38. [Google Scholar] [CrossRef]
  11. Siegel, M.; Koller, D.; Vogt, V.; Sundmacher, L. Developing a composite index of spatial accessibility across different health care sectors: A German example. Health Policy 2016, 120, 205–212. [Google Scholar] [CrossRef]
  12. Foster, A.; Dunham, I.M. Volunteered geographic information, urban forests, & environmental justice. Comput. Environ. Urban Syst. 2015, 53, 65–75. [Google Scholar] [CrossRef]
  13. Schultz, C.L.; Stanis, S.A.W.; Sayers, S.P.; Thombs, L.A.; Thomas, I.M. A longitudinal examination of improved access on park use and physical activity in a low-income and majority African American neighborhood park. Prev. Med. 2017, 95, S95–S100. [Google Scholar] [CrossRef]
  14. El-Geneidy, A.; Levinson, D.; Diab, E.; Boisjoly, G.; Verbich, D.; Loong, C. The cost of equity: Assessing transit accessibility and social disparity using total travel cost. Transp. Res. Part A Policy Pract. 2016, 91, 302–316. [Google Scholar] [CrossRef] [Green Version]
  15. Foth, N.; Manaugh, K.; El-Geneidy, A.M. Towards equitable transit: Examining transit accessibility and social need in Toronto, Canada, 1996–2006. J. Transp. Geogr. 2013, 29, 1–10. [Google Scholar] [CrossRef]
  16. Wee, G.; Geurs, K. Discussing Equity and Social Exclusion in Accessibility Evaluations. Eur. J. Transp. Infrastruct. Res. 2011, 11. [Google Scholar] [CrossRef]
  17. Deboosere, R.; El-Geneidy, A. Evaluating equity and accessibility to jobs by public transport across Canada. J. Transp. Geogr. 2018, 73, 54–63. [Google Scholar] [CrossRef]
  18. Hansen, W.G. How Accessibility Shapes Land Use. J. Am. Inst. Planners 1959, 25, 73–76. [Google Scholar] [CrossRef]
  19. Luo, W.; Wang, F. Measures of Spatial Accessibility to Health Care in a GIS Environment: Synthesis and a Case Study in the Chicago Region. Environ. Plan. B Plan. Des. 2003, 30, 865–884. [Google Scholar] [CrossRef] [Green Version]
  20. Shen, Q. Location characteristics of inner-city neighborhoods and employment accessibility of low-wage workers. Environ. Plan. B Plan. Des. 1998, 25, 345–365. [Google Scholar] [CrossRef]
  21. Curtis, C.; Scheurer, J. Planning for sustainable accessibility: Developing tools to aid discussion and decision-making. Prog. Plan. 2010, 74, 53–106. [Google Scholar] [CrossRef]
  22. Geurs, K.T.; van Eck, J.R. Accessibility measures: Review and applications. In Evaluation of Accessibility Impacts of Land-Use Transportation Scenarios, and Related Social and Economic Impact; RIVM: Bilthoven, The Netherlands, 2011. [Google Scholar]
  23. Kwan, M.-P.; Murray, A.T.; O’Kelly, M.E.; Tiefelsdorf, M. Recent advances in accessibility research: Representation, methodology and applications. J. Geogr. Syst. 2003, 5, 129–138. [Google Scholar] [CrossRef]
  24. Neutens, T. Accessibility, equity and health care: Review and research directions for transport geographers. J. Transp. Geogr. 2015, 43, 14–27. [Google Scholar] [CrossRef]
  25. Xia, N.; Cheng, L.; Chen, S.; Wei, X.; Zong, W.; Li, M. Accessibility based on Gravity-Radiation model and Google Maps API: A case study in Australia. J. Transp. Geogr. 2018, 72, 178–190. [Google Scholar] [CrossRef]
  26. Niedzielski, M.A.; Kucharski, R. Impact of commuting, time budgets, and activity durations on modal disparity in accessibility to supermarkets. Transp. Res. Part D Transp. Environ. 2019, 75, 106–120. [Google Scholar] [CrossRef]
  27. Widener, M.J.; Farber, S.; Neutens, T.; Horner, M. Spatiotemporal accessibility to supermarkets using public transit: An interaction potential approach in Cincinnati, Ohio. J. Transp. Geogr. 2015, 42, 72–83. [Google Scholar] [CrossRef] [Green Version]
  28. Herskovic, L. The Effect of Subway Access on School Choice. Econ. Educ. Rev. 2020, 78, 102021. [Google Scholar] [CrossRef]
  29. Islam, M.S.; Asktar, S. Measuring physical accessiblity to health facilities: A case study on Khunla City. World Health Popul. 2011, 12, 123–127. [Google Scholar] [CrossRef]
  30. Perry, B.; Gesler, W. Physical access to primary health care in Andean Bolivia. Soc. Sci. Med. 2000, 50, 1177–1188. [Google Scholar] [CrossRef]
  31. Dai, D. Black residential segregation, disparities in spatial access to health care facilities, and late-stage breast cancer diagnosis in metropolitan Detroit. Health Place 2010, 16, 1038–1052. [Google Scholar] [CrossRef] [PubMed]
  32. Hiscock, R.; Pearce, J.; Blakely, T.; Witten, K. Is Neighborhood Access to Health Care Provision Associated with Individual-Level Utilization and Satisfaction? Health Serv. Res. 2008, 43, 2183–2200. [Google Scholar] [CrossRef] [Green Version]
  33. Wan, N.; Zhan, F.B.; Zou, B.; Wilson, J.G. Spatial Access to Health Care Services and Disparities in Colorectal Cancer Stage at Diagnosis in Texas. Prof. Geogr. 2013, 65, 527–541. [Google Scholar] [CrossRef]
  34. McGrail, M.R.; Humphreys, J.S. Measuring spatial accessibility to primary health care services: Utilising dynamic catchment sizes. Appl. Geogr. 2014, 54, 182–188. [Google Scholar] [CrossRef]
  35. Wang, F. Measurement, Optimization, and Impact of Health Care Accessibility: A Methodological Review. Ann. Assoc. Am. Geogr. 2012, 102, 1104–1112. [Google Scholar] [CrossRef] [PubMed] [Green Version]
  36. Mansour, S. Spatial analysis of public health facilities in Riyadh Governorate, Saudi Arabia: A GIS-based study to assess geographic variations of service provision and accessibility. Geo-Spat. Inf. Sci. 2016, 19, 26–38. [Google Scholar] [CrossRef]
  37. Chang, H.-T.; Lai, H.-Y.; Hwang, I.-H.; Ho, M.-M.; Hwang, S.-J. Home healthcare services in Taiwan: A nationwide study among the older population. BMC Health Serv. Res. 2010, 10, 274. [Google Scholar] [CrossRef] [Green Version]
  38. Wang, Y.; Cao, M.; Liu, Y.; Ye, R.; Gao, X.; Ma, L. Public transport equity in Shenyang: Using structural equation modelling. Res. Transp. Bus. Manag. 2020, 100555. [Google Scholar] [CrossRef]
  39. Chen, G.; Wang, C.C.; Jin, P.; Xia, B.; Xiao, L.; Chen, S.; Luo, J. Evaluation of healthcare inequity for older adults: A spatio-temporal perspective. J. Transp. Health 2020, 19, 100911. [Google Scholar] [CrossRef]
  40. Boisjoly, G.; Deboosere, R.; Wasfi, R.; Orpana, H.; Manaugh, K.; Buliung, R.; El-Geneidy, A. Measuring accessibility to hospitals by public transport: An assessment of eight Canadian metropolitan regions. J. Transp. Health 2020, 18, 100916. [Google Scholar] [CrossRef]
  41. Rao, Y.; Lin, G. Rationality of the Geographical Distributio of Urban Education Resources from the Perspective of Balancing Supply and Demand: A Case Study of Wuhan City. J. South-Central Univ. Natl. Soc. Sci. 2021, 41, 147–152. (In Chinese) [Google Scholar]
  42. Giuliano, G.; Kang, S. Spatial dynamics of the logistics industry: Evidence from California. J. Transp. Geogr. 2018, 66, 248–258. [Google Scholar] [CrossRef]
  43. Hickman, R. Cultural perspectives on transport, urban planning and design. J. Transp. Geogr. 2017, 63, 50–52. [Google Scholar] [CrossRef]
  44. Sukaryavichute, E.; Prytherch, D.L. Transit planning, access, and justice: Evolving visions of bus rapid transit and the Chicago street. J. Transp. Geogr. 2018, 69, 58–72. [Google Scholar] [CrossRef]
  45. Duan, M.; Hang, Z.; Long, L.; Ou, R. The evaluation of allocation fairness to urban transit system service to elderly in mountainous city. J. Geo-inf. Sci. 2021, 23, 617–631. (In Chinese) [Google Scholar] [CrossRef]
  46. Jiang, H.; Zhang, W.; Wei, S. Public service facility accessibility as influenced by public transportation in Beijing. Prog. Geogr. 2017, 36, 1239–1249. (In Chinese) [Google Scholar] [CrossRef] [Green Version]
  47. Luo, X.; Yue, B.; Lin, A. The research of accessibility and fairness of pension service facilities based on multiple modes of transportation-a case study of Wuhan. J. Cent. China Norm. Univ. Sci. 2018, 52, 883–893. (In Chinese) [Google Scholar]
  48. Li, M.; Long, Y. The Coverage Ratio of Bus Stations and an Evaluation of Spatial Patterns of Major Chinese Cities. Urban Plan. Forum 2015, 6, 30–37. (In Chinese) [Google Scholar]
  49. Chen, B.Y.; Cheng, X.-P.; Kwan, M.-P.; Schwanen, T. Evaluating spatial accessibility to healthcare services under travel time uncertainty: A reliability-based floating catchment area approach. J. Transp. Geogr. 2020, 87, 102794. [Google Scholar] [CrossRef]
  50. Luo, J.; Chen, G.; Li, C.; Xia, B.; Sun, X.; Chen, S. Use of an E2SFCA Method to Measure and Analyse Spatial Accessibility to Medical Services for Elderly People in Wuhan, China. Int. J. Environ. Res. Public Health 2018, 15, 1503. [Google Scholar] [CrossRef] [Green Version]
  51. Hess, D.B. Walking to the bus: Perceived versus actual walking distance to bus stops for older adults. Transportation 2011, 39, 247–266. [Google Scholar] [CrossRef]
  52. Kang, J.-Y.; Michels, A.; Lyu, F.; Wang, S.; Agbodo, N.; Freeman, V.L.; Wang, S. Rapidly measuring spatial accessibility of COVID-19 healthcare resources: A case study of Illinois, USA. Int. J. Health Geogr. 2020, 19, 1–17. [Google Scholar] [CrossRef] [PubMed]
  53. Jue, W.; Mei-Po, K. Hexagon-Based Adaptive Crystal Growth Voronoi Diagrams Based on Weighted Planes for Service Area Delimitation. Isprs Int. J. Geo. Inf. 2018, 7, 257. [Google Scholar]
  54. Caggiani, L.; Colovic, A.; Ottomanelli, M. An equality-based model for bike-sharing stations location in bicycle-public transport multimodal mobility. Transp. Res. Part A Policy Pract. 2020, 140, 251–265. [Google Scholar] [CrossRef]
  55. Theil, H. Economics and Information Theory; North-Holland: Amsterdam, The Netherlands, 1967. [Google Scholar]
  56. Liu, X.; Macedo, J.; Zhou, T.; Shen, L.; Liao, Y.; Zhou, Y. Evaluation of the utility efficiency of subway stations based on spatial information from public social media. Habitat Int. 2018, 79, 10–17. [Google Scholar] [CrossRef]
  57. Wang, Y.; Li, Y.; Qin, S.; Kong, Y.; Yu, X.; Guo, K.; Meng, J. The disequilibrium in the distribution of the primary health workforce among eight economic regions and between rural and urban areas in China. Int. J. Equity Health 2020, 19, 1–10. [Google Scholar] [CrossRef] [PubMed] [Green Version]
  58. Yin, C.; He, Q.; Liu, Y.; Chen, W.; Gao, Y. Inequality of public health and its role in spatial accessibility to medical facilities in China. Appl. Geogr. 2018, 92, 50–62. [Google Scholar] [CrossRef]
  59. Ahn, K.; Jang, H.; Song, Y. Economic impacts of being close to subway networks: A case study of Korean metropolitan areas. Res. Transp. Econ. 2020, 83, 100900. [Google Scholar] [CrossRef]
  60. Zhou, Q.; Dai, D.; Wang, Y.; Fan, J. Decade-Long Changes in Disparity and Distribution of Transit Opportunity in Shenzhen China: A Transportation Equity Perspective. J. Adv. Transp. 2018, 1–16. [Google Scholar] [CrossRef] [Green Version]
  61. Qian, T.; Chen, J.; Li, A.; Ang, L.; Shen, D. Evaluating Spatial Accessibility to General Hospitals with Navigation and Social Media Location Data: A Case Study in Nanjing. Int. J. Environ. Res. Public Health 2020, 17, 2752. [Google Scholar] [CrossRef]
  62. Yohan, F.; Delphine, P.; Béatrice, F.; Isabelle, R.-C.; Jean-Yves, B.; Françoise, D.; Guy, F.; Elodie, F. Beyond the map: Evidencing the spatial dimension of health inequalities. Int. J. Health Geogr 2020, 19, 46. [Google Scholar]
  63. Subal, J.; Paal, P.; Krisp, J.M. Quantifying spatial accessibility of general practitioners by applying a modified huff three-step floating catchment area (MH3SFCA) method. Int. J. Health Geogr. 2021, 20, 1–14. [Google Scholar] [CrossRef]
Figure 1. Spatial context of the central urban core of Shenyang: (a) location of Shenyang in China; (b) administrative boundaries in Shenyang; (c) overview of the study area.
Ijgi 10 00439 g001
Figure 2. Schematic diagram of measurement of spatial accessibility to healthcare services: (a) measure spatial accessibility; (b) the accessibility of residential location i; (c) aggregate accessibility measure.
Ijgi 10 00439 g002
Figure 3. Spatial distribution of supply–demand to healthcare services in the main urban area of Shenyang.
Ijgi 10 00439 g003
Figure 4. Spatial quantity accessibility to healthcare services at different stages of subway system development: (a) accessibility in 2015; (b) accessibility in 2020; (c) accessibility in 2025.
Ijgi 10 00439 g004
Figure 5. Spatial changes in residential zones with quantity accessibility ranking.
Ijgi 10 00439 g005
Figure 6. Spatial quality accessibility to healthcare services at different stages of subway system development: (a) accessibility in 2015; (b) accessibility in 2020; (c) accessibility in 2025.
Ijgi 10 00439 g006
Figure 7. Spatial changes in residential zones with quality accessibility ranking.
Ijgi 10 00439 g007
Figure 8. Spatial walking accessibility to healthcare services at different stages of subway system development: (a) accessibility in 2015; (b) accessibility in 2020; (c) accessibility in 2025.
Ijgi 10 00439 g008
Figure 9. Spatial changes in residential zones with walking accessibility ranking.
Ijgi 10 00439 g009
Figure 10. Variations in equity of accessibility to healthcare services during development of subway system: (a) changes in equity of access quantity after introduction of metro lines 9 and 10; (b) changes in equity of access quantity after introducing metro lines 3, 4, and extension lines; (c) changes in equity of access quality after introducing metro lines 9 and 10; (d) changes in equity of access quality after introducing metro lines 3, 4, and extension lines; (e) changes in equity of walking access after introducing metro lines 9 and 10; (f) changes in equity of walking access after introducing metro lines 3, 4, and extension lines.
Ijgi 10 00439 g010
Figure 11. Comparison of equity of healthcare services through development of subway system: (a) the Theil index of quantity; (b) the Theil index of quality; (c) the Theil index of walking distance.
Ijgi 10 00439 g011
Table 1. List of vulnerability factors and vulnerability index in each district.
DistrictTax Value
(10,000)
Number of the Elderly
(10,000)
Number of Arrivals
(10,000)
Mortality Rate
(‰)
Vulnerability Index
Heping77,09217.932.038.33146.70
Shenhe67,90020.311.119.37169.10
Dadong29,08318.970.7410.34129.84
Huanggu27,02221.721.658.97197.85
Tiexi44,55225.151.749.82269.21
Sujiatun12,87211.100.369.4219.57
Hunnan35,5977.662.376.42116.46
Yuhong849810.212.257.9390.50
Shenbei90937.830.819.0441.37
Publisher’s Note: MDPI stays neutral with regard to jurisdictional claims in published maps and institutional affiliations.

