Article

Global Contraction and Local Strengthening of Firms’ Supply and Sales Logistics Networks in the Context of COVID-19: Evidence from the Development Zones in Weifang, China

School of Architecture, Southeast University, Nanjing 210096, China
*
Author to whom correspondence should be addressed.
ISPRS Int. J. Geo-Inf. 2021, 10(7), 477; https://doi.org/10.3390/ijgi10070477
Submission received: 23 May 2021 / Revised: 1 July 2021 / Accepted: 8 July 2021 / Published: 11 July 2021

Abstract

:
The stagnation of multinational and cross-regional goods circulation has created significant disruptions to manufacturing supply chains due to the outbreak of the COVID-19 pandemic. To explore the impact of COVID-19 on the circulation of manufacturing industry products at different geographical scales, we drew upon a case study of development zones in the city of Weifang in China to analyze the characteristics of firms’ logistics networks in these development zones, and how these characteristics have changed since the outbreak of the COVID-19 pandemic. The data used in this study were collected from fieldwork conducted between 26 August 2020 and 15 October 2020, and included the supply originations of firms’ manufacturing sources and the sales destinations of their goods. We chose the two-mode network analysis method as our study methodology, which separates the logistics networks into supply networks and sales networks. The results show the following: First, the overall structure of firms’ logistics networks in Weifang’s development zones is characterized by localization. In the context of the COVID-19 pandemic, the local network links have further strengthened, whereas the global links have seriously declined. Moreover, the average path length of both the supply and sales logistics networks has slightly decreased, indicating the increased connectivity of the logistics networks. Second, in terms of the network node centrality, the core nodes of the supply logistics networks are the development zones and the city in which the firms are located, whereas the core nodes of the sales logistics networks are the core companies in the development zones. However, since the outbreak of the COVID-19 pandemic, the centrality of supply originations and sales destinations at the local scale has increased, whereas the centrality of supply originations and sales destinations at the global scale has decreased significantly. Third, the influencing factors of such changes include controlling personnel and goods circulation based on national boundaries and administrative boundaries, forcing the logistics networks in the development zones to shrink to the local scale. Moreover, there are differences in the scope of spatial contraction between supply logistics networks and the sales logistics networks.

1. Introduction

1.1. Background

With the rapid development of economic globalization, goods circulation across the world has been gradually strengthened since the 1980s. Meanwhile, with the increasingly fierce market competition, the profit space of the production and operation of enterprises is shrinking, forcing enterprises to shift profit space towards logistics, which is often referred to as the “third-party profit headspring” [1]. The concept of “just-in-time logistics”, which can reduce inventory and increase the turnover of goods, has gradually emerged and received attention. However, due to the outbreak of COVID-19, the amount of international trade barriers continues to increase [2], and the lockdown measures adopted by many countries have resulted in the stagnation of product manufacturing and logistics [3,4] and a dramatic impact on the international circulation of goods [5]. The outbreak of COVID-19 has caused an increase in logistical costs [6], closure of production facilities [4], and sensitivity of supply chain logistics to distance [6]. Therefore, research on logistics networks from a spatial perspective has become increasingly important.
Specifically, the Chinese market has also experienced a significant impact on goods circulation and product supply, characterized by a sharp decline in the throughput of foreign trade ports and the growth of national freight volume (Appendix A, item 1). By implementing anti-epidemic measures, China has gradually controlled the nationwide spread of COVID-19, and has taken the lead in manufacturing recovery [7]. In this recovery process, the overall recovery of the supply chain plays an important role, and the logistics network is an essential component of manufacturing supply chains [8]. In the context of COVID-19, the adaptability and changing characteristics in regional manufacturing supply chains during the global public health crisis have attracted significant attention from policymakers and scholars, and the experience of China’s local manufacturing supply chain recovery needs to be studied and summarized. In this paper, we discuss the characteristics of local manufacturing supply chain changes and policy recommendations from the perspective of logistics networks, by investigating the development zones in Weifang—a prefecture-level city in China’s Shandong Province. This study could be of practical significance for the recovery of local industries in the post-pandemic era for other countries.

1.2. Literature Review

Logistics is essentially driven by the relationship between “space” and “flow” [9], and is a key element of geographic research as a component of “flow space”. Hanson [10] and Hoyle [11] were the first to consider the impact of logistics in their treatises on transportation geography. O’Kelly proposed a spatial system comprising three levels of logistics networks based on a spatial hub–spoke network organization structure [12]. Research on production networks and distribution systems has gradually emerged since the 1990s, mainly including research on logistics and distribution from the perspective of geographical locations [13,14], the system of model-based optimization of logistics networks [15,16,17], and distribution center layout in different logistics models [18]. In recent years, researchers have increasingly focused on logistics networks based on air, sea, and other modes of cargo circulation, with studies having been conducted regarding the spatial structure and vulnerability of transnational shipping networks [19], network centrality [20,21], air cargo networks, and the main driving forces [22] and structural changes [23] of logistics networks. Many scholars have also conducted studies on the hierarchical structure and distribution pattern of Chinese cities [24], as well as the spatial structure of urban networks from the perspective of railway and air passenger flows [25].
Two paradigms are commonly used to study logistics networks under the influence of public crises: empirical research, and model simulation. The empirical research is mainly based on network dimensions such as trade networks and production networks, which are not exactly equivalent to logistics networks, but involve goods circulation. For example, Yukiko studied the causes, mechanisms, and effects resulting from the Great East Japan Earthquake through interfirm transaction networks [26]; Ando and Kimura studied the changes to transnational production networks in Japan based on the global financial crisis and Great East Japan Earthquake [27]; Obashi studied the resilience of the production networks in Asia during a financial crisis [28]; and Fang et al. studied the shipping network under the influence of international events such as military conflicts, lifting of economic sanctions, and government elections [29]. The model simulation paradigm mainly focuses on the design and robustness optimization of logistics networks during earthquakes and other means of facility disruption [30,31,32,33].
Studies investigating factors that impact logistic networks have focused on different geographical scales and multiple logistics methods. Research on the international scale can be summarized as concerning economic and political factors. Economic factors include market demand and prices, production costs, transportation costs, import tariffs/export taxes, monetary exchange rates, inflation, interest rates, duty drawbacks, transfer prices, etc. [34,35,36,37]. Political factors include political stability, trade regulations, local content rules, financial incentives, etc. [37,38,39]. Furthermore, labor characteristics, infrastructure, telecommunication technologies, and cultural differences [38,40] are also important. In terms of cities’ external and internal logistics networks, the internal urban logistics networks are affected by various factors. Stathopoulos et al. [41] point out that urban freight transport is influenced by the location of economic activity, the composition of the freight flows, and the quality of infrastructure. For the external logistics networks of cities, empirical studies on European cities suggest that a city’s global logistics network connectivity is favored by agglomeration economies, physical accessibility, non-physical accessibility (network economies), and innovation activity [42]. Many studies have researched factors that result in logistics network changes at the international, subregional, and inner-city scale. However, there is a lack of research considering the different geographical scales and their impact on logistics networks.
Logistics is an important component dimension of the supply chain [11]. Recent studies have analyzed how various factors affect the manufacturing supply chain. For instance, some scholars have studied the functions and performance of the supply chain [43], optimization of the supply chain recovery model [5], and scenario simulations of food supply chain disruption [3]. The aforementioned studies are generally based on mathematical modeling and simulation. Some scholars have also studied the characteristics and causes of supply chain changes in specific countries or regions by empirical research, such as a study on the sustainability of the clothing supply chain in South Asian countries based on semi-structured interview data [44], and a study on the impact of food supply chain disruptions in India based on retail website data [45]. However, relatively few studies have focused on the logistics dimension of the supply chain, let alone the changes in the logistics networks caused by the rising logistical costs and transportation disruptions in the context of the COVID-19 pandemic.
Studies on logistics networks have been mainly conducted at the global or subregional levels, while insufficient attention has been paid to conducting comprehensive research investigating logistics networks at different geographical scales. Moreover, logistics network research using empirical methods has mainly used data from transportation infrastructure networks, shipping routes, highway freight flows, and enterprise transactions, etc. In contrast, few studies have drawn upon firm survey data to analyze firms’ logistics networks and their changes. It is important to focus on urban production space—such as industrial zones, development zones, and special economic zones—where many firms gather, to investigate their logistics networks and the impact of different geographical scales. Notably, some Chinese scholars have studied the spatial patterns of supply and sales logistics networks in typical industrial spaces based on the empirical cases of wholesale markets in Guangzhou [46] and the Xining Development Zone [47]. However, few studies have analyzed network changes in the context of global public crises.

1.3. Aims and Questions

Given the current research gap, this study focuses on China’s development zones in order to analyze the changes in firms’ supply and sales logistics networks in the context of COVID-19. In terms of the representativeness of the firm sampling survey and diversity of industry categories, China’s development zones are good choices for a case study. First, development zones are the most typical industrial space in China, and the most important spatial carriers for China to participate in the division of international trade and drive local industrial development (Appendix A, item 2). As Nicholas pointed out, economic and geographic analysis of the knowledge, capital, and export linkages of economic enclaves—represented by development zones—shows a strong correlation with cities’ economic performance [48]. Secondly, since the outbreak of the COVID-19 pandemic, development zones in China have significantly contributed to the recovery of local manufacturing supply chain logistics, and experienced the main problems of local industrial supply chain logistics. Therefore, development zones have become important windows to investigate the supply chain problems of China’s manufacturing industry during the global COVID-19 pandemic; analyzing the logistics of firms in China’s development zones would yield a better understanding of the changes in China’s manufacturing supply chain, and provide valuable experience of the typical Chinese manufacturing and logistics recovery during the COVID-19 pandemic.
With the purpose of discovering the characteristics and mechanisms of logistics network changes in China’s development zones at different geographical scales, we aim to analyze the following three research questions, by dividing a firm’s supply chain logistics network into the supply logistics network and the sales logistics network [49]: (1) What is the structure of the firms’ supply and sales logistics networks in development zones in a typical Chinese city?; (2) What are their changes at different geographical scales due to the outbreak of COVID-19?; (3) What are the influencing factors of the firms’ logistics network changes at different geographical scales in the context of COVID-19?

1.4. Research Framework

The paper is organized as follows: In Section 1, based on the literature review of logistics networks and related research, and over the background of the increasing spatial sensitivity of product circulation under the influence of COVID-19, we focus on the characteristics of firms’ logistics networks at different geographical scales during the COVID-19 pandemic. We introduce the study area, methodology, analysis steps, and data resources used in Section 2, based on the research aims and questions raised in Section 1. In Section 3, we present the research results of firms’ logistics networks in Weifang’s development zones based on the two-mode network analysis method. In Section 4, we analyze the influencing factors at different geographical scales. In Section 5, we compare the findings with other related studies, and put forward policy suggestions; in the final part of this section, we summarize the research limitations and provide suggestions for future research (Figure 1).

2. Materials and Methods

2.1. Study Area

Located in the middle of the Shandong Peninsula, and as one of the 16 prefecture-level cities in Shandong Province (35°41′~37°26′ N and 118°10′~120°01′ E), Weifang has 4 districts and 2 counties under its jurisdiction, and hosts 6 county-level cities. According to The China Development Zone Audit Announcement List 2018 issued by the Chinese government, there are 3 national-level development zones (1 national-level economic and technological development zone, 1 national-level high-tech industrial development zone, and 1 comprehensive bonded zone) and 12 provincial development zones in Weifang (Figure 2). Weifang Comprehensive Bonded Zone is not included in this study because it is different from other development zones in terms of its logistics network organization mechanism, due to being based in bonded storage, export processing, and transit trade.
The reasons for taking Weifang in China’s Shandong Province as a case study are as follows: First, Weifang is located in the eastern coastal area of China and has an export-oriented economy, and the impact of COVID-19 on the circulation of international goods has extended to firms’ supply and sales logistics networks in the local development zones. Second, there are many development zones at the national and provincial levels in Weifang (Table 1), which contribute 78.3% of the total output value of industrial companies above that scale in the city [50]. Therefore, the firms in the development zones that were surveyed in this study can better represent the major industrial companies in Weifang. Third, Weifang is a typical prefecture-level city with relatively strong economic performance in China, and its development zones have attracted a certain number of local and multinational firms. Compared to the headquarters of multinational corporations gathered in the development zones of Beijing, Shanghai, Shenzhen, and other megacities, development zones in Weifang can better reflect the logistics network characteristics of China’s local industrial clusters.

2.2. Methodology

2.2.1. Two-Mode Network

The two-mode network has been widely adopted in studies on the spatial patterns of logistics networks [16,17], the market structure of inbound traveler sources [51], the polycentricity of urban agglomerations [52], and the network structure characteristics of listed companies and directors [53]; due to its well-demonstrated efficacy in these areas, we chose to use the two-mode network to investigate the logistics networks of firms in Chinese development zones. The two-mode network focuses on the relationship network formed by the actors between two sets [54], as opposed to the one-mode network, which can only analyze relationships within the same set. According to the two-mode network concept, the companies in development zones become receiver companies when they buy raw materials from different sources, and become seller companies when selling the products produced to different destinations; thus, there are both supply logistics networks and sales logistics networks in the development zones. The surveyed firms in Weifang’s development zones are integrated with the supply originations and the sales destinations to form a two-mode network. The supply originations and the sales destinations are divided into 61 space units, including “within development zones”, “outer development zones within Weifang”, another 15 prefecture-level cities in Shandong Province other than Weifang, all provinces (autonomous regions), municipalities directly under the central government, special administrative regions in China, and overseas countries and regions (Appendix A, item 3). Accordingly, in our study, we established a sales logistics network composed of a collection of seller companies and a collection of sales destinations, and a supply logistics network composed of a collection of receiver companies and a collection of supply originations (Figure 2).

2.2.2. Network Centrality Analysis

Centrality is one of the focuses of network analysis, which generally includes degree, closeness, and betweenness centrality; centrality is used to quantify the power of actors in the network [55], as a common method of researching logistics networks [19,20].
  • Degree Centrality
The total number of events is divided by the number of events of a point in order to obtain the relative degree centrality of the point in a two-mode network. From the perspective of the supply logistics network, for the supply originations, the degree centrality is equal to the total number of receiver companies divided by the number of receiver companies of the point; for the receiver companies, it is equal to the total number of supply originations divided by the number of supply originations of the point. The degree centrality of the sales destinations and the seller companies in the sales logistics network can be calculated in the same way. The larger the degree centrality at a node in the network, the more points associated with it, and the more important position it holds in the network.
  • Closeness Centrality
Closeness centrality [56] represents the degree of approach from network members to other members. For any given point in a two-mode network, the sum of the distances is equal to the sum of the distances from the point to other points, plus the distances from the point to all events. From the perspective of the supply logistics network, for the receiver companies, closeness centrality is a function of the shortest network distance from their supply originations to other supply originations and receiver companies; similarly, from the perspective of the sales logistics network, for the seller companies, closeness centrality is a function of the shortest network distance from their sales destinations to other sales destinations and seller companies (Equation (1)):
C c ( n i ) = [ 1 + i = 1 g + h min k d ( k , j ) g + h 1 ] 1
where C c ( n i ) represents the closeness centrality of the receiver or seller company n i , in which C c represents closeness centrality; g represents the number of receiver or seller companies; h represents the number of supply originations or sales destinations; k represents a supply source or sales destination adjacent to the receiver or seller company n i ; j represents some other receiver or seller company, or some other supply source or sales destination; and min k d ( k , j ) represents the shortest network distance between k and j , in which min k d represents a function for finding the minimum distance from k and j .
From the perspective of the supply logistics network, for the supply originations, closeness centrality is a function of the shortest network distance from their own receiver companies to other supply originations and receiver companies; similarly, from the perspective of the sales logistics network, for the sales destinations, closeness centrality is a function of the shortest network distance from their supplier companies to other supplier companies and sales destinations (Equation (2)):
C c ( m k ) = [ 1 + j = 1 g + h min i d ( i , j ) g + h 1 ] 1
where C c ( m k ) represents the closeness centrality of the supply source or sales destination m k , in which C c represents closeness centrality; g represents the number of supply originations or sales destinations; h represents the number of receiver or supplier companies; i represents a receiver or supplier company adjacent to the supply origination or sales destination m k ; j represents some other supply source or sales destination, or some other receiver or supplier company; and min i d ( i , j ) represents the shortest network distance between i and j , in which min i d represents a function for finding the minimum distance from i and j .
Generally speaking, a smaller closeness centrality of a network member indicates better accessibility, and it is easier to establish relationships with other members and be in the center of the overall network.
  • Betweenness Centrality
Betweenness centrality [56] shows the relationship between two non-adjacent nodes in the network, and their degree of dependence on other nodes in the network. In the one-mode network, betweenness centrality focuses on the extent to which an actor lies in the middle of the network. In the two-mode network, the communication between each pair of actors should be performed by the participation of actors in various events; similarly, the communication between each pair of events should be performed by actors. In the two-mode network, all actors involved in the event should be considered, in order to calculate the betweenness centrality of an event m k . If only one event m k (i.e., X i j N = 1 ) is shared for a given pair of actors ( n i , n j ), the betweenness centrality of m k should be increased by one unit. If X i j N is shared for a given pair of actors ( n i , n j ), the betweenness centrality of m k should be increased by 1 X i j N unit(s) for any pair of actors ( n i , n j ); therefore, the betweenness centrality ratio of an event m k can be expressed as the number of shared qualifications per pair of its members (Equation (3)):
C b ( n i ) = 1 2 n i , n j m k 1 X i j N
In the supply logistics network in this study, for a receiver company, only when any pair of supply originations both offer supplies to the receiver company can the receiver company obtain the betweenness centrality. If one supply source offers supplies to only one receiver company, the receiver company will receive g + h + 2 betweenness “point(s)”. Similarly, in the sales logistics network, for a supplier company, only when any pair of sales destinations both accept the supplier company can the supplier company obtain the betweenness centrality. If one sales destination accepts only one supplier company, the supplier company will receive g + h + 2 betweenness “point(s)”.
Similarly, for the supply originations or sales destinations, if a single supply source or sales destination is the only cooperation area of a receiver or supplier company, the supply source or sales destination will receive g + h + 2 betweenness “point(s)”; for all recipient receiver or supplier companies contacted by a supply source or sales destination, the supply source or sales destination will receive 1 X k l M betweenness centrality(ies). m l represents another supply source or sales destination of the receiver or supplier companies shared with m k , and X k l M represents the number of receiver or supplier companies shared by m k with m l .
The centrality of the two-mode network can be measured by the network → centrality → two-mode centrality module in UCINET 6.

2.2.3. Analysis Steps

The analysis steps were performed as follows: The first step was data collection; the firms’ data were collected by fieldwork in Weifang’s development zones, including information on the supply originations and sales destinations of respondents before and after the outbreak of the COVID-19 pandemic. In the second step, the two-mode network approach was introduced to analyze the firms’ logistics networks. Using the two-mode network approach, we deconstructed the firms’ logistics networks into supply logistics networks and sales logistics networks. In the third step, we built four rectangular data matrices based on the fieldwork data of the firms and the two-mode network approach—supply logistics networks before the outbreak, supply logistics networks after the outbreak, sales logistics networks before the outbreak, and sales logistics networks after the outbreak. In the fourth step, we imported the data matrices into UCINET for the network centrality analysis, and into Gephi to visualize the topological structure of the firms’ logistics networks.

2.3. Data Resources

This study is based on both the field visits and the questionnaire that was distributed to firms in the 14 Weifang development zones from 26 August 2020 to 15 October 2020. During the field visits and questionnaire surveys, we explained to the firms the specific time periods of “before the pandemic outbreak” and “after the pandemic outbreak”, in which “before the pandemic outbreak” refers to 2019—the firms were required to fill in the relatively stable supply originations and sales destinations in that year—and “after the pandemic outbreak” refers to the times at which the field visits and questionnaire distribution were conducted (Appendix A, item 4). A total of 123 valid questionnaires were collected, including 12 from the Weifang Binhai Economic and Technological Development Zone, 11 from the Weifang Hi-Tech Industrial Development Zone, 5 from the Weicheng Economic Development Zone, 14 from the Weifang Economic Development Zone, 1 from the Changle Economic Development Zone, 46 from the Zhucheng Economic Development Zone, 14 from the Gaomi Economic Development Zone, and 20 from the Changyi Economic Development Zone. There were 8 and 17 firms reflecting the changes in supplier sources and main product sales destinations, respectively, as a result of the outbreak of COVID-19. The firms of the valid questionnaires included multiple industry categories (Figure 3).

3. Results

3.1. Structure of Firms’ Logistics Networks before the Outbreak of the Pandemic

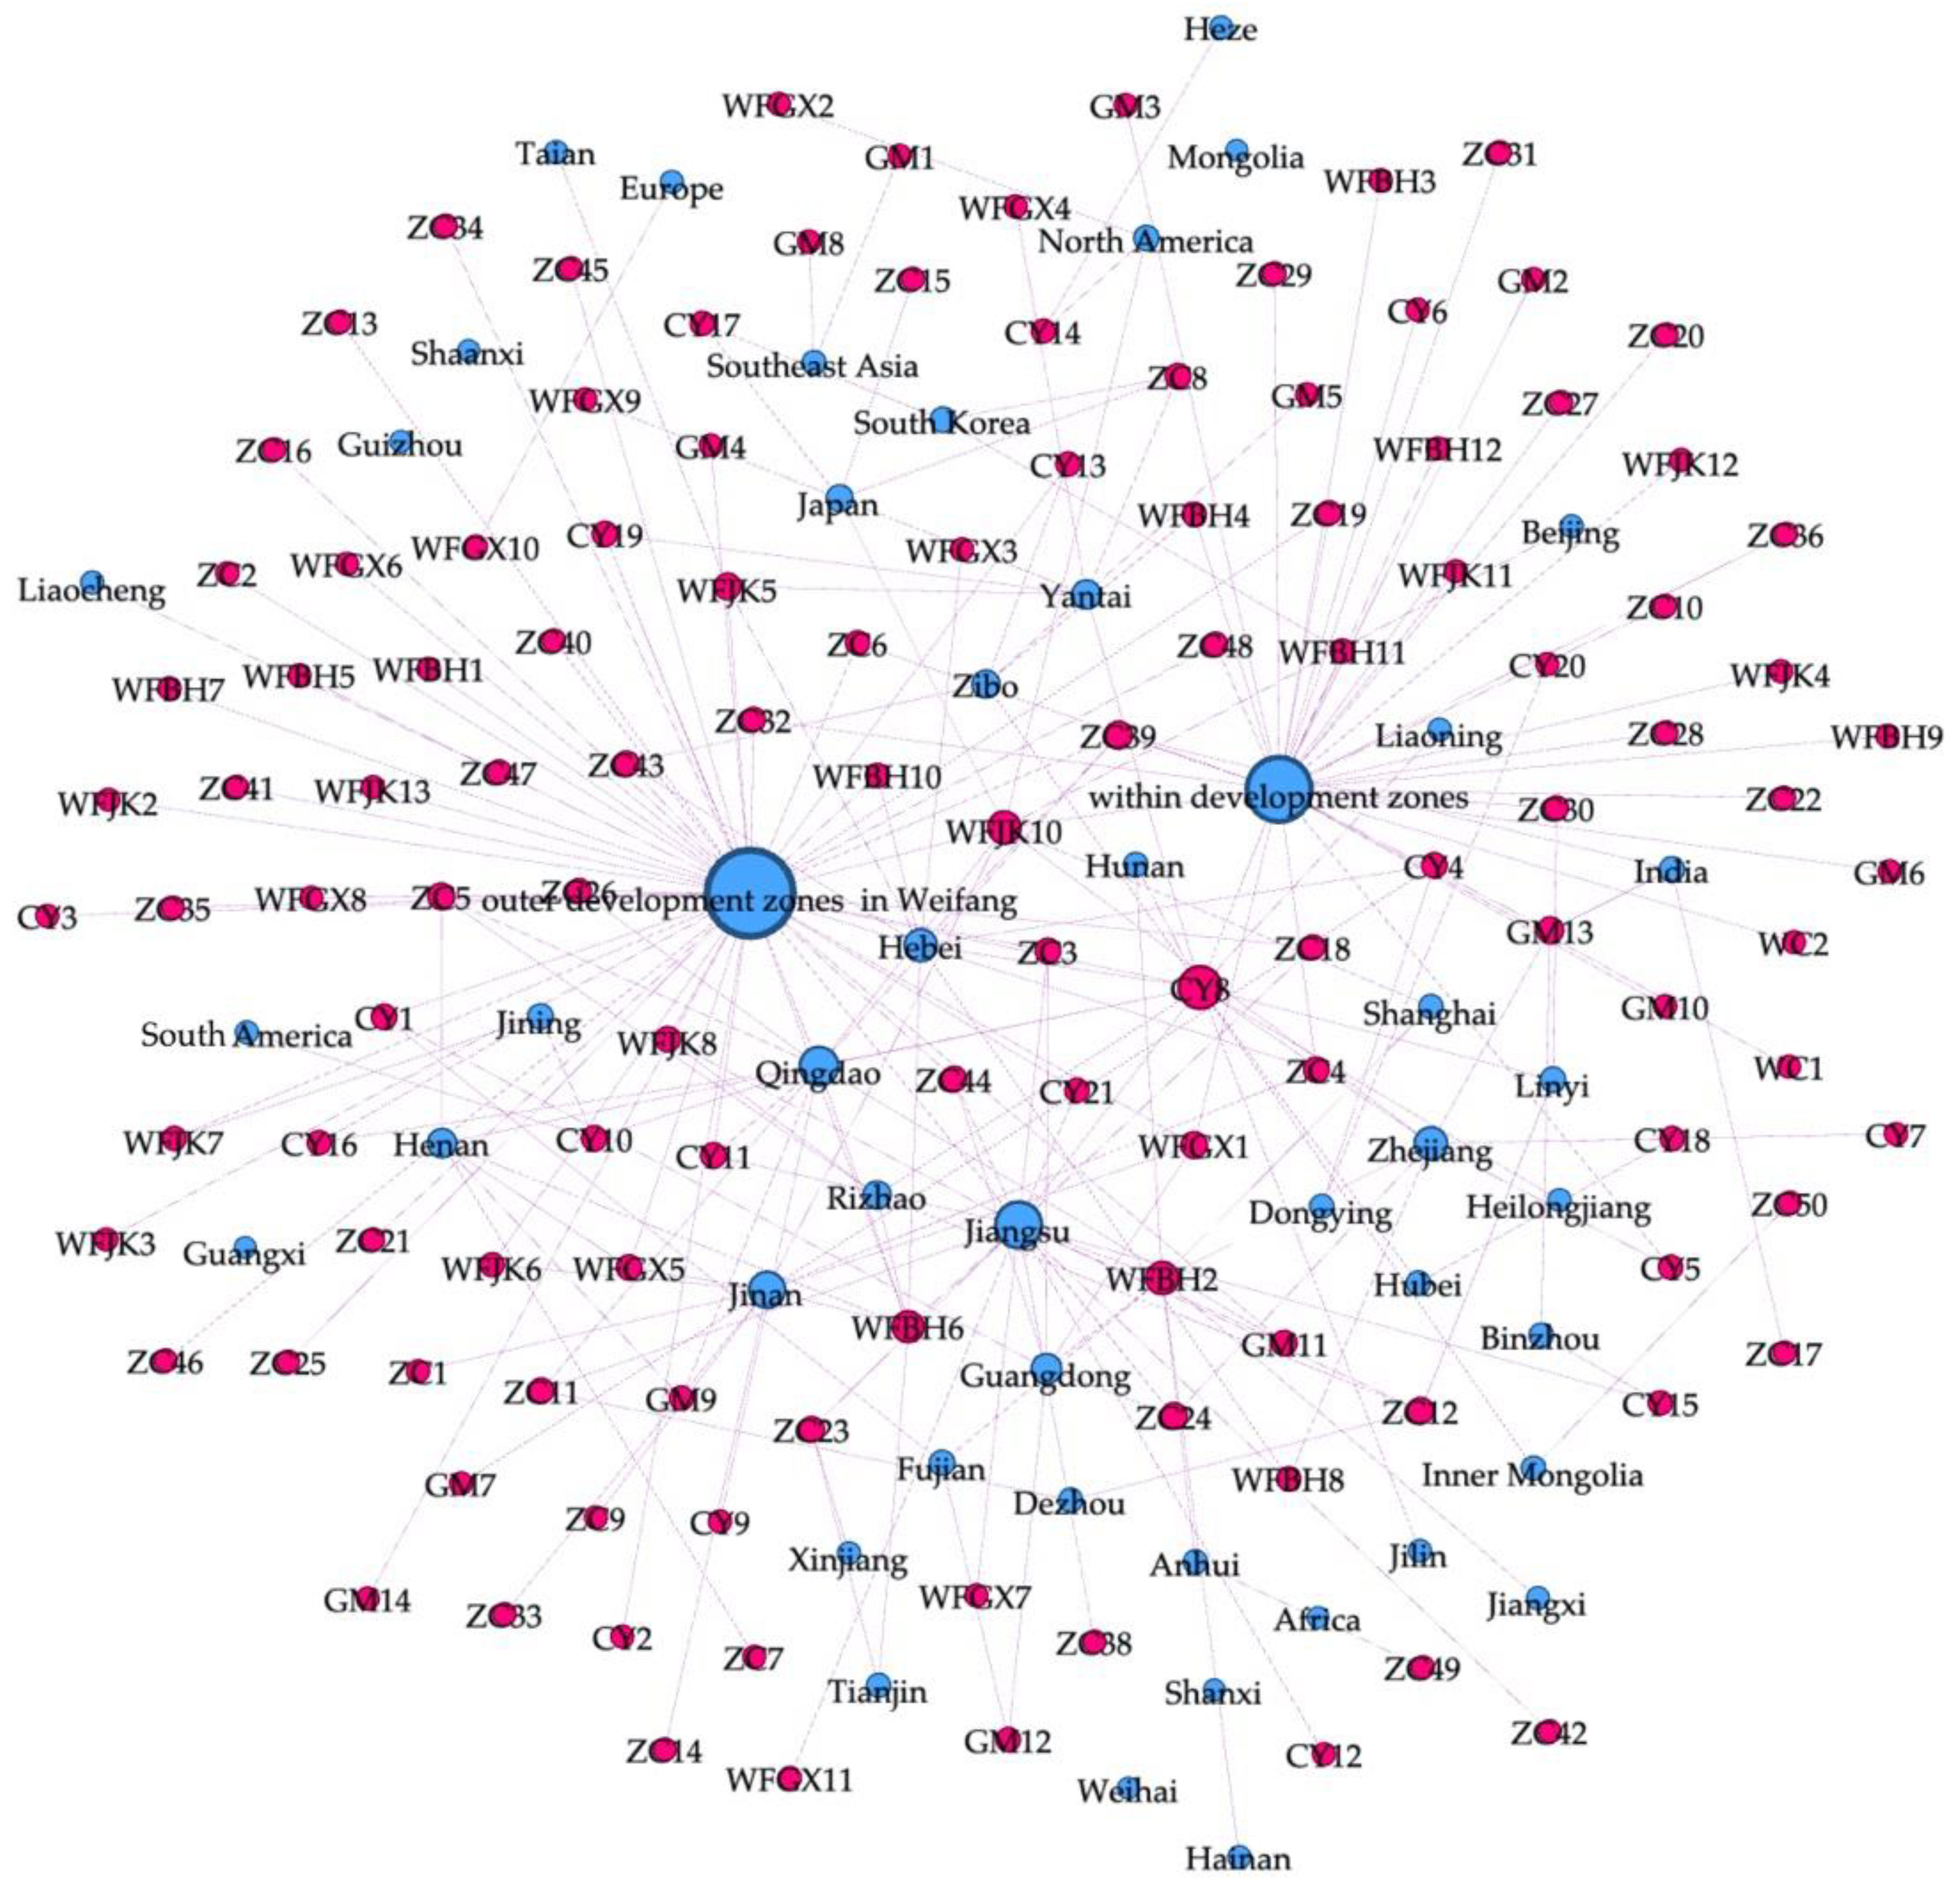
3.1.1. Supply Logistics Networks

The firms’ supply logistics networks in Weifang’s development zones are localized. The supply source nodes of “within development zones” and “outer development zones within Weifang” in the firms’ supply logistics networks have the highest degree centrality and betweenness centrality, indicating that the two nodes have the highest connectivity and most central position within the networks. At the provincial level of Shandong, Jinan and Qingdao are the two city units with the highest network node centrality; Jinan and Qingdao are also the capital city of Shandong and the city with the largest economic aggregate, respectively. At the national level, Jiangsu, Zhejiang, Hebei, and Guangdong are the four provinces with the highest degree centrality in the firms’ supply logistics networks. From the perspective of overseas supply source nodes in the firms’ supply logistics networks, Japan, South Korea, North America, and India are the main sources of overseas supply for Weifang’s development zones; Southeast Asia, Europe, and South America are also supply originations of Weifang development zones, but these three regions only have supply logistics links with some individual firms, and they are at the edge of the networks, with the node’s betweenness centrality of 0 (Figure 4).

3.1.2. Sales Logistics Networks

The firms’ sales logistics networks in the development zones use the key firms as the core, and the major sales destinations lie in the middle circle of the networks. The firms at the edge of the networks are further driven by the sales destinations in the middle circle, and a circle layer nesting characterizes the network structure as a whole. The node of “outer development zones within Weifang” is the top sales destination of the firms. The “outer development zones within Weifang” node is the sales destination node with the highest degree centrality in the networks, and its degree centrality reaches 0.342. The firms’ sales logistics networks also have the typical characteristic of localization. For the firms’ sales destinations in the province, Qingdao and Jinan are the top two in terms of degree centrality and betweenness centrality among sales destination nodes other than Weifang. Zhejiang, Guangdong, Jiangsu, and Henan are the top four provinces as out-of-province sales destinations regarding degree centrality in the firms’ sales logistics networks. Among the overseas sales destinations of the firms, Europe, Japan, and North America have the highest node connectivity; Mongolia is at the very edge of the sales networks, and its betweenness centrality is 0 (Figure 5).

3.2. Changes to Firms’ Logistics Networks after the Outbreak of the Pandemic

3.2.1. Changes to Supply Logistics Networks

The firms’ supply logistics network structure in Weifang’s development zones has changed partially after the pandemic outbreak. Specifically, the core circle of the networks has gradually changed from the overall structure of “double centers” of “within development zones” and “outer development zones in Weifang” before the outbreak of the pandemic, to a structure with “double centers + strong cities in the province (Jinan, Qingdao) + neighboring major economic provinces (Jiangsu)” as the composite center (Figure 6). From the perspective of node centrality, the node degree centrality and intermediary centrality of “within development zones” and “outer development zones within Weifang” have increased slightly, with an improvement in the network connectivity and centrality of localized supply source nodes (Table 2). The node degree centrality of the supply originations at two spatial levels of “outer Weifang in Shandong” and “outer Shandong in China” has also slightly increased by 1.65% and 1.64%, respectively; the node degree centrality and betweenness centrality of Qingdao and Jinan in Shandong have also increased. The source of overseas supply has experienced the most dramatic change in node centrality. The sum of degree centrality of all overseas supply originations has decreased significantly (−20.51%). There is also a decrease in the degree centrality of Japan, South Korea, and North America (Table 3, Figure 7).

3.2.2. Changes to Sales Logistics Networks

The most significant change in the overall structure of the firms’ sales logistics networks is the shrinking of overseas sales destinations after the outbreak of COVID-19; for example, the degree centrality and betweenness centrality of sales destination nodes in Japan, South Korea, Europe, North America, and India decreased significantly, and the sum of degree centrality of all overseas sales destinations decreased by 23.48% compared to before the outbreak of the pandemic (Figure 8, Table 4). Furthermore, the sum of degree centrality of local sales destination nodes—such as “within development zones” and “outer development zones in Weifang”—increased slightly (4.65%). By contrast, those of sales destination nodes within Shandong (outer Weifang) and in China (outer Shandong) decreased slightly (−2.00%) and basically remained the same (0.02%), respectively (Table 5, Figure 9).

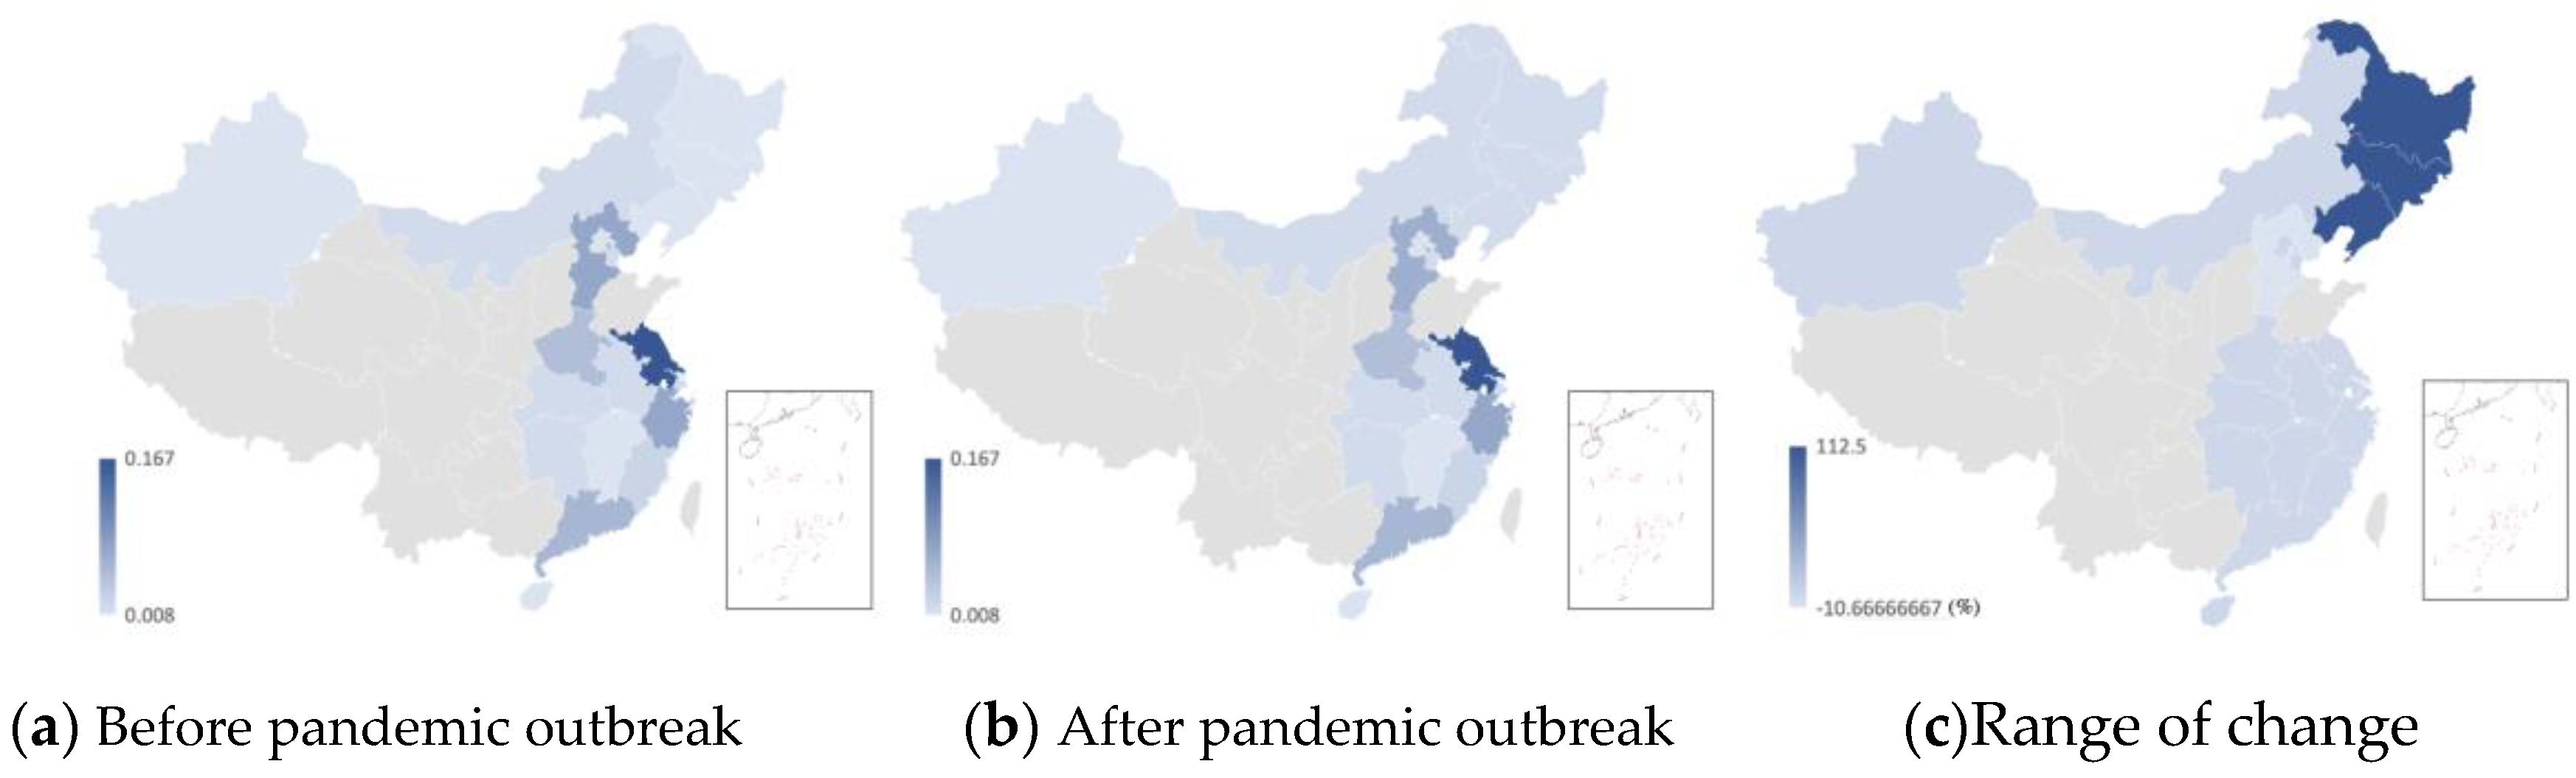
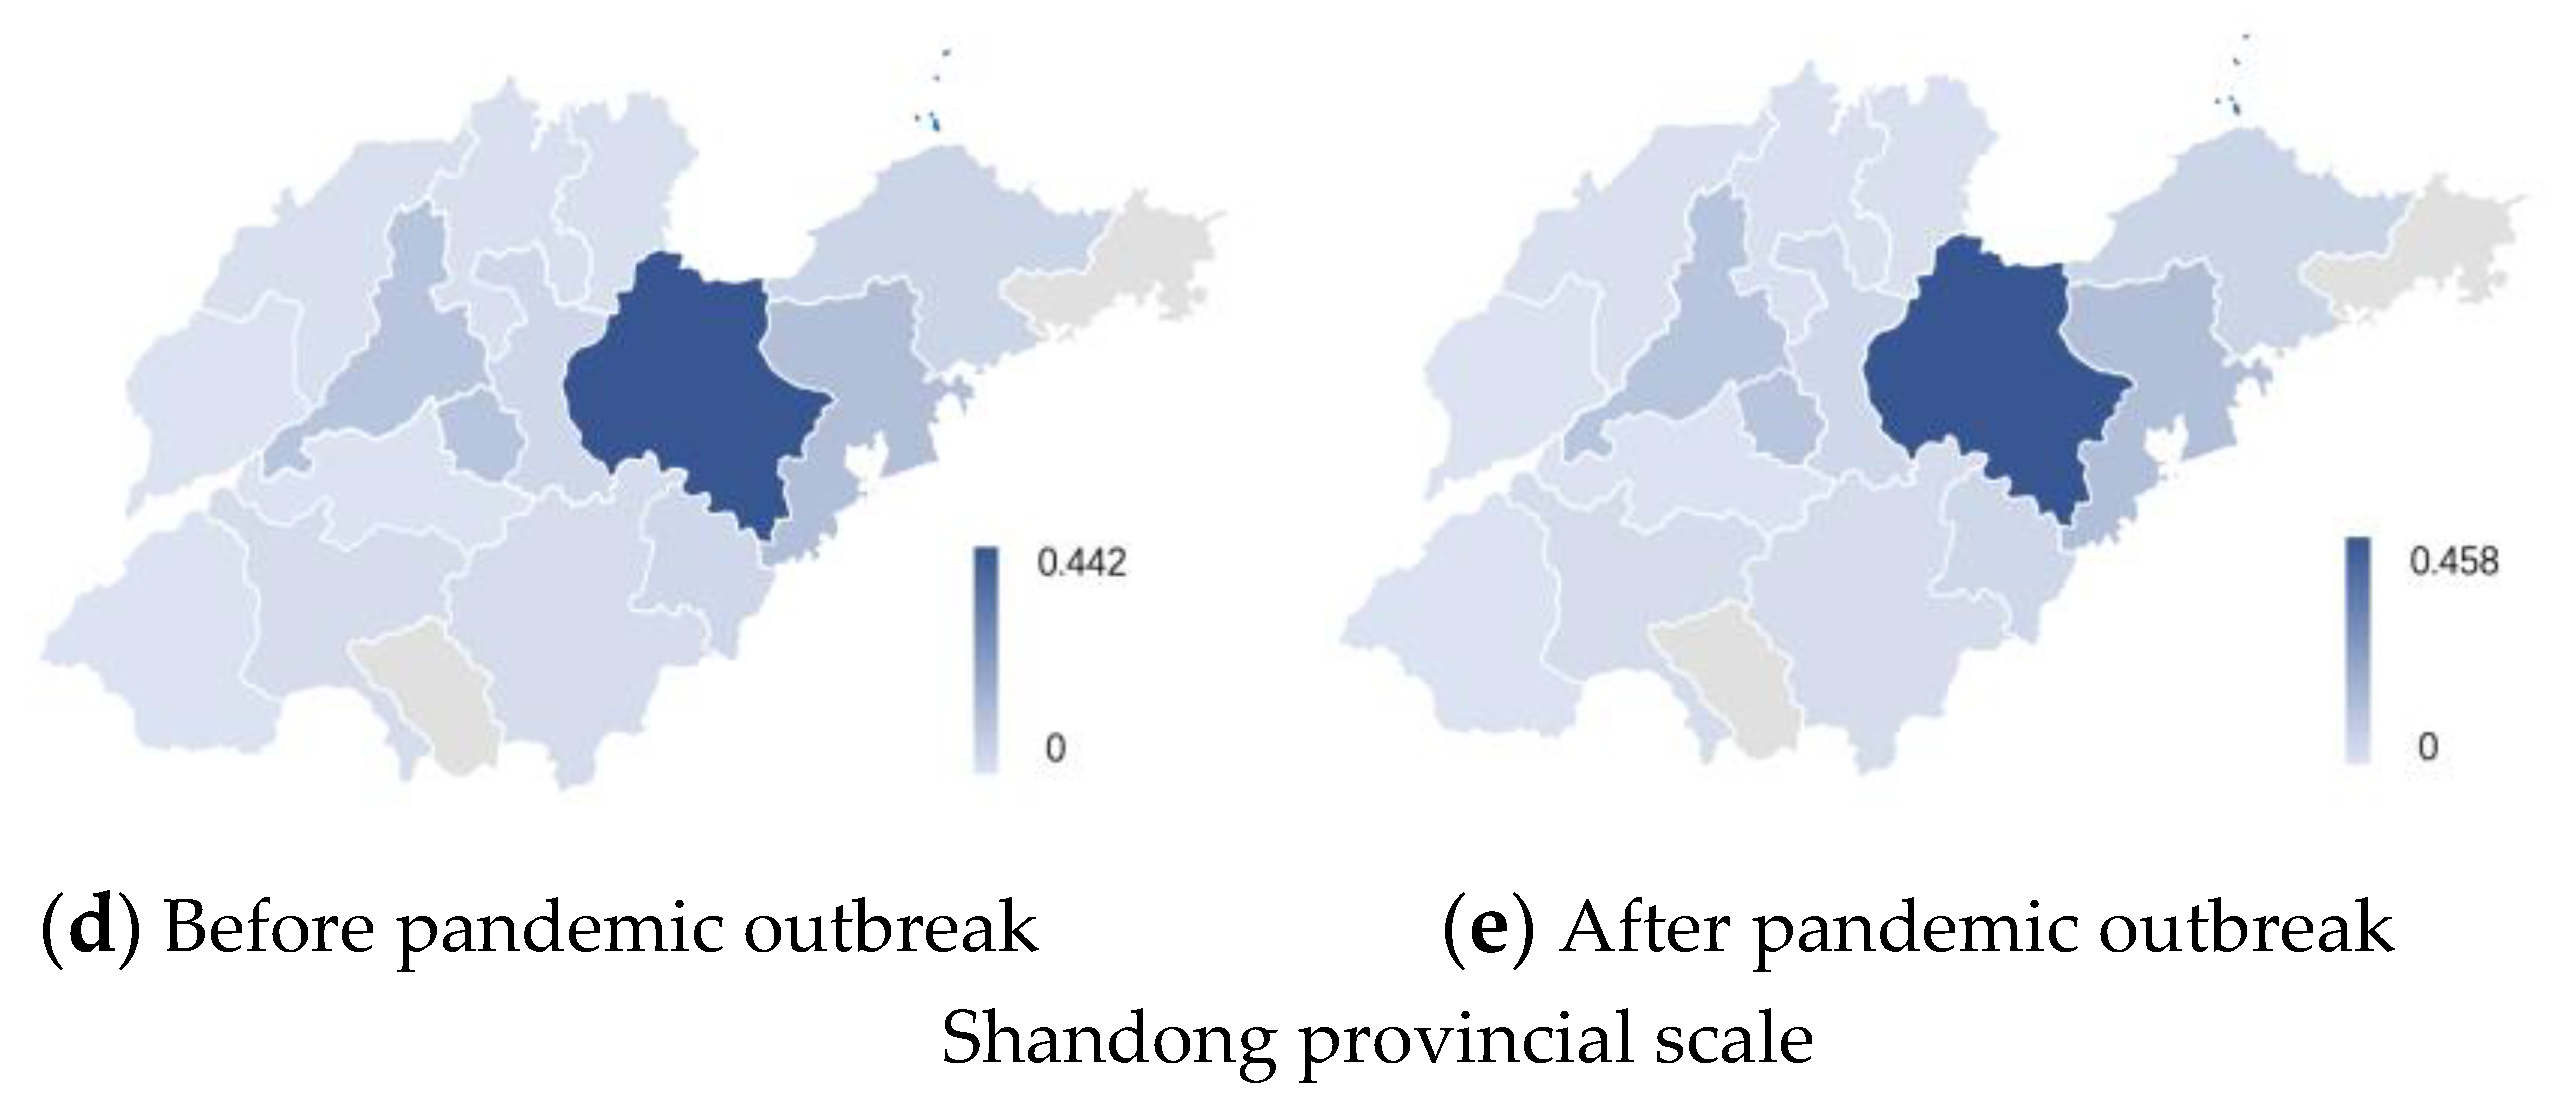
3.2.3. Changes in Firms’ Logistics Linkage Frequencies at Different Geographical Scales

We calculated the linkage frequencies of the firms’ supply and sales logistics at five different geographical scales, before and after the outbreak of the pandemic. We found that the geographical distribution of the linkage frequencies of the firms’ supply logistics differs from that of their sales logistics, and the firms’ supply logistics are more localized, whereas the firms’ sales logistics have higher linkage frequencies at the scales of “outer Weifang in Shandong” and “outer Shandong in China”. The results also show that the local links of the firms’ logistics were strengthened (the firms’ supply and sales logistics linkage frequencies within the development zones increased by 3.51% and 6.64%, respectively), and the supply and sales logistics linkage frequencies within Weifang increased by 3.46% and 6.64%, respectively, after the outbreak. By contrast, the contraction of the firms’ supply and sales logistics overseas linkage frequencies are obvious (the linkage frequencies of the firms’ supply logistics and sales logistics decreased by 19.36% and 15.58%, respectively), whereas the linkage frequencies within Shandong province and China remained stable during the outbreak (Table 6).
In addition to the calculation of the change range, we further tested the statistical significance of changes by paired sample t-test using SPSS 15.0 software. First, the geographical scales of “within development zones” and “outer development zones in Weifang” were combined to represent the local scale. Second, taking every development zone in Weifang as the basic unit in testing, we summed the logistics linkages of firms in every development zone at four geographical scales. Third, we obtained the data of logistics network linkage frequencies of the firms in every development zone at four geographical scales, before and after the outbreak of the pandemic. According to the t-test result, the changes at the local and global scales are statistically significant at the 10% and 5% significance levels, respectively, whereas the changes at “outer Weifang in Shandong” and “outer Shandong in China” are statistically insignificant (Table 7).

4. Analysis of Influencing Factors

Decisions in international logistics networks have three levels, according to the time horizon of planning—strategic, tactical, and operational—where strategic is the highest level, and operational is the lowest; the lower-level decisions are limited by the higher levels [34,37]. Among them, the strategic level mainly includes the layout of logistics facilities, and the tactical level concerns the material flow management, whereas the operational level mainly focuses on in-time delivery.
The COVID-19 pandemic has been a sudden and serious public health event. Less than a year had passed from the outbreak of the pandemic to the time of our field visit and questionnaire distribution. The logistics networks at different geographical levels have not yet reacted to the pandemic at the strategic level. Instead, logistics networks have mainly adapted in terms of the transformation of the tactical and operational levels made by the firms in response to the changes in the logistical environment during the pandemic. In our study, we analyzed the tactical and operational levels, specifically investigating the influencing factors of firms’ logistics networks from the international scale to the local scale, and conducted supplementary analysis from the standpoint of firms in the development zones (Figure 10).

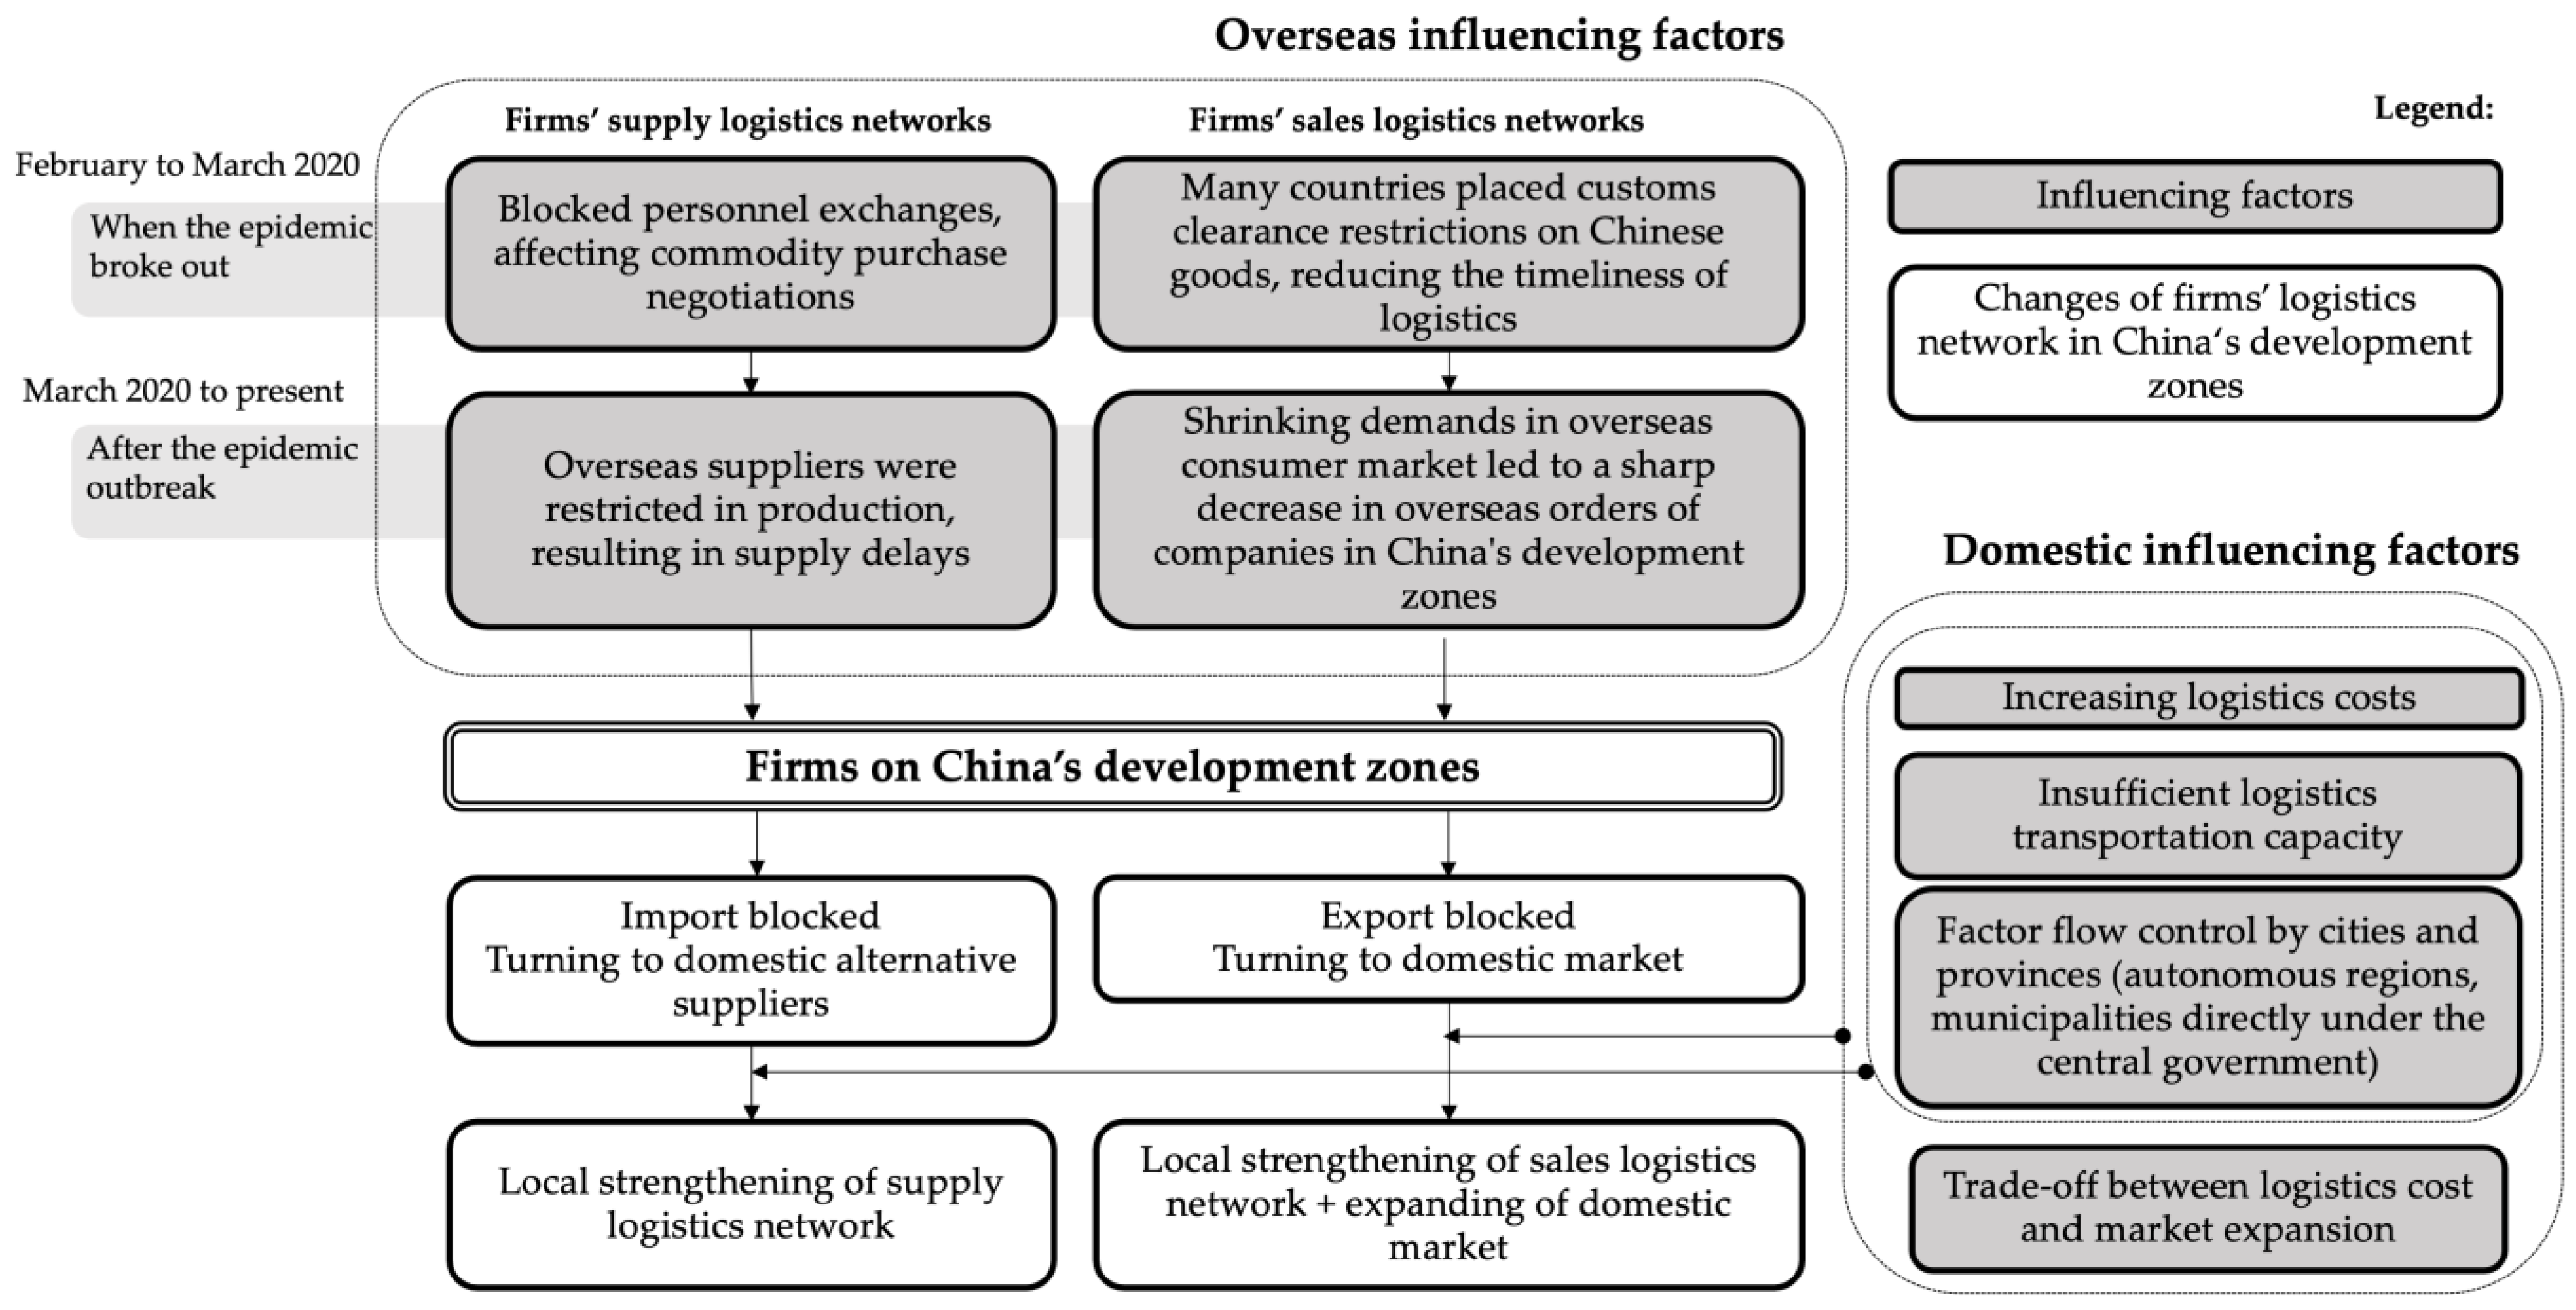
4.1. Overseas and Domestic Influencing Factors

In terms of the overseas influencing factors of firms’ logistics networks in development zones, many countries placed tighter customs clearance restrictions on Chinese exports and personnel exchanges during the outbreak of COVID-19 in China, forcing the firms in China’s development zones to adjust their overseas sales destinations to domestic ones. Despite the primary control of the pandemic in China, there was still a massive outbreak overseas, resulting in overseas suppliers of the firms in China’s development zones not carrying out full load production because of lockdown measures taken in response to the pandemic. The shrinking overseas demand also led to the continual cancellation of their export orders (Appendix A, item 5), accompanied by a sharp decline in the throughput of China’s foreign trade ports (Appendix A, item 6), delayed receipt of goods by the firms in China’s development zones, and blocked exports. Firms in China’s development zones reacted by looking for domestic suppliers as substitutes during the outbreak period, at home or abroad, while also turning their sales targets towards domestic firms.
In terms of the domestic influencing factors of the firms’ logistics networks in China’s development zones, China has been faced with the problems of insufficient logistics transportation capacity, interruption of the logistics network [10], rising logistics transportation costs [30] (Appendix A, item 7), and the firms in the development zones hoping to find closer suppliers (Appendix A, item 8). As provinces (including autonomous regions and municipalities directly under the oversight of the central government) are the basic units for administrative management in China, provinces serve as the basic units for implementing first-level response (FLR) policies for major public health emergencies. In total, 31 Chinese mainland provinces have launched FLR policies since the closure of Wuhan. Interprovincial mobility of the population in China was strictly restricted, thus affecting the interprovincial logistics networks due to the limitation of face-to-face business negotiation in supply chain commodity procurement. Therefore, the province has become an important unit for the construction of the firms’ local supply logistics networks. For the sales logistics networks of the firms in the development zones, the companies have to turn their sales targets to the domestic market, and hope to make up for the loss of earnings at the export end through the expansion of the domestic sales logistics network when their export is blocked (Appendix A, item 9).

4.2. Local Influencing Factors

When analyzing the pandemic, we can see that it accelerated the shift of supply chains from a global level to a local level [57,58]. In China, the localization of the supply chain has also been influenced by government management. The “managed hand” of the Chinese urban government can guide enterprise agglomeration and coordinate cross-enterprise cooperation [59]. In our field investigation of the Weifang development zones, we found that the management committees of the development zones in China carried out the planning, construction, and investment attraction of the development zones on behalf of the local governments. For example, when the interprovincial logistics were restricted during the pandemic period, the Management Committee of Weifang Hi-Tech Industrial Development Zone conducted targeted investment according to the list of supply-chain-supporting companies provided by Weichai Power Co., Ltd., Weifang, China—the leading enterprise in the zone—and brought supply-chain-supporting companies to the local development zone in order to realize nearby supply from downstream suppliers of hub firms in the zone. Limited by the timely delivery and logistical costs, some supply-chain-supporting companies also took the initiative to move from Xiangyang in Hubei Province and Longkou in Yantai Province to the Weifang Hi-Tech Industrial Development Zone, in order to shorten their spatial distance from the upstream companies in the supply chain. To facilitate this move, the Weifang Hi-Tech Industrial Development Zone provided land, investment, taxation, and other support measures to these companies [60].
The policies and services of local governments and development zone managers have met the needs of the firms’ supply chain logistics after the outbreak of the epidemic to a certain extent, and played an active role in the post-pandemic recovery of the manufacturing supply chain, promoting the strengthening of firms’ local logistics networks. According to the questionnaire survey, 43.18% of the surveyed firms hope that the managers of the development zones can bring them into contact with the upstream and downstream companies in the supply chain, or help them to seek the target market for their products; 46.6% and 22.73% hope to find suppliers and sales destinations, respectively, in the neighboring provinces. The difference between the last two figures reflects the information asymmetry and the urgent need for companies to expand the market of products.

5. Discussion and Conclusions

5.1. Discussion

One implication of our empirical results concerns the crisis adaptability of local industry, which differs from the findings of other studies. For instance, Majumdar et al. [44] and Mahajan et al. [45] found that the supply chains were vulnerable in developing countries during global public crises—based on the case studies of the garment industry in South Asia and the food industry in India, respectively—compared to a strong risk adaptability in the manufacturing supply chains in some developed countries in Central Europe [61]. Our case study finds that the average path length of the firms’ supply logistics networks in Weifang’s development zones decreased from 3.469 before the outbreak of COVID-19 to 3.458 after the outbreak and, correspondingly, the sales logistics network decreased from 3.147 to 3.04, indicating the increased connectivity of the logistics network after the outbreak. Thus, local industrial clusters in China have shown a certain adaptability to the global public crisis, unlike similar cases in India and South Asia.
For the spatial structure of the firms’ logistics networks, the logistics networks of the firms in the development zones of ordinary prefecture-level cities in eastern China—represented by Weifang—differ from those of the development zones of a large city in central China—the Zhengzhou Economic and Technological Development Zone [62]—where the major suppliers and customers of firms are located within the same province as the firm, or within China. In comparison, the logistics networks of Weifang’s development zones are significantly localized, with a higher percentage of companies in the development zone supporting those in the same development zone and the same city, in a spatial structure similar to that characterized by “strong localization and weak globalization” in the development zones of Xining—the capital city of a western province in China [47]. As an administrative means of government to guide the concentration of firms, the logistics networks under the guidance of development zones may differ from those in industrial agglomerations. A previous study on local production networks (LPNs) of innovative firms in Hertfordshire, UK shows that 29% of large companies had no local suppliers [63], whereas 74% of the firms regard Hertfordshire as their geographic production base because of its local high-quality human resources [64]. Whether or not development zones can guide the formation of a regional production system and its mechanisms calls for further study.
In our study, we confirmed the important role of hub firms in an industrial cluster, similar to how Yukiko found that a small number of hub firms played a role in linking different regions and local networks based on the Great East Japan Earthquake and the data from Japanese corporate transaction partners, thus geographically dispersing the impact of the earthquake on the economy [26]. Our study also highlights a significant divergence in the betweenness centrality of firm nodes in the supply logistics networks of the firms in Weifang’s development zones, where firm nodes with greater betweenness centrality serve to link firms in the development zones with major sales destinations.
The supply chain risk in global sourcing has always been questioned [65]; the outbreak of COVID-19 demonstrates that localized supply chain systems are more robust and resilient than global supply chain systems [66,67], and that the pandemic accelerates the shift of supply chains from globalization to localization [61,68]. According to the research results of firms’ logistics networks in Weifang’s development zones, the following policy recommendations are put forward to industrial park administrative organizations and local governments in order to better manage logistics networks and supply chain logistics: First, for the supply logistics networks, attention should be paid to the support, cultivation, and introduction of local supporting suppliers. The study results show that the overseas supply originations are the most unstable part of the firms’ supply logistics networks in the development zones in the context of the COVID-19 pandemic, and the import and export disruptions directly affect the survival of small foreign trade companies. Governments at higher levels should take the lead to focus on the development of the industrial Internet for better connections between production factors and subjects such as equipment, production lines, factories, suppliers, products, and customers. By sharing the real-time demand for raw materials in production and bridging the “information gap” in supply chain support for small exporters, the government can enhance the ability of firms to resist external risks. Secondly, for the sales logistics networks, importance should be attached to the development and support of hub firms in local industrial clusters. These hub firms, with high node centrality—which often have channel advantages—are critical in linking local companies to the domestic and overseas markets. Local governments can introduce downstream supply-chain-supporting companies of leading hub firms directly into the industrial park in order to achieve nearby goods supply, and provide financial, land, capital, and other support in this process. Thirdly, local governments and industrial park administrative organizations can act as supply chain “intermediaries” for companies to develop a locally centered logistics network relying on the advantages of local industries. Administrative organizations of industrial parks can, based on the characteristics and needs of the companies in the park, help them to connect to external markets through the efforts made by the professional management teams of industrial parks, in order to establish a multilevel supply chain logistics system with localized logistics networks as basic, and key hub firms as mediators between local firms’ logistics networks and external networks.

5.2. Conclusions

Based on the survey data of the supply originations and the sales destinations of firms in Weifang’s development zones, we used the two-mode network method of social network analysis to explore the characteristics of firms’ logistics networks in China’s development zones in a prefecture-level city, and their changes in the context of the COVID-19 pandemic. In addition, we discuss the changes in the influencing factors of the firms’ logistics networks at different geographical scales (global, domestic, and local) during the COVID-19 pandemic.
The contributions of this study are as follows: First, we contribute to and expand the research field of logistics networks. Second, this study enriches the empirical research of logistics networks via a comparative study based on different geographical scales. Third, we illustrate a phenomenon of global contraction and local strengthening of firms’ logistics networks during the COVID-19 outbreak, by analyzing the most typical type of industrial space in China, highlighting current logistical trends.
However, there are some limitations to this study: First, for the changes in influence factors on logistics networks, there is no quantitative analysis on the influencing factors, nor any specific degree of influence by the COVID-19 pandemic on firms’ logistics networks in development zones. Second, as lists of the names of supporting suppliers and customers are trade secrets of firms, it is almost impossible to acquire the accurate supply chain partners of the interviewed firms, except by investigating the firms’ supply originations and sales destinations by dividing the spatial units; as such, detailed research on the spatial characteristics of local logistics networks was not conducted in this research. Third, although we analyzed the overall characteristics of the supply and logistics networks, and preliminarily discussed the characteristics of the supply chain logistics of a collection of manufacturing firms via the case study of Weifang’s development zones, there is a lack of analysis based on the division of industry categories and supply chain segments of firms in the development zones. Finally, more case studies of other Chinese cities, such as prefecture-level cities adjacent to metropolitan areas, ought to be introduced for comparison with the case of Weifang. The above points remain to be further studied.

Author Contributions

Conceptualization, Xingping Wang and Yiran Yan; methodology, Yiran Yan; validation, Yiran Yan; formal analysis, Yiran Yan; investigation, Yiran Yan; resources, Yiran Yan; data curation, Yiran Yan; writing—original draft preparation, Yiran Yan; writing—review and editing, Yiran Yan; visualization, Yiran Yan; supervision, Xingping Wang; project administration, Xingping Wang; funding acquisition, Xingping Wang. All authors have read and agreed to the published version of the manuscript.

Funding

The research was funded by China’s National Key Research and Development Plan “Research Cooperation and Exemplary Application in Planning of Overseas Industrial Parks” (No. 2016YFE0201000).

Data Availability Statement

The knowledge of the main suppliers and sales destinations of the products of the companies in the development zones were obtained by field visits and online questionnaires. The data used in Section 1.1 can be obtained through the China National Bureau of Statistics (https://data.stats.gov.cn/easyquery.htm?cn=A01, accessed on 15 February 2021). The data used in 2.1 can be obtained through the Bureau of Statistics of Shandong Province (http://tjj.shandong.gov.cn/tjnj/nj2017/zk/indexch.htm, accessed on 15 February 2021).

Conflicts of Interest

The authors declare no conflict of interest.

Appendix A

  • According to the data released by the Chinese National Bureau of Statistics, the throughput of China’s foreign trade cargo ports increased by 1.3%, 0.3%, and –0.6% (8.2% in November 2019), and the national freight volume was down by 17.0%, 29.9%, and 13.0%, from January to March 2020, when the pandemic was at its height in China.
  • According to the China Development Zone Audit Announcement List 2018, there are 2718 national and provincial development zones in China. The publication of Main Economic Indicators for the Economic and Technological Development Areas in China (2019) shows that 218 national economic and technological development zones contributed 10.9% of China’s fiscal revenue, 17.4% of the added value of the secondary industry, and 19.9% of total imports and exports. These proportions would be higher if the provincial development zones were considered.
  • The surveyed companies were required to fill in the countries/regions of their supply originations or sales destinations when the questionnaires were distributed. According to the questionnaire results, the overseas countries/regions are divided into 11 spatial units: Southeast Asia, Europe, Africa, Middle East, North America, South America, India, Oceania, Mongolia, Japan, and South Korea.
  • As China controlled the spread of COVID-19 in March 2020, reducing the number of daily new confirmed cases from 15,153 cases, with the peak on 12 February 2020, to below 100 on average, manufacturing companies in China are gradually resuming production. As of 1 December 2020, the number of daily new confirmed cases overseas was still high—between 500,000 and 600,000. The questionnaire survey in the study was conducted when the pandemic was initially controlled in China, but still severe overseas.
  • Interviews with companies in the Shandong Weifang Economic and Technological Development Zone (Shandong Weiyuan New Material Equipment Co., Ltd., Shandong, China) were conducted on 26 August 2020.
  • According to the data released by the Chinese National Bureau of Statistics, the throughput of China’s foreign trade cargo ports increased by 1.3%, 0.3%, and –0.6% (8.2% in November 2019) in January, February, and March 2020, respectively, when the pandemic was at its height.
  • A questionnaire survey and field visits to the companies in the development zones showed that 56.8% of the surveyed companies mentioned the increase in logistical and transportation costs during the outbreak of COVID-19.
  • A questionnaire survey and field visits to the companies in the development zones showed that nearly half (46.6%) of the surveyed companies hope to find raw material suppliers in the neighboring provinces or their own province after the outbreak of COVID-19.
  • According to the field survey, the surveyed companies are not inclined to limit the sales target market to the neighboring regions. Compared to the 46.6% of the surveyed companies that hope to find raw material suppliers in the neighboring provinces, only 22.73% hope to locate their target market in the neighboring provinces. This also confirms why the space contraction of the sales logistics network is not as significant as that of the supply logistics network.

References

  1. Ye, X. Logisitics cost management based on ABC and EVA integrated mode. In Proceedings of the 2011 IEEE International Conference on Automation and Logistics (ICAL), Chongqing, China, 15–16 August 2011; pp. 261–266. [Google Scholar] [CrossRef]
  2. Hobbs, J.E. Food supply chains during the COVID-19 pandemic. Can. J. Agric. Econ. 2020, 68, 171–176. [Google Scholar] [CrossRef] [Green Version]
  3. Singh, S.; Kumar, R.; Panchal, R.; Tiwari, M. Impact of COVID-19 on logistics systems and disruptions in food supply chain. Int. J. Prod. Res. 2020, 59, 1–16. [Google Scholar] [CrossRef]
  4. Aday, S.; Aday, M.S. Impact of COVID-19 on the food supply chain. Food Qual. Saf. 2020, 4, 167–180. [Google Scholar] [CrossRef]
  5. Paul, S.K.; Chowdhury, P. A production recovery plan in manufacturing supply chains for a high-demand item during COVID-19. Int. J. Phys. Distrib. Logist. Manag. 2021, 51, 104–125. [Google Scholar] [CrossRef]
  6. Liu, W.; Liang, Y.; Bao, X.; Qin, J.; Lim, M. China’s logistics development trends in the post COVID-19 era. Int. J. Logist. Res. Appl. 2020, 1–12. [Google Scholar] [CrossRef]
  7. Lu, L.; Peng, J.; Wu, J.; Lu, Y. Perceived impact of the Covid-19 crisis on SMEs in different industry sectors: Evidence from Sichuan, China. Int. J. Disaster Risk Reduct. 2021, 55, 102085. [Google Scholar] [CrossRef]
  8. Thadakamaila, H.; Raghavan, U.; Kumara, S.; Albert, R. Survivability of multiagent-based supply networks: A topological perspect. IEEE Intell. Syst. 2004, 19, 24–31. [Google Scholar] [CrossRef]
  9. Hall, P.; Hesse, M. Cities, Regions and Flows; Routledge: Oxford, UK, 2013; pp. 75–88. [Google Scholar]
  10. Hanson, S. The Geography of Urban Transportation, 3rd ed.; Guilford: New York, NY, USA, 1995. [Google Scholar]
  11. Hoyle, B.; Knowles, R. Modern Transport Geography, 2nd ed.; Wiley: London, UK, 1998. [Google Scholar]
  12. O’Kelly, M. A geographer’s analysis of hub-and-spoke networks. J. Transp. Geogr. 1998, 6, 171–186. [Google Scholar] [CrossRef]
  13. McKinnon, A. Logistical restructuring, freight traffic growth and the environment. In Transport Policy and the Environment; Routledge: Oxford, UK, 1998; pp. 97–109. [Google Scholar]
  14. Riemers, C. Functional relations in distribution channels and location patterns of the dutch wholesale sector. Geogr. Ann. B 1998, 80, 83–100. [Google Scholar] [CrossRef]
  15. Kengpol, A. Design of a decision support system to evaluate logistics distribution network in Greater Mekong Subregion Countries. Int. J. Prod. Econ. 2008, 115, 388–399. [Google Scholar] [CrossRef]
  16. Salema, M.I.G.; Barbosa-Povoa, A.; Novais, A.Q. An optimization model for the design of a capacitated multi-product reverse logistics network with uncertainty. Eur. J. Oper. Res. 2007, 179, 1063–1077. [Google Scholar] [CrossRef]
  17. Alumur, S.A.; Nickel, S.; Saldanha-Da-Gama, F.; Verter, V. Multi-period reverse logistics network design. Eur. J. Oper. Res. 2012, 220, 67–78. [Google Scholar] [CrossRef]
  18. Droździel, P.; Wińska, M.; Madleňák, R.; Pawe, S. Optimization of the post logistics network and location of the local dis-tribution center in selected area of the Lublin province. Procedia Eng. 2017, 192, 130–135. [Google Scholar] [CrossRef]
  19. Guo, J.; Wang, S.; Wang, D.; Liu, T. Spatial structural pattern and vulnerability of China-Japan-Korea shipping network. Chin. Geogr. Sci. 2017, 27, 697–708. [Google Scholar] [CrossRef]
  20. Ducruet, C.; Lee, S.; Ng, A. Centrality and vulnerability in liner shipping networks: Revisiting the Northeast Asian port hi-erarchy. Mar. Policy Manag. 2010, 37, 17–36. [Google Scholar] [CrossRef]
  21. Li, Z.; Xu, M.; Shi, Y. Centrality in global shipping network basing on worldwide shipping areas. GeoJournal 2015, 80, 47–60. [Google Scholar] [CrossRef]
  22. Gong, Q.; Wang, K.; Fan, X.; Fu, X.; Xiao, Y.-B. International trade drivers and freight network analysis—The case of the Chinese air cargo sector. J. Transp. Geogr. 2018, 71, 253–262. [Google Scholar] [CrossRef]
  23. Dai, L.; Derudder, B.; Liu, X. The evolving structure of the Southeast Asian air transport network through the lens of complex networks, 1979–2012. J. Transp. Geogr. 2018, 68, 67–77. [Google Scholar] [CrossRef] [PubMed]
  24. Zhong, Y.; Lu, Y. Hierarchical structure and distribution pattern of Chinese urban system based on railway network. Geogr. Res. 2011, 30, 785–794. [Google Scholar]
  25. Wang, J.E.; Jing, Y. Comparison of spatial structure and organization mode of inter-city networks from the perspective of railway and air passenger flow. Acta Geogr. Sin. 2017, 72, 1508–1519. [Google Scholar]
  26. Saito, Y. Geographical Spread of Interfirm Transaction Networks and the Great East Japan Earthquake. In The Economics of Interfirm Networks. Advances in Japanese Business and Economics; Watanabe, T., Uesugi, I., Ono, A., Eds.; Springer: Tokyo, Japan, 2015; Volume 4. [Google Scholar] [CrossRef]
  27. Ando, M.; Kimura, F. How did the Japanese Exports Respond to Two Crises in the International Production Networks? The Global Financial Crisis and the Great East Japan Earthquake. Asian Econ. J. 2012, 26, 261–287. [Google Scholar] [CrossRef]
  28. Obashi, A. Resiliency of Production Networks in Asia: Evidence from the Asian Crisis; Economic Research Institute for ASEAN and East Asia (ERIA): Jakarta, Indonesia, 2009. [Google Scholar]
  29. Fang, Z.; Yu, H.; Lu, F.; Feng, M.; Huang, M. Maritime network dynamics before and after international events. J. Geogr. Sci. 2018, 28, 937–956. [Google Scholar] [CrossRef] [Green Version]
  30. Tofighi, S.; Torabi, S.; Mansouri, S. Humanitarian logistics network design under mixed uncertainty. Eur. J. Oper. Res. 2016, 250, 239–250. [Google Scholar] [CrossRef] [Green Version]
  31. Vahdani, B.; Veysmoradi, D.; Noori, F.; Mansour, F. Two-stage multi-objective location-routing-inventory model for humanitarian logistics network design under uncertainty. Int. J. Disaster Risk Reduct. 2018, 27, 290–306. [Google Scholar] [CrossRef]
  32. Najafi, M.; Eshghi, K.; Dullaert, W. A multi-objective robust optimization model for logistics planning in the earthquake response phase. Transport. Res. E Log. 2013, 49, 217–249. [Google Scholar] [CrossRef]
  33. Hatefi, S.; Jolai, F. Robust and reliable forward–reverse logistics network design under demand uncertainty and facility disruptions. Appl. Math. Model. 2014, 38, 2630–2647. [Google Scholar] [CrossRef]
  34. Vidal, C.; Goetschalckx, M. Strategic production-distribution models: A critical review with emphasis on global supply chain models. Eur. J. Oper. Res. 1997, 98, 1–18. [Google Scholar] [CrossRef]
  35. Vos, B. Redesigning international manufacturing and logistics structures. Int. J. Phys. Distrib. Logist. Manag. 1997, 27, 377–394. [Google Scholar] [CrossRef]
  36. Alles, M.; Datar, S. Strategic Transfer Pricing. Manag. Sci. 1998, 44, 451–461. [Google Scholar] [CrossRef]
  37. Schmidt, G.; Wilhelm, W.E. Strategic, tactical and operational decisions in multi-national logistics networks: A review and discussion of modelling issues. Int. J. Prod. Res. 2000, 38, 1501–1523. [Google Scholar] [CrossRef]
  38. MacCarthy, B.; Atthirawong, W. Factors affecting location decisions in international operations—A Delphi study. Int. J. Oper. Prod. Manag. 2003, 23, 794–818. [Google Scholar] [CrossRef]
  39. Chen, I.J.; Paulraj, A. Understanding supply chain management: Critical research and a theoretical framework. Int. J. Prod. Res. 2004, 42, 131–163. [Google Scholar] [CrossRef]
  40. Canen, A. Looking at multiculturalism in international logistics: An experiment in a higher education institution. Int. J. Educ. Manag. 2001, 15, 145–152. [Google Scholar] [CrossRef]
  41. Stathopoulos, A.; Valeri, E.; Marcucci, E. Stakeholder reactions to urban freight policy innovation. J. Transp. Geogr. 2012, 22, 34–45. [Google Scholar] [CrossRef]
  42. Akhavan, M.; Ghiara, H.; Mariotti, I.; Sillig, C. Logistics global network connectivity and its determinants. A European City network analysis. J. Transp. Geogr. 2020, 82, 102624. [Google Scholar] [CrossRef]
  43. Ivanov, D. Predicting the impacts of epidemic outbreaks on global supply chains: A simulation-based analysis on the coronavirus outbreak (COVID-19/SARS-CoV-2) case. Transp. Res. Part eLogist. Transp. Rev. 2020, 136, 101922. [Google Scholar] [CrossRef]
  44. Majumdar, A.; Shaw, M.; Sinha, S.K. COVID-19 debunks the myth of socially sustainable supply chain: A case of the clothing industry in South Asian countries. Sustain. Prod. Consum. 2020, 24, 150–155. [Google Scholar] [CrossRef]
  45. Mahajan, K.; Tomar, S. COVID-19 and Supply Chain Disruption: Evidence from Food Markets in India. Am. J. Agron. Econ. 2021, 103, 35–52. [Google Scholar] [CrossRef] [PubMed]
  46. Pan, Y.; Cao, X. Spatial patterns and their formation mechanism of supply logistics network of wholesale markets in Guangzhou. Acta Geogr. Sin. 2012, 67, 179–188. (In Chinese) [Google Scholar]
  47. Tang, Y.; Yang, Y.; Cheng, S. The Characteristics of Supply and Sales Logistics Network Structure of Enterprises in Xining Development Zone. Econ. Geogr. 2020, 40, 129–140. (In Chinese) [Google Scholar]
  48. Phelps, N.A.; Miao, J.T.; Zhang, X. Polycentric urbanization as enclave urbanization: A research agenda with illustrations from the Yangtze River Delta Region (YRDR), China. Territ. Polit. Gov. 2020, 1–20. [Google Scholar] [CrossRef]
  49. Pan, Y.; Cao, X. Spatial patterns of sales logistics network of wholesale markets in Guangzhou: The perspective of basic-nonbasic economic activity. Hum. Geogr. 2012, 27, 92–97. (In Chinese) [Google Scholar]
  50. Bureau of Statistics of Shandong Province, Shandong Investigation Team of National Bureau of Statistics. Shandong Statistical Yearbook. 2017. Available online: http://tjj.shandong.gov.cn/tjnj/nj2017/zk/indexch.htm (accessed on 15 February 2021).
  51. Liu, F.; Chen, D.; Zhu, J. Structure and interaction of China’s inter-provincial inbound tourism market: A 2-mode network analysis. Prog. Geogr. 2016, 35, 932–940. (In Chinese) [Google Scholar]
  52. Zhang, W.; Derudder, B. How sensitive are measures of polycentricity to the choice of ‘centres’? A methodological and empirical exploration. Urban Stud. 2019, 56, 3339–3357. [Google Scholar] [CrossRef]
  53. Sankar, C.P.; Asokan, K.; Kumar, K.S. Exploratory social network analysis of affiliation networks of Indian listed companies. Soc. Netw. 2015, 43, 113–120. [Google Scholar] [CrossRef]
  54. Mote, J.E. R&D ecology: Using 2-mode network analysis to explore complexity in R&D environments. J. Eng. Technol. Manag. 2005, 22, 93–111. [Google Scholar] [CrossRef]
  55. Freeman, L. Centrality in social networks conceptual clarification. Soc. Netw. 1978, 1, 215–239. [Google Scholar] [CrossRef] [Green Version]
  56. Faust, K. Centrality in affiliation networks. Soc. Netw. 1997, 19, 157–191. [Google Scholar] [CrossRef]
  57. Remko, V.H. Research opportunities for a more resilient post-COVID-19 supply chain—Closing the gap between research findings and industry practice. Int. J. Oper. Prod. Manag. 2020, 40, 341–355. [Google Scholar] [CrossRef]
  58. Buatois, E.; Cordon, C. A Post COVID-19 Outlook: The Future of the Supply Chain. Institute for Management Development, Lausanne. Available online: https://owp.imd.org/contentassets/c46625dde711402a8b7a4f46e75c1c84/tc046-20-file-.pdf (accessed on 15 February 2021).
  59. Zheng, S.; Sun, W.; Wu, J.; Kahn, M.E. The birth of edge cities in China: Measuring the effects of industrial parks policy. J. Urban Econ. 2017, 100, 80–103. [Google Scholar] [CrossRef]
  60. Weifang Hi-Tech Industrial Development Zone Speeds Up the Construction of Company Supporting Park to Open Up the Industrial Chain and Supply Chain. Available online: https://baijiahao.baidu.com/s?id=1682942894040186998&wfr=spider&for=pc (accessed on 15 February 2021).
  61. Veselovská, L. Supply chain disruptions in the context of early stages of the global COVID-19 outbreak. Probl. Perspect. Manag. 2020, 18, 490–500. [Google Scholar] [CrossRef]
  62. Miao, C.-H.; Wei, Y.D.; Ma, H. Technological Learning and Innovation in China in the Context of Globalization. Eurasian Geogr. Econ. 2007, 48, 713–732. [Google Scholar] [CrossRef] [Green Version]
  63. Hart, D.; Simmie, J. Innovation, competition and the structure of local production networks: Initial findings from the Hertfordshire project. Local Econ. 1997, 12, 235–246. [Google Scholar] [CrossRef]
  64. Simmie, J.; Hart, D. Innovation projects and local production networks: A case study of Hertfordshire. Eur. Plann. Stud. 1999, 7, 445–462. [Google Scholar] [CrossRef]
  65. Craighead, C.; Blackhurst, J.; Rungtusanatham, M.; Handfield, R. The severity of supply chain disruptions: Design characteristics and mitigation capabilities. Decis. Sci. 2007, 38, 131–156. [Google Scholar] [CrossRef]
  66. Handfield, R.B.; Graham, G.; Burns, L. Corona virus, tariffs, trade wars and supply chain evolutionary design. Int. J. Oper. Prod. Manag. 2020, 40, 1649–1660. [Google Scholar] [CrossRef]
  67. Nandi, S.; Sarkis, J.; Hervani, A.A.; Helms, M.M. Redesigning Supply Chains using Blockchain-Enabled Circular Economy and COVID-19 Experiences. Sustain. Prod. Consum. 2021, 27, 10–22. [Google Scholar] [CrossRef]
  68. Cappelli, A.; Cini, E. Will the COVID-19 pandemic make us reconsider the relevance of short food supply chains and local productions? Trends Food Sci. Technol. 2020, 99, 566–567. [Google Scholar] [CrossRef]
Figure 1. Analysis steps.
Ijgi 10 00477 g001
Figure 2. Study area with location of development zones: (a) the location of Shandong Province in China; (b) the location of Weifang in Shandong Province; (c) distribution of development zones in Weifang.
Ijgi 10 00477 g002
Figure 3. Composition of firms’ industry categories in the valid questionnaires.
Ijgi 10 00477 g003
Figure 4. Firms’ supply logistics networks in Weifang’s development zones before the outbreak of the pandemic. Note: The blue and red dots represent the supply originations and the enterprises in the development zones, respectively; the lines represent the connection between the supply originations and the enterprises in the development zones. A larger dot indicates that the node has a higher degree centrality in the networks.
Ijgi 10 00477 g004
Figure 5. Firms’ sales logistics networks in Weifang’s development zones before the outbreak of the pandemic. Note: The blue and red dots represent the sales destinations and the enterprises in the development zones, respectively; the lines represent the connection between the sales destinations and the enterprises in the development zones. A larger dot indicates that the node has a higher degree centrality in the network.
Ijgi 10 00477 g005
Figure 6. Firms’ supply logistics networks in Weifang’s development zones after the pandemic outbreak. Note: The blue and red dots represent the supply originations and the enterprises in the development zones, respectively; the lines represent the connection between the supply originations and the enterprises in the development zones. A larger dot indicates that the node has a higher degree centrality in the network.
Ijgi 10 00477 g006
Figure 7. Spatial distribution of, and changes in, the degree centrality of supply source nodes in firms’ supply logistics networks.
Ijgi 10 00477 g007aIjgi 10 00477 g007b
Figure 8. Firms’ sales logistics networks in Weifang’s development zones after the outbreak of the pandemic. Note: The blue and red dots represent the sales destinations and the enterprises in the development zones, respectively; the lines represent the connection between the sales destinations and the enterprises in the development zones. A larger dot indicates that the node has a higher degree centrality in the network.
Ijgi 10 00477 g008
Figure 9. Spatial distribution of, and changes in, the degree centrality of sales destination nodes in firms’ sales logistics networks.
Ijgi 10 00477 g009
Figure 10. Changes to, and influencing factors of, firms’ logistics networks in the development zones after the outbreak of the pandemic.
Ijgi 10 00477 g010
Table 1. Basic information on development zones in Weifang.
NameLevelApproval DateApproved Area
(HA)
Leading Industries
Weifang Binhai Economic and Technological Development ZoneNational levelApril 2010500Petrochemical, salinization, equipment manufacturing and logistics
Weifang National Hi-tech Industrial Development ZoneNational levelNovember 1992860Power equipment, acoustics and optics, life and health care
Weifang Comprehensive Bonded ZoneNational levelJanuary 2011517Electronic information, machinery, new materials
Weicheng Economic Development ZoneProvincial levelOctober 1993353.4Energy saving and environmental protection, logistics, equipment manufacturing
Weifang Fenghuangshan Hi-Tech Industrial ParkProvincial levelNovember 1994799.99Machinery, equipment, electronic information, agricultural and sideline product processing
Weifang Economic Development ZoneProvincial levelMay 1994873.84New materials, foods, equipment manufacturing
Weifang Kuiwen Economic Development ZoneProvincial levelMarch 2006481.61Intelligent manufacturing, logistics, and automobile service
Linqu Economic Development ZoneProvincial levelMarch 1993267.34Nonferrous metal processing, equipment manufacturing, foods
Changle Economic Development ZoneProvincial levelDecember 1992974.61Equipment manufacturing, papermaking, printing and packaging
Qingzhou Economic Development ZoneProvincial levelDecember 1992192.48Equipment manufacturing, energy conservation and environmental protection, biomaterials
Zhucheng Economic Development ZoneProvincial levelDecember 1992159.29Machinery, foods, textile services
Shouguang Economic Development ZoneProvincial levelDecember 1992651.25Marine chemical, equipment manufacturing, papermaking
Anqiu Economic Development ZoneProvincial levelDecember 1992400.78Foods, machinery equipment, petrochemical
Gaomi Economic Development ZoneProvincial levelDecember 1992592.3Machinery, textile and clothing, shoemaking
Changyi Economic Development ZoneProvincial levelDecember 199269.89Chemical, machinery, textile
Data source: Announcement No. 4 (2018) of the China Development Zone Audit Announcement List 2018.
Table 2. Changes in the centrality of supply originations in Weifang’s development zones during the pandemic.
Geographical ScaleSupply SourceBefore Pandemic OutbreakAfter Pandemic Outbreak
DegreeClosenessBetweennessDegreeClosenessBetweenness
Within development zones0.2920.620.2390.30.6110.25
Outer development zones in Weifang0.4420.6960.3560.4580.6920.372
Outer Weifang in ShandongJinan0.10.5210.0650.1080.5160.07
Qingdao0.1170.5590.070.1250.5570.072
Yantai0.050.5030.030.050.4970.03
Rizhao0.0420.5070.0050.0420.5030.006
Linyi0.0250.4890.0040.0250.4850.004
Dongying0.0170.3360.010.0170.3320.01
Binzhou0.0170.3850.0010.0170.3790.001
Dezhou0.0170.35500.0170.3490
Liaocheng0.0080.3690000
Heze0.0080.29200.0080.2870
Jining0.0250.3820.0010.0250.3780.001
Tai’an0.0080.38200.0080.3770
Zibo0.0420.4910.0130.0420.4870.014
Outer Shandong in ChinaBeijing0.0080.45900.0080.4520
Tianjin0.0170.4220.0020.0170.4160.002
Shanghai0.0170.4950.0050.0170.4870.004
Hebei0.0750.5250.0360.0670.5180.027
Liaoning0.0080.48300.0170.4810.003
Jilin0.0080.48300.0170.4810.003
Heilongjiang0.0080.48300.0170.4810.003
Jiangsu0.1670.5670.1130.1670.5620.114
Zhejiang0.0750.5570.0480.0750.5470.047
Anhui0.0170.3570.010.0170.3510.01
Fujian0.0250.4120.0020.0250.4070.002
Jiangxi0.0080.35600.0080.350
Henan0.050.5070.0150.050.5030.015
Hubei0.0170.4850.0020.0170.4810.002
Hunan0.0170.5010.0040.0170.4970.005
Guangdong0.0580.4750.0160.0580.4830.017
Hainan0.0080.35600.0080.350
Inner Mongolia0.0170.4850.010.0170.4810.01
Xinjiang0.0080.3300.0080.3270
GlobalSoutheast Asia0.0170.48500.0170.3780.01
Japan0.0330.4720.0220.0250.4620.013
South Korea0.0250.3590.0020.0170.3510.001
Europe0.0080.3300.0080.3270
North America0.0250.4640.0290.0170.4550.019
South America0.0080.32800.0080.3260
India0.0250.4450.010.0250.440.01
Note: These data were acquired by calculation with UCINET software.
Table 3. Changes in node degree centrality of firms’ supply originations at different geographical scales.
Before Pandemic OutbreakAfter Pandemic OutbreakRange of Change (%)
Within Weifang (Local)0.7340.7583.17
Outer Weifang in Shandong0.4760.4841.65
Outer Shandong in China0.60.611.64
Global0.1410.117−20.51
Table 4. Changes in the centrality of sales destinations of Weifang’s development zones during the pandemic.
Geographical ScaleSales DestinationBefore Pandemic OutbreakAfter Pandemic Outbreak
DegreeClosenessBetweennessDegreeClosenessBetweenness
Within development zones0.1710.3940.140.1790.530.126
Outer development zones in Weifang0.3420.6050.2340.3590.6030.219
Outer Weifang in ShandongJinan0.1970.5220.0280.1970.5520.034
Qingdao0.2910.5840.1120.2740.5740.071
Yantai0.1790.5150.0110.1790.5450.012
Weihai0.1540.5090.0040.1540.5370.004
Rizhao0.1620.5110.0070.1540.5370.005
Linyi0.1620.5110.0060.1450.5350.002
Dongying0.1620.5110.0160.1620.540.017
Binzhou0.1450.5060.0020.1450.5350.002
Dezhou0.1620.5110.0070.1540.5370.006
Liaocheng0.1450.5060.0020.1450.5350.002
Heze0.1620.5110.0080.1620.540.008
Jining0.1620.5110.0080.1620.540.009
Tai’an0.1450.5060.0020.1450.5350.002
Zaozhuang0.1450.5060.0020.1450.5350.002
Zibo0.1710.5170.0150.1710.5470.015
Outer Shandong in ChinaBeijing0.1450.5090.0060.1450.5370.006
Tianjin0.1370.5060.0010.1370.5350.001
Shanghai0.1620.520.010.1540.550.01
Chongqing0.1370.5060.0010.1370.5350.001
Hebei0.1540.5440.0160.1540.540.008
Shanxi0.1540.5130.0080.1540.5420.008
Liaoning0.1540.5110.010.1620.5420.012
Jilin0.1370.5060.0010.1450.5370.003
Heilongjiang0.1450.5090.0010.1540.5400.004
Jiangsu0.2050.5670.0540.1970.5680.035
Zhejiang0.2220.5360.0530.2220.5770.061
Anhui0.1540.5170.0040.1540.5550.007
Fujian0.1710.5220.0140.1710.560.019
Jiangxi0.1790.5240.010.1710.560.011
Henan0.1970.5240.030.1880.5520.029
Hubei0.1540.5170.0110.1620.5470.017
Hunan0.1540.5170.0040.1620.5580.012
Guangdong0.2140.570.0540.2220.5770.058
Hainan0.1540.5170.0040.1540.5550.007
Sichuan0.1540.5110.0060.1450.5370.005
Guizhou0.1370.5060.0010.1370.5350.001
Yunnan0.1370.5060.0010.1370.5350.001
Shaanxi0.1450.5090.0060.1450.5370.007
Gansu0.1370.5060.0010.1370.5350.001
Qinghai0.1370.5060.0010.1370.5350.001
Inner Mongolia0.1370.5060.0010.1370.5350.001
Guangxi0.1450.5410.0120.1450.5370.004
Tibet0.120.5020.0010.120.530.001
Ningxia0.1370.5060.0010.1370.5350.001
Xinjiang0.1030.4940.0010.1030.5190.001
GlobalSoutheast Asia0.0770.4900.0280.0770.4990.03
Japan0.1110.5020.0630.0940.5300.057
South Korea0.0340.4780.0050.0260.4990.005
Europe0.1710.5240.0920.1450.5550.095
Middle East0.0170.3480.0020.0170.350.002
North America0.1030.5040.0490.0680.3770.035
South America0.0430.4440.0130.0430.4430.023
India0.0430.3620.0220.0340.360.012
Oceania0.0260.4680.0010.0090.4870
Africa0.0260.4450.0010.0260.4550.002
Mongolia0.0090.30500.0090.3180
Note: These data were acquired by calculation with UCINET software.
Table 5. Changes in node degree centrality of firms’ sales destinations at different geographical scales.
Before Pandemic OutbreakAfter Pandemic OutbreakRange of Change (%)
Within Weifang (Local)0.5130.5384.65
Outer Weifang in Shandong2.5442.494−2.00
Outer Shandong in China4.3764.3770.02
Global0.5890.477−23.48
Table 6. The range of change of firms’ logistics network linkage frequencies at different geographical scales during the pandemic.
Within Development ZonesOuter Development Zones in WeifangOuter Weifang in ShandongOuter Shandong in ChinaGlobal
Range of change (%)Supply3.51 3.46 −0.37 0.60 −19.36
Sales6.64 6.64 −0.48 1.75 −15.58
Table 7. Sig. (2-tailed) of paired sample t-test of firms’ logistics linkages at different geographical scales during the pandemic.
LocalOuter Weifang in ShandongOuter Shandong in ChinaGlobal
Sig. (2-tailed)Supply0.0470.6040.6040.094
Sales0.0940.3560.950.073
Publisher’s Note: MDPI stays neutral with regard to jurisdictional claims in published maps and institutional affiliations.

